
 Open Access Article
 This Open Access Article is licensed under a Creative Commons Attribution-Non Commercial 3.0 Unported Licence
Comparison of multiple protein extraction buffers for GeLC-MS/MS proteomic analysis of liver and colon formalin-fixed, paraffin-embedded tissues
Valérie
Broeckx
*a,
Kurt
Boonen
a,
Lentel
Pringels
a,
Xavier
Sagaert
b,
Hans
Prenen
c,
Bart
Landuyt
a,
Liliane
Schoofs
a and
Evelyne
Maes
de
aResearch Group of Functional Genomics and Proteomics, Department of Biology, University of Leuven, Zoological Institute, Naamsestraat 59, 3000 Leuven, Belgium. E-mail: Valerie.Broeckx@bio.kuleuven.be
bCentre for Translational Cell and Tissue Research, University Hospital of Leuven, Herestraat 49, 3000 Leuven, Belgium
cDepartment of Gastro-Enterology, Digestive Oncology Unit, University Hospital of Leuven, Herestraat 49, 3000 Leuven, Belgium
dFlemish Institute for Technological Research (VITO), Boeretang 200, 2400 Mol, Belgium
eCentre for Proteomics, University of Antwerp/Flemish Institute for Technological Research (VITO), Groenenborgerlaan 171, 2020 Antwerp, Belgium
First published on 9th December 2015
Abstract
Formalin-fixed paraffin-embedded (FFPE) tissue specimens represent a potential valuable source of samples for clinical research. Since these specimens are banked in hospital archives, large cohorts of samples can be collected in short periods of time which can all be linked with a patients' clinical history. Therefore, the use of FFPE tissue in protein biomarker discovery studies gains interest. However, despite the growing number of FFPE proteome studies in the literature, there is a lack of a FFPE proteomics standard operating procedure (SOP). One of the challenging steps in the development of such a SOP is the ability to obtain an efficient and repeatable extraction of full length FFPE proteins. In this study, the protein extraction efficiency of eight protein extraction buffers is critically compared with GeLC-MS/MS (1D gel electrophoresis followed by in-gel digestion and LC-MS/MS). The data variation caused by using these extraction buffers was investigated since the variation is a very important aspect when using FFPE tissue as a source for biomarker detection. In addition, a qualitative comparison was made between the protein extraction efficiency and repeatability for FFPE tissue and fresh frozen tissue.
1 Introduction
There is a high need for biomarkers to improve diagnosis, to stratify patients for targeted therapy and to monitor therapeutic responses for a wide spectrum of diseases. In order to find such biomarkers, tissue is frequently used in the omics field for the identification and quantification of biomolecules. Since the concentration of low abundant disease-related proteins and peptides (and metabolites) is significantly higher inside or within the vicinity of the diseased tissue, tissue-based proteomics is often preferred when insights in disease-related processes are required.1 Freshly frozen clinical samples are, therefore, in high demand for translational research. However, the limited availability of these fresh tissue specimens forms a serious drawback for biomarker discovery research.2 In addition, long-term preservation of these fresh frozen samples is expensive and collecting large cohorts of samples in short periods of time is tough.3 Recently, it was suggested that formalin-fixed paraffin-embedded (FFPE) tissue, the golden standard for long-term preservation of tissue worldwide, can serve as a valuable alternative for fresh tissue.3–5 Since FFPE tissue is routinely prepared for pathological research, millions of samples are available in hospital archives and large numbers of samples can be collected in short periods of time.6,7 Moreover, the archived material has the advantage to be associated with pathological, clinical and outcome information and is, therefore, suitable for both prospective and retrospective clinical research.1,7,8Unfortunately, for over a decade, it was thought that FFPE tissue was not suitable for mass spectrometry-based proteomic research because formaldehyde induces intra- and intermolecular protein (and DNA/RNA) crosslinks which literally trap proteins and other molecules within the tissue.9–14 The irreversibility of this crosslinking process hampers the extraction of full-length proteins and makes mass spectrometry based protein identification very challenging. Due to the development of the antigen retrieval (AR) technique in 1991, which was used to recover antigenicity in immunohistochemical studies, extraction procedures improved. Ikeda et al. (1998) were the first who succeeded in extracting proteins from FFPE tissue using the AR technique.15 Recently, several research groups have developed their own protein extraction method which allowed them to gain access to the FFPE proteome.16–21
In the last few years, many FFPE proteomics studies are published in the literature. This FFPE research can be mainly classified into three categories: studies investigating FFPE protein extraction methods very often accompanied by a fresh frozen tissue versus FFPE tissue comparison,21–26 studies determining the suitability of FFPE tissue in biomarker research27–31 and studies looking for the influence of (pre-)analytical factors.32–36 All these studies indicate that multiple methods are used among different research groups. This complicates rigorous comparison and divergent results are obtained. Therefore, there is a high need for a rigorous comparison of multiple protein extraction buffers with the same proteomic workflow.
In this study, the protein extraction efficiency of eight protein extraction buffers was compared using a standardized GeLC-MS/MS (1D gel electrophoresis followed by in-gel digestion and LC-MS/MS) workflow in order to develop a SOP for FFPE tissue proteomics. The GeLC-MS/MS workflow was tested in multiple ‘biosystems’: murine liver and colon FFPE tissue and human colon FFPE tissue.
2 Materials and methods
2.1 Murine FFPE and fresh frozen tissue samples
C57Bl/6J mice, obtained from Janvier Elevage (Le Genest-St-Isle, France), were housed under standard laboratory conditions under an 11/13-hour dark/light cycle with food and water available ad libitum. All experiments were approved by the ethical research committee of the KU Leuven and were in strict accordance with the European Communities Council Directive of 22 September 2010 (2010/63/EU) and with the Belgian legislation (KB of 29 May 2013). Every possible effort was made to minimize animal suffering and to reduce the number of animals. All animals were euthanized by cervical dislocation.Next, the entire colon and liver were dissected and the tissue specimens were immediately fixed in 6% formalin with a formalin![[thin space (1/6-em)]](https://www.rsc.org/images/entities/char_2009.gif) :tissue ratio of 10:1. The time span between tissue dissection and formalin fixation was minimized to 5 minutes for each sample. After 24 hours of fixation, the tissue specimens were washed with phosphate buffered saline (PBS), dehydrated and impregnated with paraffin. Afterwards, the FFPE samples were stored at room temperature (RT).
:tissue ratio of 10:1. The time span between tissue dissection and formalin fixation was minimized to 5 minutes for each sample. After 24 hours of fixation, the tissue specimens were washed with phosphate buffered saline (PBS), dehydrated and impregnated with paraffin. Afterwards, the FFPE samples were stored at room temperature (RT).
Fresh frozen liver tissues were obtained from an independent cohort of C57BL/6J mice. After the immediate freezing of the dissected tissues in ice cold isopentane (−40 °C) for 2 minutes, the samples were stored at −80 °C until further use.
2.2 Human FFPE tissue samples
Healthy colon mucosa tissue specimens (resected nearby tumor tissue) were obtained from surgical resection specimens at the university hospital of Leuven. All samples were collected under informed consent of all patients and were approved by the local ethical committee. The surgical resection specimens were fixed in 6% formalin for 24 to 48 hours, dehydrated and imbedded in paraffin. The resulting FFPE tissue samples were stored at room temperature.2.3 Protein extraction
Per sample, ten FFPE tissue slices of 10 μm thickness were obtained by microtome slicing (Microm HM360, Prosan, Merelbeke, Belgium). Each FFPE sample was deparaffinized in xylene for 10 minutes, followed by centrifugation at 12000g for 3 minutes at ambient temperature. This incubation and centrifugation step was repeated twice. The tissue pellets were then rehydrated with an ethanol gradient starting at 100% to 95% to 70%, each time for 1 minute. Next, the tissue pellets were air dried, suspended in 150 μl protein extraction buffer and sonicated for 3 minutes in a bath sonicator (Branson 5510 Ultrasonic cleaner). In total, the protein extraction efficiency of 8 different protein extraction buffers was tested. The compositions of these 8 buffers are summarized in Table 1. Subsequently, the samples were incubated for 20 minutes at 98 °C followed by an incubation at 80 °C during 2 hours. Next, the samples were centrifuged for 30 minutes at 14000g and 4 °C. The supernatant was transferred to a new Eppendorf Lobind tube and stored at −80 °C until further use.
| No. | Buffer composition | Ref. |
|---|---|---|
| 1 | 20 mM Tris HCl, 2% SDS, 200 mM DTT, 20% glycerol, 1% protease inhibitor (complete cocktail, Roche, Penzberg, Germany), pH 8.8 | Buffer composition adapted from Addis et al. (2009)22,42 |
| 2 | 40 mM Tris HCl, 6 M guanidine-HCl, 65 mM DTT, pH 8.2 | Jiang et al. (2007)25 |
| 3 | RIPA lysis buffer (25 mM Tris HCl, 150 mM NaCl, 1% NP-40, 1% sodium deoxycholate, 0.1% SDS, pH 7.6 | Crockett et al. (2005)43 |
| 4 | RIPA lysis buffer, 5 mM DTT, 0.2% Rapigest, pH 8 | Buffer composition adapted from Crockett et al. (2005)43 |
| 5 | RIPA lysis buffer, 2% SDS, pH 8 | Hwang et al. (2007)44 |
| 6 | 100 mM ammonium bicarbonate, 30% acetonitrile, pH 8.4 | Hwang et al. (2007)44 |
| 7 | 50% 100 mM ammonium bicarbonate, 50% trifluoroethanol (TFE) | Sprung et al. (2009)26 |
| 8 | 20 mM Tris HCl, 0.5% SDS, 1.5% CHAPS, 200 mM DTT, 10% glycerol, pH 8.8 | Buffer composition adapted from Addis et al. (2009)22,42 |
2.4 1D gel electrophoresis and trypsin digestion
The FFPE samples were loaded on NuPAGE Novex 4–12% bis-tris precast gels and were run according to the manufacturer's instructions (Invitrogen, Carlsbad, CA). The runtime was set at 10 minutes. This enabled excision of the entire protein extract in just one protein band. The excised protein bands are washed with Milli Q and suspended in 95% acetonitrile two times for 2 minutes. Next, the proteins were reduced using 500 μl of a 6.6 mM dithiothreitol solution (10 minutes, RT). After suspending in 95% acetonitrile for 2 minutes twice, the proteins were alkylated with 500 μl of a 55 mM iodoacetamide solution in the dark (10 minutes, RT). The gel pieces were again suspended in 95% acetonitrile and lyophilized. Subsequently, 100 μl of 0.01 μg μl−1 trypsin solution (Promega, Fitchburg, WI) (dissolved in 50 mM ammonium bicarbonate) was added. After an incubation time of 3 hours at 4 °C necessary for trypsin absorption by the gel, the samples were incubated overnight on a shaker at 37 °C. The next day, the tryptic peptides were extracted using 50 mM ammonium bicarbonate (2× 30 minutes) followed by a 50% acetonitrile 5% formic acid solution (2× 30 minutes). The extracts were pooled and lyophilized. Prior to mass spectrometric analysis, the samples were desalted and concentrated using C18 spin columns (Pierce, Thermo Scientific, Waltham, MA) according to the manufacturer's protocol. The eluted peptides were lyophilized and stored at −80 °C until further use.2.5 Nanoreverse phase liquid chromatography and mass spectrometry
The analysis was performed on a Q Exactive orbitrap mass spectrometer (Thermo Scientific, San Jose, CA). The mass spectrometer was online coupled to an Ultimate 3000 ultra-high performance liquid chromatography (UHPLC) instrument (Thermo Scientific, San Jose, CA). The UHPLC system was equipped with a 2 μm particle, 100 Å pore size Easy Spray Pepmap RSLC C18 column (dimensions: 50 μm × 15 cm) (Thermo Scientific, San Jose, CA). Before sample separation on the analytical column, the lyophilized sample was resuspended in 20 μl of a 2% ACN 0.1% FA solution. Next, 5 μl sample volume was injected and washed on a 3 μm particle size, 100 Å pore size, nanoviper, Acclaim Pepmap 100 C18 precolumn, (dimensions: 75 μm × 2 cm) (Thermo Scientific, San Jose, CA). Sample separation was performed using a 95 minutes gradient of 99.9% H2O, 0.1% FA (mobile phase A) and 19.92% H2O, 80% ACN, 0.08% FA (mobile phase B). A gradient of mobile phase B in mobile phase A from 4% to 10% in 5 minutes, 10% to 25% in 50 minutes, 25% to 45% in 18 minutes followed by a steep increase to 95% in 1 minute was applied at a flow rate of 300 nl min−1. An inherent rinse step (10 min gradient, from 4% to 95% in 5 minutes) was applied after every 95 minute separation gradient. In addition, after every 4 sample runs a blank run was applied. The Q Exactive mass spectrometer was operated in data dependent mode. All mass spectra were acquired in the positive ionization mode with an m/z scan range of 400 to 1600 thompson (Th). For each precursor spectrum, up to the ten most intense ions were selected for the generation of fragmentation spectra. For precursor spectra, a resolving power of 70000 full width at half maximum (FWHM) was used with an automatic gain control (AGC) target of 3000000 ions and a maximum ion injection time (IT) of 256 ms. For fragmentation spectra, a resolving power of 17000 FWHM was used with an AGC target of 1000000 ions and a maximum IT of 64 ms. Dynamic exclusion of 10 s was applied in order to avoid repeated fragmentation of the most abundant ions. Concerning ion selection, a charge exclusion of 1+, 6+–8+ was applied.
2.6 Data analysis
The Peaks studio software (Version 7, Bioinformatics solutions Inc., Waterloo, ON, Canada) workflow was used to analyze the fragmentation spectra. This software has a fourfold built up: a module for de novo amino acid sequencing of peptides, a Peaks DB search module for database driven peptide identification, a Peaks PTM search module for detection of frequently occurring post-translational modifications and a Peaks Spider search module designed to detect peptide mutations and perform homology search.37–40 All data were refined in correction in precursor mass and all fragmentation spectra were searched against the Swiss-Prot database (version December 2013, total of 540261 protein sequences). The following search parameters were used: a precursor mass tolerance of 10 ppm using monoisotopic mass and a fragment mass tolerance of 20 mmu. Trypsin was specified as the digestion enzyme, non-specific cleavages were allowed at one end of the peptide and maximum 3 missed cleavages were tolerated. Cysteine carbamidomethylation was set as fixed modification, and methionine oxidation was set as variable modification. A maximum of 3 variable post-translational modifications was allowed per peptide. A peptide identification filter of FDR <5% was set for each sample and protein identification was based on at least 2 unique peptides. Furthermore, the protein identification reliability score (−10log(P), with P being the probability, the identification is based on chance) was set at a threshold of 30, which corresponds to high confident identifications (Peaks 7 user manual (2013), Peaks Team, Bioinformatics solutions Inc.).
Progenesis QI software (Version 4.1, Nonlinear Dynamics, Newcastle upon Tyne, UK) was used for ion abundance based quantification.41 Four analysis steps were used: the peak modelling algorithm reduces the data file with one order of magnitude by reducing the data noise level. Next, all runs are aligned to compensate for between-run variation and the peak picking algorithm identifies all peaks present. In the last step, the ion abundance quantification algorithm allows normalized quantification of all peptide ions. Normalization is based on the total intensity of the peptide population. For further analysis, only peaks that met the following parameters were included: the peaks must be present in all replicates of the condition and must have a minimum normalized abundance of 10000. Furthermore, a maximum fold change of 1000 was allowed.
3 Results
In order to develop a SOP for FFPE tissue proteomics, the protein extraction efficiency of eight protein extraction buffers was compared. These buffers were chosen based on costs, ease of use and suitability for mass spectrometry. The buffer compositions are shown in Table 1.3.1 Protein concentration determination of FFPE tissue protein extracts
In order to accurately determine the concentration of FFPE protein extracts, three protein concentration assays with two different underlying principles were compared: the bicinchoninic acid (BCA) assay (Life technologies Europe, Ghent, Belgium), the bicinchoninic acid reducing agent compatible (BCA-RAC) assay (Life technologies Europe) and the Qubit assay (Life technologies Europe). Table 2 shows a subset of the results obtained with these assays using murine liver FFPE tissue. For each extraction buffer, the protein concentration of a FFPE tissue sample and a control sample (10 × 10 μm paraffin coupes without tissue) was measured with all three assays. Divergent high protein concentrations were measured for control samples, depending on the buffer components present in the eight compared protein extraction buffers (Table 2). This often led to overestimation of the protein concentrations of the tissue samples. Moreover, repeated measurements of the same samples didn't provide consistency in the results.| Buffer | 1 | 2 | 3 | 4 | 5 | 6 | 7 | 8 | ||||||||
|---|---|---|---|---|---|---|---|---|---|---|---|---|---|---|---|---|
| Sample type | Tissue | Control | Tissue | Control | Tissue | Control | Tissue | Control | Tissue | Control | Tissue | Control | Tissue | Control | Tissue | Control |
| BCA | 0 | 0 | >2600 | >2600 | >2600 | >2600 | 0 | >2600 | 489 | 188 | 1205 | 0 | 372 | 0 | 0 | >2600 |
| BCA-RAC | >2600 | 0 | >2600 | >2600 | >2600 | >2600 | 164 | 0 | >2600 | 488 | 1641 | 0 | 1240 | 0 | >2600 | 481 |
| Qubit | 1280 | 236 | 1380 | 225 | >2600 | 1 | 2490 | 1710 | >2600 | >2600 | 1230 | 1 | 392 | 1 | 2330 | 558 |
3.2 Comparative evaluation of protein extraction efficiency via 1D gel electrophoresis
The minimal reliability in terms of protein concentration was confirmed by loading equal amounts (10 μg, based on Qubit data) of mouse liver FFPE protein extracts on a 1D SDS-PAGE gel. For all eight buffers, 3 technical replicates were loaded on the 1D gel. In this paper the term ‘technical replicates’ is defined as separate protein extracts emanating from the same tissue specimen. Subsequent relative quantification of the gel lanes was performed using deep purple staining and Image Lab software (Bio-Rad, Informatics Division, United Kingdom). Fig. 1 demonstrates high variation in gel lane intensity (Fig. 1A) and relative protein quantification (Fig. 1B). Except for buffers 1 and 7, large amounts of variation from the average were observed when relatively quantifying the gel lanes (Fig. 1B). These results confirm that the measured protein concentrations are incorrect and not reproducible. All upcoming experiments were therefore based on the yield per unit of volume FFPE protein extract. | ||
| Fig. 1 Incorrect protein concentration determination, yield of FFPE-extracted proteins per unit volume. (A + C) Deep purple stained 1D SDS-PAGE gel. For each extraction buffer (1 to 8), three technical replicates were loaded. The asterisk indicates the gel lane loaded with SeeBlue Plus2 Pre-Stained Standard (Invitrogen, Carlsbad, CA). (A) Each lane is loaded with 10 μg of FFPE protein extract, based on the measurements of the Qubit assay. (C) Each lane is loaded with 9.75 μl of FFPE protein extract. (B + D) Relative protein quantification graph. Mean and standard deviation (SD) values for three technical replicates per extraction buffer are shown. No values are visualized for extraction buffers 2 and 3 as these buffers were not compatible with the 1D SDS-PAGE gel protocol due to lumping. | ||
In order to obtain a first impression about the yield per unit of volume FFPE protein extract, an equal volume of protein extract was loaded in each lane of a 1D SDS-PAGE gel. For each protein extraction buffer, three technical replicates per buffer were loaded on a 1D gel. Deep purple staining illustrates a consistently higher gel lane intensity for protein extracts of samples processed with protein extraction buffers 1, 5 and 8 (Fig. 1C).
Relative protein quantification confirmed the observation that protein extraction buffers 1, 5 and 8 were the top 3 buffers in the highest yield per unit volume of FFPE protein extract (Fig. 1D).
3.3 Comparative evaluation of protein extraction efficiency and repeatability via GeLC-MS/MS
As a difference in texture of tissue types and organs exists, the protein extraction efficiency can differ between tissue types/organs. Therefore, multiple organs are used as test cases, both from murine and human origin. An overview of the performed experiments is shown schematically in Fig. 2. | ||
| Fig. 2 Schematic overview of the different experiments. A first set of experiments was performed in order to critically evaluate the protein extraction efficiency of the eight protein extraction buffers. Murine liver and colon FFPE tissue and clinical more important human colon tissue were therefore used. Later on, the best out of the eight protein extraction buffers was used for protein extraction comparison between fresh frozen mouse liver tissue and FFPE mouse liver tissue. For all this experiments, the standardized GeLC-MS/MS workflow was used. | ||
As visualized in Fig. 3A, protein extraction buffers 1, 5 and 8 yield the highest number of confidently identified proteins. Protein identification scores (−10log(P)) were set at a minimum of 30 which resulted in an FDR close to 0, thus high confident protein identifications. Based on at least two unique peptides, an average of, respectively, 887, 737 and 693 proteins was identified. When looking at the distribution of proteins identified with >3, 3 or 2 unique peptides, a similar distribution pattern was observed in each of the top 3 protein extraction buffers (Fig. 3B). None of the buffers showed a trend of yielding more confident protein identifications compared to the other protein extraction buffers. In order to have an idea about the distribution of the total technical variation in the data, the coefficient of variation (CV) at the peptide level was calculated, based on the normalized abundance values. Only peptides who met the following parameters were included: the peptide is present in all three replicates per condition and must have a minimum normalized abundance value of 10000 and a maximum fold change of 1000. As seen in Fig. 3C, the top 3 extraction buffers (1, 5 and 8) show a similar CV distribution pattern. The comparison between the three buffers indicates that buffer 5 is characterized by the lowest average CV (50th percentile) value for the total technical variation: 43.58%. An average CV value of 49.63% and 51.58% is observed for extraction buffers 1 and 8, respectively. The total technical variation however is defined as the sum of variation caused by sample preparation and variation caused by the mass spectrometric analysis. To establish the amount of technical variation due to MS analysis, we determined the MS measurement variation by performing a triplicate injection of a murine liver FFPE tissue sample. This resulted in a relative low average CV value of 12.28% (Fig. 3C, dotted curve). This means that the total technical variation (illustrated as full curves in Fig. 3C) for buffers 1, 5 and 8 is mainly originating from the sample preparation process.
 | ||
| Fig. 3 Results of the mouse liver FFPE tissue GeLC-MS/MS experiment. (A) Total protein identifications. Mean and SD values for three technical replicates per protein extraction buffer are shown. Protein identification is based on at least two unique peptides. (B) Distribution of confidently identified proteins. The pie charts illustrate the percentage distribution of proteins identified with >3, 3 or 2 unique peptides for three technical replicates per protein extraction buffer. (C) Distribution of total technical variation data. Distribution of CV values of peptides who met the following parameters: the peptide is present in all three replicates per condition and must have a minimum normalized abundance value of 10000 and a maximum fold change of 1000. Extraction buffers 1, 5 and 8 showed an average CV of, respectively, 49.63%, 43.58% and 51.58%. Variation of the mass spectrometric analysis resulted in an average CV value of 12.28%. | ||
Mass spectrometric analysis of FFPE proteins is not only hampered by the presence of protein crosslinks. Also unknown and unexpected post-translational protein modifications (PTMs) – whether or not introduced by formaldehyde fixation or the sample processing method – hinder unambiguous protein identification. To circumvent this problem, we analyzed our data using Peaks software, which, in addition to the Peaks DB and Peaks de novo search module, enables the search for all modifications described in their PTM module (which is based on the UniMod database).
The peaks PTM module delivers even more high confident protein identifications. Due to the detection of unspecified modifications, higher protein coverages are achieved and new confident protein accession numbers can be identified. For example, when analyzing the dataset of the 3 technical replicates processed with buffer 1 using the Peaks PTM module in addition to the Peaks DB and the Peaks de novo module, up to 8% new proteins could be confidently identified. Fig. 4 shows the coverage view of a protein (accession number: Q9CXF0, kynureninase) which could be identified by the Peaks PTM module. The figure gives an overview of all peptide matches found. Three unique peptides were detected which have unspecified modifications (acetylation, methyl ester). Moreover, Peaks PTM provides a list of PTMs detected in the dataset. Table 3 gives an overview of PTMs that were found common in the FFPE datasets of all 18 processed samples. Several of these PTMs are present in basic amino acids (K, R, H, N-term). Most likely, these modifications are introduced by the formaldehyde fixation process since formalin-induced crosslinks preferably take place in basic amino acids.
 | ||
| Fig. 4 Protein identification due to the detection of unspecified post-translational modifications by Peaks PTM. The sequence coverage of kynureninase is shown in which two unspecified modifications were detected in three unique peptides (acetylation, methyl ester). Detection of these modifications made it possible to confidently identify this protein. | ||
| Name | ΔMass (Da) | # PSMa | Position |
|---|---|---|---|
| a PSM: peptide to spectrum match. | |||
| Carbamidomethyl | 57.02 | 46669 | DEHK, N-term |
| Carbamidomethyl | 57.02 | 35112 | C |
| Oxidation | 15.99 | 9469 | M |
| Deamidation | 0.98 | 9081 | NQ |
| Methyl ester | 14.02 | 6963 | DE, C-term |
| Acetylation | 42.01 | 4295 | Protein N-term |
| Formylation | 27.99 | 2374 | K, N-term |
| Methylation | 14.02 | 2074 | KRST, N-term |
| Acetylation | 42.02 | 1631 | N-term |
| Ubiquitin | 114.04 | 943 | KST |
| Carbamylation | 43.01 | 943 | K, N-term |
| Acetylation | 42.01 | 882 | K |
| Hydroxylation | 15.99 | 858 | DKNPRY |
| Dehydration | −18.01 | 727 | DSTY |
| Phosphorylation | 79.97 | 664 | STY |
| Ethyl | 28.03 | 350 | DEK, N-term, C-term |
| Dihydroxy | 31.99 | 260 | FKPRWY |
| Oxidation | 15.99 | 217 | HW |
| Propionamide | 71.04 | 192 | K, N-term |
| Ammonium | 17.03 | 159 | DE, C-term |
| Ammonia loss | −17.03 | 158 | N |
| Sodium | 21.98 | 155 | DE, C-term |
| Formylation | 27.99 | 155 | Protein N-term |
| Carboxylation | 43.99 | 100 | DKW |
 | ||
| Fig. 5 Results of the mouse colon FFPE tissue GeLC-MS/MS experiment. (A) Total protein identifications. Mean and SD values for three technical replicates per protein extraction buffer are shown. Protein identification is based on at least two unique peptides. (B) Venn diagram depicting the overlap in protein identifications of protein extraction buffers 1, 5 and 8. For each protein extraction buffer, one protein identification list was used made out of 3 technical replicates. Percentages of common proteins and unique proteins are indicated in white. (C) Distribution of confidently identified proteins. The pie charts illustrate the percentage distribution of proteins identified with >3, 3 or 2 unique peptides for three technical replicates per protein extraction buffer. (D) Distribution of total technical variation data. Distribution of CV values of peptides who met the following parameters: the peptide is present in all three replicates per condition and must have a minimum normalized abundance value of 10000 and a maximum fold change of 1000. Extraction buffers 1, 5 and 8 showed an average CV of, respectively, 46.68%, 81.12% and 88.15%. Variation of the mass spectrometric analysis resulted in an average CV value of 12.28%. | ||
Since major differences are observed in the number of protein identifications per extraction buffer, we questioned whether different subpopulations of proteins are extracted with these different buffers. A considerable part of the protein identifications are in the intersection of the 3 buffers (Fig. 5B). These 190 commonly identified proteins represent mainly high abundant proteins. Furthermore, protein extraction buffer 1 extracted 564 proteins uniquely, which corresponds to 56.85% of the total set of protein identifications in the overall experiment (Fig. 5B). Altogether, buffer 1 identified 943 proteins which represent 95.06% of the total set of protein identifications.
In concordance with previous experiments, we further investigated the variance throughout the experiment. Fig. 5D visualizes the distribution of the total technical variation data for extraction buffers 1, 5 and 8. Extraction buffers 5 and 8 show a steep and similar CV curve with an average CV value of 81.12% and 88.15%, respectively. Only peptides until the 20th percentile have a CV value lower than 50%, i.e. the threshold to be considered as highly variable peptides (or proteins). Such high variable proteins must be carefully analyzed in differential biomarker discovery studies as differences in the expression level between healthy and diseased conditions can be due to human variation instead of pathological causes. I.e., the inter-individual variation of these high variable proteins can obscure the detection of biologically significant differences. In contrast, protein extraction buffer 1 is characterized by a much lower CV curve and lower average CV value (46.68%). Peptides until the 65th percentile have a CV value lower than 50%.
As observed in previous experiments, protein extraction buffer 1 yields the most identified proteins, with an average of 681 protein identifications compared to 463 identifications for buffer 5 and 554 identifications for buffer 8, respectively (Fig. 6A). Concerning the distribution of proteins identified with >3, 3 or 2 unique peptides, no significant differences were observed (Fig. 6C). When looking at the overlap in protein identifications (Fig. 6B), 44.93% of the total protein identifications were identified in all three protein extraction buffers. Again, the group of commonly identified proteins mainly exists as high abundant proteins.
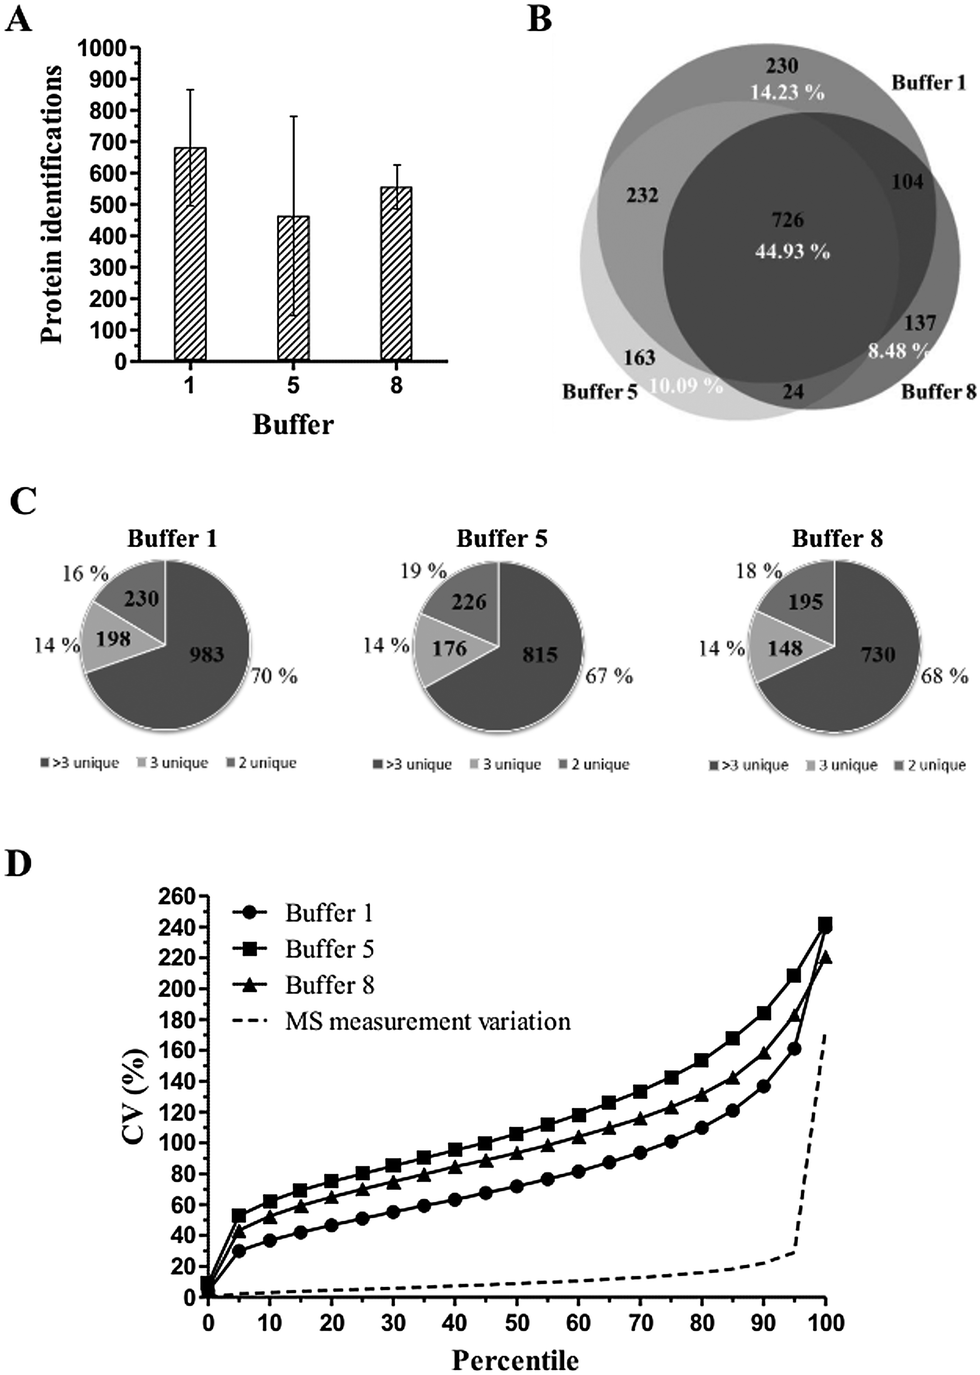 | ||
| Fig. 6 Results of the human colon FFPE tissue GeLC-MS/MS experiment. (A) Total protein identifications. Mean and SD values for six biological replicates per protein extraction buffer are shown. Protein identification is based on at least two unique peptides. (B) Venn diagram depicting the overlap in protein identifications of protein extraction buffers 1, 5 and 8. For each protein extraction buffer, one protein identification list was used made out of 6 biological replicates. Percentages of common proteins and unique proteins are indicated in white. (C) Distribution of confidently identified proteins. The pie charts illustrate the percentage distribution of proteins identified with >3, 3 or 2 unique peptides for six biological replicates per protein extraction buffer. (D) Distribution of total variation data. Distribution of CV values of peptides who met the following parameters: the peptide is present in all six replicates per condition and must have a minimum normalized abundance value of 10000 and a maximum fold change of 1000. Extraction buffers 1, 5 and 8 showed an average CV of, respectively, 80.35%, 114.83% and 99.85%. Variation of the mass spectrometric analysis resulted in an average CV value of 12.28%. | ||
When looking at the distribution of total variation (= total technical + biological variation) data, high CV values and steep CV curves are observed for all three protein extraction buffers (Fig. 6D). Moreover, only the peptides until the 5th (buffer 5), 10th (buffer 8) and 25th (buffer 1) percentile have a CV value lower than 50%. This is reflected in the very high average CV values of 80.35%, 114.83% and 99.85% for extraction buffers 1, 5 and 8, respectively. A corresponding power analysis was performed using R.45 This power analysis is based on a simulation of normally distributed data from which random samples were taken. A significance level of 0.05 was used. The power analysis illustrates that protein extraction buffer 1, for example, would require a sample size of approximately 100 samples to detect a difference of 50% with 90% certainty (Fig. 7).
 | ||
| Fig. 7 Power analysis of human colon FFPE tissue data. A significance level of 0.05 was used. Black curves indicated by circles: fold change of 2, red curves indicated by triangles: fold change of 1.5, green curves indicated by asterisks: fold change of 1.25. | ||
3.4 Qualitative analysis of fresh frozen versus FFPE tissue
Besides the extraction efficacy between different organs and organisms, we additionally determined the differences in the protein profile between FFPE and fresh frozen material using our GeLC-MS/MS proteomic workflow. In order to be able to make a rigorous comparison, the same protein extraction buffer was used for protein extraction from both FFPE and fresh frozen tissue. Since buffer 1 consistently yielded the highest protein recovery in all previous experiments, buffer 1 was used in this comparative experiment. Six technical replicates of mouse liver tissue were processed for both FFPE tissue and fresh frozen tissue. FFPE and fresh frozen tissue samples were non-paired samples. In line with previous experiments, the results are based on the yield per unit volume.In fresh frozen tissue, an average of 951 proteins was identified, compared to an average of 725 identified proteins in FFPE tissue (Fig. 8A). Identification was based on at least 2 unique peptides and the protein identifications were highly confident since the FDR of proteins was close to 0. Fig. 8C illustrates the protein/peptide score distribution in fresh frozen versus FFPE tissue. The protein/peptide score can be defined as the reliability score of protein/peptide identifications. The comparison between fresh frozen tissue and FFPE tissue indicates that both proteins and peptides can be identified with higher confidence in fresh frozen tissue compared to FFPE tissue. A qualitative comparison of the protein identifications in fresh frozen and FFPE tissue is shown in Fig. 8B. Of the total protein identifications, 59.17% is commonly identified in both tissue types. 11.22% is uniquely identified in FFPE tissue, while 29.61% is uniquely identified in fresh frozen tissue. However, gene ontology analysis showed no significant difference in protein identifications according to cellular components and biological processes (data not shown).
 | ||
| Fig. 8 Results of the mouse liver tissue FFPE versus fresh frozen GeLC-MS/MS experiment. (A) Total protein identifications. Mean and SD values for six technical replicates per protein extraction buffer are shown. Protein identification is based on at least two unique peptides. (B) Venn diagram depicting the overlap in protein identifications. For each condition, one protein identification list was used made out of 6 technical replicates. Percentages of common proteins and unique proteins are indicated in white. (C) Reliability of protein identifications. −10log(P) is the reliability score of protein identifications with P the probability the identification is based on chance (Peaks Studio software). Left: Protein score distribution. The Peaks protein score is calculated as the weighted sum of the −10log(P) scores of the protein's supporting peptides. Right: Peptide score distribution. | ||
The standardized GeLC-MS/MS workflow is based on in-gel tryptic digestion of proteins. Both arginine (R) and lysine (K) are trypsin cleavage sites. However, the primary amines of lysine side chains are known to be involved in inter- and intramolecular protein crosslinking reactions, caused by formaldehyde.9 In order to gain an idea about the C-terminal arginine-containing peptide and C-terminal lysine-containing peptide ratio, we calculated the K to R ratio. Fig. 9 illustrates a significantly reduced log(K to R ratio) in the FFPE dataset (t-test, P < 0.0001). This observation suggests a loss of C-terminal lysine-containing peptides in the formaldehyde fixed samples.
 | ||
| Fig. 9 Comparison of log-transformed ratios of C-terminal lysine versus arginine peptides observed from fresh frozen and FFPE tissue. Mean and SD values for six technical replicates per condition are shown. *** indicates significantly different from results with fresh frozen tissue (t-test, P < 0.0001). | ||
It is known that formalin fixation and FFPE tissue sample processing introduce unspecified modifications. We therefore questioned whether FFPE-linked modifications were present to a greater extent in the FFPE dataset than in the fresh frozen dataset. We also looked for modifications which occurred only in the FFPE dataset. Table 4 gives an overview of modifications detected by the Peaks PTM module which can be linked to FFPE tissue. From this table, we can observe that there is no prominent difference in the number of peptide to spectrum matches (PSM) which have modifications linked to the formalin fixation process (formylation, hydroxylation and hydroxymethyl). However, hydroxymethyl modifications only took place in FFPE proteins and were not detected in the fresh frozen tissue dataset. In addition, a higher number of methionine oxidations were observed in the FFPE tissue dataset. Methionine oxidation occurred in 4990 FFPE peptide to spectrum matches compared to 3947 peptide to spectrum matches in the fresh frozen tissue dataset.
4 Discussion
Although protein extraction from FFPE tissues can be seen as suboptimal for biomedical projects, more and more solutions are provided to overcome the accompanied challenges. One major challenge in FFPE tissue research is the fact that currently all research groups use different protocols and buffers, making rigorous comparison difficult.In this study, we compared 8 different extraction buffers with the same GeLC-MS/MS workflow. This proteomic method has already been used in multiple mass spectrometric studies and proved to be appropriate for the analysis of FFPE tissue.19–21,35,46 Performing gel electrophoresis is advantageous when whole FFPE tissue sections are used, as residual paraffin and MS-incompatible buffer components can be removed before loading the sample on the LC column. Moreover, gel electrophoresis allows the reduction of sample complexity due to their fractionation ability. In this study, whole FFPE tissue sections were used. We have deliberately chosen for whole tissue sections as they have several advantages. E.g., when analyzing tumor tissue, also the tumor microenvironment (TME) can be analyzed. This is important since it is the interaction between the tumor cells and the environment which determines the tumor's behavior.47 In addition, collecting whole tissue section samples is not very time-consuming. This is in contrast with most published FFPE tissue proteomics studies where laser capture microdissection on tissue slices is performed in order to isolate specific cells (e.g. tumor cells) for further processing.48
4.1 Protein concentration determination of FFPE tissue protein extracts
In this study, three protein concentration determination assays were tested. While the qubit assay is based on fluorescence measurements, the BCA and BCA-RAC assays have a different underlying principle: copper reduction. Unfortunately, each assay led to incorrect protein concentration determinations and non-reproducible results. Divergent high protein concentrations were measured for control samples (= paraffin sections without tissue) and repeated measurements of a single sample didn't provide consistent results. The margin of error on the protein concentration seemed to be correlated with the composition of the protein extraction buffer. We therefore conclude that mainly the (concentration of the) components of the buffers influence a correct protein concentration measurement rather than residual paraffin. Even though the final concentrations of contaminants in the qubit fluorometer are lower than allowed following the manufacturer's manual, the contaminants have a disturbing effect on the protein concentrations that are measured. When comparing the different compositions of the extraction buffers, mainly SDS, glycerol and DTT are the high influencing contaminants in our samples. Although the BCA and BCA-RAC assays are based on a totally different principle, estimation of protein concentrations of FFPE tissue protein extracts with these assays is not straightforward as amino acids that contribute to the reduction of copper are also susceptible to reactions with formaldehyde.26 As none of the tested assays provided correct and reproducible results, our experiments were based on the yield per unit volume of FFPE protein extract. Although this method works fine in the case of qualitative proteomic experiments such as we performed, this is not the best method for quantitative proteomic approaches. In order to overcome problems concerning protein concentration measurements, recently, Wisniewski (2013) has developed a new assay that is based on the measurement of tryptophan residue fluorescence in digested samples. This quantification assay is thus not based on the determination of protein concentrations, but rather focusses on ‘peptide’ concentrations, although they allow recalculation to the protein content by assuming that eukaryotic proteins contain 1.3% tryptophan on average.49 However, in our study, it is crucial to start the experiment with an equal amount of material for each sample, as we make a first evaluation in the 1D gel phase. We therefore wanted to determine the protein concentration in an earlier step, prior to tryptic digestion. However, once an optimal protocol is found for qualitative analysis of FFPE tissue, quantitative studies can be performed. We then suggest implementation of the quantification assay of Wisniewski (2013).4.2 FFPE tissue protein extraction efficiency
The critical comparison of 8 different protein extraction buffers with the same GeLC-MS/MS workflow allowed us to point out which combination of buffer components is most optimal in order to extract as many full length FFPE proteins as possible from FFPE tissue. Both in murine liver and colon FFPE tissue, as well as in human colon FFPE tissue, protein extraction buffer 1 consistently came forward as the most efficient protein extraction buffer. This buffer yielded the highest protein recovery and reached the highest number of unique protein identifications after GeLC-MS/MS analysis compared to the 7 other protein extraction buffers. Protein extraction buffer 1 is characterized by 2% SDS, 20% glycerol and a pH of 8.8. Magdeldin and Yamamoto illustrated that protein extraction buffers containing 2% SDS extract 15 times more proteins from FFPE tissue compared to extraction buffers which do not contain SDS. This extraction efficiency can be attributed to SDS' dual role as detergent and protein denaturant.5 Moreover, other studies showed that alkaline (pH 8.0–9.5) Tris-HCL buffers give higher quality protein extraction compared to neutral or acidic protein extraction buffers.50,51 Therefore, it is believed that an alkaline medium facilitates protein crosslinking reversion and thus protein extraction from FFPE tissue. Glycerol, however, has no function in protein extraction since addition of glycerol (or glycine) to extraction buffers did not improve protein recovery. In contrast, glycerol addition resulted in a more consistent protein recovery and improved reproducibility between samples. In general, glycerol is often added to protein extraction buffers as it increases osmolarity and stabilizes proteins. In addition, glycerol plays a cryoprotectant role in long-term preservation of FFPE protein extracts at −80 °C.50,51 In conclusion, the protein extraction efficiency of protein extraction buffer 1 can be attributed to the optimal combination of SDS, glycerol and an alkaline medium with pH 8.8. However, some studies argue that the buffer composition has relatively little effect on the protein extraction efficiency. They suggest that it's mainly the heating of the samples at temperatures higher than 60 °C that is crucial for high protein recovery.26,52 Although Sprung (2009) and Yamashita (2007) did not see major differences in changing buffers, we do see an effect when changing buffer compositions when the same protein extraction protocol is used.4.3 Variation in FFPE tissue data
While considerable progress has been achieved, MS-based proteome analysis of FFPE tissue is still characterized by high technical variation levels. Technical variation can be subdivided into two components: the reproducibility of the sample preparation and the reproducibility of the mass spectrometric analysis. The MS analysis variation was determined by measuring a triplicate injection of a murine liver FFPE tissue sample and resulted in an average CV value of 12.28%. This means that the mass spectrometric measurements only have a small contribution to the high percentages of total technical variation. In contrast, sample preparation causes high technical variation as the reversion of formaldehyde induced protein crosslinks is an uncontrollable process. Moreover, the efficiency of protein recovery is influenced by several pre-analytical factors such as fixation protocols, fixation times and archival times.2 The effects of these pre-analytical parameters are not mentioned here as they are very well described elsewhere.32,34,36,53,54 With the effects of pre-analytical factors in mind, the murine FFPE tissue samples used in this study were prepared in a standardized manner. However, the obtained FFPE tissue datasets show high levels of technical variation, originating in the fixation and extraction protocol. The variation caused by sample preparation can be estimated by subtracting the variation caused by MS of the total technical variation. Taken into account the fact that human FFPE tissue samples are never prepared in a standardized manner (e.g. due to pre-analytical factors related to surgery, patients' health and clinical history), human FFPE tissue samples will have even higher total technical variation levels. In addition, murine samples are characterized by relative low biological variation levels since mice have a more similar (genetic) background compared to humans. High biological variation levels in human samples – due to gender, age, health status, diet, etc. – therefore need to be taken into account when one wants to perform a statistically reliable experiment. The statistical reliability of an experiment is determined by the statistical power, i.e. the ability to detect an effect in a population when the effect is present. High statistical power is thus needed in order to prevent drawing false-negative conclusions.55 In this study, a power analysis was performed on the human colon FFPE tissue dataset (Fig. 7). The number of required samples in order to perform a statistical reliable experiment increases exponentially when increasing the power until a maximum is reached. E.g., performing an experiment with protein extraction buffer 1 and a power of 90%, approximately 100 samples are required to detect a difference of 50% (i.e. fold change of 1.5). This power analysis illustrates that the amount of variation influences the sample size proportionally. Samples characterized by high variability require more biological replicates compared to samples with low variability in order to evaluate whether an observed effect is a true effect.554.4 Fresh frozen tissue versus FFPE tissue
Although murine fresh frozen tissue is easier accessible compared to human fresh frozen tissue, both tissue types are extensively used in FFPE proteomics studies. Moreover, in the literature, many critical comparisons between fresh frozen tissue and FFPE tissue can be found.16,23,26,28,46 The general consensus in these studies is that very encouraging results have been reached in the last few years. The proteome of FFPE tissue samples has proven to be (highly) comparable to the proteome of a paired fresh frozen tissue sample. Although, this is mainly true for shotgun proteomics experiments.1 In our study, we investigated whether our optimized GeLC-MS/MS proteomics workflow is able to accurately represent the collection of proteins identified in fresh frozen tissue in a similar analysis of FFPE tissue.The effects of fixation and subsequent tissue processing of FFPE tissue – protein crosslinks and modifications – can have an impact on extracting as many full length FFPE proteins as possible and on identifying extracted proteins in an unambiguous manner. This could be clearly observed in our FFPE dataset. Firstly, the number of identified proteins in fresh frozen tissue is 14% more compared to FFPE tissue. However, some studies show a similar protein recovery in fresh frozen and FFPE tissue. For example, Sprung et al. (2009) performed a shotgun proteome analysis of FFPE tissue whereby proteome analyses were more than 90% equivalent to those generated from frozen tissues, both in numbers of proteins identified and in identities of the protein populations.26 However, this analysis was based on protein groups and not on individual proteins. Second, a trend is observed that protein identifications in fresh frozen tissue are more confident than protein identifications in FFPE tissue (Fig. 8C). Third, only an overlap of 59.17% in protein identifications was observed between fresh frozen and FFPE tissue. In addition, only 11.22% of the total protein identifications were uniquely identified in FFPE tissue. These findings indicate that the protein recovery and subsequent mass spectrometric analysis of FFPE tissue are suboptimal compared to fresh frozen tissue.
Beside arginine, lysine is used as the C-terminal cleavage site by the proteolytic enzyme trypsin when cleaving proteins into peptides. However, it is known that the primary amines of lysine side chains are involved in the formation of inter- and intramolecular protein crosslinks.9 Therefore, one can expect that tryptic FFPE tissue digests include less lysine C-terminal peptides than arginine C-terminal peptides. This expectation was confirmed when comparing the log-transformed ratio of lysine C-terminal peptides to arginine C-terminal peptides (K/R ratio) between fresh frozen and FFPE tissue data. The significant reduction in lysine C-terminal peptides in the FFPE dataset (Fig. 9) is in accordance with the chemical reactions occurring during the formaldehyde fixation process. Previous studies have come to similar results and observed an underrepresentation of lysine C-terminal peptides in FFPE tissue tryptic digests.26,28 Sprung et al. (2009) has yet another possible explanation for this significant underrepresentation of lysine C-terminal peptides.26 Amino acid side chain modifications induced by formaldehyde fixation can hinder unambiguous protein identification when performing a protein database search. However, in our study, this statement can be countered by the fact that we included the Peaks PTM search module during the data analysis, which detects frequently occurring post-translational modifications. Modifications which could be linked to the chemistry of formalin fixation found in our data were formylations on lysine and N-termini, hydroxylations on mainly basic amino acids such as lysine and arginine and hydroxymethyl(methylol) modifications on asparagine. In addition, a high number of methionine oxidations were observed. This can be linked to the storage of FFPE tissue as it is known that oxidation reactions are more pronounced in long-term archived FFPE tissue samples. The number of oxidations will increase as the storage time of the FFPE tissue samples will increase.20,32 Since these modifications are detected and included in the data analysis, unambiguous protein identification cannot longer be hindered. It is clear that the current development of advanced bioinformatics solutions unlocks more information from datasets.
5 Conclusion
In conclusion, the FFPE GeLC-MS/MS proteomics workflow is still limited in the ability to fully approach the protein recovery efficiency from fresh frozen tissue and to reverse formaldehyde induced protein modifications. In addition, FFPE data are still characterized by relative high variation levels. However, in addition to other analytical methods, FFPE tissue is suitable for proteomics candidate biomarker discovery studies when taken into account this relative high variation levels by using sufficient numbers of samples. And let this just be one of the strengths of FFPE tissue.Acknowledgements
The authors thank Wouter De Haes for assistance with the power analysis and Lut Arckens for the provision of murine FFPE tissue samples. This work was supported by the Institute for the Promotion of Innovation through Science and Technology in Flanders (IWT) and by the KU Leuven Research Fund.References
- A. Tanca, D. Pagnozzi and M. F. Addis, Proteomics: Clin. Appl., 2012, 6, 7–21 CrossRef CAS PubMed.
- N. J. Nirmalan, P. Harnden, P. J. Selby and R. E. Banks, Mol. BioSyst., 2008, 4, 712–720 RSC.
- R. Klopfleisch, A. T. Weiss and A. D. Gruber, Histol. Histopathol., 2011, 26, 797–810 CAS.
- B. A. Reimel, S. Pan, D. H. May, S. A. Shaffer, D. R. Goodlett, W. Mcintosh, L. M. Yerian, M. P. Bronner, R. Chen and T. A. Brentnall, Curr. Proteomics, 2009, 6, 63–69 CrossRef CAS PubMed.
- S. Magdeldin and T. Yamamoto, Proteomics, 2012, 12, 1045–1058 CrossRef CAS PubMed.
- R. Thavarajah, V. K. Mudimbaimannar, J. Elizabeth, U. K. Rao and K. Ranganathan, Int. J. Oral Maxillofac. Pathol., 2012, 16, 400–405 CrossRef PubMed.
- E. Maes, V. Broeckx, I. Mertens, X. Sagaert, H. Prenen, B. Landuyt and L. Schoofs, Amino Acids, 2013, 205–218 CrossRef CAS PubMed.
- L. D. Ralton and G. I. Murray, J. Clin. Pathol., 2011, 64, 297–302 CrossRef CAS PubMed.
- B. Metz, G. F. A. Kersten, G. J. E. Baart, A. de Jong, H. Meiring, J. ten Hove, M. J. van Steenbergen, W. E. Hennink, D. J. A. Crommelin and W. Jiskoot, Bioconjugate Chem., 2006, 17, 815–822 CrossRef CAS PubMed.
- B. Metz, J. Biol. Chem., 2003, 279, 6235–6243 CrossRef PubMed.
- J. Toews, J. C. Rogalski and J. Kast, Anal. Chim. Acta, 2010, 676, 60–67 CrossRef CAS PubMed.
- C. H. Fox, F. B. Johnson, J. Whiting and P. P. Roller, J. Histochem. Cytochem., 1985, 33, 845–853 CrossRef CAS PubMed.
- C. Klockenbusch, J. E. O'Hara and J. Kast, Anal. Bioanal. Chem., 2012, 404, 1057–1067 CrossRef CAS PubMed.
- R. Dapson, Biotech. Histochem., 2007, 82, 133–140 CrossRef CAS PubMed.
- K. Ikeda, T. Monden, T. Kanoh, M. Tsujie, H. Izawa, A. Haba, T. Ohnishi, M. Sekimoto, N. Tomita, H. Shiozaki and M. Monden, J. Histochem. Cytochem., 1998, 46, 397–403 CrossRef CAS PubMed.
- M. F. Addis, A. Tanca, D. Pagnozzi, S. Rocca and S. Uzzau, Proteomics, 2009, 9, 4329–4339 CrossRef CAS PubMed.
- C. B. Fowler, I. E. Chesnick, C. D. Moore, T. J. O'Leary and J. T. Mason, PLoS One, 2010, 5, e14253 Search PubMed.
- E. Donadio, L. Giusti, F. Cetani, Y. Da Valle, F. Ciregia, G. Giannaccini, E. Pardi, F. Saponaro, L. Torregrossa, F. Basolo, C. Marcocci and A. Lucacchini, Proteome Sci., 2011, 9, 29 CrossRef CAS PubMed.
- C. B. Fowler, T. J. Waybright, T. D. Veenstra, T. J. O'Leary and J. T. Mason, J. Proteome Res., 2012, 11, 2602–2608 CrossRef CAS PubMed.
- E. Maes, D. Valkenborg, I. Mertens, V. Broeckx, G. Baggerman, X. Sagaert, B. Landuyt, H. Prenen and L. Schoofs, Mol. BioSyst., 2013, 2686–2695 RSC.
- C. B. Fowler, T. J. O'Leary and J. T. Mason, J. Proteomics Bioinf., 2014, 7, 151–157 Search PubMed.
- M. F. Addis, A. Tanca, D. Pagnozzi, S. Crobu, G. Fanciulli, P. Cossu-Rocca and S. Uzzau, Proteomics, 2009, 9, 3815–3823 CrossRef CAS PubMed.
- K. Davalieva, S. Kiprijanovska and M. Polenakovic, Protein J., 2014, 33, 135–142 CrossRef CAS PubMed.
- B. L. Hood, T. P. Conrads and T. D. Veenstra, Briefings Funct. Genomics Proteomics, 2006, 5, 169–175 CrossRef CAS PubMed.
- X. Jiang, X. Jiang, S. Feng, R. Tian, M. Ye and H. Zou, J. Proteome Res., 2007, 6, 1038–1047 CrossRef CAS PubMed.
- R. W. Sprung, J. W. C. Brock, J. P. Tanksley, M. Li, M. K. Washington, R. J. C. Slebos and D. C. Liebler, Mol. Cell. Proteomics, 2009, 8, 1988–1998 CAS.
- N. W. Bateman, M. Sun, R. Bhargava, B. L. Hood, M. M. Darfler, A. J. Kovatich, J. A. Hooke, D. B. Krizman and T. P. Conrads, J. Proteome Res., 2011, 10, 1323–1332 CrossRef CAS PubMed.
- B. L. Hood, M. M. Darfler, T. G. Guiel, B. Furusato, D. A. Lucas, B. R. Ringeisen, I. A. Sesterhenn, T. P. Conrads, T. D. Veenstra and D. B. Krizman, Mol. Cell. Proteomics, 2005, 4, 1741–1753 CAS.
- S. Matsukawa, K. Morita, A. Negishi, H. Harada, Y. Nakajima, H. Shimamoto, H. Tomioka, K. Tanaka, M. Ono, T. Yamada and K. Omura, Cancer Med., 2014, 3, 349–361 CrossRef CAS PubMed.
- T. Takadate, T. Onogawa, T. Fukuda, F. Motoi, T. Suzuki, K. Fujii, M. Kihara, S. Mikami, Y. Bando, S. Maeda, K. Ishida, T. Minowa, N. Hanagata, H. Ohtsuka, Y. Katayose, S. Egawa, T. Nishimura and M. Unno, Int. J. Cancer, 2013, 132, 1368–1382 CrossRef CAS PubMed.
- A. Tanca, M. F. Addis, D. Pagnozzi, P. Cossu-Rocca, R. Tonelli, G. Falchi, A. Eccher, T. Roggio, G. Fanciulli and S. Uzzau, J. Proteomics, 2011, 74, 359–370 CrossRef CAS PubMed.
- B. M. Balgley, T. Guo, K. Zhao, X. Fang, F. A. Tavassoli, C. S. Lee and C. Road, J. Proteome Res., 2010, 8, 917–925 CrossRef PubMed.
- D. Jackson, R. A. Rowlinson, C. K. Eaton, J. A. Nickson, I. D. Wilson, J. D. Mills, R. W. Wilkinson and R. P. Tonge, Proteomics, 2006, 6, 3901–3908 CrossRef CAS PubMed.
- T. J. Kokkat, M. S. Patel, D. McGarvey, V. A. LiVolsi and Z. W. Baloch, Biopreserv. Biobanking, 2013, 11, 101–106 CrossRef CAS PubMed.
- A. Tanca, D. Pagnozzi, G. Falchi, G. Biosa, S. Rocca, G. Foddai, S. Uzzau and M. F. Addis, J. Proteomics, 2011, 74, 1015–1021 CrossRef CAS PubMed.
- R. Xie, J.-Y. Chung, K. Ylaya, R. L. Williams, N. Guerrero, N. Nakatsuka, C. Badie and S. M. Hewitt, J. Histochem. Cytochem., 2011, 59, 356–365 CrossRef CAS PubMed.
- J. Zhang, L. Xin, B. Shan, W. Chen, M. Xie, D. Yuen, W. Zhang, Z. Zhang, G. A. Lajoie and B. Ma, Mol. Cell. Proteomics, 2012, 11, M111.010587 Search PubMed.
- X. Han, L. He, L. Xin, B. Shan and B. Ma, J. Proteome Res., 2011, 10, 2930–2936 CrossRef CAS PubMed.
- Y. Han, B. Ma and K. Zhang, J. Bioinf. Comput. Biol., 2005, 3, 697–716 CrossRef CAS.
- B. Ma and G. Lajoie, Curr. Protoc. Bioinf., 2009, ch. 13, unit 13.10 Search PubMed.
- P. Lavery, How does Progenes. LC-MS quantify protein abundance?, 2011 Search PubMed.
- M. F. Addis, A. Tanca, D. Pagnozzi, S. Rocca and S. Uzzau, Proteomics, 2009, 9, 4329–4339 CrossRef CAS PubMed.
- D. K. Crockett, Z. Lin, C. P. Vaughn, M. S. Lim and K. S. J. Elenitoba-Johnson, Lab. Invest., 2005, 85, 1405–1415 CrossRef PubMed.
- S.-I. Hwang, J. Thumar, D. H. Lundgren, K. Rezaul, V. Mayya, L. Wu, J. Eng, M. E. Wright and D. K. Han, Oncogene, 2007, 26, 65–76 CrossRef CAS PubMed.
- R. Development Core Team, 2013.
- A. Tanca, D. Pagnozzi, G. P. Burrai, M. Polinas, S. Uzzau, E. Antuofermo and M. F. Addis, J. Proteomics, 2012, 77, 561–576 CrossRef CAS PubMed.
- A. G. Clark and D. M. Vignjevic, Curr. Opin. Cell Biol., 2015, 36, 13–22 CrossRef CAS PubMed.
- S. Datta, L. Malhotra, R. Dickerson, S. Chaffee, C. K. Sen and S. Roy, Histol. Histopathol., 2015, 30, 1255–1269 Search PubMed.
- J. R. Wiśniewski, J. Visualized Exp., 2013, 6–11 Search PubMed.
- J.-Y. Chung, S.-J. Lee, Y. Kris, T. Braunschweig, J. L. Traicoff and S. M. Hewitt, Proteomics: Clin. Appl., 2008, 2, 1539–1547 CrossRef CAS PubMed.
- O. Azimzadeh, Z. Barjaktarovic, M. Aubele, J. Calzada-wack, H. Sarioglu, M. J. Atkinson and S. Tapio, J. Proteome Res., 2010, 4710–4720 CrossRef CAS PubMed.
- S. Yamashita, Prog. Histochem. Cytochem., 2007, 41, 141–200 CrossRef CAS PubMed.
- S. M. Hewitt, F. A. Lewis, Y. Cao, R. C. Conrad, M. Cronin, J. F. Palma, J. A. Warrington and C. Expression, 2008, 132.
- S. M. Thompson, R. A. Craven, N. J. Nirmalan, P. Harnden, P. J. Selby and R. E. Banks, Proteomics: Clin. Appl., 2013, 7, 241–251 CrossRef CAS PubMed.
- E. Maes, I. Mertens, D. Valkenborg, P. Pauwels, C. Rolfo and G. Baggerman, Crit. Rev. Oncol. Hematol., 2015, 96, 437–448 CrossRef PubMed.
| This journal is © The Royal Society of Chemistry 2016 |