Molecular modelling studies of sirtuin 2 inhibitors using three-dimensional structure–activity relationship analysis and molecular dynamics simulations†
Yu-Chung
Chuang
a,
Ching-Hsun
Chang
a,
Jen-Tai
Lin
b and
Chia-Ning
Yang
*a
aDepartment of Life Sciences, National University of Kaohsiung, 700, Kaohsiung University Road, Nan-Tzu District 811, Kaohsiung, Taiwan. E-mail: cnyang@nuk.edu.tw; Fax: +886-75919404; Tel: +886-7-5919717
bDivision of Urology, Department of Surgery, Kaohsiung Veterans General Hospital, Kaohsiung, Taiwan
First published on 28th November 2014
Abstract
Sirtuin 2 (SIRT2) is a nicotinamide-adenine-dinucleotide-dependent histone deacetylase that plays a vital role in various biological processes related to DNA regulation, metabolism, and longevity. Recent studies on SIRT2 have indicated its therapeutic potential for neurodegenerative diseases such as Parkinson's disease. In this study, a series of SIRT2 inhibitors with a 2-anilinobenzamide core was analysed using a combination of molecular modelling techniques. A three-dimensional structure–activity relationship (3D-QSAR) model adopting a comparative molecular field analysis (CoMFA) method with a non-cross-validated correlation coefficient R2 = 0.992 (for training set) and a correlation coefficient Rtest2 = 0.804 (for test set) was generated to determine the structural requirements for inhibitory activity. Furthermore, we employed molecular dynamics (MD) simulations and the molecular mechanics/generalized Born surface area (MM/GBSA) method to compare the binding modes of a potent and selective compound interacting with SIRT1, SIRT2, and SIRT3 and also their binding free energies to shed light on the selectivity of the footing of structural and energetic investigations. The steric and electrostatic contour maps from the 3D-QSAR analysis identified several key interactions also observed in the MD simulations. According to these results, we provide guidelines for developing novel potent and selective SIRT2 inhibitors.
Introduction
The silent information regulator (SIR) protein family is highly conserved from bacteria to humans.1–14 This protein family regulates gene silencing and is responsible for various biological functions and medical conditions, including cell-cycle regulation, cell survival, apoptosis, autophagy, inflammation, DNA recombination, DNA repair, glucose homeostasis, age-related diseases, diabetes, obesity, and neuro-degenerative disorders.15–26In yeast, there are five SIR proteins (SIR1-5). SIR1-4 are essential for establishing and maintaining gene silencing. The SIR2–SIR3–SIR4 complex is involved in mating-type and telomeric silencing. SIRT2 interacting with other proteins is responsible for rDNA silencing.27–33 Seven sirtuin proteins have been reported in humans. Sirtuin 1 (SIRT1) is localized in the nucleus and modulates gene expression by deacetylating proteins, histone H4, p53, BCl6, and FOXO.12,13,18,20,23,34–36 SIRT2 is localized in the cytoplasm and has been implicated in the process of cell division because it deacetylates α-tubulin.37,38 SIRT3, SIRT4, and SIRT5 are mitochondrial proteins. SIRT3 has been demonstrated to be involved in the activation of mitochondrial functions. SIRT4 was reported to play a regulatory role in the insulin secretion.39–41 The function of SIRT5 remains unclear.35 SIRT6 is localized in the nucleus and deactylates lysine 9 of histone H3 in regulating telomeric metabolism and functions. SIRT7 is localized in the nucleus and is involved in the activation of RNA polymerase I transcription. Interestingly, only SIRT2 (Sirtulin) of all SIRT members is involved in gene-silencing methods from bacteria to higher eukaryotes. Therefore, the processes through which SIRT2 mediates gene silencing, the structure of SIRT2, and SIRT2 regulators (activators and inhibitors) have been widely studied in the previous decade.
In eukaryotic cells, gene silencing is regulated by histone deacetylases (HDACs). Four classes of zinc-dependent (classical) HDACs have been characterized: Class I (HDAC1, 2, 3, and 8), Class IIa (HDAC4, 5, 7, and 9), Class IIb (HDAC6 and 10), and Class IV (HDAC11). The nicotinamide adenine dinucleotide (NAD+)-dependent deacetylases are divided into two major groups, namely Class III and sirtuins, according to their mechanisms.22,42–47 SIRT2 belongs to Class III deacetylase. During deacetylation, SIRT2 cleaves glycosidic bonds and generates nicotinamide and the novel metabolite O-acetyl-ADP ribose.2–5 Because SIRT2 has been proved to regulate various biological functions, the regulators of SIRT2 have potential therapeutic functions in cancer, HIV, obesity, diabetes, parkinsonian diseases, and Huntington disease.23,26,37,48 Numerous potential SIRT2 inhibitors including the tryptamide-based TRIPOS 360702,49,50 bisindolylmaleimide analogs,51 and 2-cyano-3-[5-(2,5-dichlorophenyl)-2-furanyl]-N-5-quinolinyl-2-propenamide24 have been reported. Suzuki and colleagues recently synthesized and evaluated a novel series of 2-anilinobenzamide derivatives targeted at SIRT2 with the lowest IC50 value of 0.57 μM (compound 39 as shown in Table 1).52 Moreover, 39 exhibited in vitro selectivity against SIRT1 (IC50 > 300 μM) and SIRT3 (IC50 > 300 μM) as evaluated by the same assay for compounds 1–46.
Molecular dynamics (MD) simulation is a powerful tool for correlating protein structure and function because it enables elucidating protein structures and dynamics at the atomic level. Numerous researchers have used MD simulations in conjunction with experimental observations to investigate protein–protein and protein–small compound interactions.53–57 In addition, three-dimensional quantitative structure–activity relationship (3D-QSAR) analysis adopting the comparative molecular field analysis (CoMFA) method58 constitutes a computer-aided drug design approach for providing structural guidelines for small molecules and, regarding interactive fields, predicting the influence of activity. In this study, we applied 3D-QSAR analysis to obtain the structural requirements for drug development of SIRT2 inhibitors. MD simulations and binding free-energy calculations using the molecular mechanics/generalized Born surface area (MM/GBSA) approach59 were performed to evaluate the selectivity of 39 bound in SIRT1, SIRT2, and SIRT3. Compound 39 was investigated because, according to Suzuki and colleagues, who obtained an in vitro selectivity profile for SIRT1, SIRT2, and SIRT3, 39 exhibited a preference for SIRT2 over the other two SIRT proteins,52 regardless of the 52% for SIRT2 vs. SIRT3 and 39% for SIRT2 vs. SIRT1 amino acid sequence similarity. The MD results for SIRT2–39 were consistent with contour maps derived through 3D-QSAR analysis and were compared with SIRT1–39 and SIRT3–39 complexes predicted using the MD simulations. The conclusions drawn in this study provide insight into further structural modifications that yield more potent and selective SIRT2 inhibitors.
Computational methods
Setup for CoMFA
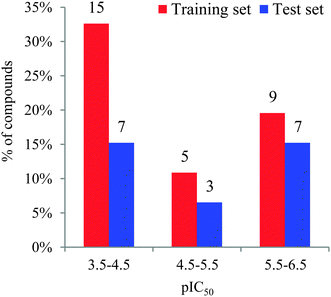
Forty-six molecules and their inhibitory activities against SIRT2 were obtained from the data set designed and synthesized by Suzuki and colleagues.52 The structures and IC50 values (μM) of these molecules against SIRT2 are listed in Table 1. We divided the 46 compounds into a training set containing 29 compounds for model generation and a test set containing 17 compounds (marked with an asterisk “*” in Table 1) for model validation. The test set compounds were selected according to the distribution of biological data and structural diversity, as indicated in Table 1 and Fig. 1. We chose the training and test set compounds based on random selection. For compounds 1–30 with higher structural diversity and a wider IC50 value range (from 4.3 to 100 μM), we took a ratio of 2![[thin space (1/6-em)]](https://www.rsc.org/images/entities/char_2009.gif) :
:![[thin space (1/6-em)]](https://www.rsc.org/images/entities/char_2009.gif) 1 for the training and test set compounds with the hope of using a larger training set to take all sorts of structural variations into consideration. However, because compounds 31–46 possess very minor structural differences on the substituent “R” in Table 1 and a narrow IC50 range (between 0.57 and 3.4 μM), we took a ratio of nearly 1
1 for the training and test set compounds with the hope of using a larger training set to take all sorts of structural variations into consideration. However, because compounds 31–46 possess very minor structural differences on the substituent “R” in Table 1 and a narrow IC50 range (between 0.57 and 3.4 μM), we took a ratio of nearly 1![[thin space (1/6-em)]](https://www.rsc.org/images/entities/char_2009.gif) :
:![[thin space (1/6-em)]](https://www.rsc.org/images/entities/char_2009.gif) 1 when choosing the training set (9 compounds) and test set (7 compounds).
1 when choosing the training set (9 compounds) and test set (7 compounds).
Alignment of the compounds is critical for determining a structure–activity relationship because discriminative inhibitory activities are firmly correlated with minor structural variations on a single corner of a series of compounds. We adopted a ligand-based approach for aligning the studied compounds because no cocrystal structure was available for SIRT2 bound with one of the studied inhibitors. All the studied compounds were sketched and geometrically optimized in 5![[thin space (1/6-em)]](https://www.rsc.org/images/entities/char_2009.gif) 000 steps by using Gasteiger–Hückel charge assignment, Tripos force-field parameters, and the Powell method without constraints. The database alignment protocol in Sybyl 8.160 was used to align the structures according to the 2-anilinobenzamide core depicted in ball-and-stick representation as shown in Fig. 2. Two descriptors, including steric (Lennard-Jones 6-12 potential) and electrostatic (Coulombic potential) field energies, were calculated to build the CoMFA model by using an sp3-carbon atom, which carried a +1.0 charge and served as a probe atom placed at the lattice point of a region box. In the partial least squares regression analysis, a leave-one-out (LOO) cross-validation was first performed to determine the optimal number of components (ONC). Further analysis with no cross-validation was then performed using the ONC to obtain the final QSAR model.
000 steps by using Gasteiger–Hückel charge assignment, Tripos force-field parameters, and the Powell method without constraints. The database alignment protocol in Sybyl 8.160 was used to align the structures according to the 2-anilinobenzamide core depicted in ball-and-stick representation as shown in Fig. 2. Two descriptors, including steric (Lennard-Jones 6-12 potential) and electrostatic (Coulombic potential) field energies, were calculated to build the CoMFA model by using an sp3-carbon atom, which carried a +1.0 charge and served as a probe atom placed at the lattice point of a region box. In the partial least squares regression analysis, a leave-one-out (LOO) cross-validation was first performed to determine the optimal number of components (ONC). Further analysis with no cross-validation was then performed using the ONC to obtain the final QSAR model.
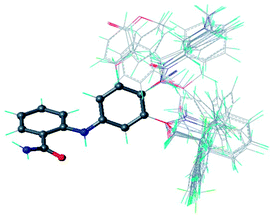 | ||
| Fig. 2 Alignment of the 46 compounds in this study with the core structure specified in a ball and stick representation. | ||
Setup for MD simulations
The MD simulations were performed using AMBER 11.0 software package61 with ff03.r162 and ff99SB force fields63 to compare the binding modes of 39 in SIRT1, SIRT2, and SIRT3 and to explain the selectivity of 39. X-ray crystallography revealed that the SIRT1 structure bound to NAD+ and the SIRT2 and SIRT3 structures bound to ADP ribose had the PDB codes 4I5I,643ZGV,65 and 4BN4,66 respectively. The initial SIRT1–39, SIRT2–39, and SIRT3–39 complex structures were generated after the removal of the bound ligand in each complex structure, although in the latter section it is demonstrated that the studied inhibitors take the substrate site instead of the NAD+ or ADP ribose site. The initial SIRT2–39 complex structure was generated using the LibDock module in Discovery Studio 3.567 after consideration of the highest scored pose of 39 in the scoring function. Because Suzuki and colleagues reported that the amide side chain of SIRT2 Q267 forms hydrogen bonds with the amino-hydrogen atom and the amide-oxygen atom in the 2-anilinobenzamide core,52 our docking simulations focused on a binding pocket including Q267. Fig. S1 (in ESI†) shows the binding site sphere in the SIRT2 set for the docking simulation where the amino acid residues were not allowed to adjust their orientations upon accommodating 39. This highest scored pose of 39 according to the LibDock scoring function68 (Table S1 in ESI†) for this binding site was confirmed by our 3D-QSAR model; in other words, the spacious arrangement of the amino acids around 39 was consistent with the steric contour map generated using the CoMFA method. In addition, we applied a short MD simulation by using Discovery Studio 3.567 and employed the implicit water solvation setting on the LibDock-modeled SIRT2–39 complex structure to reduce the steric hindrance between 39 and its nearby amino acid residues. To maintain the docked pose of 39, we constrained the docked geometry of 39, allowing the amino acid residues in SIRT2 to orient properly. The parameters used in the short MD run are described as follows: 10![[thin space (1/6-em)]](https://www.rsc.org/images/entities/char_2009.gif) 000 steps of steepest-descent minimization using RMS gradient = 0.1 on SIRT2, followed by another 5
000 steps of steepest-descent minimization using RMS gradient = 0.1 on SIRT2, followed by another 5![[thin space (1/6-em)]](https://www.rsc.org/images/entities/char_2009.gif) 000 steps with conjugate-gradient minimization using RMS gradient = 0.05 on SIRT2; 5000 steps for heating from 0 to 300 K; 50
000 steps with conjugate-gradient minimization using RMS gradient = 0.05 on SIRT2; 5000 steps for heating from 0 to 300 K; 50![[thin space (1/6-em)]](https://www.rsc.org/images/entities/char_2009.gif) 000 steps for equilibration; and 1 ns for production, where the time interval for each step was 1 fs. The final snapshot of this short MD run was used as the initial SIRT2–39 conformation for the follow-up MD simulation performed using AMBER 11.0.
000 steps for equilibration; and 1 ns for production, where the time interval for each step was 1 fs. The final snapshot of this short MD run was used as the initial SIRT2–39 conformation for the follow-up MD simulation performed using AMBER 11.0.
When constructing the initial SIRT1–39 and SIRT3–39 complex structures, we processed structural alignment between SIRT2 and SIRT1 and between SIRT2 and SIRT3 according to the aforementioned implicit-water MD refined SIRT2–39 structure to locate the region for accommodating 39. The root-mean-square deviation (RMSD) value was 4.9 Å for the aligned SIRT1–39 and SIRT2–39 and 6.0 Å for the aligned SIRT3–39 and SIRT2–39. The superposed SIRT2–39 and SIRT1–39 conformations and the superposed SIRT2–39 and SIRT3–39 conformations (not shown in this paper) suggested major structural discrepancies in their small domains, whereas their large domains exhibited favorable alignment.
The force-field parameters for the ligand were generated using the general AMBER force field by employing the Antechamber program.69 The partial atomic charges for the ligand atoms were assigned using the AM-BCC protocol70 after electrostatic potential calculations at the HF/6-31G* level. All hydrogen atoms of the three proteins were assigned using the LEaP module in consideration of ionizable residues set at their default protonation states at a neutral pH value. Each complex was immersed in a cubic box of the TIP3P water model.71 The size of the box was set such that the distance between the atoms in the studied complex and the wall was greater than 12 Å. Five, six, and seven Na+ ions were added to neutralize the SIRT1–39, SIRT2–39, and SIRT3–39 complex systems, respectively. The solvated system was energy-minimized through three stages, each employing 15![[thin space (1/6-em)]](https://www.rsc.org/images/entities/char_2009.gif) 000 steps of the steepest descent algorithm and 15
000 steps of the steepest descent algorithm and 15![[thin space (1/6-em)]](https://www.rsc.org/images/entities/char_2009.gif) 000 steps of the conjugate-gradient algorithm with a nonbonded cutoff of 8.0 Å. At stage 1, the protein and 39 were restrained, enabling the added TIP3P water molecules to adjust to their proper orientations. At stage 2, the protein backbone was restrained to enable the amino acid side chains to find a superior way of accommodating 39, especially for the manually formed SIRT1–39, SIRT2–39, and SIRT3–39 systems. At stage 3, the entire solvated system was minimized without any restraint.
000 steps of the conjugate-gradient algorithm with a nonbonded cutoff of 8.0 Å. At stage 1, the protein and 39 were restrained, enabling the added TIP3P water molecules to adjust to their proper orientations. At stage 2, the protein backbone was restrained to enable the amino acid side chains to find a superior way of accommodating 39, especially for the manually formed SIRT1–39, SIRT2–39, and SIRT3–39 systems. At stage 3, the entire solvated system was minimized without any restraint.
The MD simulations in this study were performed according to the standard protocol, which consists of gradual heating, density, equilibration, and production procedures in the isothermal isobaric ensemble (NPT, P = 1 atm, and T = 300 K) MD. A minimized solvated system was used as the starting structure for subsequent MD simulations. In the 500 ps heating procedure, the system was gradually heated from 0 to 300 K for 500 ps, followed by density at 300 K for 300 ps, and then constant equilibration at 300 K for 500 ps. After the equilibration procedure, the system underwent a 30 ns production procedure for conformation collection. The time step was set at 2 fs. Snapshots were taken at 10 ps intervals to record the conformation trajectory during the production MD stimulation. An 8 Å cutoff was applied to treat nonbonding interactions, such as short-range electrostatics and van der Waals interactions, and the particle-mesh-Ewald method was applied to treat long-range electrostatic interactions.72 The SHAKE algorithm73 was used to limit all bonds containing hydrogen atoms to their equilibrium lengths. For structural and energetic analysis, we captured the trajectory in the final 5 ns (i.e., 500 conformation snapshots) for each complex system.
Binding free energy calculations
MM/GBSA59 is a popular approach for investigating the energetic contribution to protein-small molecule binding affinity. To compare 39 binding free energies in different SIRTs, MM/GBSA calculations were applied to the snapshots extracted from the final 5 ns of the MD trajectories. The binding free energy was computed for each molecular species, including complexes, ligands, and proteins, as the difference| ΔGbinding = GSIRT–39 − [GSIRT − G39] |
| Gmolecule = 〈EMM〉 + 〈Gpolarsolvaion〉 + 〈Gnonpolarsolvaion〉 − TS, |
| 〈EMM〉 = 〈Einternal〉 + 〈Eelectrostatic〉 + 〈EvdW〉, |
| Gnonpolarsolvation = γA + β. |
Results and discussion
Statistical parameters of the CoMFA model
The statistical parameters of the CoMFA model are summarized in Table 2. The ONC = 5 was recommended after a LOO cross-validated run yielded a value of r2 = 0.884 and the subsequent non-cross-validated R2 = 0.992 yielded a value higher than the criterion value of 0.6 required for a favorable model. Modelling using the test set to predict their pIC50 values with Rtest2 = 0.804 further ensured the predictive ability of the model built using the training set. The corresponding field contributions of steric and electrostatic are 63.2% and 36.8%, indicating the relatively higher influence of the steric field compared with that of the electrostatic field.| a Abbreviations used r2: leave-one-out cross-validated correlation coefficient; ONC: optimum number of principal components; R2: non-cross-validated correlation coefficient (for training set); SEE: standard error of the estimate; F: F-ratio; Rtest2: correlation coefficient of the predicted test set pIC50 by the model. | |
|---|---|
| r 2 | 0.884 |
| ONC | 5 |
| R 2 | 0.992 |
| SEE | 0.072 |
| F | 566.937 |
| R test 2 | 0.804 |
| Contributions | |
| Steric | 0.632 |
| Electrostatic | 0.368 |
The pIC50 values predicted using the CoMFA model are listed in Table S1 (in ESI†) alongside the experimentally observed pIC50 values and the residuals defined by the experimentally observed pIC50 values after the modelling-predicted pIC50 values were subtracted. The experimentally observed pIC50 values are plotted versus the modelling-predicted pIC50 values in Fig. 3. The residuals between the predicted and experimentally observed pIC50 values of the training set were between +0.209 and −0.115 for the training set and between +0.695 and −0.383 for the test set.
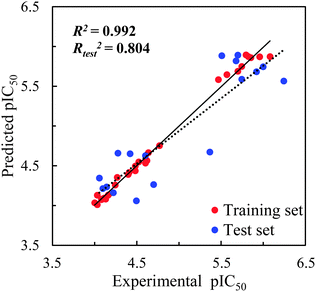 | ||
| Fig. 3 CoMFA prediction for the training and test sets for SIRT2 inhibitory activities with the regression lines for the training set (solid line) and test set (dash line) predictions. | ||
CoMFA model interpretation
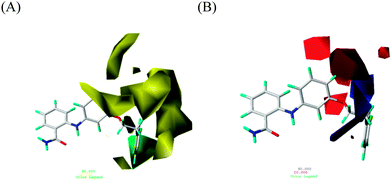
In the steric-field contour map containing a background of 39, as shown in Fig. 4A, a green contour, which prefers a bulky group to increase the designed inhibitor's activity, surrounds 39's fluorobeneze moiety, extending from the aniline of the 2-anilinobenzamide core. Compounds 31–46 possessed such a ring moiety characterized by a long OCH2CH2 linkage rooted to the core and reaching the green contour and exhibited IC50 values (ranging from 0.57 to 3.4 μM) much lower than those of the other compounds studied in the series. However, large yellow contours that avert bulky groups can be classified as two regions. A set of yellow contours appeared on the upper right corner, implying that an extension on the para site relative to the aniline amino group is not preferred, as evidenced by 8–21 with IC50 values ranging from 17 to 93 μM. Another set of yellow contours on the lower right corner indicated that a short extension on the meta site, relative to the aniline amine group, was harmful to inhibitory activity, as proved by 1–7 and 22–29, of which the IC50 values were between 24 and 100 μM.Fig. 4B shows the electrostatic field, exhibiting 39 in the background, where blue and red contours represent electropositive and electronegative groups, respectively, that benefit activity. The blue contour in the background was supported by a comparison between 3 (in which an electronegative –CF3 group was in contact with this blue contour, resulting in a poorer IC50 value of 100 μM) and 4 (in which an –OPh group bypassing this blue contour resulted in a superior IC50 value of 25 μM).
MD simulations of compound 39-bound SIRT systems
MD simulations were performed for 30 ns to investigate the mode of 39 binding to the three SIRT isoforms and, thus, to elucidate the selectivity for SIRT2 over SIRT1 and SIRT3. The RMSD from the initial structure was monitored to examine the dynamic stability of the complexes and plotted against time, as shown in Fig. 5. The magenta line in Fig. 5A denotes the RMSD for the amino acid backbone atoms throughout SIRT1–39, whereas the grey line signifies the backbone atoms near 39 bound in a sphere with a radius of 10 Å. The magenta line suggests that the complex was not stable at the early stage and after a conformational alternation the complex became stable at approximately 7 ns. Such a conformational alternation occurred outside the binding pocket because the grey line is relatively stable. The blue and grey lines in Fig. 5B for SIRT2–39 showing almost the same trend in conformation variation indicate that the entire complex and the binding site region reached stability at approximately 6 ns. Fig. 5C shows that the structural mobility of the SIRT3–39 complex was higher than that of the other two complexes, implying that 39 may not be suitable for SIRT3. The trajectory attained stability at around 20 ns. We used the last 5 ns in subsequent structural and energetic analyses for the three complexes.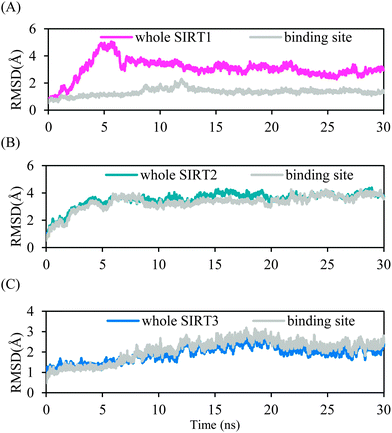 | ||
| Fig. 5 RMSDs of heavy atoms of the protein and ligand in the entire complex or within the binding pocket for: (A) SIRT1–39, (B) SIRT2–39, and (C) SIRT3–39 as a function of the simulation time. | ||
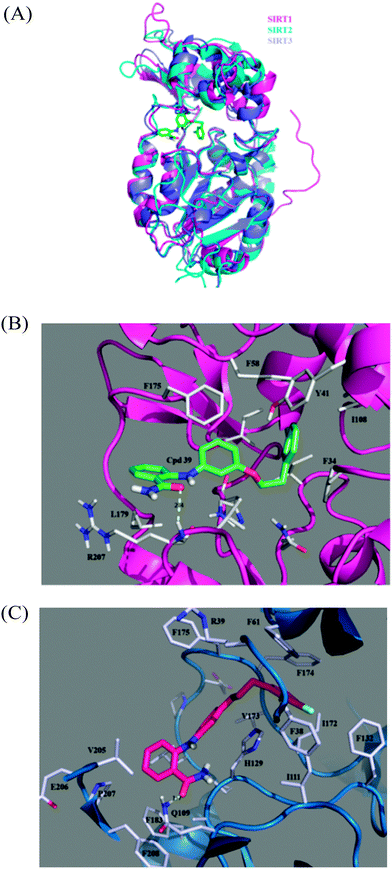
Fig. 6A shows the complex structure of human SIRT2 in a complex with ADP-ribose (PDB code: 3ZGV) and contains labels denoting the 39 binding and substrate sites. The structural architecture of SIRT2 has two domains: a large domain and a small domain.74,75 The large domain comprises six β-strands (β1–β3 and β7–β9) forming a parallel β-sheet and six α-helixes (α1, α7, α8, α10, α11, and α13) packed against the β-sheet. This large domain is in a Rossmann fold, which is present in various NAD(H)–NADP(H) binding enzymes. The small domain contains two structural modules: (i) a helical module, including α3–α6, and (ii) a zinc-binding module, including α9 and β4–β6 in an antiparallel β-sheet where the zinc ion is anchored by four conserved cysteine residues: C195, C200, C221, and C224. Linkage between the large domain and the small domain is achieved by three loops, including L1, which links α2 and α3; L3, which links β3 and β4; and L4, which links α10 and β6. The NAD+ binding groove (i.e., the ADP-ribose binding site) in Fig. 6A, is usually divided into three regions: a site is for accommodating the adenine ring, B site is for the nicotinamide ribose where deacetylation occurs, and C site, which, despite not being in contact with the NAD+, is for polarizing and hydrolyzing the NAD+ glycosidic bond for nicotinamide cleavage.76 Compared with the free-state SIRT2 (PDB code: 1J8F),75 the ADP-ribose-bound state of SIRT2 (PDB code: 3ZGV)65 shows that L1 undergoes a remarkable conformational alternation upon ADP-ribose binding. In more detail, in the absence of the ADP-ribose, the L1 loop and α3–α6 form a more compact helical module; whereas, upon ADP-ribose binding, L1 moves 25° downward to the large domain to clamp the bound ADP-ribose ligand.73 Regarding the substrate binding site, a groove between α10 and α11 and above the parallel β-sheet created by β1 and β2 was proposed as ideal for a peptide substrate possessing an acetyl-lysine side chain oriented toward the B site for deacetylation. The predicted binding site of 39, also shown in Fig. 6A, is spaciously overlapped by the site for acetyl-lysine of the substrate, suggesting that the inhibition mechanism of the studied SIRT2 inhibitors is achieved through competition. It can be correlated to the RMSD result in Fig. 5B that SIRT2 does not undergo significant conformational alternation upon accommodating 39.
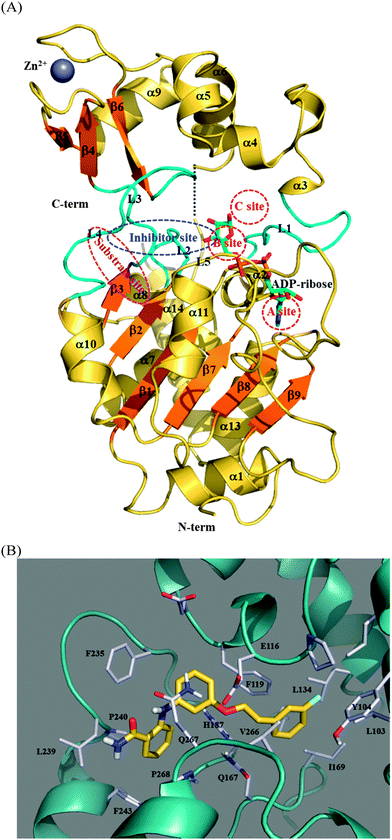 | ||
| Fig. 6 Specification of binding sites in SIRT2. (A) Overall structure of SIRT2 (based on PDB code: 3ZGV) showing the NAD+ site (divided into A, B, and C sites), peptide substrate binding site, and 39 binding site denoted as the inhibitor site. (B) A close up view of the predicted SIRT2–39 binding mode. | ||
Fig. 6B shows a close-up view of the simulated binding mode of 39 within SIRT2 possessing a benzamide moiety oriented toward the entrance of the substrate binding groove and the extended phenyl ring moiety inserted into the B site. An intramolecular hydrogen bond exists between the amino-hydrogen atom and the amide-oxygen atom in 39 to maintain the relative orientation of the aniline and benzamide moieties. The binding pocket is mainly hydrophobic and surrounded by aromatic amino acid residues (F243, F235, F119, and Y104) and aliphatic amino acid residues (V266, L239, L134, and L103). In the large domain near the substrate entrance, P268 (on α11) and L239 (on L4) clamp the amino group of 39. F243 (on α10) and F235 (on L4 that links β6 and α10) encompass the benzamide moiety of 39 to provide π-stacking interaction where the separation distances between the ring centroids are 5.37 Å for F243–benzamide and 6.49 Å for F235–benzamide. F119 (on α4) faces the aniline and the extended phenyl-ring moieties of 39 with separation distances between the ring centroids 4.53 and 5.71 Å, respectively. Y104 (at the junction of α3 and L1) and the long side chains of L103 (on L1) and L134 (on α6) surround the extended phenyl ring of 39. V266 (on L5 connecting α11 and β7 in the large domain) stabilizes the linkage between the extended phenyl ring and the aniline moiety through van der Waals interaction, with separation distance 5.37 Å between the centroid of V266's side chain and the phenyl ring's centroid. The only hydrophilic amino acid, E116 (adjacent to the beginning of α4), does not form any electrostatic interaction with 39; instead, its negatively charged side chain forms a hydrogen bond with the backbone NH atom of Q267 (on L5 linking β7 and α11) to lock the helical module and the large domain of SIRT2, possibly contributing a certain degree of stability to the SIRT2–39 complex.
The position of Q267 in our simulation data differed from that predicted by Suzuki and colleagues.52 Suzuki's model suggested that Q267 uses its side chain carbonyl-oxygen atom and amino-hydrogen atom to form two hydrogen bonds with the amino-hydrogen atom and amide-oxygen atom of 10, respectively.52 Such a discrepancy may have resulted from the extended phenyl ring moiety existing in para or meta positions relative to the amino group in 10 or 39. Furthermore, Suzuki's molecular docking adopted an Hst2-based homology modeled on SIRT2 structures, whereas we used a human ADP-ribose-bound SIRT2 structure in which Q267 is secured by its neighboring Q167, Q116, E235, and V6. Because the Q267 in our model cannot interact with 39, the docking result showed that 39 prefers a docking position that is slightly outward compared to Suzuki's prediction.
A comparison between our MD simulation on SIRT–39 and the QSAR models revealed the following agreements. First, the yellow steric-disfavoured contour in Fig. 4A on the para position of the aniline moiety relative to the amine group can be related to the bulky side chain of F119. In other words, a modification on this corner would clash with F119. However, the green steric-favoured contour in Fig. 4A can be correlated with the empty space at the nearby C site. The red contour in Fig. 4B, which prefers a negatively charged modification, can be related to the basic side chain of H187, of which the closeness enhances the electrostatic attraction.
Fig. 7A shows superposed snapshots of the three SIRT–39 complexes, indicating the RMSD value for SIRT1–39 relative to SIRT2–39 to be 4.90 Å, that of SIRT3–39 relative to SIRT2–39 to be 6.01 Å, and that of SIRT1–39 relative to SIRT3–39 to be 4.45 Å. In contrast to the diverse small domains of the three SIRTs, the large domains among these three complexes align favourably. Fig. 7B shows a model of the SIRT1–39 complex, in which 39 uses its amino-oxygen atom to form a hydrogen bond with the amine-hydrogen atom of the backbone of R207, exhibiting 88% hydrogen bond occupancy in the entire 30 ns MD simulation. R207 is located at the beginning of α11 (analogous to SIRT2 P268). R207 and L179 (at the beginning of L4 and analogous to SIRT2 L239) reside at the substrate-binding entrance of the large domain. The binding pocket of SIRT1 is hydrophobic and is composed of several aromatic amino acid residues, including F175 (on L4 and analogous to SIRT2 F235), which stabilizes the aniline ring (with a separation distance of 3.96 Å between two ring centroids); Y41 (on α3 and analogous to SIRT2 Y104), which stabilizes the extended phenyl ring (with a separation distance of 9.00 Å between two ring centroids); F58 (on α4 and analogous to F119), which stabilizes both the aniline ring (with a separation distance of 7.38 Å between two ring centroids) and the extended phenyl ring (with a separation distance of 7.31 Å between two ring centroids); and F34 (on L1), which stabilizes the extended phenyl ring (with a separation distance of 4.99 Å between two ring moieties' centroids). These van der Waals interactions are provided by the upper region of SIRT1, except F34 which is from L1 on the lateral side, whereas the electrostatic interaction comes from the large domain. Table 3 lists the binding free energies calculated using the MM/GBSA approach. SIRT1 and SIRT2 hold almost the same van der Waals interactions toward 39 (−48.08 and −50.21 kcal mol−1 for SIRT1–39 and SIRT2–39, respectively), and SIRT1 carries a markedly higher electrostatic interaction (−14.48 vs. −1.57 kcal mol−1) because of the stable hydrogen bond of R207. However, a higher polar solvation instability at SIRT1–39, possibly caused by the reduced solvent accessibility of R207 and N178 upon SIRT1–39 formation, causes the ΔGbind of SIRT1–39 (−39.20 kcal mol−1) to be lower than that of SIRT2–39 (−43.05 kcal mol−1), confirming the experimentally determined IC50 values.
| ΔGvdw | ΔGele | ΔGpolar,sol | ΔGnonpol,sol | ΔGMM | ΔGsol | ΔGbind | IC50a | |
|---|---|---|---|---|---|---|---|---|
| a Experimentally observed inhibitory activities.52 | ||||||||
| SIRT1–39 | −47.067 | −15.093 | 30.016 | −5.814 | −62.159 | 24.202 | −37.957 | >300 |
| SIRT2–39 | −49.389 | −1.269 | 15.632 | −6.381 | −50.658 | 9.251 | −41.407 | 0.57 |
| SIRT3–39 | −41.330 | −7.462 | 21.116 | −5.482 | −48.791 | 15.635 | −33.157 | >300 |
The orientation of 39 in SIRT3–39, as shown in Fig. 7C, is similar to that in the other two complexes. The side chain amine hydrogen atom of Q109 (on the β2) forms a hydrogen bond with the amino-hydrogen atom of 39 with 58% occupancy in the last 10 ns in the whole 30 ns MD duration. Accordingly, the ΔGelec term of SIRT3–39 is between that of SIRT1–39 and SIRT2–39. F174 (on L4 and analogous to SIRT1 F174 and SIRT2 F234, even though these two residues do not face any ring of 39) is toward the extended phenyl ring (with a separation distance of 5.81 Å between two ring centroids), F61 (on the C-terminus of α4) toward the extended ring (with a separation distance of 4.79 Å between two ring centroids), and F38 (on L1) toward the extended ring (with a separation distance of 6.73 Å between two ring centroids). Overall, the electrostatic interactions come from the large domain, and the van der Waals interactions are either from the helical module or loops. Compared with the two aforementioned SIRT–39 complexes, 39 is more exposed to the solvent when binding to SIRT3, and therefore, its van der Waals contribution is the smallest, as shown in the ΔGvdW column. The ΔGbind for SIRT3–39 (−34.59 kcal mol−1) and SIRT2–39 (−43.05 kcal mol−1) correspond to their >300 and 0.57 μM IC50 values, as determined by Suzuki and colleagues.52
According to the structural and energetic analyses conducted in this study, SIRT1 binds to 39 more strongly than SIRT3 does, although both SIRT1–39 and SIRT3–39 exhibit inhibitory activities at concentrations >300 μM. Compared with the binding pocket in SIRT1 and SIRT2, the binding pocket in SIRT3 is larger and, thus, 39 is loosely bound therein. However, two hydrogen bonds, although in low hydrogen bond occupancies, form between SIRT3 and 39, and, therefore, any further modification on the same series of inhibitors should avoid these hydrogen bond formations to discriminate SIRT3.
Disch and colleagues recently identified a series of pan-SIRT inhibitors in a scaffold of thieno[3,2-d]pyrimidine-6-carboxamides exhibiting nanomolar inhibition potency toward SIRT1, SIRT2, and SIRT3.77 The crystal structure of SIRT3 bound with 11C as described by Disch suggests that such pan-SIRT inhibitors occupy a binding pocket that is similar to that used by the aniline and extended phenol moieties of 39 herein. Accordingly, the selectivity of the 2-anilinobenzamide series of SIRT2 inhibitors should rely on the modification of a benzoamide side that exhibits differential binding behaviours among SIRT1, SIRT2, and SIRT3.
Conclusion
This study applied CoMFA to investigate a series of 2-anilinobenzamide derivatives and, thus, determine the structural requirements essential to fit the NAD+ -dependent histone deacetylase SIRT2. In addition, molecular docking and MD simulations were used to investigate the binding modes of 39, which demonstrated a higher inhibitory potency for SIRT2 than for SIRT1 and SIRT3 in Suzuki's selectivity assay.52 As concluded in Fig. 8, the steric field generated by the CoMFA suggested that an extended modification rooted on the meta position of the aniline moiety can form π staking with the SIRT2 F119, whereas a para extension can conflict with F119, as indicated by the molecular docking result. The binding pocket in SIRT2 is mainly hydrophobic and encompassed by numerous aromatic amino acids (Y104, F119, F243, and F235) and aliphatic amino acids (L103, L134, L239, and V266). Moreover, a great portion of the benzamide plane is clamped by L239 and P268 located on α10 and α11. In summary, 39 is stabilized by the large domain and the helical module of SIRT2. By contrast, except for R207 from the large domain, which forms a hydrogen bond with 39, SIRT1 exhibits affinity toward 39 from the helical module. Regarding SIRT3, its binding pocket is slightly larger than those of SIRT1 and SIRT2 and accordingly exhibits the lowest affinity, as verified according to the ΔGbind term and a loosely binding mode in the structural analysis. Because both SIRT1 and SIRT3 exhibit the potential to form hydrogen bonds with 39, further modifications for enhancing the preference of 39 for SIRT2 should avoid hydrogen bond donors or acceptors oriented toward SIRT1 R207 and SIRT3 Q109. These computational results will benefit the further development of selective SIRT2 inhibitors.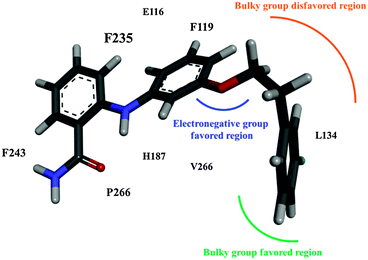 | ||
| Fig. 8 Concluding remarks of the CoMFA model for SIRT2 inhibitors with a 2-anilinobenzamide scaffold. | ||
Acknowledgements
This work was supported by the National Science Council of Taiwan (NSC 102-2113-M-390-007-MY2).Notes and references
- P. Hu, S. L. Wang and Y. K. Zhang, J. Am. Chem. Soc., 2008, 130, 16721–16728 CrossRef CAS PubMed.
- G. Blander and L. Guarente, Annu. Rev. Biochem., 2004, 73, 417–435 CrossRef CAS PubMed.
- R. Marmorstein, Biochem. Soc. Trans., 2004, 32, 904–909 CrossRef CAS PubMed.
- J. M. Denu, Curr. Opin. Chem. Biol., 2005, 9, 431–440 CrossRef CAS PubMed.
- C. W. Anthony A. Sauve, V. L. Schramm and J. D. Boek, Annu. Rev. Biochem., 2006, 75, 435–465 CrossRef PubMed.
- M. A. D. C. H. Westphal and L. Guarente, Trends Biochem. Sci., 2007, 32, 555–590 CrossRef PubMed.
- K. S. Hiroyasu Yamamoto and J. Auwerx, Mol. Endocrinol., 2007, 21, 1745–1755 CrossRef PubMed.
- D. A. S. Philipp Oberdoerffer, Nat. Rev. Mol. Cell Biol., 2007, 8, 692–702 CrossRef PubMed.
- D. Moazed, Curr. Opin. Cell Biol., 2001, 13, 232–238 CrossRef CAS.
- M. M. C. Susan and M. Gasser, Gene, 2001, 279, 1–16 CrossRef.
- S. Hekimi and L. Guarente, Science, 2003, 299, 1351–1354 CrossRef CAS PubMed.
- A. Brunet, L. B. Sweeney, J. F. Sturgill, K. F. Chua, P. L. Greer, Y. X. Lin, H. Tran, S. E. Ross, R. Mostoslavsky, H. Y. Cohen, L. S. Hu, H. L. Cheng, M. P. Jedrychowski, S. P. Gygi, D. A. Sinclair, F. W. Alt and M. E. Greenberg, Science, 2004, 303, 2011–2015 CrossRef CAS PubMed.
- M. C. Motta, N. Divecha, M. Lemieux, C. Kamel, D. Chen, W. Gu, Y. Bultsma, M. McBurney and L. Guarente, Cell, 2004, 116, 551–563 CrossRef CAS.
- V. J. Starai, H. Takahashi, J. D. Boeke and J. C. Escalante-Semerena, Curr. Opin. Microbiol., 2004, 7, 115–119 CrossRef CAS PubMed.
- S. Gottlieb and R. E. Esposito, Cell, 1989, 56, 771–776 CrossRef CAS.
- M. Kaeberlein, M. McVey and L. Guarente, Genes Dev., 1999, 13, 2570–2580 CrossRef CAS.
- S. J. Lin, P. A. Defossez and L. Guarente, Science, 2000, 289, 2126–2128 CrossRef CAS.
- J. Luo, A. Y. Nikolaev, S. Imai, D. Chen, F. Su, A. Shiloh, L. Guarente and W. Gu, Cell, 2001, 107, 137–148 CrossRef CAS.
- H. A. Tissenbaum and L. Guarente, Nature, 2001, 410, 227–230 CrossRef CAS PubMed.
- H. Vaziri, S. K. Dessain, E. Ng Eaton, S. I. Imai, R. A. Frye, T. K. Pandita, L. Guarente and R. A. Weinberg, Cell, 2001, 107, 149–159 CrossRef CAS.
- M. A. McMurray and D. E. Gottschling, Science, 2003, 301, 1908–1911 CrossRef CAS PubMed.
- M. Biel, V. Wascholowski and A. Giannis, Angew. Chem., Int. Ed., 2005, 44, 3186–3216 CrossRef CAS PubMed.
- B. Heltweg, T. Gatbonton, A. D. Schuler, J. Posakony, H. Li, S. Goehle, R. Kollipara, R. A. Depinho, Y. Gu, J. A. Simon and A. Bedalov, Cancer Res., 2006, 66, 4368–4377 CrossRef CAS PubMed.
- T. F. Outeiro, E. Kontopoulos, S. M. Altmann, I. Kufareva, K. E. Strathearn, A. M. Amore, C. B. Volk, M. M. Maxwell, J. C. Rochet, P. J. McLean, A. B. Young, R. Abagyan, M. B. Feany, B. T. Hyman and A. G. Kazantsev, Science, 2007, 317, 516–519 CrossRef CAS PubMed.
- Y. Itoh, T. Suzuki and N. Miyata, Curr. Pharm. Des., 2008, 14, 529–544 CrossRef CAS.
- J. C. Milne and J. M. Denu, Curr. Opin. Chem. Biol., 2008, 12, 11–17 CrossRef CAS PubMed.
- P. Moretti, K. Freeman, L. Coodly and D. Shore, Genes Dev., 1994, 8, 2257–2269 CrossRef CAS.
- A. Hecht, T. Laroche, S. Strahl-Bolsinger, S. M. Gasser and M. Grunstein, Cell, 1995, 80, 583–592 CrossRef CAS.
- A. Hecht, S. Strahl-Bolsinger and M. Grunstein, Nature, 1996, 383, 92–96 CrossRef CAS PubMed.
- D. Moazed, A. Kistler, A. Axelrod, J. Rine and A. D. Johnson, Proc. Natl. Acad. Sci. U. S. A., 1997, 94, 2186–2191 CrossRef CAS.
- S. Strahl-Bolsinger, A. Hecht, K. Luo and M. Grunstein, Genes Dev., 1997, 11, 83–93 CrossRef CAS.
- W. Shou, J. H. Seol, A. Shevchenko, C. Baskerville, D. Moazed, Z. W. Chen, J. Jang, H. Charbonneau and R. J. Deshaies, Cell, 1999, 97, 233–244 CrossRef CAS.
- A. F. Straight, W. Shou, G. J. Dowd, C. W. Turck, R. J. Deshaies, A. D. Johnson and D. Moazed, Cell, 1999, 97, 245–256 CrossRef CAS.
- E. Langley, M. Pearson, M. Faretta, U. M. Bauer, R. A. Frye, S. Minucci, P. G. Pelicci and T. Kouzarides, EMBO J., 2002, 21, 2383–2396 CrossRef CAS PubMed.
- E. Michishita, J. Y. Park, J. M. Burneskis, J. C. Barrett and I. Horikawa, Mol. Biol. Cell, 2005, 16, 4623–4635 CrossRef CAS PubMed.
- J. Smith, Trends Cell Biol., 2002, 12, 404–406 CrossRef CAS.
- B. J. North, B. L. Marshall, M. T. Borra, J. M. Denu and E. Verdin, Mol. Cell, 2003, 11, 437–444 CrossRef CAS.
- T. Inoue, M. Hiratsuka, M. Osaki and M. Oshimura, Cell Cycle, 2007, 6, 1011–1018 CrossRef CAS.
- T. Shi, F. Wang, E. Stieren and Q. Tong, J. Biol. Chem., 2005, 280, 13560–13567 CrossRef CAS PubMed.
- C. Argmann and J. Auwerx, Cell, 2006, 126, 837–839 CrossRef CAS PubMed.
- N. Ahuja, B. Schwer, S. Carobbio, D. Waltregny, B. J. North, V. Castronovo, P. Maechler and E. Verdin, J. Biol. Chem., 2007, 282, 33583–33592 CrossRef CAS PubMed.
- M. A. Holbert and R. Marmorstein, Curr. Opin. Struct. Biol., 2005, 15, 673–680 CrossRef CAS PubMed.
- C. Corminboeuf, P. Hu, M. E. Tuckerman and Y. Zhang, J. Am. Chem. Soc., 2006, 128, 4530–4531 CrossRef CAS PubMed.
- L. J. Juan, W. J. Shia, M. H. Chen, W. M. Yang, E. Seto, Y. S. Lin and C. W. Wu, J. Biol. Chem., 2000, 275, 20436–20443 CrossRef CAS PubMed.
- A. Ito, Y. Kawaguchi, C. H. Lai, J. J. Kovacs, Y. Higashimoto, E. Appella and T. P. Yao, EMBO J., 2002, 21, 6236–6245 CrossRef CAS PubMed.
- M. A. Glozak, N. Sengupta, X. Zhang and E. Seto, Gene, 2005, 363, 15–23 CrossRef CAS PubMed.
- S. Sakkiah, N. Krishnamoortthy, P. Gajendrarao, S. Thangapandian and Y. Lee, et al. , Bull. Korean Chem. Soc., 2009, 30, 1152–1156 CrossRef CAS.
- A. Vaquero, M. B. Scher, D. H. Lee, A. Sutton, H. L. Cheng, F. W. Alt, L. Serrano, R. Sternglanz and D. Reinberg, Genes Dev., 2006, 20, 1256–1261 CrossRef CAS PubMed.
- P. H. Kiviranta, J. Leppanen, V. M. Rinne, T. Suuronen, O. Kyrylenko, S. Kyrylenko, E. Kuusisto, A. J. Tervo, T. Jarvinen, A. Salminen, A. Poso and E. A. Wallen, Bioorg. Med. Chem. Lett., 2007, 17, 2448–2451 CrossRef CAS PubMed.
- P. H. Kiviranta, H. S. Salo, J. Leppanen, V. M. Rinne, S. Kyrylenko, E. Kuusisto, T. Suuronen, A. Salminen, A. Poso, M. Lahtela-Kakkonen and E. A. Wallen, Bioorg. Med. Chem., 2008, 16, 8054–8062 CrossRef CAS PubMed.
- J. Trapp, A. Jochum, R. Meier, L. Saunders, B. Marshall, C. Kunick, E. Verdin, P. Goekjian, W. Sippl and M. Jung, J. Med. Chem., 2006, 49, 7307–7316 CrossRef CAS PubMed.
- T. Suzuki, M. N. Khan, H. Sawada, E. Imai, Y. Itoh, K. Yamatsuta, N. Tokuda, J. Takeuchi, T. Seko, H. Nakagawa and N. Miyata, J. Med. Chem., 2012, 55, 5760–5773 CrossRef CAS PubMed.
- S. Karkola, A. Lilienkampf and K. Wahala, ChemMedChem, 2008, 3, 461–472 CrossRef CAS PubMed.
- D. Li, M. S. Liu, B. Ji, K. Hwang and Y. Huang, J. Chem. Phys., 2009, 130, 215102 CrossRef PubMed.
- R. T. Shenoy, S. F. Chowdhury, S. Kumar, L. Joseph, E. O. Purisima and J. Sivaraman, J. Med. Chem., 2009, 52, 6335–6346 CrossRef CAS PubMed.
- S. G. Estacio, R. Moreira and R. C. Guedes, J. Chem. Inf. Model., 2011, 51, 1690–1702 CrossRef CAS PubMed.
- Y. Yang, Y. Shen, H. Liu and X. Yao, J. Chem. Inf. Model., 2011, 51, 3235–3246 CrossRef CAS PubMed.
- R. D. Cramer, D. E. Patterson and J. D. Bunce, J. Am. Chem. Soc., 1988, 110, 5959–5967 CrossRef CAS PubMed.
- A. Onufriev, D. Bashford and D. A. Case, Proteins, 2004, 55, 383–394 CrossRef CAS PubMed.
- Sybyl 8.1, Tripos International, St. Louis Search PubMed.
- D. A. Case, T. A. Darden, T. E. Cheatham I, C. L. Simmerling, J. Wang, R. E. Duke, R. Luo, R. C. Walker, W. Zhang, K. M. Merz, B. Roberts, B. Wang, S. Hayik, A. Roitberg, G. Seabra, I. Kolossváry, K. F. Wong, F. Paesani, J. Vanicek, J. Liu, X. Wu, S. R. Brozell, T. Steinbrecher, H. Gohlke, Q. Cai, X. Ye, J. Wang, M.-J. Hsieh, G. Cui, D. R. Roe, D. H. Mathews, M. G. Seetin, C. Sagui, V. Babin, T. Luchko, S. Gusarov, A. Kovalenko and P. A. Kollman, AMBER, 11, University of California, San Francisco, 2010 Search PubMed.
- Y. Duan, C. Wu, S. Chowdhury, M. C. Lee, G. Xiong, W. Zhang, R. Yang, P. Cieplak, R. Luo, T. Lee, J. Caldwell, J. Wang and P. Kollman, J. Comput. Chem., 2003, 24, 1999–2012 CrossRef CAS PubMed.
- V. Hornak, R. Abel, A. Okur, B. Strockbine, A. Roitberg and C. Simmerling, Proteins, 2006, 65, 712–725 CrossRef CAS PubMed.
- X. Zhao, D. Allison, B. Condon, F. Zhang, T. Gheyi, A. Zhang, S. Ashok, M. Russell, I. MacEwan, Y. Qian, J. A. Jamison and J. G. Luz, J. Med. Chem., 2013, 56, 963–969 CrossRef CAS PubMed.
- S. Moniot, M. Schutkowski and C. Steegborn, J. Struct. Biol., 2013, 182, 136–143 CrossRef CAS PubMed.
- G. T. Nguyen, S. Schaefer, M. Gertz, M. Weyand and C. Steegborn, Acta Crystallogr., Sect. D: Biol. Crystallogr., 2013, 69, 1423–1432 CAS.
- Discovery Studio Modeling Environment, Accelrys Software Inc, 2012 Search PubMed.
- S. N. Rao, M. S. Head, A. Kulkarni and J. M. LaLonde, J. Chem. Inf. Model., 2007, 47, 2159–2171 CrossRef CAS PubMed.
- J. Wang, W. Wang, P. A. Kollman and D. A. Case, J. Mol. Graphics Modell., 2006, 25, 247–260 CrossRef CAS PubMed.
- A. Jakalian, D. B. Jack and C. I. Bayly, J. Comput. Chem., 2002, 23, 1623–1641 CrossRef CAS PubMed.
- J. C. William L. Jorgensen, J. D. Madura, R. W. Impey and M. L. Klein, J. Chem. Phys., 1983, 79, 926 CrossRef PubMed.
- T. Darden, D. Y ork and L. Pedersen, J. Chem. Phys., 1993, 98, 10089 CrossRef CAS PubMed.
- G. C. Jean-Paul Ryckaert and H. J. C. Berendsen, J. Comput. Phys., 1977, 23, 327–341 CrossRef.
- S. Moniot, M. Schutkowski and C. Steegborn, J. Struct. Biol., 2013, 182, 136–143 CrossRef CAS PubMed.
- M. S. Finnin, J. R. Donigian and N. P. Pavletich, Nat. Struct. Biol., 2001, 8, 621–625 CrossRef CAS PubMed.
- R. N. Dutnall and L. Pillus, Cell, 2001, 105, 161–164 CrossRef CAS.
- J. S. Disch, G. Evindar, C. H. Chiu, C. A. Blum, H. Dai, L. Jin, E. Schuman, K. E. Lind, S. L. Belyanskaya, J. Deng, F. Coppo, L. Aquilani, T. L. Graybill, J. W. Cuozzo, S. Lavu, C. Mao, G. P. Vlasuk and R. B. Perni, J. Med. Chem., 2013, 56, 3666–3679 CrossRef CAS PubMed.
Footnote |
| † Electronic supplementary information (ESI) available: Tables S1, S2 and Fig. S1. See DOI: 10.1039/c4mb00620h |
| This journal is © The Royal Society of Chemistry 2015 |


![[double bond, length as m-dash]](https://www.rsc.org/images/entities/char_e001.gif) CHCOOMe-Ph
CHCOOMe-Ph


