 Open Access Article
Creative Commons Attribution 3.0 Unported Licence
Temperature-controlled MPa-pressure ultrasonic cell manipulation in a microfluidic chip†
Mathias
Ohlin
,
Ida
Iranmanesh
,
Athanasia E.
Christakou
and
Martin
Wiklund
*
Dept. of Applied Physics, Royal Institute of Technology, KTH-Albanova, SE-106 91 Stockholm, Sweden. E-mail: martin.wiklund@biox.kth.se
First published on 29th June 2015
Abstract
We study the temperature-independent impact on cell viability of relevant physical parameters during long-term, high-acoustic-pressure ultrasonic exposure in a microfluidic chip designed for ultrasonic-standing-wave trapping and aggregation of cells. We use a light-intensity method and 5 μm polymer beads for accurate acoustic pressure calibration before injecting cells into the device, and we monitor the viability of A549 lung cancer cells trapped during one hour in an ultrasonic standing wave with 1 MPa pressure amplitude. The microfluidic chip is actuated by a novel temperature-controlled ultrasonic transducer capable of keeping the temperature stable around 37 °C with an accuracy better than ±0.2 °C, independently on the ultrasonic power and heat produced by the system, thereby decoupling any temperature effect from other relevant effects on cells caused by the high-pressure acoustic field. We demonstrate that frequency-modulated ultrasonic actuation can produce acoustic pressures of equally high magnitudes as with single-frequency actuation, and we show that A549 lung cancer cells can be exposed to 1 MPa standing-wave acoustic pressure amplitudes for one hour without compromising cell viability. At this pressure level, we also measure the acoustic streaming induced around the trapped cell aggregate, and conclude that cell viability is not affected by streaming velocities of the order of 100 μm s−1. Our results are important when implementing acoustophoresis methods in various clinical and biomedical applications.
Introduction
Microchannel acoustophoresis is an attractive method for the manipulation of cells into the pressure nodes of standing-wave fields inside miniature fluid cavities.1 The method has been used for, e.g., continuous separation of cells based on size,2 exchange of the liquid medium where the cells are suspended,3 trapping and up-concentration of cells4 and studies of cell–cell interactions.5 While many of the past studies of microscale acoustophoresis focused on the design of the technology,6 more recent studies have implemented the method into real biological and clinical applications.5,7–11 Of outmost importance for this transition from technology design to biomedical use is to define guidelines for the safe operation of ultrasound without damaging cells or their biological functions.12 We have previously demonstrated that the proliferation rate of cells trapped and exposed to standing-wave ultrasound continuously for up to 75 minutes at moderate pressure levels is not affected by the ultrasound.13 This study was later extended to three days of continuous exposure with similar results, but without any accurate pressure estimation.14 Li et al. demonstrated an acoustophoresis-driven perfusion micro-bioreactor for cartilage tissue engineering, where the cartilages were kept viable when exposed to ultrasound at approx. 170 kPa pressure amplitude continuously for 21 days.10 Burguillos et al. focused not only on viability but they also studied whether microchannel acoustophoresis had any impact on the functions of different cell types.7 They concluded that flow-through acoustophoresis did not alter any biological function of the investigated cells even at high pressure amplitudes (~1 MPa), but at relatively short exposure times (of the order of seconds). Another study by Christakou et al. demonstrated that prolonged ultrasound exposure (several hours) at similar pressure levels as in the study of Li et al. did not interfere with functions of immune cells, e.g., the ability of natural killer cells to form immune synapses and to lyse cancer cells.5 In contrast, in a study by Ankrett et al., a 60% reduction in cell viability was observed at high ultrasonic actuation voltages causing significant Rayleigh-type acoustic streaming velocity close to the trapped cells and potentially onset of cavitation.15 Common for most of these studies is that the acoustic pressure has not been accurately measured; it was only roughly estimated or not defined at all. In some cases,5,14 the authors solely specify the transducer actuation voltage, which is of limited importance since the achieved acoustic pressure per actuation voltage can vary greatly between different devices. In addition, potentially damaging indirect effects of ultrasound such as temperature and micro-streaming have not been accurately monitored or controlled during these experiments.When summarizing the reports on cell viability in microchannel acoustophoresis, we may conclude that cells can be trapped by MHz-frequency ultrasound for very long times at a few hundred kPa pressure amplitudes, if the temperature is controlled and if the cells are kept under normal culture conditions.5,10,14 Cells can also under certain circumstances survive high acoustic pressure amplitudes exceeding 1 MPa for short times.7 However, it would be useful to investigate whether cells can survive both high pressures and longer exposure times, where the acoustic pressure is accurately measured in situ, and where any temperature effect is decoupled from the direct acoustic effects. In order to answer this question, we have in the present study designed an acoustophoresis microdevice capable of stable and long-term ultrasonic standing-wave operation at 1 MPa pressure amplitude. This pressure amplitude is about one order of magnitude higher than needed in most acoustophoresis applications. The system has a built-in calibration function for initial pressure measurement before cell injection, and a temperature control system integrated in the transducer capable of regulating the temperature around any preferred setpoint value independently on the ultrasound power produced. The pressure calibration is performed using a light-intensity method previously developed in our group together with Barnkob and Bruus.16 We monitor the viability of lung cancer cells trapped and exposed to 1 MPa pressure amplitudes at 2.5 MHz during one hour. We compare the average acoustic pressure amplitudes obtained with frequency-modulation actuation17 and single-frequency actuation. We also measure the velocities of the Rayleigh-type acoustic streaming around the trapped cell aggregates by particle image velocimetry and particle motion tracking. We conclude that our previously used method for robust and uniform cell manipulation based on frequency modulation17 can be used for robust, long-term, MPa-pressure acoustophoresis, and that the cell viability is not compromised at this pressure during one hour of continuous ultrasound exposure as long as the temperature is carefully controlled and the fluid streaming velocity close to the cells is moderate. In addition, we conclude that the viability of ultrasound-trapped cells is not compromised by MPa-pressure ultrasound for up to one hour at maintained physiological temperature. Our results are important for the design and use of acoustophoresis micro-devices for long-term cell handling, and confirm that standing-wave ultrasound is a suitable cell manipulation technology for clinical applications even at high pressure amplitudes.
Materials and methods
Cell line, culture and labeling
In this work we used the human lung cancer cell line A549 (adenocarcinoma human alveolar basal epithelial cells), which are adherent cells with average size 10 μm. The cells were cultured in RPMI-1640 (SH30027, Thermo Scientific, USA) supplemented with 10% bovine serum (SV30160, Thermo Scientific, USA), and 100 U ml−1 penicillin-100 mg ml−1 streptomycin, 1× non-essential amino acids and 1 mM sodium pyruvate. After two days of culture, the cells were trypsinized and washed using centrifugation (300 × g for 3 minutes). Two fluorescent probes were used, calcein green AM (Invitrogen, Carlsbad, CA, USA) as a viability probe and far red DDAO-SE (Invitrogen, Carlsbad, CA, USA) as a probe for cell death (remaining dye when calcein leaks out after membrane disruption). The cells were incubated for 30 minutes in 1 μM of far red DDAO-SE and 0.25 μM of calcein green AM in RPMI-1640 at 37 °C. The cells were then washed again and finally diluted in 2.5 mL of DPBS/modified buffer (Thermo Scientific, USA) at 37 °C before injected in the microchannel.Temperature controlled ultrasonic transducer and microfluidic chip
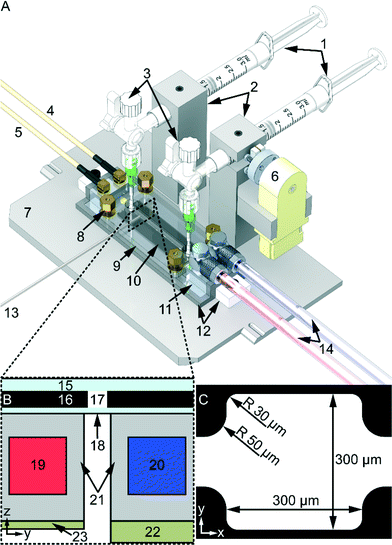
The device, illustrated in Fig. 1, consists of a microfluidic chip, described more in detail in ref. 18, combined with a novel in-house built temperature regulated dual-piezo-actuator ultrasonic transducer. The chip is optimized for trans-illumination (cf.Fig. 1B) live-cell microscopy with continuous ultrasound exposure and with active temperature regulation. It has a rectangular cell trapping chamber in the center with dimensions 300 × 300 × 110 μm3, and connecting inlet- and outlet channels with cross sections 110 × 110 μm2, cf.Fig. 1C. The temperature-regulated ultrasonic transducer consists of one piezo-actuator (60 × 10 mm2, 2.5 MHz, material 840, APC International Ltd, USA) designed for cell trapping (cf.Fig. 1B-8) in the rectangular chamber (Fig. 1C), and another piezo-actuator (60 × 10 mm2, 6.8 MHz material 840, APC International Ltd, USA) designed for levitation of trapped cells (cf.Fig. 1B-9), The frequencies (2.5 MHz and 6.8 MHz) are selected to match a half wavelength (λ/2) in the y- (300 μm) and z- (110 μm) directions, respectively (cf.Fig. 1C). However, only the 2.5 MHz trapping piezo-actuator was used in this work since we used a one dimensional pressure calibration method.16 The microfluidic chip is connected to the two 3 ml syringes (Plastipak, BD, USA) via silicon tubing (760070-05 Versilic, Saint-Gobain, France), Tygon tubing (AAQ04127, Saint-Gobain, France), 18G stainless steel dispensing tip (PT-025-18, Drifton, Denmark) and a 4-way stopcock valve with luer connections (EW-30600-04, Cole-Parmer, USA) (cf.Fig. 1A-3). To prevent sedimentation of the particle samples (cf. “Tracer particles and cell sample loading” below) the device is fitted with an in-house built motorized magnet stirrer with a PFTE magnetic stirrer bar (cat. no. 137103, Brand, Germany) inside the injection syringe. However, no magnetic stirring was used for the cell samples (see “Tracer particles and cell sample loading” below). To regulate the temperature on the microfluidic chip the device is connected to an in-house built temperature control system via a liquid-loop.11 The temperature was monitored by two type-T thermocouple micro probes (IT-21, Physitemp Instruments, USA) connected to a data logger (RDXL4SD, Omega Engineering, USA) and to the temperature control system's PID unit (KT4, Panasonic, Japan). To maximize heat conduction a heat sink compound was used (White Ice 510FG, Timtronics, USA) between thermocouples and the microfluidic chip glass surface. Furthermore, to ensure good coupling of ultrasound between the chip and the transducer a thin layer of oil was used (Immersol 518 F, Zeiss, Germany) together with a PMMA manifold (cf.Fig. 1A-9) pressing down the chip against the matching layer (cf.Fig. 1A-11). To adjust the pressure exerted by the manifold to the microfluidic chip four compression springs (stock. no. 20950, Sodemann Industrial Springs, Denmark) with nuts were placed in each corner of the manifold.Ultrasonic actuation method
The transducer was actuated by a signal generator (DS345, Stanford, USA) and RF amplifier (75A250, Amplifier Research, USA). In this work, two different actuation methods were used for achieving a robust and uniform two-dimensional (2D) acoustic force field in the trapping chamber in the microfluidic chip: a frequency modulation method as described previously,17 and single frequency actuation. For frequency-modulation (FM) actuation, the selected center frequency was 2.53 MHz, and the frequency was cycled linearly in 100 kHz wide bands around the center frequency at the rate 1 kHz. For single frequency (SF) actuation, we used the same frequency as the center frequency of FM actuation (2.53 MHz). The applied voltage to the piezo-actuator for cell trapping was adjusted so the energy density was of the order of 100 J m−3 (measured with the light-intensity method16). Furthermore, both piezo-actuators (trapping and levitation) were characterized by admittance analysis using an impedance analyzer (Z-Check 16777k, Sinephase, Austria), see Fig. 1A-8 and 9. Hence, both the resonance frequencies and Q-factors of the piezo-actuators were calculated from electrical impedance measurements, and were used as starting values before manual fine tuning of the driving frequency based on experimental observations.Tracer particles and cell loading
In this work we used three types of particles for different purposes: 1 μm particles as flow tracers for measuring acoustic streaming; 5 μm particles for calibrating the acoustic pressure amplitude; and 10 μm particles (having the same size as the A549 cells) as cell models in the acoustic streaming measurements. The 1 μm particles and the 10 μm particles were fluorescent (red- and green-fluorescent polystyrene, respectively, Fluoro-Max, Fisher Scientific, USA) and the 5 μm beads were non-fluorescent (EU-DFS-BMF-ver.1 for Flow Doppler Phantoms, Danish Phantom Design, Denmark) containing polyamide Orgasol Powders (Arkema, France). The concentrations were (1.27 × 10⁸ ± 2.4 × 10⁶) ml−1 for the 5 μm particles and (6.48 × 10⁸ ± 1.1 × 10⁷) ml−1 and (3.47 × 10⁴ ± 1.6 × 10³) ml−1 for the 1 μm and 10 μm particles, respectively, measured with a Coulter Counter. All particles were suspended in Milli-Q water (with 0.01% Tween20). The calcein green AM and far red DDAO-SE labeled A549 cells were suspended in 2.5 ml DPBS buffer with concentrations, measured with a hemocytometer (“Bürker chamber”), of (1.93 × 10⁶ ± 4.2 × 10⁵) ml−1 and (4.1 × 10⁶ ± 5.5 × 10⁵) ml−1 for the control and ultrasound exposure experiment (cf. “Results and discussion” below), respectively. Before loading the cell sample, the chip was cleaned with filtered (Syringe filter 0.2 μm PFTE (N.A. PN: 28145-495), VWR, USA) 99.6% ethanol, Milli-Q water and finally flushed with several ml of filtered (Sterile syringe filter 0.2 μm (N.A. PN: 28145-501), VWR, USA) DPBS buffer. Before and after each cell experiment the cells in the chip were trypsinized followed by flushing the chip with DPBS buffer repeatedly to remove any cell debris.Microscopy and image analysis
Fluorescent and bright-field images were acquired with an inverted microscope (Axiovert 40 CFL, Zeiss, Germany) equipped with a CCD camera (AxioCam HsC, Zeiss, Germany) and an objective with long working distance (LMPlanFL 20×/0.40, WD = 12 mm, Olympus, Japan) together with AxioVision Rel. 4.8 software. The acquired images were processed in ImageJ19 using thresholding, contrast and brightness, and color filtering (e.g. isolating red channel when using red fluorescent beads). The processed bright-field images were used to measure the energy density in the trapping chamber using the light-intensity method16 and the acoustic pressure amplitude was calculated from the measured acoustic energy density20 using the material parameters in Table 1. The size of each trapped particle aggregate was calculated by implementing MATLAB (R2012b, MathWorks Inc.) functions for boundary tracing. In both energy density measurements and aggregate size measurements, we used 5 μm particles. The processed fluorescent images were used for quantifying the acoustic streaming in the trapping chamber using the free micro-particle-image-velocimetry (μPIV) toolbox for MATLAB.21 Furthermore, manual particle tracking was also performed using the video analysis tool Tracker 4.87 (ref. 22) to verify the acoustic streaming results from μPIV, in particular in regions with streaming in the plane perpendicular to the microscope image plane. The cell viability was quantified by two complementary methods: manual counting of green- and red-labeled cells using fluorescence microscopy, and morphology analysis using bright-field microscopy. The latter method was used as a second opinion in high cell density images.| Density, water23 | 994 kg m−3 |
| Density, polyamide16 | 1030 kg m−3 |
| Speed of sound, water23 | 1522 m s−1 |
| Speed of sound, polyamide16 | 2660 m s−1 |
| Dynamic viscosity, water23 | 0.698 mPa s |
| Mean-diameter, polyamide beads16 | (4.5 ± 0.7) μm |
| Compressibility (1/ρc2), water23 | 435 TPa−1 |
| Compressibility (1/ρc2), polyamide16 | 137 TPa−1 |
| Contrast factor water/polyamide20 | 0.24 |
Experimental procedure
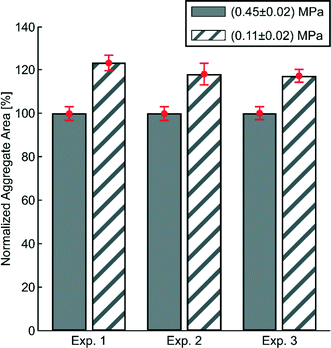
Three particle experiments were performed: (1) quantification of acoustic energy density and acoustic pressure amplitude inside the trapping chamber, (2) quantification of particle aggregate size in the chamber at different levels of ultrasonic actuation voltages, and (3) qualitative and quantitative mapping of the acoustic streaming in the chamber using μPIV. In experiments (1) and (2), 5 μm polyamide particles were used and in experiment (3) fluorescent 1 μm and 10 μm beads were used. The energy density and pressure amplitude were quantified with the 5 μm particles before starting the streaming experiments and the cell viability experiments in order to obtain the same level of acoustic pressure throughout the different experiments. In experiment (1), 22 and 21 repetitions for FM and SF actuation were performed, respectively. The CCD camera was set to record images at 60 frames per second and each repetition lasted 5 seconds generating in total 300 images per repetition. These 300 images per repetition were cropped in ImageJ and the initial frames before the ultrasound was turned on were discarded. The remaining images (approx. 250) were analyzed using the light-intensity method16 to calculate energy density. The energy density was then used to calculate the acoustic pressure in the trapping chamber. Between each repetition the microfluidic chip was flushed with new polyamide bead solution from the reservoir in the injection syringe in order to have the same initial concentration and conditions in the chamber for each repetition. Between repetitions the motorized magnetic stirrer was turned on to prevent sedimentation of particles in the syringe. In experiment (2), three repetitions of the same experiment were performed. Each repetition lasted in total 10 min with continuous FM actuation, 5 min with (0.45 ± 0.02) MPa and 5 min with 25% of (0.45 ± 0.02) MPa, i.e. (0.11 ± 0.02) MPa. The CCD camera was set to record one image every second compared to other experiments were the camera was set to record at maximum frame rate, i.e. 60 frames per second. Secondly, these 600 generated images (10 min at 1 frame per second) were cropped and thresholded in ImageJ to mark the boundary of the trapped particle aggregate in the chamber. Finally, the images were analyzed in MATLAB to trace the boundary of the aggregate and calculate the area of the aggregate. To prevent errors the first 100 images were discarded as the trapping motion when the ultrasound was turned on is not of interest, with the same reasoning the 100 images after the actuation voltage had been changed to 25% were also discarded. In total, 200 images for (0.45 ± 0.02) MPa and 200 images for (0.11 ± 0.02) MPa were analyzed. In experiment (3) the CCD camera was set to record at approx. 60 frames per second. For each actuation method, FM and SF, 400 images were generated (approx. 6.6 seconds of continuous ultrasound exposure). For both methods, μPIV was performed on each set of 400 images generating an average μPIV-vector-plot.Three cell experiments were performed. In the first two experiments we quantified the cell viability in the microfluidic chip with and without continuous ultrasound exposure during one hour. In the third cell experiment we formed a cell aggregate during one minute of ultrasound exposure, follow by 59 minutes with ultrasound turned off. Before starting the cell experiment with ultrasound on, the energy density was calibrated with the 5 μm particles and adjusted to the same level as for the acoustic streaming experiment. After one hour, both fluorescent and bright-field microscope images were acquired. For the control experiment (no ultrasound) the entire microfluidic chip was screened as for the two ultrasound experiments only the trapping chamber was screened since we only characterized the acoustic pressure and acoustic streaming inside the chamber.
Finally, the temperature on the microfluidic chip was measured over time for different operational conditions of continuous ultrasound actuation. For the experiment without active regulation one experiment started from room temperature and the other from the selected setpoint temperature. The temperature was logged every second (for all experiments in this paper) using the data logger connected to one of the thermocouples in contact with the top glass layer of the chip (cf.Fig. 1A-13).
Lastly, all experiments were performed with no flow (i.e. with closed valves, cf.Fig. 1A-3).
Results and discussion
Acoustic energy density and acoustic pressure in the trapping chamber
In a previous study not using temperature regulation, it was not fully clear whether frequency-modulated (FM) actuation could produce equally high pressure amplitudes in a microchannel as with single-frequency (SF) actuation.24 For this reason, the acoustic energy densities and corresponding acoustic pressure amplitudes for two types of ultrasonic actuation schemes (FM and SF) were measured in the trapping chamber with the light-intensity method,16 see Fig. 2. As seen in the diagram, there is no significant difference between FM and SF actuation in the energy density or acoustic pressure in the trapping chamber, and both methods are suitable for high-pressure acoustophoresis (0.94 ± 0.06 MPa and 0.93 ± 0.06 MPa for FM and SF actuation, respectively). For the rather complex type of temperature-regulated transducer used in this work, we achieved a Q-factor of (9 ± 0.004) at the resonance frequency of 2.52 ± 0.02 MHz. Thus, with such a broadbanded transducer, there is little difference between FM and SF actuation. Furthermore, with active temperature control, both actuation methods provide stable and robust operation over time. However, although the pressure levels are similar, FM actuation is preferred if a uniform and symmetric acoustic radiation force field is needed for trapping the cells.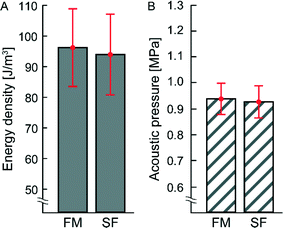 | ||
| Fig. 2 (A) Energy density and (B) acoustic pressure amplitude inside the trapping chamber measured with the light-intensity method16 for frequency-modulation (FM) and single frequency (SF) actuation. The respective mean values with corresponding standard deviations (±σ) are shown in red. For FM actuation the average energy density and acoustic pressure are 96.3 ± 12.8 J m−3 and 0.94 ± 0.06 MPa, respectively. For SF actuation the average energy density and acoustic pressure are 94.2 ± 13.2 J m−3 and 0.93 ± 0.06 MPa, respectively. The temperature was actively regulated during both measurements (36.4 ± 0.2 °C). | ||
Temperature control at different regulation schemes
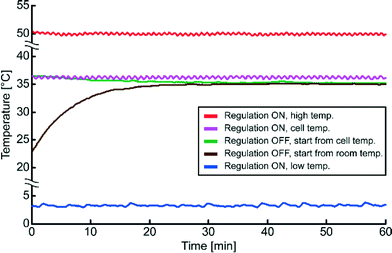
Different temperature regulation schemes were investigated with continuous ultrasound actuation, see Fig. 3. The device was tested with setpoint temperatures within a relatively large temperature interval, from 3 °C to 50 °C, with stable temperature regulation within ±0.2 °C for any setpoint temperature in this interval and for any produced energy density up to approx. 100 J m−3. To maintain a physiological temperature for the cells (37 °C ± 1 °C), independently on the ultrasound actuation voltage, the device is set to regulate around 36.0–36.5 °C (see Fig. 2 magenta colored curve). We also investigated the temperature during transducer operation without active regulation (see Fig. 3). This passive regulation scheme has been described previously.24 The design of the present device permits operations <37 °C for approx. pressure levels of 0.9 MPa without active temperature regulation. Without active temperature regulation the temperature of the device with continuous ultrasound actuation stabilize around 35 °C. However, the final temperature is dependent on the room temperature which at the time was 23 °C and on the actuation voltage of the transducer. On the contrary, with active temperature regulation the final temperature of the device is not dependent on the room temperature nor on the actuation voltage. For this reason we used active temperature regulation in all experiments.Size of particle aggregate for different actuation voltages
The acoustic pressure needed for trapping and aggregating cells is typically much smaller than the pressure levels investigated in this work. In order to demonstrate this, we measured the dependence of aggregate size (using 5 μm particles) on the transducer actuation voltage for two different acoustic pressure amplitudes: (0.45 ± 0.02) MPa and (0.11 ± 0.02) MPa, see Fig. 4. As seen in the diagram, decreasing the voltage by 75% (from 0.45 MPa to 0.11 MPa) causes the particle aggregate to increase in size on average by 20%. This suggests that once the particles/cells are trapped, the actuation voltage, and hence the acoustic pressure, can be lowered and still maintaining sufficient trapping. However, if a more compact aggregate is needed, higher acoustic pressures can be used.Acoustic streaming in the trapping chamber
As mentioned in the introduction, it is relevant for the biocompatibility to measure the amount of acoustic streaming around trapped cells. If the acoustic streaming velocity is too high, the fluid may shear and disrupt the cell membranes.10,12 Here, the acoustic streaming was characterized both quantitatively (Fig. 5A and B) and qualitatively (Fig. 5C and D) for the two actuation methods, FM and SF. The pattern of acoustic streaming in the chamber consists of three sets of streaming vortices, four vortices in each set. The in-plane (cf. the horizontal xy-plane in Fig. 5A and B) acoustic streaming is quantified by μPIV. Here the streaming speed in the central parts of the chamber is underestimated by approx. a factor of 10 because of the vertically oriented vortices (cf. green vortices in Fig. 5C and D). Hence, the 1 μm particles appear to move in two opposite directions, causing artefacts with μPIV (see Video S1 and S2†). To correct for these artefacts, we performed manual particle tracking in this region (Video S2†). Thus, the maximum streaming velocities after correction was on average 120 μm s−1 (vertical streaming vortices, cf. Video S2†) and 80 μm s−1 (horizontal streaming vortices, cf.Fig. 5). In future, acoustic streaming measurements in our device can be improved by the use of more advanced 3D μPIV.26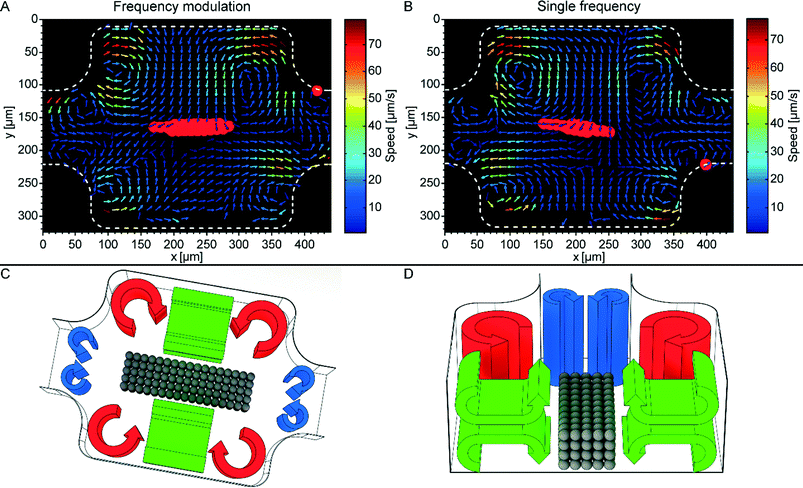 | ||
| Fig. 5 Quantitative (A and B) and qualitative (C and D) description of the acoustic streaming in the micro-box-cage. (A): Micro-particle-image-velocimetry (μPIV) of the acoustic streaming when implementing frequency-modulated (FM) ultrasound (2.53 MHz, span 0.1 MHz, and a rate of 1 kHz, acoustic pressure amplitude 0.87 ± 0.02 MPa). (B): μPIV of the acoustic streaming at single frequency (SF) ultrasound (2.53 MHz and acoustic pressure amplitude 0.87 ± 0.02 MPa). The red colored regions in (A) and (B) indicates where the larger 10 μm beads are trapped. (C): Sketch of the three different types of acoustic streaming in the trapping chamber: standard Rayleigh boundary streaming (red), smaller Rayleigh streaming located at the transitions to the inlet and outlet channel of the chamber (blue), and finally vertical Rayleigh streaming (green). The qualitative description of the acoustic streaming is verified in Video S1.† (D): Cross section view of (C) giving a more detailed view of the vertical streaming vortices (green). The gray colored spheres in (C) and (D) represent a trapped particle aggregate. | ||
Interestingly, the smaller streaming vortices located at the inlet and outlet of the chamber (cf. blue vortices Fig. 5C and D) counteracts the larger in-plane vortices (cf. red vortices Fig. 5C and D). This special feature of the trapping chamber is beneficial for retaining the trapped aggregate during fluid flow, since the smaller streaming vortices along the centerline of the chamber have the same direction as the acoustic radiation forces, causing an inward particle motion into the chamber (cf. Video S3†). This is opposite to the standard Rayleigh streaming orientation that typically counteracts the radiation forces in the pressure nodal plane and causes an outward particle motion.27
Cell viability after one hour of continuous ultrasound exposure
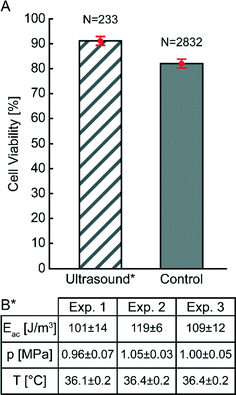
After careful characterization of the acoustic energy density, acoustic pressure amplitude, temperature and acoustic streaming velocity, we investigated the viability of cells trapped at high acoustic pressures during one hour (see Fig. 6 and 7). The diagram in Fig. 6 compares the viability of A549 cells after one hour of continuous ultrasound exposure, with a control experiment without ultrasound turned on. The classification of live and dead cells was based on counting of green and red cells from fluorescence microscope images of A549 cells labelled with calcein (live) and DDAO-SE (dead), respectively (see Fig. 7). Before starting the cell experiments, the energy density and acoustic pressure were measured with 5 μm particles and the light-intensity method,16 and both experiments were performed with active temperature regulation. We note that the viability of ultrasound-exposed cells was 91% ± 2%, compared to 82% ± 2% for the control without ultrasound. For the short (~1 min) ultrasound exposure experiment the cell viability was 91% ± 4% (N = 203) and with an average acoustic energy density of (68 ± 4) J m−3 after one hour. Thus, applying ultrasound at 1 MPa does not compromise the cell viability. The lower cell viability for the control experiment where cells were not aggregated by ultrasound can be justified for example by the distinctness of quantifying non-aggregated cells comparing to clustered cells. However, the lower viability of the control cells was also observed in a previous study of the growth rate of ultrasound-trapped COS-7 cells,13 suggesting that the cell–cell interaction initiated by the ultrasound is beneficial for both the viability and the growth rate of adherent cells, in particular when using low cell concentrations resulting in few spontaneous cell–cell contacts for the control cells (cf.Fig. 7B). This is confirmed by the two experiments using long and short term ultrasound exposure.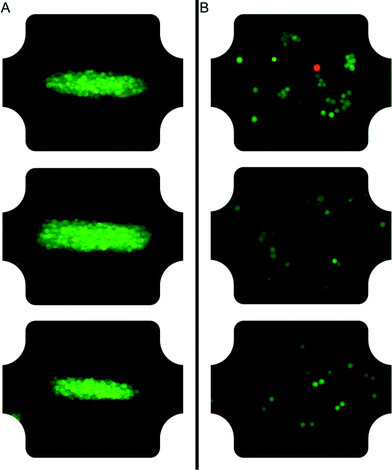 | ||
| Fig. 7 Microscope images of A549 cells after one hour in the chamber with ultrasound on (A) and ultrasound off (B). Series of such images were quantified in Fig. 6. The A549 cells are labeled with calcein green AM and far red DDAO-SE, where live cells are green and dead cells red. | ||
The most important physical factors for the biocompatibility of ultrasonic standing wave manipulation devices are (i): stable physiological temperature, (ii): prevention of cavitation, and (iii): limited fluid velocity around the cells. In this paper, we controlled the temperature and measured the fluid velocity. The last factor, cavitation, is more difficult to measure directly. However, if cavitation occurs the cell viability would definitely be affected negatively. Therefore, we can exclude any cavitation activity in our experiments. Typically, the pressure threshold at 2.5 MHz for the onset of cavitation is above 1 MPa in bubble-free fluids.28 Furthermore, if cavitation still would occur, it will most likely start in the pressure antinodes close to the chamber walls instead of in the pressure nodes where the cells are trapped. This means that the radiation force bringing the cells to the pressure nodes provides a protective effect on cells in standing waves.29
The choice of performing all experiments in this study around 1 MPa pressure amplitude was based on limitations in the pressure calibration method.16 This method needs to resolve the motion of particles into the pressure node, and currently, our camera is limited to 60 frames per second. Therefore, we were not able to determine any pressure threshold above 1 MPa causing cell damage. On the other hand, 1 MPa pressure amplitude is beyond what is needed in most acoustic cell trapping applications. In summary, our study confirms the high biocompatibility extending the safe range of MHz-frequency acoustophoresis to high pressures (1 MPa) and long continuous durations (1 hour), which is important for the implementation of acoustophoresis in clinical and biomedical applications. However, this conclusion is valid for the examined cells in this study (A549 lung cancer cells). The result achieved in this study should not be mistaken for a guarantee that cell damage in general can never happen at 1 MPa and 1 hour. If other cells are used, in particular primary cells, the cell viability and cell function during a certain acoustic exposure scheme needs to be investigated for each cell type and each application.
Conclusion
We have demonstrated that A549 lung cancer cells can be trapped in an ultrasonic standing wave with pressure amplitude 1 MPa and frequency 2.5 MHz during at least one hour without any noticeable reduction in cell viability. This result is valid for a fully temperature-controlled system where the temperature is kept within the interval 36.2–36.4 °C, and with a long-term stability better than ±0.2 °C. Furthermore, the result is also valid for a trapped cell aggregate exposed to acoustic streaming with peak velocity 120 μm s−1.The observation of lower viability for the non-aggregated control cells not exposed to ultrasound is in agreement with the results obtained in a previous study.13 However, we do not believe that ultrasound improves the viability relative cells not exposed to ultrasound. Instead, it is the ultrasound-mediated cell aggregation that may have a beneficial effect on cell viability for the adherent cells in this and the previous study. This conclusion is supported by the similar viability obtained after both one minute and one hour of ultrasound exposure, as long as the exposure time is long enough to cause aggregation. On the other hand, there is an uncertainty in the live/dead scoring of individual cells within an aggregate since not all cells are visible in the three-dimensional cluster, which makes it difficult to estimate the significance of the approx. 9% lower viability for the control cells not exposed to ultrasound. Still, our study clearly shows that continuous standing-wave ultrasound exposure at 1 MPa pressure amplitude and one hour duration is not reducing cell viability of A549 lung cancer cells.
References
- H. Bruus, J. Dual, J. Hawks, M. Hill, T. Laurell, J. Nilsson, S. Radel, S. Sadhal and M. Wiklund, Lab Chip, 2011, 11, 3579–3580 RSC.
- A. Lenshof, C. Magnusson and T. Laurell, Lab Chip, 2012, 12, 1210–1223 RSC.
- P. Augustsson and T. Laurell, Lab Chip, 2012, 12, 1742–1752 RSC.
- M. Evander and J. Nilsson, Lab Chip, 2012, 12, 4667–4676 RSC.
- A. E. Christakou, M. Ohlin, B. Vanherberghen, M. Khorshidi, N. Kadri, T. Frisk, M. Wiklund and B. Önfelt, Integr. Biol., 2013, 5, 712–719 RSC.
- T. Laurell, F. Petersson and A. Nilsson, Chem. Soc. Rev., 2007, 36, 492–506 RSC.
- M. A. Burguillos, C. Magnusson, M. Nordin, A. Lenshof, P. Augustsson, M. J. Hansson, E. Elmér, H. Lilja, P. Brundin, T. Laurell and T. Deierborg, PLoS One, 2013, 8, e64233 CAS.
- A. Lenshof and T. Laurell, JALA, 2011, 16, 443–449 CAS.
- A. Lenshof, A. Jamal, J. Dykes, A. Urbansky, I. Åstrand-Grundström, T. Laurell and S. Scheding, Cytometry, Part A, 2014, 85, 933–941 CrossRef PubMed.
- S. Li, P. Glynne-Jones, O. G. Andriotis, K. Y. Ching, U. S. Jonnalagadda, R. O. C. Oreffo, M. Hill and R. S. Tare, Lab Chip, 2014, 14, 4475–4485 RSC.
- A. E. Christakou, M. Ohlin, B. Önfelt and M. Wiklund, Lab Chip, 2015 10.1039/c5lc00436e.
- M. Wiklund, Lab Chip, 2012, 12, 2018–2028 RSC.
- J. Hultström, O. Manneberg, K. Dopf, H. M. Hertz, H. Brismar and M. Wiklund, Ultrasound Med. Biol., 2007, 33, 145–151 CrossRef PubMed.
- B. Vanherberghen, O. Manneberg, A. Christakou, T. Frisk, M. Ohlin, H. M. Hertz, B. Önfelt and M. Wiklund, Lab Chip, 2010, 10, 2727–2732 RSC.
- D. N. Ankrett, D. Carugo, J. Lei, P. Glynne-Jones, P. A. Townsend, X. Zhang and M. Hill, J. Nanobiotechnol., 2013, 11, 20 CrossRef CAS PubMed.
- R. Barnkob, I. Iranmanesh, M. Wiklund and H. Bruus, Lab Chip, 2012, 12, 2337–2344 RSC.
- O. Manneberg, B. Vanherberghen, B. Önfelt and M. Wiklund, Lab Chip, 2009, 9, 833–837 RSC.
- O. Manneberg, B. Vanherberghen, J. Svennebring, H. M. Hertz, B. Önfelt and M. Wiklund, Appl. Phys. Lett., 2008, 93, 063901 CrossRef PubMed.
- C. A. Schneider, W. S. Rasband and K. W. Eliceiri, Nat. Methods, 2012, 9, 671–675 CrossRef CAS PubMed.
- H. Bruus, Lab Chip, 2012, 12, 1014–1021 RSC.
- N. Mori and K. Chang, Introduction to mpiv-piv toolbox in MATLAB Search PubMed.
- Tracker. Available from: http://www.cabrillo.edu/%E2%88%BCdbrown/tracker/.
- M. Settnes and H. Bruus, Phys. Rev. E: Stat. Phys., Plasmas, Fluids, Relat. Interdiscip. Top., 2012, 85, 016327 CrossRef.
- I. Iranmanesh, R. Barnkob, H. Bruus and M. Wiklund, J. Micromech. Microeng., 2013, 23, 105002 CrossRef.
- J. Svennebring, O. Manneberg and M. Wiklund, J. Micromech. Microeng., 2007, 17, 2469–2474 CrossRef.
- P. B. Muller, M. Rossi, Á. G. Marín, R. Barnkob, P. Augustsson, T. Laurell, C. J. Kähler and H. Bruus, Phys. Rev. E: Stat. Phys., Plasmas, Fluids, Relat. Interdiscip. Top., 2013, 88, 023006 CrossRef CAS.
- M. Wiklund, R. Green and M. Ohlin, Lab Chip, 2012, 12, 2438–2451 RSC.
- R. E. Apfel and C. K. Holland, Ultrasound Med. Biol., 1991, 17, 179–185 CrossRef CAS.
- W. L. Nyborg, Ultrasound Med. Biol., 2001, 27, 301–333 CrossRef CAS.
Footnote |
| † Electronic supplementary information (ESI) available. See DOI: 10.1039/c5lc00490j |
| This journal is © The Royal Society of Chemistry 2015 |

