 Open Access Article
Creative Commons Attribution 3.0 Unported Licence
Ultrasonic three-dimensional on-chip cell culture for dynamic studies of tumor immune surveillance by natural killer cells†
Athanasia E.
Christakou‡
a,
Mathias
Ohlin‡
a,
Björn
Önfelt
*ab and
Martin
Wiklund
*a
aDept. of Applied Physics, KTH - Royal Institute of Technology, Stockholm, Sweden. E-mail: martin.wiklund@biox.kth.se
bDept. of Microbiology, Tumor and Cell Biology, Karolinska Institute, Stockholm, Sweden. E-mail: bjorn.onfelt@scilifelab.se
First published on 5th June 2015
Abstract
We demonstrate a simple method for three-dimensional (3D) cell culture controlled by ultrasonic standing waves in a multi-well microplate. The method gently arranges cells in a suspension into a single aggregate in each well of the microplate and, by this, nucleates 3D tissue-like cell growth for culture times between two and seven days. The microplate device is compatible with both high-resolution optical microscopy and maintenance in a standard cell incubator. The result is a scaffold- and coating-free method for 3D cell culture that can be used for controlling the cellular architecture, as well as the cellular and molecular composition of the microenvironment in and around the formed cell structures. We demonstrate the parallel production of one hundred synthetic 3D solid tumors comprising up to thousands of human hepatocellular carcinoma (HCC) HepG2 cells, we characterize the tumor structure by high-resolution optical microscopy, and we monitor the functional behavior of natural killer (NK) cells migrating, docking and interacting with the tumor model during culture. Our results show that the method can be used for determining the collective ability of a given number of NK cells to defeat a solid tumor having a certain size, shape and composition. The ultrasound-based method itself is generic and can meet any demand from applications where it is advantageous to monitor cell culture from production to analysis of 3D tissue or tumor models using microscopy in one single microplate device.
Introduction
In cellular research, there is a need for improved in vitro model systems mimicking the complex in vivo microenvironment of living tissue. Cells within tissue interact with other cells, the extracellular matrix (ECM) and other soluble factors in a 3D communication network which is crucial for tissue development, function and survival.1,2 For this reason, traditional 2D culture which has been used for a long time is insufficient and its experimental outcome can sometimes be of limited relevance. This is of great importance for pharmaceutical companies who need appropriate cell-based assays to evaluate drugs in the early stages of development.3 In tumor biology, it is increasingly recognized that the heterogeneous composition of tumors with mixtures of cell types spatially arranged in 3D creates a microenvironment that affects tumor aggressiveness, gene expression and resistance to drug treatments.4–7The tumor microenvironment can also shape the immune response, which is exemplified by the commonly observed phenomenon wherein NK cells, a type of cytotoxic lymphocyte important for the body's defense against cancer and virus infections, isolated from explanted tumors often display an exhausted and inactive phenotype.8 This is in stark contrast to the cytotoxic activity often observed in NK cells when interacting with tumor cells in vitro, even if the target cells originate from solid tumors.9,10 Recent studies have shown that both human cervical carcinoma cells and Ewing's sarcoma family of tumor cells when grown in 3D spheroids were more resistant to NK-mediated lysis compared to those grown in monolayers.11,12 NK cell infiltration in tumors has been associated with better prognosis in lung, gastric and colorectal carcinoma, suggesting a potential future role of NK cells in cell therapy against solid tumors.13,14 However, more relevant model systems where the tumor microenvironment and architecture can be controlled are needed to better understand how NK cells interact with solid tumors.
Several techniques for 3D culture have been developed and optimized over the past few decades. Today, there are several commercially available tools for multicellular 3D culture for applications in biology and medicine.15 Most of these methods are based on assembly of cells in a 3D structure by a supporting physical scaffold around the cells using, for example, proteins and hydrogels.16 Limitations of such scaffold-based systems include the difficulty for the cell culture to interact with its environment due to the inert and/or non-transparent scaffold. It is also possible to obtain 3D cell cultures by the use of different cell adhesion-resistant surface coatings such as agarose and poly-HEMA.17 For example, coatings may be applied to microstructure patterns or combined with conical-bottom plates.18 An alternative to scaffold- and coating-based methods for 3D cell culture is to use self-assembly of cells assisted by an external force field. The most commonly used method here is the “hanging drop” where cells assemble into spheroids by gravity in drops within an upside-down oriented microplate.19 This method is limited by the difficulty to keep the drops stable over extended culture times, in particular to prevent evaporation which adds some complexity to the otherwise simple principle. Another reported method uses magnetic levitation of a hydrogel composed of cells, magnetic iron oxide, gold nanoparticles, and bacteriophage.20
In this paper, we demonstrate a novel 3D cell culture method based on ultrasonic standing waves (USWs). USWs have long been used for the purpose of trapping, concentrating or separating particles and cells, in particular in microfluidic systems.21 We have previously developed a device based on this method for the controlled manipulation of individual cells in a multi-well microplate,22 and we have used this method for studying the interaction between individual NK and leukemia cells.23,24 We have also demonstrated in several studies that continuous ultrasound exposure at MHz frequencies and a few hundred kPa acoustic pressure amplitudes does not compromise the viability or function of cells over time periods up to at least one week.22,25–27 In the present paper, we have combined these findings in order to develop a new and simple method for producing synthetic 3D solid tumors of human hepatocellular carcinoma (HCC) HepG2 cells. HCC is the most common malignancy of the liver and one of the most common and aggressive human cancers worldwide. HCC is an inflammation-related cancer as the initiation and development of liver tumors appear to be caused by chronic inflammations derived from infections with hepatitis viruses, alcohol and drug abuse, toxins and metabolic or hereditary disorders.28,29 HepG2 was selected for this study since it is a widely used and well-characterized liver tumor cell model which is also susceptible to NK cell-mediated lysis.30 In addition, recent studies suggest that immunotherapy with cytokine-activated NK cells increased the recurrence-free and overall survival of HCC patients.31 We characterize the dimensions (from 2D to 3D) and compactness of the tumor models, and use the method for monitoring the docking and infiltration of NK cells towards, onto and into the tumors. Furthermore, we monitor the rate of NK cell-mediated lysis of tumor cells, relative to the rate of tumor growth, which could thereby determine the number of NK cells needed for defeating tumors of different size and morphology. The method is integrated with live-cell confocal microscopy for time-lapse high-resolution imaging of the 3D structure of the solid tumor, as well as for tracking the interaction behavior between individual NK cells and the tumors. The methodology presented is a novel, simple and generic assay for 3D cell culture, seamlessly combining tumor/tissue production with tumor/tissue analysis. It allows the construction of more complex tumor models consisting of different cell types and architectures, with a more accurately modelled microenvironment including the extracellular matrix and soluble factors.
Materials and methods
Preparation and culture of peripheral blood NK cells
Polyclonal primary human NK cells were isolated by negative selection from lymphocyte-enriched buffy coat residues derived from anonymous healthy donors as previously described.23 Briefly, peripheral blood mononuclear cells (PBMCs) were isolated from the buffy coat by centrifugation using Ficoll-Paque Plus according to the manufacturer's instructions (GE Healthcare). NK cell isolation was performed by negative immunomagnetic bead isolation (EasySep® Human NK Cell Enrichment Kit, Stemcell Technologies) according to the manufacturer's instructions. Primary human NK cells were cultured for 7–14 days in Iscove's modified Dulbecco's medium (IMDM, I3390, Sigma-Aldrich, St. Louis, MO, USA) supplemented with 10% autologous human serum, 2 mM L-glutamine (G7513, Sigma-Aldrich, St. Louis, MO, USA), 100 U ml−1 penicillin–100 μg ml−1 streptomycin (P4333, Sigma-Aldrich, St. Louis, MO, USA), 1× non-essential amino acids (M7145, Sigma-Aldrich, St. Louis, MO, USA), 1 mM sodium pyruvate (S8636, Sigma-Aldrich, St. Louis, MO, USA) and 200 U ml−1 human interleukin (IL)-2 (PeproTech, Rocky Hill, NJ, USA) before use in experiments.Cell lines
HepG2 cells were cultured in RPMI-1640 (SH30027 Thermo Scientific, MA, USA) supplemented with 10% fetal bovine serum, 100 U ml−1 penicillin–100 μg ml−1 streptomycin, 1× non-essential amino acids, 1 mM sodium pyruvate, 2 mM L-glutamine and maintained at 37 °C in 5% CO2.Cell seeding and labeling
A cell suspension of HepG2 cells was pipetted into a microplate primed with cell medium, and the cells were settled to the bottom of the wells by gravity resulting in a stochastic distribution with an average number of cells per well controlled by the total number of added cells. The number of HepG2 cells seeded into the microplate was either 7000 or 20![[thin space (1/6-em)]](https://www.rsc.org/images/entities/char_2009.gif) 000 (the lower number was used for the NK cell experiments), and the number of seeded NK cells ranged from 5000 to 10
000 (the lower number was used for the NK cell experiments), and the number of seeded NK cells ranged from 5000 to 10![[thin space (1/6-em)]](https://www.rsc.org/images/entities/char_2009.gif) 000. Typically, 70% of the seeded cells settled in the wells of the microplate. HepG2 tumors were labeled in the chip with the viability probe calcein green AM and with far-red DDAO-SE, while NK cells were stained with calcein red-orange AM (all from Invitrogen, Carlsbad, CA, USA) as described previously.23 After seeding and on-chip culture, the growth medium was removed gently, the cells were washed four times (with RPMI-1640), and a pre-heated (37 °C) solution of calcein green AM (0.25 μM) and far-red DDAO-SE (1 μM) was added into the microplate under gentle mixing. The chip was placed in an incubator for 30 minutes and the dye solution was removed by washing twice with RPMI-1640 after which cell culture medium was added.
000. Typically, 70% of the seeded cells settled in the wells of the microplate. HepG2 tumors were labeled in the chip with the viability probe calcein green AM and with far-red DDAO-SE, while NK cells were stained with calcein red-orange AM (all from Invitrogen, Carlsbad, CA, USA) as described previously.23 After seeding and on-chip culture, the growth medium was removed gently, the cells were washed four times (with RPMI-1640), and a pre-heated (37 °C) solution of calcein green AM (0.25 μM) and far-red DDAO-SE (1 μM) was added into the microplate under gentle mixing. The chip was placed in an incubator for 30 minutes and the dye solution was removed by washing twice with RPMI-1640 after which cell culture medium was added.
Multi-well microplate and ultrasound transducer
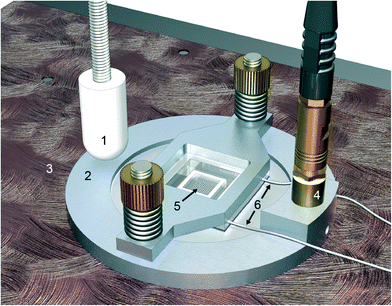
The device for ultrasonic cell manipulation, illustrated in Fig. 1, consists of a multi-well microplate and a ring-shaped ultrasonic transducer which is described in detail in ref. 22 and 32. In brief, the microplate consists of an array of 10 × 10 wells etched in the center of a silicon layer bonded to a glass layer as thick as a coverslip, forming a sandwich-type of a microplate measuring 22 × 22 × 0.475 mm3. The wells, with either straight or slightly rounded walls, have a cross-section area of 350 × 350 μm2 and a depth of 300 μm. A polydimethylsiloxane (PDMS) frame is bonded to the top layer, i.e. the silicon surface, around the wells to increase the sample volume capacity (thus providing a pool of approx. 50 μl of cell medium above the wells). Furthermore, to minimize evaporation, a cover glass is placed on top of the PDMS frame. This cover glass can easily be removed for adding or removing liquid from the microplate. The transducer consists of a ring-shaped piezoceramic plate (Pz-26, Ferroperm, Denmark) with dimensions of 38 mm (outer diameter) and 0.86 mm (thickness) and an 8 mm center hole for visual access using a microscope. Upon assembling the piezoceramic plate into the microdevice shown in Fig. 1, the transducer became broadbanded with suitable driving frequencies in the range of 1.9–2.5 MHz.Temperature control system and cell incubator
The microplate device was integrated into a small tabletop cell incubator, allowing control of the environmental conditions (temperature, CO2 and humidity) while being operated by ultrasound continuously for up to 7 days. To maintain a physiological temperature independent of the ultrasound actuation voltage, the temperature in the microplate was regulated using an in-house built temperature control system consisting of a PID (KT4, Panasonic, Japan) controlled liquid heat exchanger capable of both cooling and heating. This was achieved by varying the temperature of a water block clamped to the microdevice and integrated into the tabletop cell incubator, with feedback from the temperature measured by two type-T thermocouple microprobes attached to the microplate (Fig. S1†).Ultrasound cell culture
The ultrasound transducer was actuated by a signal generator and an RF amplifier. We used a frequency modulation method as described previously,33 to achieve a robust and uniform two-dimensional (2D) acoustic force field in each well of the microplate. This actuation method resulted in driving seeded cells by acoustic radiation forces into the pressure nodes of standing waves located in the center of each well, where they were trapped and aggregated. Thus, each well acts as a 2D half-wave resonator producing a single trapping position. With the frequency-modulation method, we were able to decouple any mutual resonance interferences (causing spurious or unsymmetrical modes) between different wells in the 100-well microplate. For the microplates used in this work, the selected center frequencies were 1.96 MHz for the straight-wall wells and 2.46 MHz for the wells with slightly rounded walls (depending on the resonance frequency of each plate design), and the frequency was cycled linearly in 50 and 100 kHz wide bands around the center frequency, respectively, at a rate of 1 kHz. Actuation voltages ranged from 60–110 Vpp measured with a 10× attenuation probe. HepG2 cells were seeded into the microplate according to the method described in ref. 24. Cell aggregation and positioning in each well were monitored by microscopy during the initial (approx. 5 min) phase of transducer actuation. The device was then moved into the cell incubator and clamped to the water block for temperature control. During the relocation of the device, the ultrasound was temporarily turned off. When the device was reactivated, the ultrasound cell culture was operated continuously for time periods varying from 15 min up to as long as 7 days. For long culture times (more than 3 days), short breaks were performed for medium exchange. Passive cell incubation (ultrasound OFF) was implemented in some experiments to investigate the continued growth of the formed tumors without the effect of ultrasound.Microscopy
Images were acquired with two different microscope systems: an inverted laser scanning confocal microscope (LCSM, Zeiss LSM 5 Pascal) equipped with a motorized stage, and an inverted bright-field microscope (Axiovert 40 CFL, Zeiss, Germany) equipped with a DSLR camera (Sony α77, Sony, Japan) and an objective (Epiplan 5×/0.13, Zeiss, Germany). High-resolution 3D confocal imaging of individual tumors was performed using a 40×/1.3 oil objective and pinhole adjusted according to the fluorescence signal in order to acquire the optimal images. Fluorescence imaging of the entire chip was performed with a 10×/0.3 objective using a moving stage to form a 4 × 4 tile scan. When time-lapse imaging was performed, the 4 × 4 tile scan was repeated every 20–30 minutes.Image analysis
ImageJ and MATLAB were used for image analysis and 3D reconstruction. The normalized tumor volume was estimated by multiplying the measured area in the images with the average of the inverted grey scale value within that area (the latter being a rough measure of the tumor height based on the bright-field images). As a comparison, the average tumor volume corresponded to a tumor having a bottom area of 43![[thin space (1/6-em)]](https://www.rsc.org/images/entities/char_2009.gif) 000 μm2 and a height of approx. 150 μm. Such an aggregate contains about 2200 HepG2 cells (estimated by counting the cells in the small 3D structure in Fig. 2E–F, assuming the same shape (category I), and scaled with the tumor volume in Fig. 6). The number of NK cells in each tumor was estimated by the initial fluorescence intensity within the marked boundary of the tumor with the mean intensity of individual NK cells (determined from individual measurements of n = 30 NK cells). The calcein AM penetration depth was calculated by implementing a method based on offsetting the boundary of the aggregate, hence dividing each aggregate into several surface segments, from the outer boundary towards the center. Target cell death was scored by visual inspection of the calcein AM fluorescence (decreases upon cell death) and far-red DDAO-SE fluorescence (increases upon cell death) from target cells in conjunction with morphological features (e.g. cell blebbing) in the bright-field image.
000 μm2 and a height of approx. 150 μm. Such an aggregate contains about 2200 HepG2 cells (estimated by counting the cells in the small 3D structure in Fig. 2E–F, assuming the same shape (category I), and scaled with the tumor volume in Fig. 6). The number of NK cells in each tumor was estimated by the initial fluorescence intensity within the marked boundary of the tumor with the mean intensity of individual NK cells (determined from individual measurements of n = 30 NK cells). The calcein AM penetration depth was calculated by implementing a method based on offsetting the boundary of the aggregate, hence dividing each aggregate into several surface segments, from the outer boundary towards the center. Target cell death was scored by visual inspection of the calcein AM fluorescence (decreases upon cell death) and far-red DDAO-SE fluorescence (increases upon cell death) from target cells in conjunction with morphological features (e.g. cell blebbing) in the bright-field image.
Statistical analysis
The Kruskal–Wallis test was used to evaluate the overall statistical differences between groups in the experiments. To indicate pairwise differences between groups, the Mann–Whitney U test was used. Stars were used to indicate statistical significance: ns (p > 0.05); * (0.01 < p ≤ 0.05); ** (0.001 < p ≤ 0.01); *** (0.001 < p ≤ 0.0001); **** (p > 0.0001).Results
Temperature control of the ultrasound cell culture device
The multi-well microplate device22,32 used for ultrasonic cell culture is illustrated in Fig. 1. The device was operated by frequency-modulated actuation, which eliminates the need for frequency calibration and resonance tracking. This actuation method requires broadband (low quality factor) ultrasound technology, which is known to generate more heat than single-frequency (high quality factor) technology, and therefore we incorporated a custom-built regulator controlling the temperature of the microplate independently of the surrounding temperature (cf. Fig. S1†). To investigate whether our device was compatible with long-term cell culture, the device was placed in a tabletop cell incubator, and the temperature in the microplate was monitored with and without an external temperature control system during continuous ultrasound exposure for up to 63 hours. The external control system can regulate the temperature within less than ±0.3 °C, independently of both the ultrasound power delivered to the device and the preferred setpoint temperature (cf. Fig. S2†), which is better than needed for most cell culture applications.27 Thus, frequency-modulated ultrasonic cell manipulation combined with temperature control is robust allowing long-term cell studies.Ultrasound 3D culture of HepG2-based tumor models
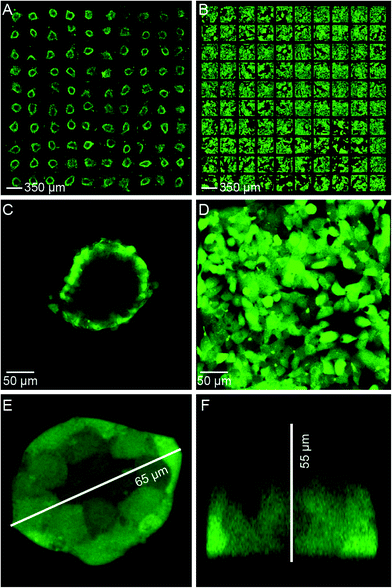
A demonstration of ultrasound 3D cell culture is shown in Fig. 2, where the results of a seven day active culture (ultrasound ON, Fig. 2A) is compared with a seven day passive culture (ultrasound OFF, Fig. 2B). The cells formed compact 3D “tumors” in the active culture (Fig. 2C) while they spread out in 2D monolayers on the glass surface in the passive culture (Fig. 2D). Here, a “tumor” means a compact tissue-like 3D cluster of HepG2 cells with tight intercellular junctions, in contrast to the initially trapped cell aggregate of loosely bound cells. In these tumors, we note that the green viability probe (calcein AM) could not penetrate far into the tumor core (Fig. 2C) due to the tight junctions between cells formed in the active culture (clearly seen in Fig. 2E). The width (Fig. 2E, top view) and height (Fig. 2F, side view) of the tumors were assessed by 3D confocal microscopy. In addition to fluorescence imaging, the tumor models display a characteristic morphology in both bright-field and dark-field imaging due to the distinctive cell boundary surrounding the tumors (cf. Fig. S3†). This typical morphology is in agreement with the HepG2 spheroid structures reported in other 3D cell culture studies.34,35 Another typical feature of the active culture is the flat bottom facing the glass layer, forming “hemi-spheroid” 3D structures adhered to the bottom, in contrast to the spheroid structures formed by 3D cell culture methods based on prevention of the cells from adhering to any substrate.5 This feature of our method is advantageous since the tumors are not accidentally removed upon exchanging the medium.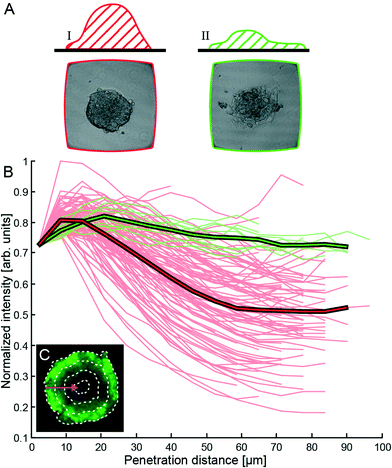 | ||
| Fig. 3 Characterization of compactness and shape of the HepG2 tumors in Fig. 2A. (A) Manual classification of the formed tumors into two different categories with sketch and photo examples (width of each photo is 350 μm = width of the wells): category I (predominantly 3D structure, red curves in (B)) and II (predominantly 2D structure, green curves in (B)). (B) Fluorescence intensity versus penetration depth of the viability probe calcein AM. The penetration depth is measured from the surface towards the center of the tumor in the horizontal cross-section. The bold colored curves in the diagram show the respective average values for the two categories. (C) Example of the stepwise layer-by-layer segmentation algorithm. Here, a segment is the area between two dotted lines. For each segment, the average intensity is calculated and plotted as a function of penetration depth. | ||
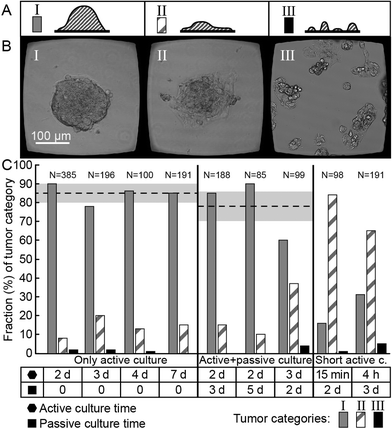 | ||
| Fig. 4 Tumor classification after different times of active (ultrasound ON) and passive (ultrasound OFF) culture. Side-view sketches (A) and bright-field images (B) of the three different tumor categories I–III. Here, categories I–II (predominantly 3D and 2D structures, respectively) are the same as those in Fig. 3, while category III represents a non-aggregated structure, associated with failed ultrasound trapping. (C) Tumors from nine different experiments with various times of active and passive culture were classified into the three different categories (I–III). Here, ‘d’ stands for days, ‘h’ for hours, and ‘N’ for number of assessed wells. The dotted lines and light gray zones are the mean values and standard deviation of the fractions of category I tumors (predominantly 3D) for each actuation group (only active, and active + passive culture) where we used at least two days of active culture time. | ||
Characterization of compactness, shape and size of ultrasound-cultured tumor models
As an indicator of hemi-spheroid formation and compactness of 3D tumor models with tight intercellular junctions, we compared manual classification of the formed tumors in Fig. 2A with quantification of the fluorescence intensity from calcein AM at different horizontal depths relative to the outer boundary of the tumors (cf.Fig. 3). Here, 99 tumors from one experiment were manually sorted into two different categories (I (89%) and II (10%)) according to their appearance in the bright-field microscope image (cf.Fig. 4): category I = predominantly 3D structures (i.e., the majority of the apparent area of the tumor in the image is a compact 3D hemi-spheroid) and category II = predominantly 2D structures (i.e., the majority of the apparent area of the tumor in the image is a 2D monolayer). The average cross-section area of the category I hemi-spheroids was (2.9 ± 0.5) × 104 μm2, corresponding to circles with diameters of (200 ± 20) μm. Based on manual counting of the cells in Fig. 2E–F, this corresponds to (category I) 3D solid tumors containing on average 1400 HepG2 cells. We also measured the change in size of the tumors during growth in the active ultrasound culture. For this purpose, we compared the average size of the tumors shown in Fig. 2A after two days of active culture (data not shown) with the size after seven days of active culture (cf.Fig. 2A). For category I and category II tumors, the average tumor area in the images increased by (49 ± 17)% and (53 ± 12)%, respectively, within five days of culture (i.e. from day 2 to 7 in the active culture).Tumor classification after different time periods of active and passive culture
For the tumors shown in Fig. 2, we performed active ultrasound culture for 7 days. However, we examined the outcome for a range of ultrasound exposure times, from a short exposure time (15 min) up to 7 days (see Fig. 4). Here, tumors from nine different experiments are sorted into three different categories (I–III) based on the same manual classification as in the previous section. In addition to categories I–II (predominantly 3D and 2D tumors), category III represents fragmented cell cultures in the well, i.e., insufficient ultrasonic cell trapping. For category I (tumors with predominantly 3D structures), we obtain on average (85 ± 5)% for any active culture time between 2 and 7 days (the group “only active culture” in Fig. 4C). We also studied whether or not the successfully formed 3D structures were retained when switching from active (ultrasound ON) to passive (ultrasound OFF) culture after 2–3 days of initial active culture (the group “active + passive culture” in Fig. 4C). Here, the corresponding percentage of category-I tumors was (78 ± 16)%. The slightly lower success rate can be explained by a small transformation from category I (more 3D-type) into II (more 2D-type) when cells spread on the bottom glass substrate of the microplate without the supporting acoustic forces. However, most 3D structures were retained and continued to grow for several days without losing their shape. Finally, we also examined the outcome for shorter culture times (15 min and 4 hours), resulting in 16% and 31% of category-I tumors (last group in Fig. 4C). Thus, our data indicate that an active culture time of 2 days or more is suitable for the production of a great majority of useful 3D tumors of HepG2 cells, and a great majority of these 3D tumors are retained even after switching to passive culture.NK cell migration, docking to tumors and lysis of tumor cells
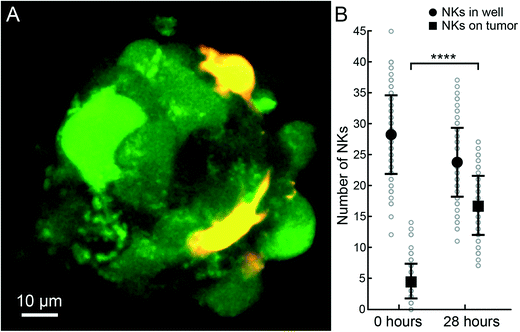
After establishing a protocol for forming HepG2 tumors, we exposed them to NK cells to monitor the different stages of immune surveillance. In all the following NK cell experiments, we did not use an active ultrasound culture. Instead, human IL-2 activated NK cells were seeded into wells in microplates and allowed to spontaneously migrate and interact with the ultrasound-formed tumors. In the early stages when NK cells docked onto the tumors, they often stretched out and migrated across the tumor surface (cf.Fig. 5A). Immediately after seeding, only a few NK cells docked onto the tumors, while at t = 28 h, almost all NK cells were on or inside the tumors (cf.Fig. 5B). Z-scans from the initial phases of the interaction revealed that NK cells were mainly situated at the tumor periphery, although we also observed some NK cells that infiltrated the tumor mass (cf. Movie S1†). Time-lapse movies confirmed this observation as NK cells moved across the tumor surface, at the tumor–glass interface under the tumor and also inside the tumors (Movie S2†). To monitor target cell death, we used the fluorescence signals from calcein AM (leaks out) and far-red DDAO-SE (increases), as well as visual signs in the bright-field images. Consistent with previous results,30 NK-mediated lysis started immediately after addition of the NK cells and within a few hours, signs of tumor cell death were evident mainly at the periphery of the tumor (Fig. S4 and S5†).Time-lapse studies of NK-cell mediated tumor defeat
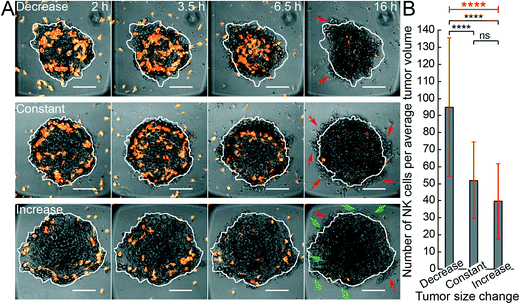
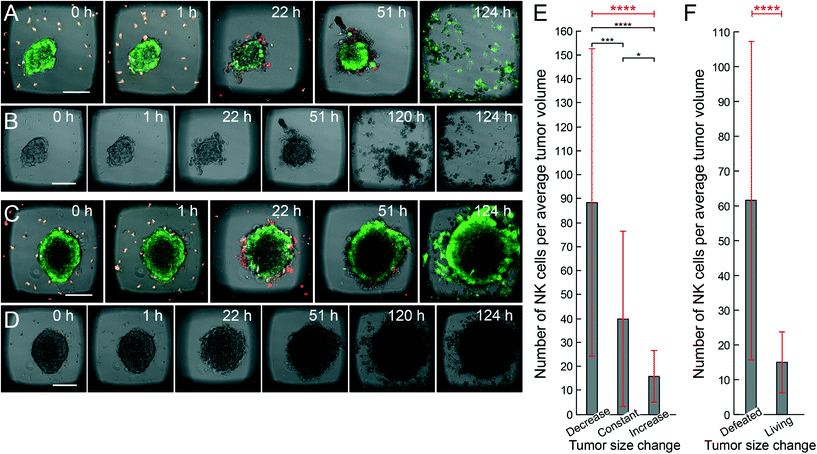
In the next set of experiments, we acquired time-lapse sequences of all wells of the microplate in parallel, allowing us to quantify the battle between tumor growth and NK-mediated lysis. We examined both the initial phase (first day) of either a decrease or an increase of apparent tumor size and the final outcome of either defeated or living tumors (after up to five days).From bright-field microscopy images, each initial tumor area was manually marked (see white boundary in Fig. 6A), and we then assessed if the tumor shrunk by tumor cells being lysed inside the boundary (Fig. 6A, upper panel), if they remained constant (Fig. 6A, middle panel), or if they grew outside this boundary (Fig. 6A, lower panel) during the initial 16 hours of NK cell – tumor interactions. Based on the fluorescence and bright-field images, we estimated the tumor volumes, giving a rough estimate of the number of HepG2 cells per tumor (approx. 2200), and the number of NK cells interacting with each tumor. Plotting the estimated number of NK cells per average category I tumor volume for the three outcomes (decreased, constant or increased tumor size) suggested that the number of NK cells per tumor volume had an immediate impact on the development of the tumor (Fig. 6B). The cut-off value between causing a decrease or an increase in tumor size (i.e. for suppressing tumor growth) was on average around 50 NK cells per HepG2 tumor of ~0.2 mm diameter (mean value of the middle bar in Fig. 6B). This corresponds to a ratio between NK cells and HepG2 cells of roughly 1![[thin space (1/6-em)]](https://www.rsc.org/images/entities/char_2009.gif) :
:![[thin space (1/6-em)]](https://www.rsc.org/images/entities/char_2009.gif) 40.
40.
In a second experiment, the monitoring time was increased to track the full process from the initial tumor decrease or increase until the final tumor outcome. After 124 hours, some tumors were completely defeated (Fig. 7A–B, Movie S3†) while others were viable and continued to grow (Fig. 7C–D). In this experiment, the average cut-off value for suppressing initial tumor growth (after 22 hours) was around 40 NK cells per average tumor volume (middle bar in Fig. 7E). Here, note that new calcein green AM was added into the microplate at 51 (cf. Fig. S6†) and 124 hours, resulting in the same color of both NK cells and viable HepG2 cells at these time points in the presented sequence. The full process, including both the initial first day (22 hours) and the final fifth day (124 hours), is quantified in Fig. 7E–F. Here, we used the same quantification method for estimating the tumor volume as that in the first experiment (cf.Fig. 6), however NK cell estimation was performed manually without taking into account the NK cell fluorescence intensity. As the average tumor volume was smaller, corresponding to approx. 700 HepG2 cells, in this experiment, this corresponds to a ratio between NK cells and HepG2 cells of about 1![[thin space (1/6-em)]](https://www.rsc.org/images/entities/char_2009.gif) :
:![[thin space (1/6-em)]](https://www.rsc.org/images/entities/char_2009.gif) 20.
20.
After an additional four days of continued NK cell–tumor culture, we were able to score whether the tumor was completely defeated or parts of the tumor were still viable (see Fig. 7F). Here, we note that on average, 20 NK cells per tumor were present in the wells where the tumor had survived.
Discussion and conclusion
We have demonstrated a novel method for 3D cell culture based on ultrasonic standing waves in a multi-well microplate. The method is designed for producing small (~0.2 mm size) 3D solid tumors or tissue structures in parallel without the need for any supporting scaffold or surface coating. Our results can be compared with a previous study where HepG2 spheroids were formed after the initial aggregation of cells by ultrasound for 5 min, followed by insertion of the aggregate into a gel-based passive culture.36,37 Our method is gel-free, and thus requires active culture times longer than 4 hours to produce stable 3D structures. On the other hand, the active culture time can also be used as a steering parameter for choosing different solid tumor shapes (short time for more 2D shapes and long time for more 3D shapes).The ultrasound is coupled into the microplate by a broadband transducer operating in a frequency-modulated mode, without the need for any calibration or resonance control during long-term operation. This is accomplished by a temperature-controlled water block connected to the microplate and placed inside a tabletop cell incubator. In this way, the temperature of the microplate device as well as of the surrounding air is carefully controlled and can be kept constant at any preferred relevant temperature, independently of the ultrasound power delivered to the device, something that is more difficult to realize with single-frequency ultrasound technology. The microplate device is compatible with high-resolution optical microscopy, offering a method for combined 3D cell culture and cell characterization.
Here, the method was used to culture 3D solid HepG2 tumor models, followed by studying the interaction between small populations (approx. 10–100) of primary human NK cells and HepG2 tumors. We found that a large majority (85%) of the produced solid tumors were 3D hemi-spheroids and we outlined a procedure for classification based on their shape and compactness. NK cells were observed to interact with tumors, primarily by adhering and migrating across their surface but also by infiltrating into the tumor mass. In agreement to this, target cell death was primarily observed at the tumor periphery, suggesting that NK cells attack the tumors from the outside to the inside rather than the opposite. Furthermore, we demonstrate how the method could be used for determining the average number of NK cells needed for initial suppression of tumor growth or completely defeating a tumor in the following days of culture. For the experimental conditions used in this work, we observed that a ratio between NK cells and HepG2 cells in the range of 1![[thin space (1/6-em)]](https://www.rsc.org/images/entities/char_2009.gif) :
:![[thin space (1/6-em)]](https://www.rsc.org/images/entities/char_2009.gif) 20–1
20–1![[thin space (1/6-em)]](https://www.rsc.org/images/entities/char_2009.gif) :
:![[thin space (1/6-em)]](https://www.rsc.org/images/entities/char_2009.gif) 40 was needed to prevent tumor growth in the first day, while a ratio of approx. 1
40 was needed to prevent tumor growth in the first day, while a ratio of approx. 1![[thin space (1/6-em)]](https://www.rsc.org/images/entities/char_2009.gif) :
:![[thin space (1/6-em)]](https://www.rsc.org/images/entities/char_2009.gif) 10 was needed to destroy the tumor in five days. These results are average values; when individual tumors were studied, the standard deviations were large. Still, statistical analysis confirms that the identified trends of increasing number of NK cells observed for shrinking or defeating tumors, relative to the number observed for growing tumors, are significant (cf.Fig. 6B and 7B), with the only exception of the threshold between constant and increasing size in Fig. 6B.
10 was needed to destroy the tumor in five days. These results are average values; when individual tumors were studied, the standard deviations were large. Still, statistical analysis confirms that the identified trends of increasing number of NK cells observed for shrinking or defeating tumors, relative to the number observed for growing tumors, are significant (cf.Fig. 6B and 7B), with the only exception of the threshold between constant and increasing size in Fig. 6B.
Although a simple cell model was used in this initial work, the method allows the production of more complex tumor models, including several cell types, extracellular matrix and different relevant soluble factors. One important advantage of the ultrasound cell culture method is the possibility to vary between the ordered and chaotic structures of the building blocks in the tumor model and its microenvironment. This can be achieved by, e.g., changing the manner of adding the components into the microplate either one by one or as a mixture. In the future, we believe that this method will be useful for applications where it is of interest to create sophisticated in vitro models of tissue or solid tumors, with the additional functionality of real-time and detailed optical monitoring of individual multi-cellular structures.
Acknowledgements
We thank the Swedish Research Council, the Swedish Foundation for Strategic Research and Stockholm's Läns Landsting for financial support.References
- C. J. Lovitt, T. B. Shelper and V. M. Avery, Biology, 2014, 3, 345–367 CrossRef PubMed.
- C. L. Li, T. Tian, K. J. Nan, N. Zhao, Y. H. Guo, J. Cui, J. Wang and W. G. Zhang, Oncol. Rep., 2008, 20, 1465–1471 Search PubMed.
- E. C. Butcher, E. L. Berg and E. J. Kunkel, Nat. Biotechnol., 2004, 22, 1253–1259 CrossRef CAS PubMed.
- D. Hanahan and R. A. Weinberg, Cell, 2000, 100, 57–70 CrossRef CAS.
- F. Pampaloni, E. G. Reynaud and E. H. K. Stelzer, Nat. Rev. Mol. Cell Biol., 2007, 8, 839–845 CrossRef CAS PubMed.
- S. Ghosh, G. C. Spagnoli, I. Martin, S. Ploegert, P. Demougin, M. Heberer and A. Reschner, J. Cell. Physiol., 2005, 204, 522–531 CrossRef CAS PubMed.
- K. E. Sung and D. J. Beebe, Adv. Drug Delivery Rev., 2014, 79–80, 68–78 CrossRef CAS PubMed.
- A. Stojanovic, M. P. Correia and A. Cerwenka, Cancer Microenviron., 2013, 6, 135–146 CrossRef CAS PubMed.
- M. R. Parkhurst, J. P. Riley, M. E. Dudley and S. A. Rosenberg, Clin. Cancer Res., 2011, 17, 6287–6297 CrossRef CAS PubMed.
- T. Igarashi, J. Wynberg, R. Srinivasan, B. Becknell, J. P. McCoy Jr., Y. Takahashi, D. A. Suffredini, W. M. Linehan, M. A. Caligiuri and R. W. Childs, Blood, 2004, 104, 170–177 CrossRef CAS PubMed.
- A. Giannattasio, S. Weil, S. Kloess, N. Ansari, E. H. K. Stelzer, A. Cerwenka, A. Steinle, U. Koehl and J. Koch, BMC Cancer, 2015, 15, 351 CrossRef PubMed.
- T. D. Holmes, Y. M. El-Sherbiny, A. Davison, S. L. Clough, G. E. Blair and G. P. Cook, J. Immunol., 2011, 186, 1538–1545 CrossRef CAS PubMed.
- P. A. Albertsson, P. H. Basse, M. Hokland, R. H. Goldfarb, J. F. Nagelkerke, U. Nannmark and P. J. Kuppen, Trends Immunol., 2003, 24, 603–609 CrossRef CAS PubMed.
- K. Iwasaki, H. Kikuchi, S. Miyatake, T. Aoki, T. Yamasaki and Y. Oda, Cancer Res., 1990, 50, 2429–2436 CAS.
- M. Rimann and U. Graf-Hausner, Curr. Opin. Biotechnol., 2012, 23, 803–809 CrossRef CAS PubMed.
- D. Gao, H. Liu, Y. Jiang and J.-M. Lin, TrAC, Trends Anal. Chem., 2012, 35, 150–164 CrossRef CAS PubMed.
- F. Hirschhaeuser, H. Menne, C. Dittfeld, J. West, W. Mueller-Klieser and L. A. Kunz-Schughart, J. Biotechnol., 2010, 148, 3–15 CrossRef CAS PubMed.
- A. Ivascu and M. Kubbies, J. Biomol. Screening, 2006, 11, 922–932 CrossRef CAS PubMed.
- Y. C. Tung, A. Y. Hsiao, S. G. Allen, Y. S. Torisawa, M. Ho and S. Takayama, Analyst, 2011, 136, 473–478 RSC.
- G. R. Souza, J. R. Molina, R. M. Raphael, M. G. Ozawa, D. J. Stark, C. S. Levin, L. F. Bronk, J. S. Ananta, J. Mandelin, M.-M. Georgescu, J. A. Bankson, J. G. Gelovani, T. C. Killian, W. Arap and R. Pasqualini, Nat. Nanotechnol., 2010, 5, 291–296 CrossRef CAS PubMed.
- H. Bruus, J. Dual, J. Hawkes, M. Hill, T. Laurell, J. Nilsson, S. Radel, S. Sadhal and M. Wiklund, Lab Chip, 2011, 11, 3579–3580 RSC.
- B. Vanherberghen, O. Manneberg, A. Christakou, T. Frisk, M. Ohlin, H. M. Hertz, B. Onfelt and M. Wiklund, Lab Chip, 2010, 10, 2727–2732 RSC.
- A. E. Christakou, M. Ohlin, B. Vanherberghen, M. A. Khorshidi, N. Kadri, T. Frisk, M. Wiklund and B. Onfelt, Integr. Biol., 2013, 5, 712–719 RSC.
- M. Wiklund, A. Christakou, M. Ohlin, I. Iranmanesh, T. Frisk, B. Vanherberghen and B. Önfelt, Micromachines, 2014, 5, 27–49 CrossRef PubMed.
- J. Hultström, O. Manneberg, K. Dopf, H. M. Hertz, H. Brismar and M. Wiklund, Ultrasound Med. Biol., 2006, 33, 145–151 CrossRef PubMed.
- J. Svennebring, O. Manneberg and M. Wiklund, J. Micromech. Microeng., 2007, 17, 2469 CrossRef.
- M. Wiklund, Lab Chip, 2012, 12, 2018–2028 RSC.
- C. Berasain, J. Castillo, M. J. Perugorria, M. U. Latasa, J. Prieto and M. A. Avila, Ann. N. Y. Acad. Sci., 2009, 1155, 206–221 CrossRef CAS PubMed.
- D. Capece, M. Fischietti, D. Verzella, A. Gaggiano, G. Cicciarelli, A. Tessitore, F. Zazzeroni and E. Alesse, BioMed Res. Int., 2013, 2013, 15 Search PubMed.
- H.-R. Kim, H.-J. Park, J. Park, S. Kim, K. Kim and J. Kim, Cancer Immunol. Immunother., 2004, 53, 461–470 CrossRef CAS PubMed.
- J. H. Lee, J.-H. Lee, Y.-S. Lim, J. E. Yeon, T.-J. Song, S. J. Yu, G.-Y. Gwak, K. M. Kim, Y. J. Kim, J. W. Lee and J.-H. Yoon, Gastroenterology, 2015, 1383–1391 CrossRef CAS PubMed.
- M. Ohlin, A. E. Christakou, T. Frisk, B. Önfelt and M. Wiklund, J. Micromech. Microeng., 2013, 23, 035008 CrossRef.
- O. Manneberg, B. Vanherberghen, B. Onfelt and M. Wiklund, Lab Chip, 2009, 9, 833–837 RSC.
- J. M. Kelm, N. E. Timmins, C. J. Brown, M. Fussenegger and L. K. Nielsen, Biotechnol. Bioeng., 2003, 83, 173–180 CrossRef CAS PubMed.
- R.-Z. Lin, L.-F. Chou, C.-C. Chien and H.-Y. Chang, Cell Tissue Res., 2006, 324, 411–422 CrossRef CAS PubMed.
- D. Bazou, W. T. Coakley, A. J. Hayes and S. K. Jackson, Toxicol. In Vitro, 2008, 22, 1321–1331 CrossRef CAS PubMed.
- D. Bazou, Cell Biol. Toxicol., 2010, 26, 127–141 CrossRef CAS PubMed.
Footnotes |
| † Electronic supplementary information (ESI) available. See DOI: 10.1039/c5lc00436e |
| ‡ Contributed equally. |
| This journal is © The Royal Society of Chemistry 2015 |

