 Open Access Article
Creative Commons Attribution 3.0 Unported Licence
Microscale extraction and phase separation using a porous capillary
Thomas W.
Phillips
 ,
James H.
Bannock
and
John C.
deMello
*
Department of Chemistry, Imperial College London, Exhibition Road, London, SW7 2AZ, UK. E-mail: j.demello@imperial.ac.uk
First published on 9th June 2015
Abstract
We report the use of a porous polytetrafluoroethylene capillary for the inline separation of liquid–liquid segmented flows, based on the selective wetting and permeation of the porous capillary walls by one of the liquids. Insertion of a narrow flow restriction at the capillary outlet allows the back pressure to be tuned for multiple liquid–liquid combinations and flow conditions. In this way, efficient separation of aqueous–organic, aqueous–fluorous and organic–fluorous segmented flows can be readily achieved over a wide range of flow rates. The porous-capillary-separator enables the straightforward regeneration of a continuous flow from a segmented flow, and may be applied to various applications, including inline analysis, biphasic reactions, and purification. As a demonstration of the latter, we performed a simple inline aqueous–organic extraction of the pH indicator 2,6-dichloroindophenol. An aqueous solution of the conjugate base was mixed with hydrochloric acid in continuous flow to protonate the indicator and render it organic-soluble. The indicator was then extracted from the aqueous feed into chloroform using a segmented flow. The two liquids were finally separated inline using a porous PTFE capillary, with the aqueous phase emerging as a continuous stream from the separator outlet. UV-visible absorption spectroscopy showed the concentration of indicator in the outflowing aqueous phase to be less than one percent of its original value, confirming the efficacy of the extraction and separation process.
1 Introduction
Co-injection of two immiscible liquids into a narrow channel causes one or both components to segment into a train of discrete droplets or slugs. The resulting two-phase fluid stream offers many advantages over conventional single-phase fluid streams for both analytical and synthetic chemistry.1–6 Segmentation of a solvent, for instance, increases the degree of spatial confinement, providing a more uniform environment in terms of temperature and composition, which can be beneficial for chemical analysis or synthesis. Identical or distinct reactions/analyses can be carried out in individual slugs/droplets, allowing for the rapid acquisition of robust statistical data or the exhaustive screening of multiple reaction conditions.7 Biphasic reactions can be induced at the liquid–liquid interface.8,9 And purification can be performed inline, exploiting differences in solubility to extract selected solutes from one liquid into the other.10In many cases, it subsequently becomes necessary to separate the immiscible liquids, while keeping at least one of the liquids flowing in a stable and controlled manner. Key applications of liquid–liquid separation include: (i) multistep chemical processing, where it may be impractical to carry out every step within the segmented flow regime; (ii) inline analysis, where switching to continuous flow can greatly simplify detection by removing the need for sophisticated detectors synchronised to the segmented solvent flow; and (iii) physical removal of the unwanted phase (and any impurities contained therein) prior to collection of the product.
Methods for achieving liquid–liquid separation on the microscale fall into two main categories: gravity-based methods, which exploit differences in density to separate the two phases; and wetting-based methods that exploit differences in the tendency of the two liquids to wet a surface or membrane. In a typical gravity-based separator, the two-phase flow is introduced into a separating chamber with vertically offset outlets; the denser liquid sinks to the bottom of the chamber and exits by the lower outlet, while the other liquid exits by the upper outlet.11–13 The efficiency of phase-separation increases with the weight of amassed fluid, and consequently gravity-based separators are best suited to situations where large amounts of solvent are collected over extended periods of time.
For microscale applications involving small quantities of solvent, wetting-based methods are preferable since phase separation is induced by interfacial rather than gravitational forces, removing the need to accumulate large volumes of liquid. One approach is to use micro-engineered structures to induce phase separation and coerce the two liquids into following separate exit paths, with one liquid maximizing and the other minimizing its contact with an exposed surface.14,15 Alternatively one can use porous membranes, with the wetting phase selectively permeating the membrane.16,17 The larger the difference in wetting, the easier it is to induce and maintain phase separation.
Wetting-based separators are typically suited to a limited number of liquid–liquid combinations over a narrow range of flow conditions, with most reported devices having been applied to aqueous–organic fluid streams at close to balanced volumetric flow rates (see ref. 18 for a recent review). If the flow rates of the two phases differ too much or the combined flow rate is too high or too low, separation efficiencies suffer, causing a mixture of the two liquids to emerge from (at least) one of the outlets. The operating range (i.e. the range of flow rates over which complete separation is attained) can be widened by inserting back pressure regulators or pumps at one or both outlets to maintain the necessary pressure differential between the outlets,19 but this adds cost and complexity to the set-up.
Accordingly, there is a continuing need for versatile separation techniques that can work reliably with multiple liquid–liquid combinations across a broad range of flow rates. In particular there is a need for simple methods that can be readily integrated with both chip- and capillary-based microfluidic systems without the need for extraneous equipment. We recently reported an effective method for inline separation of immiscible liquids using commercially sourced porous polytetrafluoroethylene (PTFE) capillaries.18 Using water dispersed in a fluorous oil as a test system, quantitative recovery of the water from the oil was achieved over a wide range of flow conditions, with no contamination of the water by the fluorous component even when the latter was present in large (ten-fold) excess. The exiting water stream could be readily re-dispersed by injecting additional oil downstream, allowing for repeated switching between the segmented and continuous flow regimes—a key requirement for multistep chemical processing.
The use of porous capillaries for phase separation has some precedence. Porous PTFE capillaries have previously been applied to gas–liquid and liquid–liquid extraction in Inductively Coupled Plasma Atomic Emission Spectroscopy (ICP-AES)20–22 and to liquid–liquid extraction in Inductively Coupled Plasma Mass Spectrometry (ICP-MS).23 However, there are very few reports of their use outside these fields and, prior to our previous report, porous capillaries had not been integrated with microfluidic componentry.
In that report, we applied porous PTFE capillaries to the separation of aqueous–fluorous fluid streams. It is the purpose of this paper to demonstrate their wider applicability to aqueous–organic and organic–fluorous segmented flows. The separation of organic–fluorous fluid streams is of particular concern because the favourable properties of fluorous liquids (high boiling points, good chemical stability, and immiscibility with most organic solvents) has led to their use as carrier liquids in a wide variety of flow syntheses.24–26 To our knowledge there have been no previous reports describing the successful inline separation of organic–fluorous mixtures, with one report explicitly noting the difficulty of separating such mixtures due to the small difference in interfacial tension.16 We also describe here a straightforward method for tuning the porous capillary separators to provide efficient liquid–liquid separation over a broad range of flow rates, and further present a simple demonstration of their application to the inline extraction of an analyte from an aqueous phase to organic phase.
2 Results and discussion
2.1 Operating principle
For convenience we refer to the two liquids in the segmented flow as the solvent and the carrier. The carrier is the phase that preferentially wets the walls of the separator. The solvent is typically understood to contain the reagents, products or analytes of interest, with the carrier acting merely as an inert liquid whose sole purpose is to maintain the segmented flow. However, this is not always so and in many cases—e.g. biphasic reactions or liquid–liquid extractions—both phases participate in the chemical procedure.The principle of the separator is straightforward. The two-phase stream enters the inlet of the porous capillary. The carrier liquid preferentially wets and subsequently permeates the porous wall. The incoming flow pushes the carrier liquid through the porous wall, causing it to accumulate on the exterior until it is of sufficient weight to drip from the capillary into a collection vial. This process repeats, with new carrier liquid collecting on the exterior of the porous capillary until the next drip occurs, thereby allowing carrier liquid to be extracted indefinitely from the channel without any drop in separation efficiency. A continuous (single-phase) stream of solvent is left flowing through the porous tubing and emerges at the outlet. The outflowing solvent may then be transferred to a vial for collection or passed into the next stage of a multistep chemical process as required.
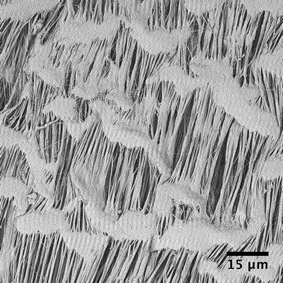
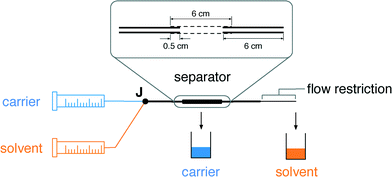
The separators are formed from short (6 cm) lengths of commercially sourced porous PTFE tubing of internal diameter (ID) 1.8 mm and outer diameter (OD) 2.5 mm. The porous PTFE has a “stringy” microstructure, with pores of up to a few microns in width and up to 30 μm in length, as can be seen from the scanning electron micrograph in Fig. 1. In consequence porous PTFE has a soft rubbery consistency that prevents its direct connection to standard microfluidic fittings. To overcome this limitation we partially insert short (6 cm) lengths of conventional rigid PTFE into each end of the porous tubing and fix them in place with a small amount of adhesive (see inset to Fig. 2 and Methods). By ensuring the adhesive is applied locally at the extremities of the porous tubing, contact between the flowing liquids and the glue is avoided, allowing the bond to remain intact regardless of the choice of solvent or carrier liquid. With the rigid PTFE tubing in place, the separators can be readily attached to other chip- or capillary-based microreactors.
The separator relies on the difference in the capillary pressure of the carrier and solvent to induce and maintain separation. Treating the pores of the separator walls as cylinders of radius R (for simplicity), the Young–Laplace equation (eqn (1)) can be used to calculate the capillary pressure ΔPc that must be overcome for a liquid to penetrate a pore:
 | (1) |
| ΔPoutlet < ΔPsolventc | (2) |
If this is not the case, a fraction of the solvent will be forced through the capillary walls, leading to its incomplete recovery at the outlet. At the same time the carrier (the wetting phase) must completely penetrate the walls so that none of it reaches the outlet channel. Hence ΔPoutlet must be greater than the capillary pressure for the carrier ΔPcarrierc:
| ΔPoutlet > ΔPcarrierc | (3) |
If this is not the case, a fraction of the carrier will pass through the entire length of the porous tubing without being depleted through the walls, causing a mixture of carrier and solvent to emerge at the outlet. It follows that to achieve perfect phase separation ΔPoutlet must lie in the range:
| ΔPsolventc > ΔPoutlet > ΔPcarrierc | (4) |
Since ΔPsolventc and ΔPcarrierc are determined by the intrinsic properties of the two liquids and the pore size distribution of the porous capillary, perfect separation can only be achieved by tuning ΔPoutlet until it satisfies the inequality in eqn (4).
Experimentally we find that, in passing common laboratory solvents of low to moderate viscosity through the porous capillary, the outlet pressure is typically too low to achieve perfect separation, causing carrier liquid to leak through the outlet. The outlet pressure drop ΔPoutlet is related to the length l and diameter d of the outlet channel by the Hagen–Poiseuille equation:
 | (5) |
2.2 Inline liquid–liquid separation
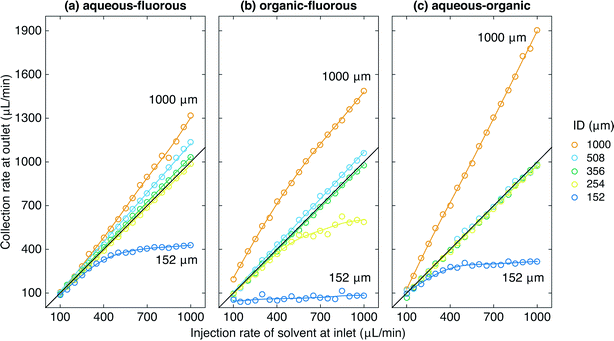
Fig. 2 shows the experimental set up used to study the behaviour of the porous capillary separator. A segmented flow was generated by separately pumping two immiscible liquids into the two inlets of a machined “two-in-one-out” PTFE junction (see Methods). The outlet of the junction was in turn connected to the inlet of the separator. To increase the outlet pressure beyond that provided by the separator alone, pieces of narrow tubing of varying diameter and length were coupled to the end of the separator using standard fluidic fittings. The liquid emerging from the outlet of the separator (plus flow restriction) was collected into a vial sitting on a mass balance, while liquid emerging from the walls of the porous tubing was collected into a second vial. The volumetric collection rate of liquid at the outlet of the separator was determined using the procedure outlined in the Methods section. For the measurements reported here the carrier and solvent were injected at equal volumetric flow rates—a common situation for two-phase systems—but the porous capillary has previously been found to provide efficient separation even when the carrier liquid is in large (ten-fold) excess.18Fig. 3a shows for an aqueous–fluorous segmented flow the measured volumetric collection rate of liquid at the outlet versus the volumetric injection rate of solvent at the inlet, using various diameters d of flow restriction between 152 and 1000 μm (length l = 5 cm in all cases). The (non-experimental) black line denotes ideal behavior, i.e. 100% separation efficiency, in which the collection rate of solvent at the outlet is equal to the injection rate of solvent at the inlet. Experimental separation curves that lie above this line correspond to incomplete depletion of the carrier liquid, causing the volume of collected liquid to exceed the volume of injected solvent. Separation curves that lie below this line correspond to incomplete recovery of the solvent due to loss through the walls of the porous capillary.
The aqueous–fluorous separation curves obtained using the three widest flow restrictions all lay above the ideal line, indicating incomplete removal of the carrier liquid through the capillary walls. The “steepness” of the curves decreased as the diameter was reduced from 1000 to 508 to 356 μm, consistent with the increasing pressure drop ΔPoutlet forcing more of the carrier liquid to deplete through the porous walls of the capillary. Visual inspection of the collection vials confirmed this to be the case: substantial contamination of the solvent by the carrier liquid was evident in the outlet vial in each case, with the amount of carrier liquid falling as the diameter of the flow restriction was reduced. (The other vial contained carrier liquid only, indicating no loss of solvent through the capillary walls).
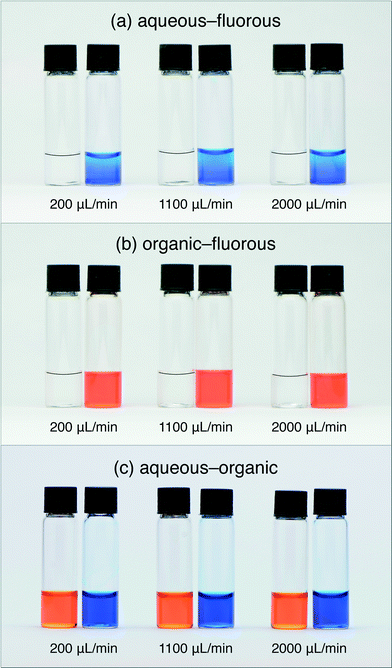
Reducing the diameter of the flow restriction further to 254 μm yielded a straight-line response of slope m = 0.980 ± 0.004, corresponding closely to the ideal line for perfect separation. Visual inspection of the two vials confirmed this to be the case, with no cross contamination evident in either vial for any of the flow rates tested, see Fig. 4a. Reducing the diameter still further to 152 μm yielded a separation curve below the ideal line, indicating incomplete recovery of the solvent (as a result of its partial depletion through the porous walls of the capillary). Visual inspection of the two vials confirmed this to be the case: while the outlet vial contained only solvent, there was substantial contamination of the carrier liquid by the solvent in the other vial. (Note, although the separation under these conditions is imperfect, it could nonetheless be acceptable for some analytical applications where complete removal of the carrier liquid—as opposed to full recovery of the analyte—is the key requirement).
Fig. 3b shows equivalent curves for an organic–fluorous fluid stream. The same general behavior was observed as before, with the widest flow restrictions leading to separation curves that lay above the ideal line, and the narrowest flow restrictions leading to separation curves that lay below the ideal line. A 356 μm diameter flow restriction was found to yield the optimum behavior with a slope m = 0.982 ± 0.005, corresponding to near-perfect separation. For this choice of flow restriction visual inspection confirmed the complete separation of the two liquids at each of the flow rates tested, with no cross contamination visible in either vial, see Fig. 4b.
Fig. 3c shows equivalent curves for an aqueous–organic fluid stream. With the widest flow restriction of 1000 μm, a linear response was observed with a slope of m = 1.86 ± 0.03 consistent with over 75% of the carrier liquid exiting through the outlet. Flow restrictions of 508, 356 and 254 μm all yielded close to ideal behavior with slopes of m = 1.00 ± 0.01, 0.978 ± 0.008, and 0.976 ± 0.003 respectively, signifying near-perfect separation in each case. Fig. 4c shows complete separation of the aqueous and organic phases, with no cross-contamination, for the case of a 254 μm diameter flow restriction. The narrowest 152 μm flow restriction yielded a sub-linear response due to significant depletion of water through the porous walls of the capillary.
It is evident from Fig. 3 that near-perfect liquid–liquid separation can be achieved for aqueous–fluorous, organic–fluorous and aqueous–organic fluid streams by carefully tuning the diameter of the flow restriction. However, since the outlet pressure is inversely proportional to the fourth power of the diameter (ΔPoutlet ∝ d−4, see eqn (5)), varying the diameter of the flow restriction may sometimes provide an overly coarse means of controlling the outlet pressure drop. A better approach in these circumstances is to vary the length of the outlet channel, exploiting the linear relationship between ΔPoutlet and l. In this way, d and l can be used as coarse and fine controls over the separation efficiency, enabling the widest possible operating window to be achieved for the liquid–liquid system under study.
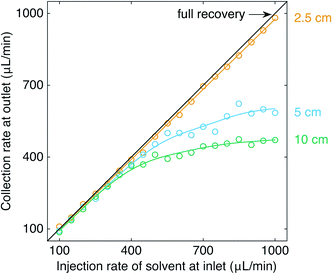
Fig. 5 shows for an organic–fluorous segmented flow the volumetric collection rate at the outlet versus the volumetric injection rate of solvent at the inlet, using three different flow restrictions of common diameter d = 254 μm and lengths l = 2.5, 5 and 10 cm. For l = 10 cm, the separation curve followed the ideal line up to solvent injection rates of approximately 300 μL min−1, denoting near-perfect separation. At higher injection rates of solvent, however, the increasing outlet pressure (see eqn (5)) caused the solvent to permeate the separator walls, causing the separation curve to fall below the ideal line. At the highest solvent injection rate of 1000 μL min−1, less than half (47%) of the solvent was recovered at the outlet.
Halving the length of the flow restriction to 5 cm brought the separation curve closer to the black line, with the reduced outlet pressure causing less solvent to permeate the separator walls. Shortening the outlet channel still further to l = 2.5 cm resulted in a linear separation curve (m = 0.976 ± 0.006) close to the black line, indicating near-perfect separation over the range of injection rates tested. Hence, it is evident that l as well as d may be tuned to achieve complete separation of the two liquids.
2.3 Inline liquid–liquid extraction
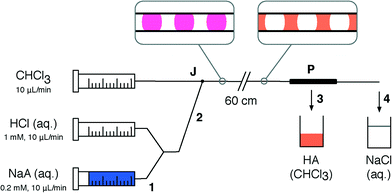
To demonstrate the suitability of the separator for inline flow processing, we implemented a liquid–liquid extraction using the pH indicator 2,6-dichloroindophenol, referred to here as HA. Since HA is a weak acid (pKa = 5.9 (ref. 27)) it is neutrally charged, and readily dissolves in organic solvents to form orange-coloured solutions. When deprotonated with a strong base such as NaOH it forms the negatively-charged conjugate base A−, rendering it soluble in water as a blue solution.Fig. 6 shows a schematic of the set-up for the aqueous–organic extraction. Aqueous solutions of conjugate base NaA (blue) and HCl (colourless) were pumped from separate syringe pumps at 10 μL min−1 each into a Y-mixer, producing HA (pink). To extract HA from the aqueous feed, a water–chloroform segmented flow was generated by connecting the outlet of the Y-mixer to one inlet of a two-in-one-out junction (see Methods), while chloroform was pumped at 10 μL min−1 into the other inlet. Chloroform preferentially wetted the PTFE walls of the channel and so acted as the carrier phase. As the segmented flow passed along the 60 cm channel, the aqueous phase gradually changed from pink to colourless, while the chloroform changed from colourless to orange, indicating successful extraction of HA from water into chloroform. Finally, the aqueous–organic segmented flow was separated using a porous PTFE separator (with d = 254 μm, l = 5 cm flow restriction). The orange organic phase containing HA permeated the walls of the separator and was collected into a vial. The aqueous phase was collected from the outlet of the separator into a separate vial (colourless).
Fig. 7 shows a photograph of the liquids at each stage of the process and the UV-visible absorption spectra of the aqueous feed (2), the organic extract (3) and the aqueous raffinate (4). Comparing the absorption spectra of the feed and the raffinate, it is evident that the aqueous phase has been virtually depleted of HA, while solution 3 now shows a strong absorption spectrum characteristic of HA in chloroform. Comparing the peak absorbances of solutions 2 and 4 at 519 nm (0.458 and 0.005 respectively), it is evident that there is an approximate 100-fold reduction in HA concentration after chloroform extraction.
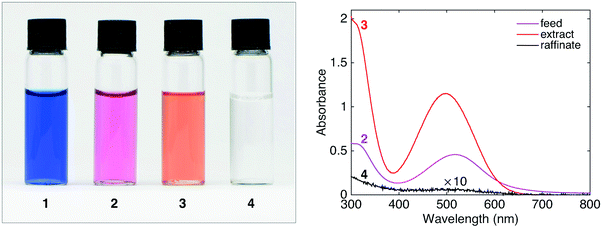 | ||
| Fig. 7 Left: Photographs of NaA (aq.) (1), HA (aq.) (2), extract HA (CHCl3) (3), and raffinate NaCl (aq.) (4) obtained using the set-up in Fig. 6. Right: UV-visible absorption spectra of the feed (2), extract (3), and raffinate (4). | ||
3 Conclusions
In conclusion we have demonstrated the use of a porous PTFE capillary for the inline separation of aqueous–fluorous, organic–fluorous, and aqueous–organic segmented flows. When a suitable back pressure is established (e.g. by adding a flow restriction of appropriate diameter and length), separation of the two phases can be reliably achieved over a wide range of flow rates.As a practical demonstration of the utility of the separator a simple inline aqueous–organic extraction was carried out using the pH indicator 2,6-dichloroindophenol. Extraction of the indicator from an aqueous solution into chloroform using a segmented flow, followed by liquid–liquid separation in a porous capillary, resulted in a continuous aqueous exit stream that had been almost completely depleted of indicator.
4 Methods
4.1 Two-in-one-out junction
A two-in-one-out junction was machined from PTFE round stock (RS Components) on a 4-axis CNC mill to the design in ref. 28. A channel was drilled for the inlet of the carrier and the outlet of the two-phase flow. A second channel for the solvent inlet was drilled to create a junction of the two channels with an intersection angle of 60°. Holes were drilled and tapped (1/4"-28 UNF) to allow connection of tubing using Upchurch flangeless fittings.4.2 Fabrication of separator
Loctite 770 primer was applied to the outer surface of the last 5 mm of two 6 cm lengths of non-porous PTFE tubing (Polyflon Technology Ltd, 1 mm ID, 2 mm OD). The primed ends were inserted 5 mm into each end of a 6 cm length of porous PTFE capillary (Aeos, Zeus Industrial Products, 1.8 mm ID, 2.5 mm OD, 15 μm to 25 μm internodal distance) to give a 5 cm length of exposed porous tubing. To secure the rigid PTFE in place, Loctite 406 adhesive was applied to the outside of the porous PTFE where the ends of the tubing overlapped.4.3 Testing of separator
Toluene (>99.5%, VWR) and Galden HT230 (Solvay Solexis) were used as the organic and fluorous phases respectively. Deionized water was obtained from a Millipore Direct-Q UV 3 system. Water and toluene were dyed with methylene blue and Sudan II, respectively (Sigma-Aldrich). Fluorinated ethylene propylene tubing (Upchurch) was used for the flow restrictions, with the exception of the 1000 μm ID flow restriction, which was PTFE. Unless specified otherwise, all other tubing was PTFE with an ID of 1 mm and an OD of 2 mm.A Syrris Asia syringe pump was used to control the volumetric injection rates of the solvent and carrier liquid into the inlets of the two-in-one-out junction. The volumetric collection rate of liquid at the separator outlet was determined by collecting the liquid into a vial on a mass balance and recording the change in mass over a fixed period of time as described below.
The solvent and carrier liquid were pumped at equal volumetric flow rates to give a total flow rate (TFR) of 200 μL min−1 to 2000 μL min−1. TFRs were tested in a randomized order. For each TFR, the liquids were infused for two minutes to allow the separator to reach steady state. The pumps were briefly stopped to record the mass of liquid mi on the mass balance. The pumps were then restarted and run for a collection time Δt of four minutes, before stopping and again recording the mass mf. The collected mass Δm of liquid over the four minute duration was determined from Δm = mf − mi.
In the case of perfect separation, pure solvent was collected at the outlet and pure carrier liquid was collected through the walls of the separator. For imperfect separation, a mixture of the two liquids was only observed in one of the two vials: either a mixture of the two liquids was collected at the outlet, while pure carrier liquid was extracted through the walls of the separator; or pure solvent was collected at the outlet, while a mixture of the two liquids was collected through the walls of the separator. Liquid–liquid mixtures were never observed in the two collection vials simultaneously.
The injected mass Δm* of solvent is given by Δm* = QinρsΔt where Qin and ρs are the volumetric injection rate and the density of the solvent respectively. For the case where pure solvent was collected at the outlet, Δm ≤ Δm*, and the volumetric collection rate of liquid was calculated as:
 | (6) |
 | (7) |
4.4 Inline extraction
2,6-Dichloroindophenol sodium salt hydrate (NaA, 5.5 mg, ≥90%, Sigma-Aldrich) was dissolved in 100 mL deionized water to produce a 0.19 mM (anhydrous basis) solution. HCl (37%, VWR) was diluted to give a 1 mM solution. Liquids were pumped from gas-tight syringes (Hamilton) using Harvard Pump 11 Plus syringe pumps. NaA (aq.) and HCl (aq.) were injected at 10 μL min−1 each into a Y-mixer (Upchurch). The outlet of the mixer was connected to a two-in-one-out junction where the aqueous phase was combined with chloroform (99.0–99.6%, VWR, 10 μL min−1) to generate a segmented flow. The segmented flow was passed through 60 cm of PTFE tubing, and into the inlet of a porous capillary separator with a d = 254 μm and l = 5 cm flow restriction. The chloroform emerging through the walls of the capillary and the aqueous phase emerging from the separator outlet were collected in separate vials. UV-visible absorption spectra were recorded with a Unicam UV 500 spectrometer, using quartz cuvettes (10 mm path length, Lightpath Optical (UK) Ltd).4.5 Scanning electron microscopy
A small piece of porous PTFE capillary was attached to a sample stub using carbon tape, sputtered with 5 nm chromium, and then examined using an FEI Phenom scanning electron microscope.Acknowledgements
TWP is funded by the EPSRC through a Centre for Doctoral Training in Plastic Electronics (grant number EP/G037515/1). JHB is funded by an EPSRC Knowledge Transfer Secondment (grant number EP/K503733/1) and holds an Industrial Fellowship with the Royal Commission for the Exhibition of 1851.References
- H. Song, D. L. Chen and R. F. Ismagilov, Angew. Chem., Int. Ed., 2006, 45, 7336–7356 CrossRef CAS PubMed.
- K. Choi, A. H. Ng, R. Fobel and A. R. Wheeler, Annu. Rev. Anal. Chem., 2012, 5, 413–440 CrossRef CAS PubMed.
- X. Niu and A. J. deMello, Biochem. Soc. Trans., 2012, 40, 615–623 CrossRef CAS PubMed.
- A. M. Nightingale and J. C. deMello, Adv. Mater., 2013, 25, 1813–1821 CrossRef CAS PubMed.
- T. W. Phillips, I. G. Lignos, R. M. Maceiczyk, A. J. deMello and J. C. deMello, Lab Chip, 2014, 14, 3172–3180 RSC.
- G. Niu, A. Ruditskiy, M. Vara and Y. Xia, Chem. Soc. Rev., 2015 10.1039/C5CS00049A.
- Y. Zhu and Q. Fang, Anal. Chim. Acta, 2013, 787, 24–35 CrossRef CAS PubMed.
- J. Ji, Y. Zhao, L. Guo, B. Liu, C. Ji and P. Yang, Lab Chip, 2012, 12, 1373–1377 RSC.
- E. Quevedo, J. Steinbacher and D. T. McQuade, J. Am. Chem. Soc., 2005, 127, 10498–10499 CrossRef CAS PubMed.
- D. Ciceri, J. M. Perera and G. W. Stevens, J. Chem. Technol. Biotechnol., 2014, 89, 771–786 CrossRef CAS PubMed.
- M. O'Brien, P. Koos, D. L. Browne and S. V. Ley, Org. Biomol. Chem., 2012, 10, 7031–7036 Search PubMed.
- D. X. Hu, M. O'Brien and S. V. Ley, Org. Lett., 2012, 14, 4246–4249 CrossRef CAS PubMed.
- J. F. B. Hall, X. Han, M. Poliakoff, R. A. Bourne and M. W. George, Chem. Commun., 2012, 48, 3073–3075 RSC.
- O. K. Castell, C. J. Allender and D. A. Barrow, Lab Chip, 2009, 9, 388–396 RSC.
- X. Z. Niu, B. Zhang, R. T. Marszalek, O. Ces, J. B. Edel, D. R. Klug and A. J. deMello, Chem. Commun., 2009, 6159–6161 RSC.
- J. G. Kralj, H. R. Sahoo and K. F. Jensen, Lab Chip, 2007, 7, 256–263 RSC.
- A. E. Cervera-Padrell, S. T. Morthensen, D. J. Lewandowski, T. Skovby, S. Kiil and K. V. Gernaey, Org. Process Res. Dev., 2012, 16, 888–900 CrossRef CAS.
- J. H. Bannock, T. W. Phillips, A. M. Nightingale and J. C. deMello, Anal. Methods, 2013, 5, 4991–4998 RSC.
- A. Adamo, P. L. Heider, N. Weeranoppanant and K. F. Jensen, Ind. Eng. Chem. Res., 2013, 52, 10802–10808 CrossRef CAS.
- X. Wang and R. M. Barnes, J. Anal. At. Spectrom., 1988, 3, 1091–1095 RSC.
- M. Yamamoto, Y. Obata, Y. Nitta, F. Nakata and T. Kumamaru, J. Anal. At. Spectrom., 1988, 3, 441–445 RSC.
- R. M. Barnes and X. Wang, J. Anal. At. Spectrom., 1988, 3, 1083–1089 RSC.
- X. Wang, M. Viczian, A. Lasztity and R. M. Barnes, J. Anal. At. Spectrom., 1988, 3, 821–827 RSC.
- J. H. Bannock, S. H. Krishnadasan, A. M. Nightingale, C. P. Yau, K. Khaw, D. Burkitt, J. J. M. Halls, M. Heeney and J. C. de Mello, Adv. Funct. Mater., 2013, 23, 2123–2129 CrossRef CAS PubMed.
- A. M. Nightingale, T. W. Phillips, J. H. Bannock and J. C. de Mello, Nat. Commun., 2014, 5, 3777 CAS.
- J. H. Bannock, M. Al-Hashimi, S. H. Krishnadasan, J. J. M. Halls, M. Heeney and J. C. de Mello, Mater. Horiz., 2014, 1, 214–218 RSC.
- J. M. Armstrong, Biochim. Biophys. Acta, 1964, 86, 194–197 CrossRef CAS.
- A. M. Nightingale, J. H. Bannock, S. H. Krishnadasan, F. T. F. O'Mahony, S. A. Haque, J. Sloan, C. Drury, R. McIntyre and J. C. deMello, J. Mater. Chem. A, 2013, 1, 4067–4076 CAS.
| This journal is © The Royal Society of Chemistry 2015 |

