 Open Access Article
Creative Commons Attribution 3.0 Unported Licence
Doping of inorganic materials in microreactors – preparation of Zn doped Fe3O4 nanoparticles†
M. D.
Simmons
ab,
N.
Jones
a,
D. J.
Evans
a,
C.
Wiles
ac,
P.
Watts
d,
S.
Salamon
e,
M.
Escobar Castillo
f,
H.
Wende
e,
D. C.
Lupascu
f and
M. G.
Francesconi
*a
aDepartment of Chemistry, University of Hull, Cottingham Road, Hull HU6 7RX, UK. E-mail: m.g.francesconi@hull.ac.uk
bMolecular Vision, Abingdon Health Ltd., Sand Hutton, York, YO41 1LZ, UK
cChemtrix BV, Chemelot Campus, Urmonderbaan 22, 6167 RD, Geleen, The Netherlands
dInnoVenton: NMMU Institute for Chemical Technology, Nelson Mandela Metropolitan University, PO Box 77 000, Port Elizabeth, 6031, South Africa
eFaculty of Physics and Center for Nanointegration Duisburg-Essen (CENIDE), University of Duisburg-Essen, 47048, Duisburg, Germany
fInstitute for Materials Science and Center for Nanointegration Duisburg-Essen (CENIDE), University of Duisburg-Essen, 45141, Essen, Germany
First published on 5th June 2015
Abstract
Microreactor systems are now used more and more for the continuous production of metal nanoparticles and metal oxide nanoparticles owing to the controllability of the particle size, an important property in many applications. Here, for the first time, we used microreactors to prepare metal oxide nanoparticles with controlled and varying metal stoichiometry. We prepared and characterised Zn-substituted Fe3O4 nanoparticles with linear increase of Zn content (ZnxFe3−xO4 with 0 ≤ x ≤ 0.48), which causes linear increases in properties such as the saturation magnetization, relative to pure Fe3O4. The methodology is simple and low cost and has great potential to be adapted to the targeted doping of a vast array of other inorganic materials, allowing greater control on the chemical stoichiometry for nanoparticles prepared in microreactors.
Introduction
Microreactors are used as a common tool for the study and optimization of a wide variety of synthetic organic reactions, but also increasingly in the synthesis of organic and inorganic nanoparticles. When compared to conventional batch reactions, microreactors offer many practical advantages, such as continuous processing and highly controlled reaction conditions e.g. low and precisely controllable mass transfer times.1–3 This has culminated in “black box” techniques, which seek to automate these synthetic processes completely, on the basis of specific product properties, affording quality by design.4Greater control of reaction conditions has led to vastly greater yields and stereoselectivity in the preparation of organic compounds, and to smaller particle sizes and increased monodispersity in the preparation of nanoparticles.3,4 Microreactor systems are now able to produce a diverse array of metal nanoparticles, including Au,5 Ag,6 and Au–Ag nanoalloys,7 metal oxide nanoparticles including TiO2 (ref. 8) and SiO2 (ref. 9) and non-oxide compounds such as CdSe.10 Recently, such devices have been used for the synthesis of iron oxide nanoparticles.11–13 Iron oxide nanoparticles (IONs) have multiple uses in technology, but recent research has focussed mainly on their use in biomedicine as magnetic resonance imaging (MRI) contrast agents and hyperthermia treatments for arteriosclerosis and cancer.14
Magnetic hyperthermia treatments use magnetic nanoparticles to induce death of cancer cells by heating the tissue; as magnetic nanoparticles can be engineered to target specific cells, consequently invasive surgery can be avoided. Furthermore, magnetic nanoparticles are favoured for hyperthermia treatments compared to gold nanoparticles as they are activated by external application of a magnetic field and do not require potentially harmful laser light.15
Fe3O4, magnetite, exhibits the inverse spinel structure (space group Fd![[3 with combining macron]](https://www.rsc.org/images/entities/char_0033_0304.gif) m).16 The oxide anions form a face centred cubic sublattice, with half of the Fe3+ cations occupying the tetrahedral holes and the other half occupying the octahedral holes together with the Fe2+ cations. The cubic unit cell has a lattice parameter of 8.3985(5) Å and contains eight Fe3O4 formula units, so that a more representative formula can be written as [(Fe3+)8]TET[(Fe3+Fe2+)8]OCTO32.17
m).16 The oxide anions form a face centred cubic sublattice, with half of the Fe3+ cations occupying the tetrahedral holes and the other half occupying the octahedral holes together with the Fe2+ cations. The cubic unit cell has a lattice parameter of 8.3985(5) Å and contains eight Fe3O4 formula units, so that a more representative formula can be written as [(Fe3+)8]TET[(Fe3+Fe2+)8]OCTO32.17
Substitution of various transition metals into the spinel structure can have varying effects upon both the structural and magnetic properties of the material. Partial substitution of iron with zinc leads to the ZnxFe3−xO4 series (0 ≤ x ≤ 1), within which the compound with x ≈ 0.3 was reported to show a maximum in the value of the saturation magnetisation.18
Zinc ferrites exhibit the normal spinel structure (Fd![[3 with combining macron]](https://www.rsc.org/images/entities/char_0033_0304.gif) m a = 8.4432(3) Å) in which most Zn2+ cations occupy the tetrahedral sites and the Fe3+ cations the octahedral sites (Fig. S1†).19
m a = 8.4432(3) Å) in which most Zn2+ cations occupy the tetrahedral sites and the Fe3+ cations the octahedral sites (Fig. S1†).19
The magnetic properties of Fe3O4 are due to superexchange interactions between the Fe cations and mediated by the oxide anions. These interactions can be intra-site, when they occur between Fe cations on the tetrahedral sites, (Fe3+)TET–O–(Fe3+)TET, or between iron cations on the octahedral sites, (Fe3+)OCT–O–(Fe3+)OCT/(Fe3+)OCT–O–(Fe2+)OCT, and, inter-sites, when occurring between cations on the octahedral and tetrahedral sites, (Fe3+)TET–O–(Fe3+/Fe2+)OCT. Inter-site superexchange interactions are much stronger and will contribute the most to the magnetic properties. In the ZnxFe3−xO4 series (0 ≤ x ≤ 1) Zn2+ occupies the tetrahedral sites, hence substituting for Fe3+ into the structure of Fe3O4. According to Wen, for x < 0.37 the effect of the substitution of the diamagnetic Zn2+ for Fe3+ lowers the magnetisation of the tetrahedral site, increasing the magnetisation of the whole compound. However, for x > 0.37 the magnetisation of the A site becomes much weaker, to the point that (Fe3+)OCT–O–(Fe3+)OCT/(Fe3+)OCT–O–(Fe2+)OCT become the main super-exchange interactions and the total magnetisation decreases.20
Similarly to IONs, ZnxFe3−xO4 nanoparticles are being studied as both MRI contrast agents and for hyperthermia treatments of cancer cells, complementary to IONs, due to the increased magnetisation obtained for x < 0.37 and larger T2 relaxivity.20,21
ZnxFe3−xO4 nanoparticles are mostly prepared via co-precipitation methods and solvothermal methods.19,20,22–26 Here, we report a simple one-step synthetic method to prepare ZnxFe3−xO4 samples with controlled and varied Zn content (0 ≤ x ≤ 0.5) using microreactors. This technique allows for the continuous production of zinc doped iron oxide nanoparticles with controlled magnetic and physical properties, which would be difficult to achieve in a reliable manner through the use of current batch techniques.
A method based on two interconnected microreactors and comprising a heating step, has been recently used by Abou-Hassan et al. to prepare CoFe2O4.27 However, to the best of our knowledge, no microreactor based methods have been reported for the preparation of Zn-containing ferrites and, more importantly, for solid solutions with variable metal content.
Experimental
Synthesis
The synthetic procedure is based on the methodology reported for the preparation of un-doped iron oxide in microreactors, reported recently by Simmons et al.12 A schematic diagram of the microreactor used is shown in Fig. 1. The microreactor comprised of one etched layer and one cover plate, which, upon bonding, afforded isotropic channels of a depth of 60 μm and width of 300 μm (volume 10 μl).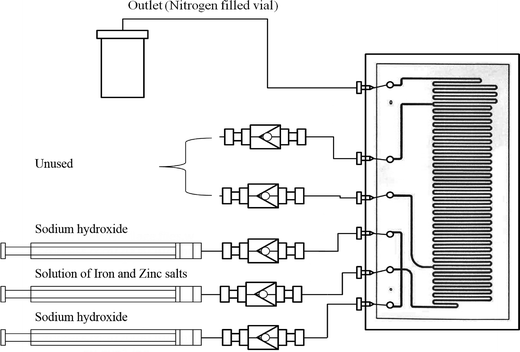 | ||
| Fig. 1 Schematic diagram for the microreactor set up used in the syntheses of ZnxFe3−xO4 nanoparticles. | ||
To prepare pure iron oxide nanoparticles, an iron salts precursor solution (ISPS) was prepared by mixing stoichiometric volumes of FeCl2·4H2O (0.01 mol dm−3) in HCl (1.10 mol dm−3) and FeCl3 (0.02 mol dm−3) in HCl (1.10 mol dm−3), and a base solution, NaOH (1.00 mol dm−3) was also prepared. The solutions were pumped into the microreactor simultaneously.
The synthesis of ZnxFe3−xO4 was achieved via a modified version of the above procedure (Fig. 2b), according to the general equation, where x = 0–0.5:
| xZnCl2 + (1 − x)FeCl2 + 2FeCl3 + 8NaOH → ZnxFe3−xO4 + 4H2O + 8NaCl |
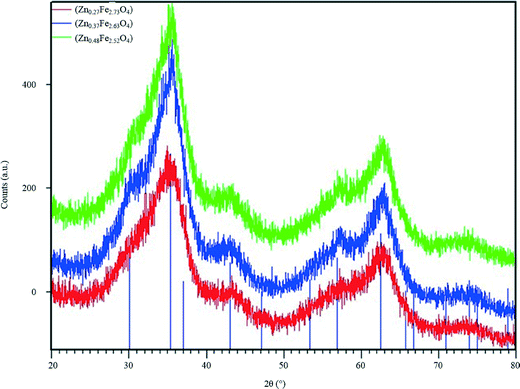 | ||
| Fig. 2 PXRD patterns of ZnxFe3−xO4 series synthesised using microreactors. The lines represent the PXRD pattern for magnetite, calculated from the model reported by Fleet.30 | ||
A solution of iron and zinc salts was prepared by mixing stoichiometric volumes of FeCl2·4H2O (0.01 mol dm−3) in HCl (1.10 mol dm−3), FeCl3 (0.02 mol dm−3) in HCl (1.10 mol dm−3), and ZnCl2 (0.01 mol dm−3) in HCl (1.10 mol dm−3) (Fig. 1).
The volumes of solutions of the reagents used in this work are listed in Table 1.
| Volume of ZnCl2 (0.01 M) (ml) | Volume of FeCl2 (0.01 M) (ml) | Volume of FeCl3 (0.02 M) (ml) |
|---|---|---|
| 1.25 | 11.25 | 12.5 |
| 2.50 | 10.00 | |
| 3.75 | 8.75 |
The Labtrix® Start system was used for these experiments, with glass microreactor design 3025, further details can be found in the paper by Simmons et al.12
The solutions were pumped into the reactor along with a solution of NaOH (1.00 mol dm−3). Oxidation of Fe2+ was prevented by de-oxygenating all solutions for 1 hour by bubbling nitrogen through them prior to use.11 As the precipitation of iron oxide nanoparticles is pH controlled and occurs mainly at basic pH, acidifying the ISPS favours the formation of the nanoparticles in the central microchannel upon addition of NaOH.
The precursor solution was pumped into the central microchannel (mod-ISPS), while the base was pumped through the two lateral micro channels. By “focusing” the precursor solution between the two flows of base, the area upon which nanoparticles can adhere to the microreactor walls was minimised, thus greatly reducing the amount of precipitating nanoparticles upon the microreactor walls and preventing blocking of the channel. Flow rates of 2000 μl h−1 per feed line (6000 μl h−1 total flow rate) were used, flow rates <1500 μl h−1 led to clogging of the microreactor, while flow rates >6000 μl h−1 led to an undesired elevated pressure drop. Under these conditions, we calculate residence times ranging from 6 to 24 s and Re numbers of 10.3 to 3 respectively which confirm the work is performed under a laminar flow regime. No back pressure regulator was fitted to the outlet of the microreactor. Photos of the equipment are shown in the ESI† section (Fig. S2).
ZnxFe3−xO4 nanoparticles formed and precipitated within the channels and were carried through to the outlet tube where they were collected in a N2 filled vial.
Magnetic nanoparticles were removed from the liquid phase via magnetic decantation and further washed with deionised water and ethanol to remove any sodium chloride by-product. No thermal steps were included in the procedure, except an overnight drying stage under argon at 100 °C.
Characterisation
Powder X-ray Diffraction (PXRD) patterns were collected using a Bruker D5000 diffractometer with Cu Kα radiation over the range 20 ≤ 2θ° ≤ 80, with a step size of 0.02° and a time step of 28 seconds per step.For ICP-AES analyses, the samples (approximately 0.03 g) were dissolved in 3 ml of conc. HCl, while heated on a hotplate. The dissolved samples were then diluted and the Fe and Zn content was measured in weight percentage of a 10 ml aliquot. Analysis was carried out using a Perkin Elmer Optima 5300DV instrument, Fe in radial view, Zn in axial view against calibration at 0 and 10 ppm Fe (238.204 nm) and Zn (206.200 nm).
Mössbauer spectra for the three ZnxFe3−xO4 (x = 0.3, 0.4, 0.5) were recorded at T = 80 K, on an ES-Technology MS-105 Mössbauer spectrometer. Spectra were referenced against 25 μm iron foil at 298 K and spectrum parameters were obtained by fitting with Lorentzian curves. Mössbauer spectra for the three ZnxFe3−xO4 (x = 0.3, 0.4, 0.5) and for Fe3O4 were also recorded at 4.2 K in transmission geometry using a constant acceleration spectrometer with a 57Co source (Rh-matrix) and a liquid helium bath cryostat. The setup was calibrated using α-Fe foil as reference at room temperature.
Magnetometry measurements were carried out using a Quantum Design MPMS-5S SQUID magnetometer. The saturation magnetisation was measured at 5 K and a maximum applied magnetic field of 5 T, while field-cooled (FC) and zero-field-cooled (ZFC) curves were recorded at an applied field of 0.1 T between 5 K and room temperature. Additionally, temperature dependent AC susceptibility measurements have been carried out to characterise the superparamagnetic blocking temperatures of each sample, using alternating magnetic fields with amplitude of 0.4 mT at 11 Hz. Magnetometry measurements and Mössbauer spectroscopy were carried out on the powders collected from the microreactor after washing and drying without further treatment.
The morphology of the powders was studied using a scanning electron microscope (ESEM Quanta 400 FEG) and a high-resolution transmission electron microscope (HR-TEM Tecnai F20) with a high-angle annular dark field detector. For the TEM analyses the synthesized powders were ground in a ball mill with zirconia oxide spheres in ethanol (consistent ratio powder/spheres 1 g/10 g) for 240 hours at 10 rpm and then sonicated for 10 min with an ultrasonic sonotrode (Bandelin Sonopuls HD 70).
Results and discussion
Recently we developed a simple synthetic method for the preparation of iron oxide nanoparticles (IONs) in commercially available micro-reactors.12 The synthesis is based on a laminar flow technique that grants careful control of precipitation while avoiding channel blockage. Furthermore, no fouling was observed for up to 40 hours of continuous operation. The IONs obtained were of comparable size and polydispersity to those previously prepared in ad hoc built continuous flow reactors, which constituted the first seminal works, but were somehow limited in the fact that upscaling would be complex with homemade reactors.11,13,28,29Considering the high degree of controllability achieved via our method, we have exploited it to achieve controlled doping in IONs. In particular, we focussed on ZnxFe3−xO4, with the view to varying the value of x, i.e. the Zn2+ content. The reactor design allowed three single reagent streams to come together, so that one solution of metal salts and two of a base solution could be reacted while pumped along the channel of the microreactor and produce a precipitate of nanoparticles, which are moved along by the flow and collected at the channels outlet. Under the laminar flow conditions employed, mixing occurs exclusively by molecular diffusion, and it needs to be emphasized that the speed of mixing is directly related to the thickness of the resulting lamella, with the proportion of mixing determined by the channel length. Consequently, the speed of precipitation is highly controlled and repeatable. Furthermore, under these flow conditions (6000 μl h−1 total, 2000 μl h−1 each feed line), the particles flow freely from the reactor avoiding blockage; no backpressure regulator (BPR) was employed.
The same technique was used for the preparation of ZnxFe3−xO4 nanoparticles by simply replacing a portion of the iron chlorides with zinc chloride in the initial solution. The amount of solutions of starting reagents are shown in Table 1.
ICP-AES analyses were carried out to determine the chemical formulae of the ZnxFe3−xO4 nanoparticles. The raw data obtained from ICP are expressed in weight percentages and shown in Table 2.
There is a linear increase of Zn content (value of x in the ZnxFe3−xO4 series) with increasing ZnCl2 in the initial mixture (and decreasing FeCl2), indicating that our simple route allows controllability of doping up to x = 0.5.
PXRD patterns of the ZnxFe3−xO4 series (Fig. 2) suffer badly from peak broadening. This is likely to be due to the very small size of the nanoparticles, and the presence of a small percentage of impurities cannot be ruled out completely. All three patterns of the ZnxFe3−xO4 compounds are compared and show little difference. The average two theta positions of the broad peaks can be related to the position of the diffraction peaks for Fe3O4, calculated using the cubic model reported by Fleet (Fd![[3 with combining macron]](https://www.rsc.org/images/entities/char_0033_0304.gif) m, a = 8.3941 Å), suggesting that the spinel structure is maintained throughout the Zn/Fe substitution carried out in this work.30 An additional heating step would probably have increased the crystallinity of the compounds, however it bears the risk of increasing the particle size.
m, a = 8.3941 Å), suggesting that the spinel structure is maintained throughout the Zn/Fe substitution carried out in this work.30 An additional heating step would probably have increased the crystallinity of the compounds, however it bears the risk of increasing the particle size.
PXRD data were used as an additional tool to estimate the particle size, after fitting the profile of all peaks, via the Williamson–Hall plot.31 The PXRD patterns of all samples were used with the exception of the sample with the lowest Zn content, Zn0.27Fe2.73O4, as the profile fit of the peak was not satisfactory. The average size of the nanoparticles was found to be 1.6 nm for Zn0.37Fe2.63O4 and 1.3 nm for Zn0.48Fe2.52O4, in good agreement with the results from size analysis of the particles, using TEM data (Fig. 3).
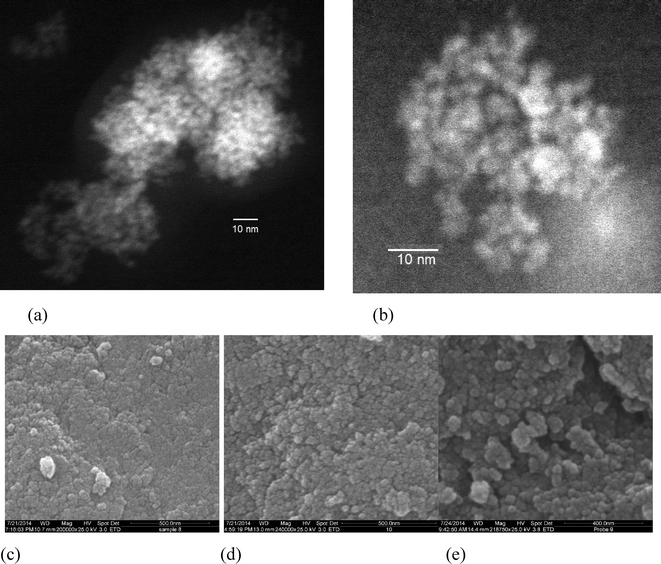 | ||
| Fig. 3 (a) and (b) TEM images of the sample Zn0.27Fe2.73O4; (c)–(e) SEM images of the nanoparticles of (c) Zn0.27Fe2.73O4; (d) Zn0.37Fe2.63O4; (e) Zn0.48Fe2.52O4. | ||
Fig. 3a and b show the TEM micrographs of Zn0.27Fe2.73O4 nanoparticles, after partial de-agglomeration. The TEM pattern confirms that the particles are spherical with a uniform grain size distribution. The measured particle size is visually estimated to be less than 5 nm, supporting the size analysis performed using the Scherrer formula and the Williamson–Hall plot.
It is interesting to point out that the average size of ZnxFe3−xO4 nanoparticles prepared via co-precipitation or sol–gel methods is generally above 10 nm, without the use of capping agents.
Fig. 3(c)–(e) shows SEM pictures of the nanoparticles for all the samples within the ZnxFe3−xO4 series, taken after drying. The particles appear approximately spherical, homogeneous in shape and size and highly agglomerated. This high degree of agglomeration is due to the fact that the particles were not coated after synthesis, and to their small size and magnetic properties.
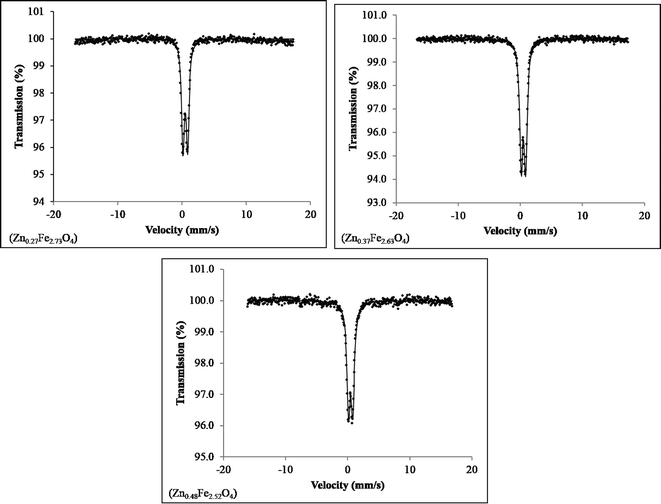
No impurities were detected in the Mössbauer spectra for the three ZnxFe3−xO4 (x = 0.27, 0.37, 0.48) samples collected at 80 K (Fig. 4), although close inspection of the baseline of the spectrum of the sample Zn0.27Fe2.73O4 shows some deviation, which may be due to a very small amount of another iron oxide (Fe3O4 or γ-Fe2O3) or a very broad six-line hyperfine component of the spectra. The spectrum of Fe3O4 was also collected for direct comparison (Fig. S3†) and no substantial differences could be noticed.
The Mössbauer isomer shift and quadropole splitting were seen to be of the same order as those seen in the literature (Table 3). The well-defined doublet seen in all spectra is common for nanosized zinc ferrite systems displaying superparamagnetic behaviour. The isomer shift and quadrupole splitting for each sample was higher than those seen for ZnFe2O4 nanoparticles at 85 K and Fe3O4 at 80 K, indicating different behaviour of the ZnxFe3−xO4 series, compared to both the end members of the solid solution.31 The half-width at half-maximum peak for the ZnxFe3−xO4 series increases slightly for x values from x = 0.3 to x = 0.5, hence supporting increasing substitution of Zn2+ in Fe3O4. The deviation from the baseline in the spectrum of Zn0.27Fe2.73O4, may be due to the sample being close to the blocking temperature at which point the expected sextet would emerge from the baseline.
| Sample | Isomer shift (mm s−1) | Quadrupole splitting (mm s−1) | Half width at half maximum (mm s−1) |
|---|---|---|---|
| Zn0.27Fe2.73O4 | 0.43 ± 0.02 | 0.71 ± 0.02 | 0.27 ± 0.02 |
| Zn0.37Fe2.63O4 | 0.45 ± 0.02 | 0.71 ± 0.02 | 0.31 ± 0.02 |
| Zn0.48Fe2.52O4 | 0.43 ± 0.02 | 0.70 ± 0.02 | 0.33 ± 0.02 |
| Fe3O4 | 0.34 ± 0.001 | 0.69 ± 0.002 | 0.31 ± 0.003 |
| ZnFe2O4 (ref. 31) | 0.39 | 0.59 | N/A |
Further spectra of the ZnxFe3−xO4 (x = 0.3, 0.4, 0.5) samples were collected at 4.2 K and are shown in Fig. S3 ESI.† The hyperfine field distribution fit was applied and the parameters obtained from the fitting procedure are summarized in Table S1 ESI,† including the mean hyperfine field Bhf, isomer shift, quadrupole shift and line width. Except for a slightly increased line width for the sample with the lowest amount of Zn doping, no noticeable changes could be detected throughout the doping series. The spectrum of Fe3O4 was also collected for direct comparison (Fig. S4†) and no substantial differences could be noticed, indicating that magnetic properties below TB are unchanged compared to pure Fe3O4.
Fig. 5 shows the saturation magnetisation as a function of Zn content for each of the observed samples. Each data point consists of four individual measurements of the magnetic moment at 5 K and ±5 T, with error bars being calculated from the standard deviation of the magnetic measurements and the uncertainty of the scale used to determine each sample's weight. Standard error propagation was used for the final error. The data display an increase of the magnetisation with Zn content by 35% from un-doped Fe3O4 up to the sample with the highest Zn doping. This is a clear indicator of a change in magnetic properties due to a change in Zn content. It should be noted however, that small fluctuations of the mean particle diameter can also be responsible for changes of the magnetisation values. Plotting magnetisation against mean particle diameter did not yield any recognizable pattern, leading us to conclude that the increased saturation magnetisation is caused mainly by Zn doping.
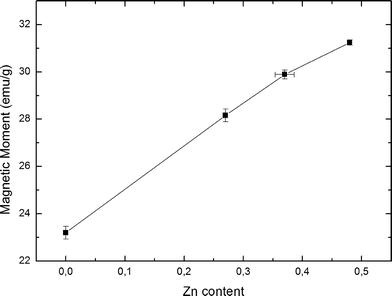 | ||
| Fig. 5 Saturation magnetic moments as function of increasing Zn content in ZnxFe3−xO4, at 5 K and 5 T. | ||
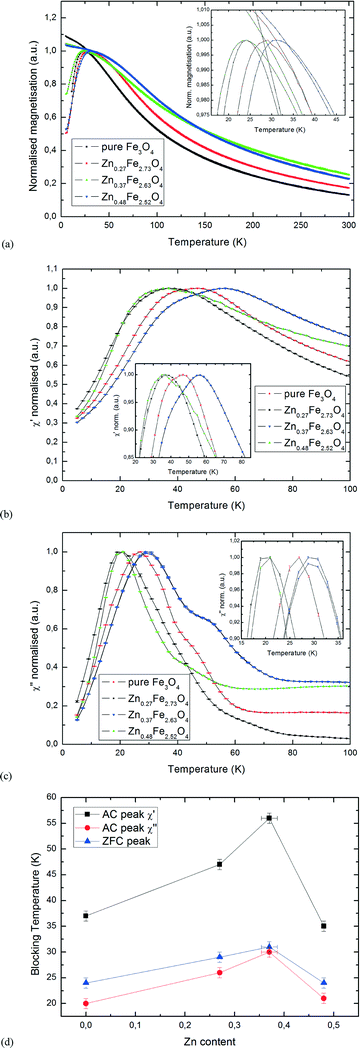
Fig. 6a shows the ZFC-FC curves of the ZnxFe3−xO4 samples, with the ZFC peaks being shown in the inset. The samples were cooled to 5 K at zero applied field, after which the field was ramped to 0.1 T, with the samples' magnetic moment being measured while warming up to room temperature, then cooling back down to 5 K. For better comparability, the curves were scaled so that the ZFC peaks have equal amplitude. No error bars are shown due to the constant change of temperature only allowing for one scan per measurement. The peaks obtained from ZFC measurements are indicative of the mean blocking temperature, TB, for superparamagnetic particles.
In addition to the ZFC-FC curves, data from AC susceptibility measurements was used to substantiate the determined blocking temperatures, and to examine the samples' superparamagnetic behaviour in greater detail. This specialized measurement option uses alternating magnetic fields to probe a sample's dynamic response, with two sets of data being produced: the magnitude of the susceptibility, χ, and the phase shift between applied and measured signal, φ, which can also be displayed as an in-phase (real) component χ′ and an out-of-phase (imaginary) component χ′′. The latter indicates dissipative processes in the sample, with peaks in the χ′′ versus T curve being a good indicator for blocking temperatures. Both sets of curves are displayed in Fig. 6b and c, with only the temperature region of interest around the peaks being shown (normalised). Samples were cooled to 5 K at zero applied field and the susceptibility was measured while heating to room temperature. To make sure that no thermal hysteresis effects are present, the measurement was run in both directions for one of the samples, Zn0.37Fe2.63O4. As seen in the diagrams, the two curves are perfectly identical. Generally speaking, all samples showed a distinct peak at low temperatures, clearly showing superparamagnetic behaviour. While the main peak of each sample is clearly visible, especially on the χ′′ curves, there are also secondary peaks or shoulders, best visible for Zn0.37Fe2.63O4. As superparamagnetic behaviour is strongly size-dependent, this indicates a particle size distribution that has two peaks, one main peak containing the majority of particles in the sample and a smaller peak. Due to this secondary peak being visible towards higher temperatures in the measurements, it can be assumed that the size distribution also has a small secondary peak at larger particle sizes. However, with particle sizes in the range of 1.3–1.6 nm, these fluctuations are assumed to be very small. Generally speaking, a good agreement can be seen between the peaks determined from the ZFC-FC curves and the ones determined from AC measurements, showing reproducible results by both static and dynamic magnetometry. As shown in Fig. 6d, our results indicate that a change in Zn content leads to a change of TB compared to the un-doped pure Fe3O4 sample, with Zn0.37Fe2.63O4 having the highest blocking temperature of all samples measured. Plotting the mean particle diameter against TB does not yield any clear pattern, with TB for Zn0.37Fe2.63O4 and Zn0.48Fe2.52O4 being 19 K apart while mean particle diameters for both samples were determined to be 1.3 nm. This proves that changes in TB are caused by the Zn doping rather than fluctuations in particle size.
Conclusions
Microreactors have been used for the synthesis of inorganic compounds, but this is the first report of chemical doping achieved via this technique. The synthesis of the series of zinc-doped Fe3O4, ZnxFe3−xO4 (0 ≤ x ≤ 0.48), nanoparticles was carried out using a reversed engineered microfluidic technique. The partial substitution of zinc for iron in magnetite, Fe3O4, shows a linear increase in Zn content with increase of ZnCl2 in the initial mixture of reagents. The ZnxFe3−xO4 (0 ≤ x ≤ 0.48) nanoparticles show average size below 5 nm, smaller than those obtained via more traditional methods such as co-precipitation or sol–gel. PXRD show that all samples show the spinel structure and Mössbauer spectra showed the nanoparticles to be superparamagnetic, at 80 K, with the width of the spectrum peak increasing linearly with the zinc content. Magnetic measurements showed a linear increase of the saturation magnetisation with increasing Zn content, further supporting the observed linear substitution while also showing that Zn substitution actively alters the compound's magnetic properties. Superparamagnetic behaviour was clearly visible in both ZFC and AC curves, with results indicating that shifts of the mean blocking temperature TB were not caused by fluctuations in particle diameter but mostly by changes in Zn content. In conclusion, the use of microreactors has been shown here to be successful for the preparation of doped Fe3O4 nanoparticles below 5 nm and with progressively increasing Zn content. This relatively simple and low-cost synthetic route has great potential to be exploited for the synthesis and doping of a wide range of inorganic nanoparticles. With the chance of tailoring the chemical formulas, hence properties, as well as the paricle size and distribution of inorganic nanoparticles, microfluidic technology is set to grow in importance as synthetic tool.Acknowledgements
The authors would like to thank the Department of Chemistry, University of Hull for a PhD studentship for M. D. Simmons and Mr Bob Knight for ICP measurements. The authors would like to thank Dr V. V. Shvartsman for his helpful instructions in the magnetic measurements. This work was supported by Stiftung Mercator (MERCUR). D. C. Lupascu acknowledges partial support through DFG Forschergruppe 1509.References
- T. W. Phillips, I. G. Lignos, R. M. Maceiczyk, A. J. deMello and J. C. deMello, Lab Chip, 2014, 14, 3172–3180 RSC.
- C. Wiles and P. Watts, Chem. Commun., 2011, 47, 6512–6535 RSC.
- M. Pumera, Chem. Commun., 2011, 47, 5671–5680 RSC.
- S. Krishnadasan, R. J. C. Brown, A. J. deMello and J. C. deMello, Lab Chip, 2007, 7, 1434–1441 RSC.
- J. Wagner and J. M. Ko, Nano Lett., 2005, 5(4), 685–691 CrossRef CAS PubMed.
- X. Z. Lin, A. D. Terepka and H. Yang, Nano Lett., 2004, 4, 2227–2232 CrossRef CAS.
- L. Sun, W. Luan, Y. Shan and S. Tu, Chem. Eng. J., 2012, 189–190, 451–455 CrossRef CAS PubMed.
- M. Baghbanzadeh, T. N. Glasnow and O. Kappe, J. Flow Chem., 2013, 3, 109–113 CrossRef.
- S. A. Khan, A. Guenther, M. A. Schmidt and K. F. Jensen, Langmuir, 2004, 20, 8604–8611 CrossRef CAS PubMed.
- S. Krishnadasan, J. Tovilla, R. Vilar, A. J. deMello and J. C. deMello, J. Mater. Chem., 2004, 14, 2655–2660 RSC.
- A. Abou Hassan, O. Sandre, V. Cabuil and P. Tabeling, Chem. Commun., 2008, 1783–1785 RSC.
- M. Simmons, C. Wiles, V. Rocher, M. G. Francesconi and P. Watts, J. Flow Chem., 2013, 3, 7–10 CrossRef CAS.
- L. Frenz, A. El Harrak, M. Pauly, S. Begin-Colin, A. D. Griffiths and J.-C. Baret, Angew. Chem., Int. Ed., 2008, 47, 6817–6820 CrossRef CAS PubMed.
- E. Kim, K. Lee, Y.-M. Huh and S. Haam, J. Mater. Chem. B, 2013, 1, 729–739 RSC.
- S. Laurent, S. Dutz, U. O. Häfeli and M. Mahmoudi, Adv. Colloid Interface Sci., 2011, 166, 8–23 CAS.
- M. E. Fleet, J. Solid State Chem., 1986, 62, 75–82 CrossRef CAS.
- R. M. Cornell and U. Schwertmann, The Iron Oxides: Structure, Properties, Reactions, Occurences and Uses, Wiley-VCH Verlag GmbH & Co. KGaA, 2nd edn, 2003 Search PubMed.
- M. Wen, Q. Li and Y. Li, J. Electron Spectrosc. Relat. Phenom., 2006, 153, 65–70 CrossRef CAS PubMed.
- S. S. Pati and J. Philip, J. Appl. Phys., 2013, 113, 044314 CrossRef PubMed.
- B. Behdadfar, A. Kermanpur, H. Sadeghi-Aliabadi, M. D. P. Morales and M. Mozaffari, J. Magn. Magn. Mater., 2012, 324, 2211–2217 CrossRef CAS PubMed.
- C. Bárcena, A. K. Sra, G. S. Chaubey, C. Khemtong, J. P. Liu and J. Gao, Chem. Commun., 2008, 2224–2246 RSC.
- J. C. Aphesteguy, S. E. Jacobo, L. Lezama, G. V. Kurlyandskaya and N. N. Schegoleva, Molecules, 2014, 19, 8387–8401 CrossRef CAS PubMed.
- J. Liu, Y. Bin and M. Matsuo, J. Phys. Chem. C, 2012, 116, 134–143 CAS.
- Z. R. Marand, M. H. R. Farimani and N. Shahtahmasebi, Nanomed. J., 2014, 1(4), 238–247 CAS.
- Y. Li, Q. Li, M. Wen, Y. Zhang, Y. Zhai, Z. Xie, F. Xu and S. Wei, J. Electron Spectrosc. Relat. Phenom., 2007, 160, 1–6 CrossRef CAS PubMed.
- Y. H. Li, S. Y. An and C. S. Kim, IEEE Trans. Magn., 2013, 49, 4287–4290 CrossRef CAS.
- A. Abou-Hassan, S. Neveu, V. Dupuis and V. Cabuil, RSC Adv., 2012, 2, 11263 RSC.
- S. F. Chin, K. S. Iyer, C. L. Raston and M. Saunders, Adv. Funct. Mater., 2008, 18, 922–927 CrossRef CAS PubMed.
- K. Kumar, A. M. Nightingale, S. H. Krishnadasan, N. Kamaly, M. Wylenzinska-Arridge, K. Zeissler, W. R. Branford, E. Ware, A. J. de Mello and J. C. de Mello, J. Mater. Chem., 2012, 22, 4704–4708 RSC.
- M. E. Fleet, Acta Crystallogr., Sect. B: Struct. Crystallogr. Cryst. Chem., 1982, 38, 1718–1723 CrossRef.
- Y. Ahn, E. J. Choi, S. Kim, D. H. An, K. U. Kang, B. G. Lee, K. S. Baek and H. N. Oak, J. Korean Phys. Soc., 2002, 41, 123–128 CAS.
Footnote |
| † Electronic supplementary information (ESI) available. See DOI: 10.1039/c5lc00287g |
| This journal is © The Royal Society of Chemistry 2015 |

