
 Open Access Article
 This Open Access Article is licensed under a Creative Commons Attribution-Non Commercial 3.0 Unported Licence
An automated programmable platform enabling multiplex dynamic stimuli delivery and cellular response monitoring for high-throughput suspension single-cell signaling studies†
Luye
He‡
a,
Ariel
Kniss‡
b,
Adriana
San-Miguel
a,
Tel
Rouse
a,
Melissa L.
Kemp
b and
Hang
Lu
*a
aSchool of Chemical & Biomolecular Engineering, Georgia Institute of Technology, 311 Ferst Dr. NW, Atlanta, GA, USA 30332-0100. E-mail: hang.lu@gatech.edu
bDepartment of Biomedical Engineering, Georgia Institute of Technology and Emory University, 313 Ferst Dr. NW, Atlanta, GA, USA 30332-0535
First published on 12th January 2015
Abstract
Cell signaling events are orchestrated by dynamic external biochemical cues. By rapidly perturbing cells with dynamic inputs and examining the output from these systems, one could study the structure and dynamic properties of a cellular signaling network. Conventional experimental techniques limit the implementation of these systematic approaches due to the lack of sophistication in manipulating individual cells and the fluid microenvironment around them; existing microfluidic technologies thus far are mainly targeting adherent cells. In this paper we present an automated platform to interrogate suspension cells with dynamic stimuli while simultaneously monitoring cellular responses in a high-throughput manner at single-cell resolution. We demonstrate the use of this platform in an experiment to measure Jurkat T cells in response to distinct dynamic patterns of stimuli; we find cells exhibit highly heterogeneous responses under each stimulation condition. More interestingly, these cells act as low-pass filters, only entrained to the low frequency stimulus signals. We also demonstrate that this platform can be easily programmed to actively generate arbitrary dynamic signals. We envision our platform to be useful in other contexts to study cellular signaling dynamics, which may be difficult using conventional experimental methods.
Introduction
T lymphocytes are a critical component of the adaptive immune response. Activation of T cells induces rapid signaling through multiple kinase cascades to alter gene expression and ultimately leads to rapid proliferation and cytokine release.1,2 The dynamic feature of these signaling pathways is essential for full functionality of T cells.3,4 Dysregulation of T cell intracellular signaling has been implicated in a multitude of diseases such as asthma,5 allergic reactions,6 autoimmunity,7 lupus,8 and tumor immunity.9 Although many components of the T cell receptor signaling network have been identified, the signal transduction properties of these dynamic processes are difficult to be discerned with conventional experimental methods, which typically measure cellular response to a simple stimulus concentration step change.To better understand the structure and dominant feedback controls in complex signaling networks, system identification methods, originally developed in control engineering, have recently been applied.10–13 By stimulating cells with a dynamic input signal and measuring the gain and delay of the output signal, the signal transduction properties of a particular signaling pathway can be analyzed.14 However, this approach requires rapid perturbing and monitoring of cells on short timescales:15 for example, calcium signaling, with a time scale of seconds to minutes,16 is an event too fast to interrogate for experiments done in bulk. Moreover, due to heterogeneity among cells, conventional population-average assays can mask individual cell dynamics.16,17 The successful adoption of a systematic engineering approach relies on rapid delivery of dynamic stimuli and simultaneous monitoring of high-throughput readouts at single cell resolution. Specifically, as suspension cells, T cells pose additional challenges during these types of experiments.
Microfluidics offer new opportunities to study cellular signaling dynamics.18–23 There has been multiple techniques developed for suspension cell trapping, such as dielectrophoresis (DEP),24,25 optical tweezers,26 valves,27,28 microarray,29,30 or hydrodynamic focusing.31,32 However, creating changes of cellular chemical microenvironment is still difficult with these platforms.
The ability to rapidly and robustly vary the microenvironment perceived by cells is critical for this systematic approach to studying cell signaling.15 Achieving this goal requires actively delivery of a complete dynamic signal in both time and concentration level, i.e. frequency and amplitude domains. Several microfluidic designs exist in this functional domain. One such microfluidic design used for study chemotaxis generates a spatially varying but temporally static chemical gradient.33 Some designs have generated oscillatory chemical signals.10–12,34,35 While these schemes allow rapid on-and-off switch and can modulate frequency of the stimuli, it is difficult to vary concentration levels (the amplitude).
Some designs have demonstrated ways to temporally modulate concentration level through mixing of volume fractions.36 However, precisely controlling volume fractions is difficult, resulting complicated device design and operation such as use of multilayer devices and multiple syringe pumps.37–40 The mixing step requires long residence time or auxiliary structures.41 Due to the capacitance associated with these extra components, the temporal resolution of dynamic signal is often limited. In addition, these approaches have not been shown to handle suspension cells.
To develop a system that is high-throughput, operationally simple, and easy to integrate with a chemical delivery module, we built a platform off of a cell trap array device20 that uses passive hydrodynamic focusing to sequentially trap and monitor suspension T cells through time. Our platform allows rapid perturbation of chemical microenvironment and simultaneous high-throughput monitoring of cell response at single-cell resolution. The microfluidic component of this platform incorporates on-chip valves that enable rapid delivery of complete dynamic signals in both frequency and amplitude domains using only binary inputs. The system delivers versatile waveforms of signals in a large dynamic range while using relatively simple fabrication and operation steps, making this platform likely a convenient tool for end-users.
Material and methods
Device design
Our device consists of a single-layer PDMS that is plasma bonded onto a standard glass slide (Fig. 1A). It is composed of two functional modules: pneumatic valves to generate stimulatory signals and cell trap arrays to facilitate high-throughput imaging.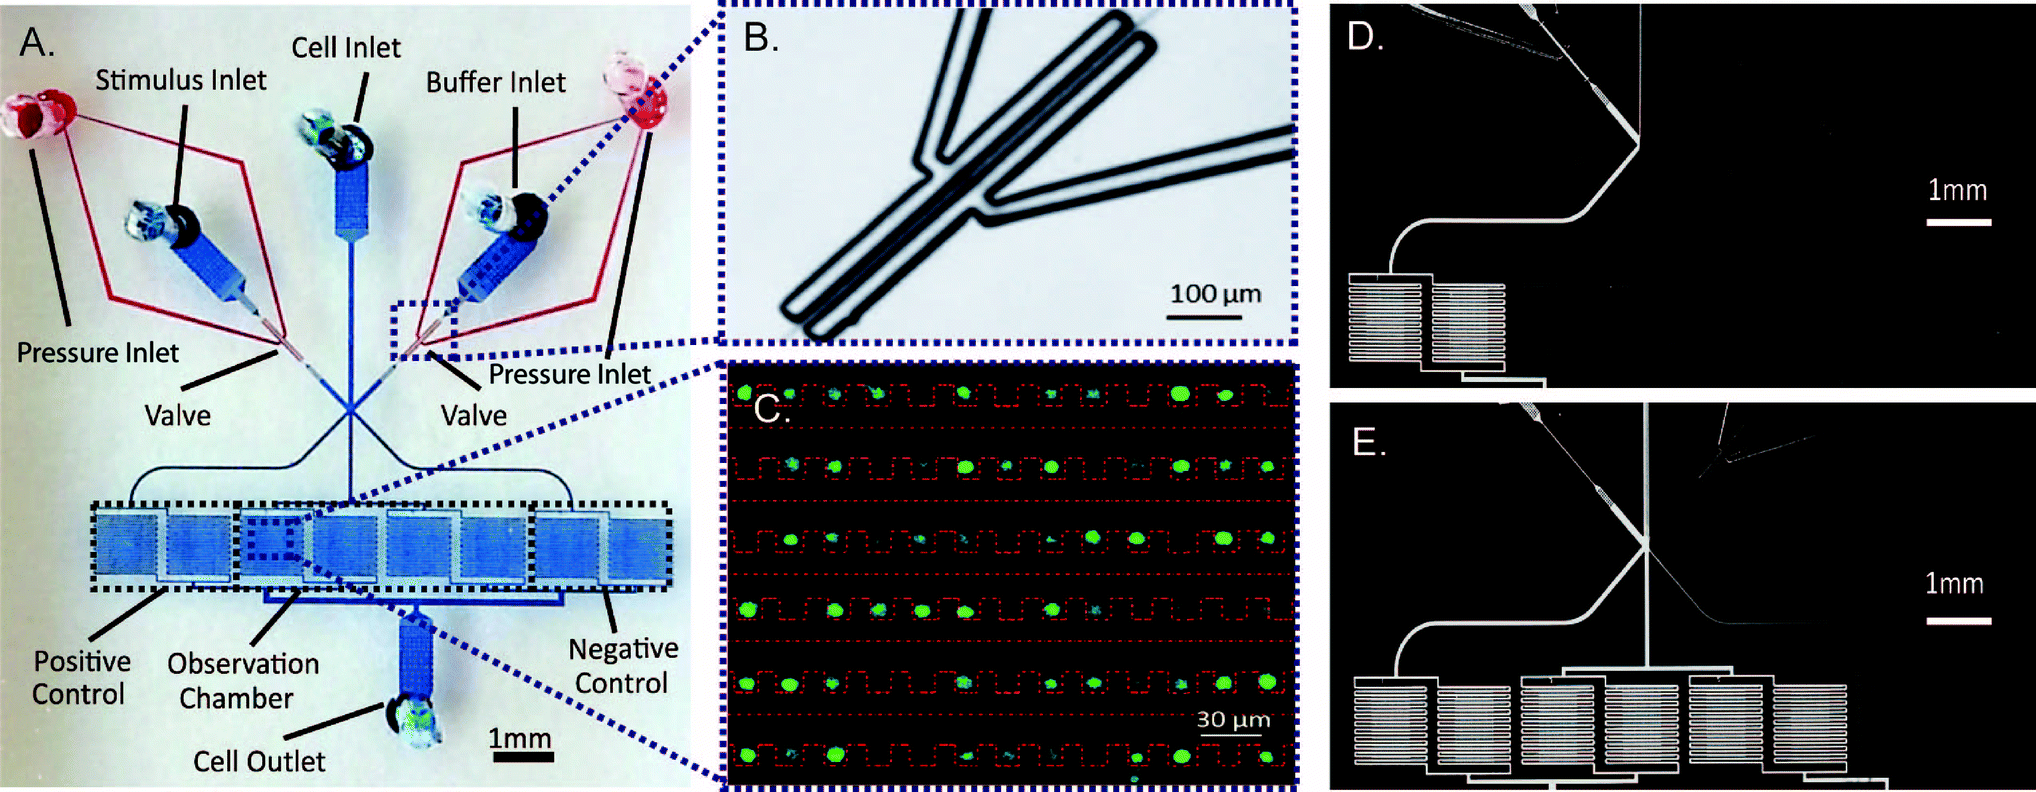 | ||
| Fig. 1 (A) Micrograph of microfluidic device: pneumatic valves (red) and fluid flow module (blue). (B) Enlarged bright field image of pneumatic valves when actuated. (C) False color image of Jurkat cells (green) trapped in cell chamber (red dotted line). (D & E) Fluorescent image of alternate switching between fluorescein solution (bright) and PBS (dark). | ||
We use two sets of on-chip pneumatic valves (Fig. 1B), which are key to generating versatile dynamic signals. By integrating the valves on-chip, we eliminate pressure fluctuations associated with using external macro-scale switch valves and tubing. This feature enables stable flow and faster response time of the system. The design is all in a single layer,25 avoiding the time-consuming and labor-intensive processes of fabricating multiple layer devices.26 Each set of valves forms a two-sided clamp on each of the two solution inlets (spacing of 10 μm between the valve and channel of 10 μm in width). By alternate actuation of the two valve sets, we can modulate the laminar interface between co-flowing streams (Fig. 1D & E).25 The flow then splits into multiple cell trap arrays downstream. Cells in the middle four chambers are exposed to the dynamic stimuli created by the fluid switching, while cells in each of the two side chambers experience constant stimuli as a positive or negative control (Fig. 1A, D & E).
Because of the small dimensions of flow channels (width of 30 μm and height of 15 μm), on-chip filters upstream from the cell chambers are included in the design to prevent debris from clogging the cell traps. The cell trap arrays are adopted from a previous design from our lab,20 where cells are passively trapped via hydrodynamic focusing (Fig. 1C). Due to the small inner volume of the device, we choose to use a pressure source to provide for a more stable flow, as opposed to a flow source.
Device fabrication
To make a device, polydimethylsiloxane mixture (PDMS, Sylgard 184, Dow Corning, Midland, MI) was cast over a hybrid two-layer master. The bottom layer of the master was 2 μm high and was etched on a new silicon wafer by deep reactive-ion etching (DRIE). The process ensures the high uniformity of this shallow layer, which is difficult to achieve using photoresist spin coating. The top layer of the master is 15 μm high and was spin coated onto the bottom silicon features using negative photoresist (SU-8 2015, Microchem, Newton, MA) and processed by standard UV photolithography. The master was treated with tridecafluoro-1,1,2,2-tetrahydrooctyl-1-trichlorosilane vapor (United Chemical Technologies, Bristol, PA) in a vacuum desiccator for 12 hours to prevent adhesion of PDMS during the molding process. PDMS mixture (A and B in 20![[thin space (1/6-em)]](https://www.rsc.org/images/entities/char_2009.gif) :1 ratio) of 1 mm thick was first poured onto the master and partially cured in a 75 °C oven for 15 minutes. Then, another layer of 4 mm PDMS mixture (A and B in 10:1 ratio) was added onto the bottom layer and incubated for another 4 hours. The difference in stiffness offers both mechanical support (top layer) and elasticity for the pneumatic side valves (bottom layer). The PDMS was peeled off from the master and cut into individual devices. Holes were punched with 19-gauge needles and the PDMS devices were plasma bonded onto a clean glass slide.
:1 ratio) of 1 mm thick was first poured onto the master and partially cured in a 75 °C oven for 15 minutes. Then, another layer of 4 mm PDMS mixture (A and B in 10:1 ratio) was added onto the bottom layer and incubated for another 4 hours. The difference in stiffness offers both mechanical support (top layer) and elasticity for the pneumatic side valves (bottom layer). The PDMS was peeled off from the master and cut into individual devices. Holes were punched with 19-gauge needles and the PDMS devices were plasma bonded onto a clean glass slide.
Experimental setup
All solutions and cell suspensions were prepared and contained in 15 mL tubes (Falcon tube, BD biosciences, San Jose, CA). Tubes were connected to the device through polystyrene tubing (PE4, Scientific Commodities). Pneumatic valves were initially filled with water at 30 psi through the valve inlet; during the experiment, valves were alternatively actuated at 50 psi. To prime the device and create a liquid environment, filtered 2% bovine serum albumin (BSA, Fisher Scientific) in 1× phosphate buffered saline (PBS, Boston BioProducts) was pressurized simultaneously from all ports into the device using a pressure of approximately 5 psi. This priming step removed any air bubbles and prevented undesired adhesion of cells to channel walls. To load cells after priming the device, the cell inlet was replaced with tubing connecting to the cell suspension, while all other ports stayed connected to priming solution. The cell suspension was driven into the device by applying 1 psi at the cell inlet and no pressure at the outlet. Pressures were adjusted at stimulus and buffer inlets to keep priming solution flowing into device, which ensured unidirectional loading of cells to trapping chambers. After cells were loaded, priming solutions at stimulus and buffer inlets were replaced by stimulus solution and cell media, respectively. After closing the cell inlet by pinching the tubing, stimulus and buffer were driven to their respective inlets by a constant pressure between 1 and 5 psi to stimulate cells with a dynamic signal. The pressure source was provided by an air compressor regulated through solenoid valves in a customized pressure control box. A custom Matlab (MathWorks) GUI controlled these solenoid valves that modulate the actuation or shutoff of pressure.Cell culture and treatments
The Jurkat E6-1 human acute T cell lymphoma cell line (American Type Culture Collection) was cultured in RPMI 1640 Medium without Phenol Red and with L-glutamine (Sigma-Aldrich) at 37 °C in a humidified 5% CO2 incubator. The media was supplemented with 10 mM HEPES buffer, 1 mM sodium pyruvate, 50 units mL−1 penicillin–streptomycin (Cellgro), 1× MEM nonessential amino acids, and 10% fetal bovine serum (Sigma-Aldrich).Cytoplasmic Ca2+ concentration was monitored using Fluo-3, AM, cell permeant (Life Technologies). Cells were incubated for 40 minutes with 5 μM Fluo-3 and 0.05% w/v Pluronic F127 at 37 °C before being washed 3 times with PBS and resuspended in white RPMI without Phenol Red. Cells were loaded into the device at 0.5 × 10⁶ cells mL−1 for approximately 20 minutes before they received stimulation.
Time-lapse microscopy and image analysis
Once cells were loaded in the device, images were acquired with a Nikon Eclipse Ti inverted fluorescent microscope using a FITC filter cube (Omega XF22). Time-lapse microscopy was performed using Elements Software (Nikon) with frame rates of 0.1 Hz to avoid photo bleaching of the Ca2+ dye, Fluo-3.Images were analyzed in an automated fashion using custom Matlab (MathWorks) scripts. Analyzed cells were manually chosen based on presence in the first and final frame. The mean fluorescence intensity was calculated for each region of interest (ROI) with the removal of background fluorescence at each time point.
Characterization of stimulus profiles at various flow rates, temporal resolutions and concentration levels
To assess the performance of our device in various experimental conditions, we empirically characterized the chemical stimulus profiles at various flow rates, temporal resolutions and concentration levels. We recorded the fluorescent intensity by acquiring images (Infinity 3, Leica) at a frame rate of 5 Hz. Image analysis was done using custom MATLAB (MathWorks) scripts. With these scripts, we manually identified a ROI for each row and calculated the mean intensity in that ROI for all frames.To visualize the effect of flow rates on stimulus profiles within the cell trapping chamber, we pressurized fluorescein solution (0.05 mg mL−1, Sigma-Aldrich, St. Louis, MO) and PBS into the device at various pressures: 1, 2, and 3 psi, while alternating these two solutions at a constant frequency of 50 mHz. We also repeated this experiment with fluorescein isothiocyanate conjugate bovine serum albumin of 10 mg mL−1 (FITC–BSA, Sigma-Aldrich, St. Louis, MO) solution (Fig. S1†).
To characterize the temporal resolution of stimulus profiles, we alternated fluorescein solution (0.05 mg mL−1) and PBS at 4 frequencies: 5, 10, 100, and 500 mHz, while pressurizing both solutions at 3 psi. The alternation was automated by a customized pressure control box and controlled through a customized Matlab GUI communicating to the box.
To characterize the stimulus profiles at various concentration levels, we alternated fluorescein solution (0.05 mg mL−1) and PBS at 10 relative durations to generate 10 corresponding concentration levels (pure PBS as 0, pure fluorescein solution as 10 and the other 9 combinations for corresponding intermediate levels), while both solutions were pressurized at 2 psi. At each concentration level, pulse duration of one solution was fixed at base pulse duration, while pulse duration of the other solution was varied. Base pulse duration of 50, 100, 200 and 500 ms were tested. By combining the base pulse with a range of scalar multiples (0–9) of basic pulse duration, 10 concentration levels were produced. Each concentration level was held for 10 s by repeating the relative duration of binary pulses.
Quantification of effective molecular dispersion in a cell trapping chamber
In order to quantify the effective dispersion of stimulus molecule in our device, we delivered 500 ms plugs of four solutions of fluorescent molecules of different molecular weight in PBS: fluorescein (0.05 mg mL−1), FITC–dextran (mw 4000, 5 mg mL−1), FITC–BSA (10 mg mL−1) and FITC–dextran (mw 70000, 12.5 mg mL−1) at five discrete pressures of 1, 2, 3, 4 and 5 psi and measured the fluorescence intensity as a function of both travelled distance and time.42 Video recording and image analysis followed the same setup as stated previously.
To extract parameters that describe the dispersion pattern, we used the Matlab curve fitting toolbox to fit the time series values of fluorescence intensity by a Gaussian in the form of eqn (1).42
 | (1) |
Extracted parameters included background signal (d), peak intensity (a), time to reach peak intensity at the center of row n (bn), and a parameter to measure the decay rate of Gaussian (c) (Fig. 4A). Mean flow velocity was estimated using eqn (2).42
 | (2) |
The effective dispersion coefficient, Deff, was calculated using eqn (3).42
 | (3) |
Because Deff should be measured after transient regions,42,43 only parameter values at row 20 were used to compute Deff. This process was repeated for all five pressures of each molecule. Under Taylor dispersion assumption, Deff is a linear function of U2w2/D as in eqn (4),42
| Deff = kU2w2/D | (4) |
| Deff = k′U2 | (5) |
 . The rise time was estimated as twice this standard deviation, which accounts for 95% of the area under the Gaussian. Results are summarized in Table S1.†
Results and discussion
Effect of flow rate on stimulus profile
In our device, chemical stimuli are delivered in forms of alternating fluid boluses. Taylor and Aris described how transport of these signals can be affected by dispersion in long straight channels.44,45 In order to understand the actual chemical micro-environment experienced by cells in our microfluidic device, we empirically examined what controls the flow and transport behavior and how much the flow in our device deviates from Taylor–Aris model.We first examined the effect of flow rates on stimulus profiles. Fig. 2(A to C) shows the resulting spatial–temporal profiles of average ROI fluorescent intensity of fluorescein driven by various pressures. Increased flow velocities under large driving pressures (Fig. 2) result in less lag throughout the trap array. In spite of possible cell loading variation among each row, the lag per row is roughly constant and predictable at each pressure condition, which is important for robust operation. This result indicates that rise time and delay in our device can be easily tuned by adjusting the driving pressure. Using quantified flow rate data (Table S1†), we estimate the shear stress is between 0.3 dyne cm−2 at 1 psi and 2 dyne cm−2 at 5 psi.
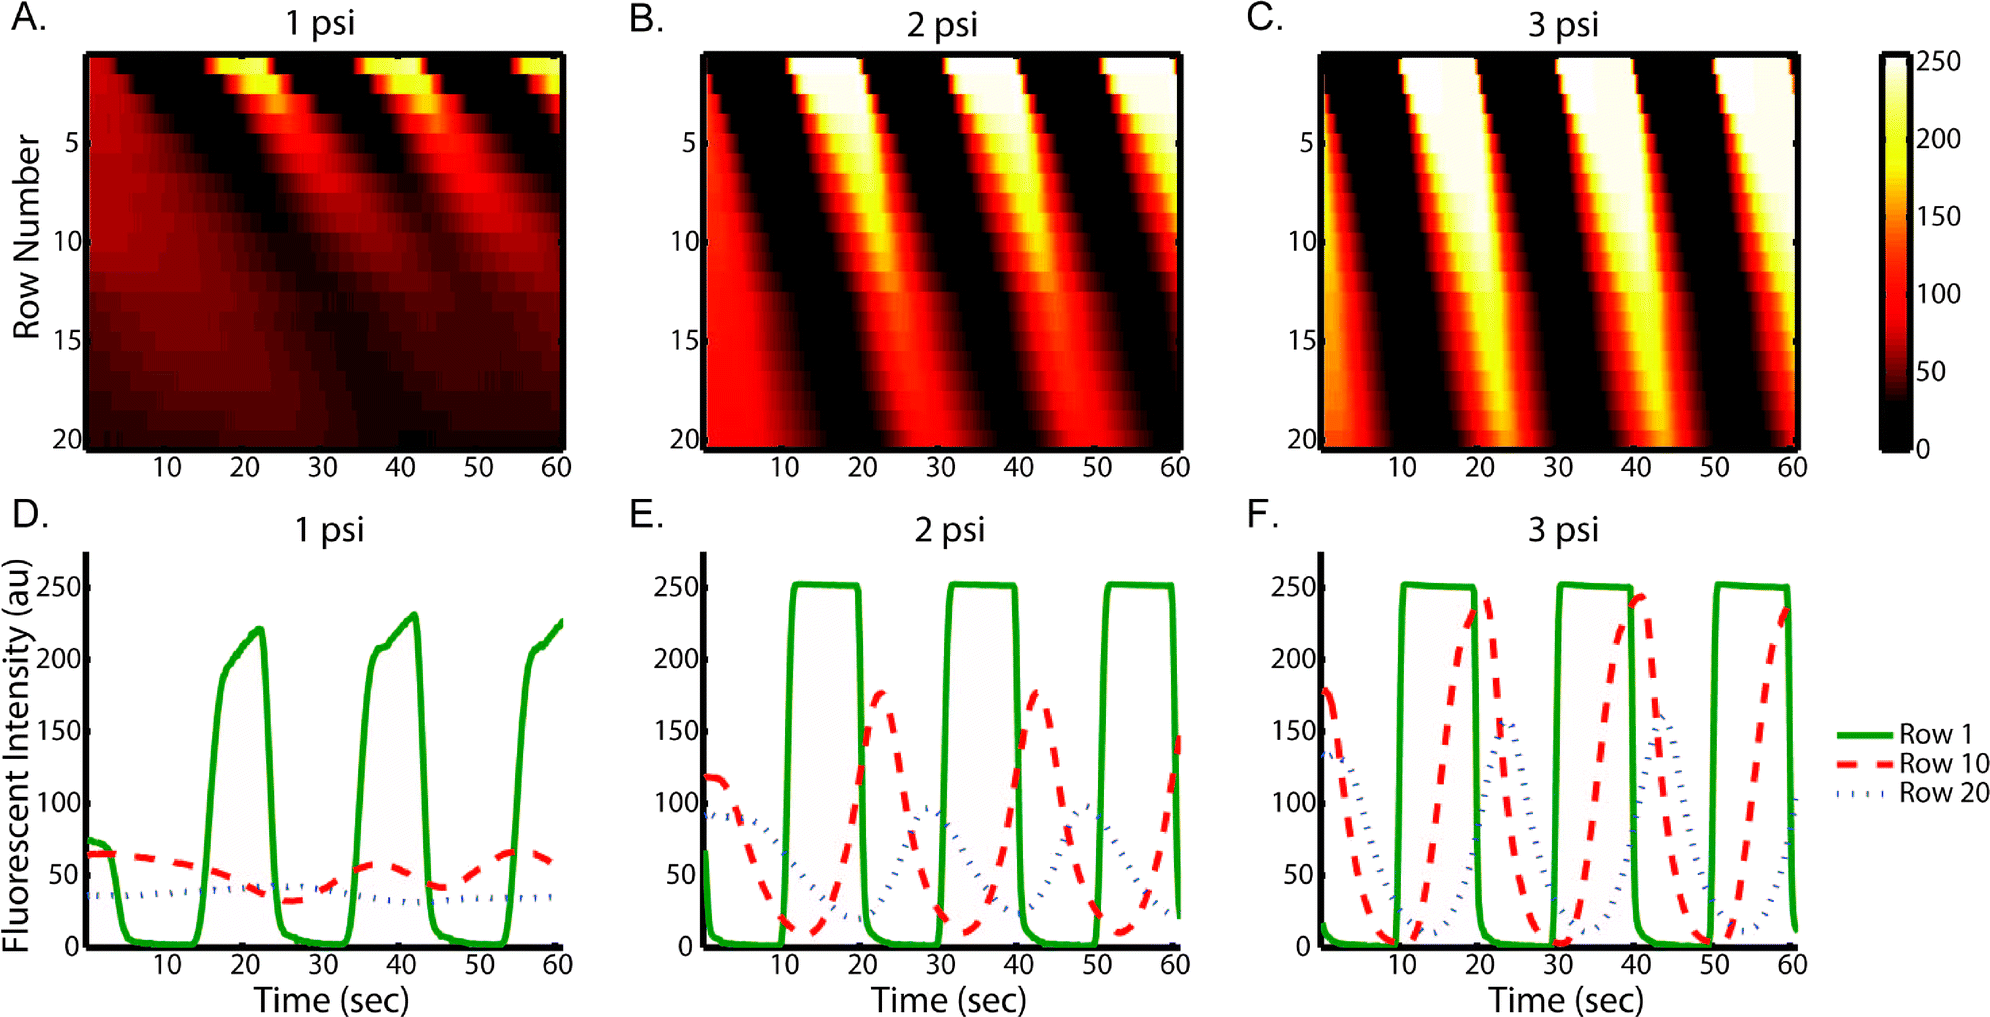 | ||
| Fig. 2 Stimulus profiles are affected by flow rates as driven at (A & D) 1 psi, (B & E) 2 psi, (C & F) 3 psi. Profiles were generated by alternatively delivering fluorescein solution and PBS at 50 mHz at each driving pressure. Top panels: heat maps of spatial (Y axis) and temporal (X axis) fluorescent intensity (color bar) in single observation chamber. Bottom panels: the corresponding average ROI fluorescent intensity (Y axis) plots as function of time (X axis) show the evolution of plug-like waveforms to Gaussian-like waveforms. | ||
To characterize dispersion in the device, we used several fluorescent solutes. As expected, dispersion of all fluorescent molecules causes continuous evolution of the stimulus profile from an initial plug-like waveform to a final Gaussian-like waveform (Fig. 2D to F, Fig. S1†). At high flow rates, due to shorter residence time, the stimulus profile is less dispersed than that at low flow rate. This feature enables multiplex stimulation of cells with signals of the same temporal characteristics (i.e. same frequency of rise and fall) but various shapes (e.g. square-wave or Gaussian-like).
This multiplex feature is beneficial in the fast screening of a wide range of input conditions in a single experiment. For example, this feature can be used to study the threshold stimulus concentration cells can sense, as dispersion shifts both the timing and concentration of stimulus perceived by cells in different locations of the array. Within each observation chamber, it is possible to generate data for up to 40 cells in each row, or multiple of 40 cells for a group of several rows, where stimulus profile can be regarded as the same. To harness the power of multiplexing requires exact knowledge of stimulus profile as a function of time and location, which will be quantified in later sections of this work.
Temporal resolution of stimulus profile
One goal of our device is to interrogate cells with stimulus signals spanning broad timescales and frequency space. To assess its dynamic range and temporal resolution, we visualized the stimulus profiles by alternating fluorescent molecule solutions with PBS at various frequencies.Fig. 3 depicts the resulting spatial–temporal profiles of fluorescein intensity at various frequencies. Depending on frequencies, dispersion affects fluorescent profiles to different extents. At frequencies slower than 10 mHz (period longer than 100 s), the effect of dispersion becomes less apparent. This is because residence time (8 s at driving pressure of 3 psi) becomes much smaller compared to the timescale of alternating period. At frequencies faster than 500 mHz (period less than 2 s), waveforms are only resolved in the first few rows, dynamic signals become homogenized into an average, constant level stimulus as they pass along the chamber.
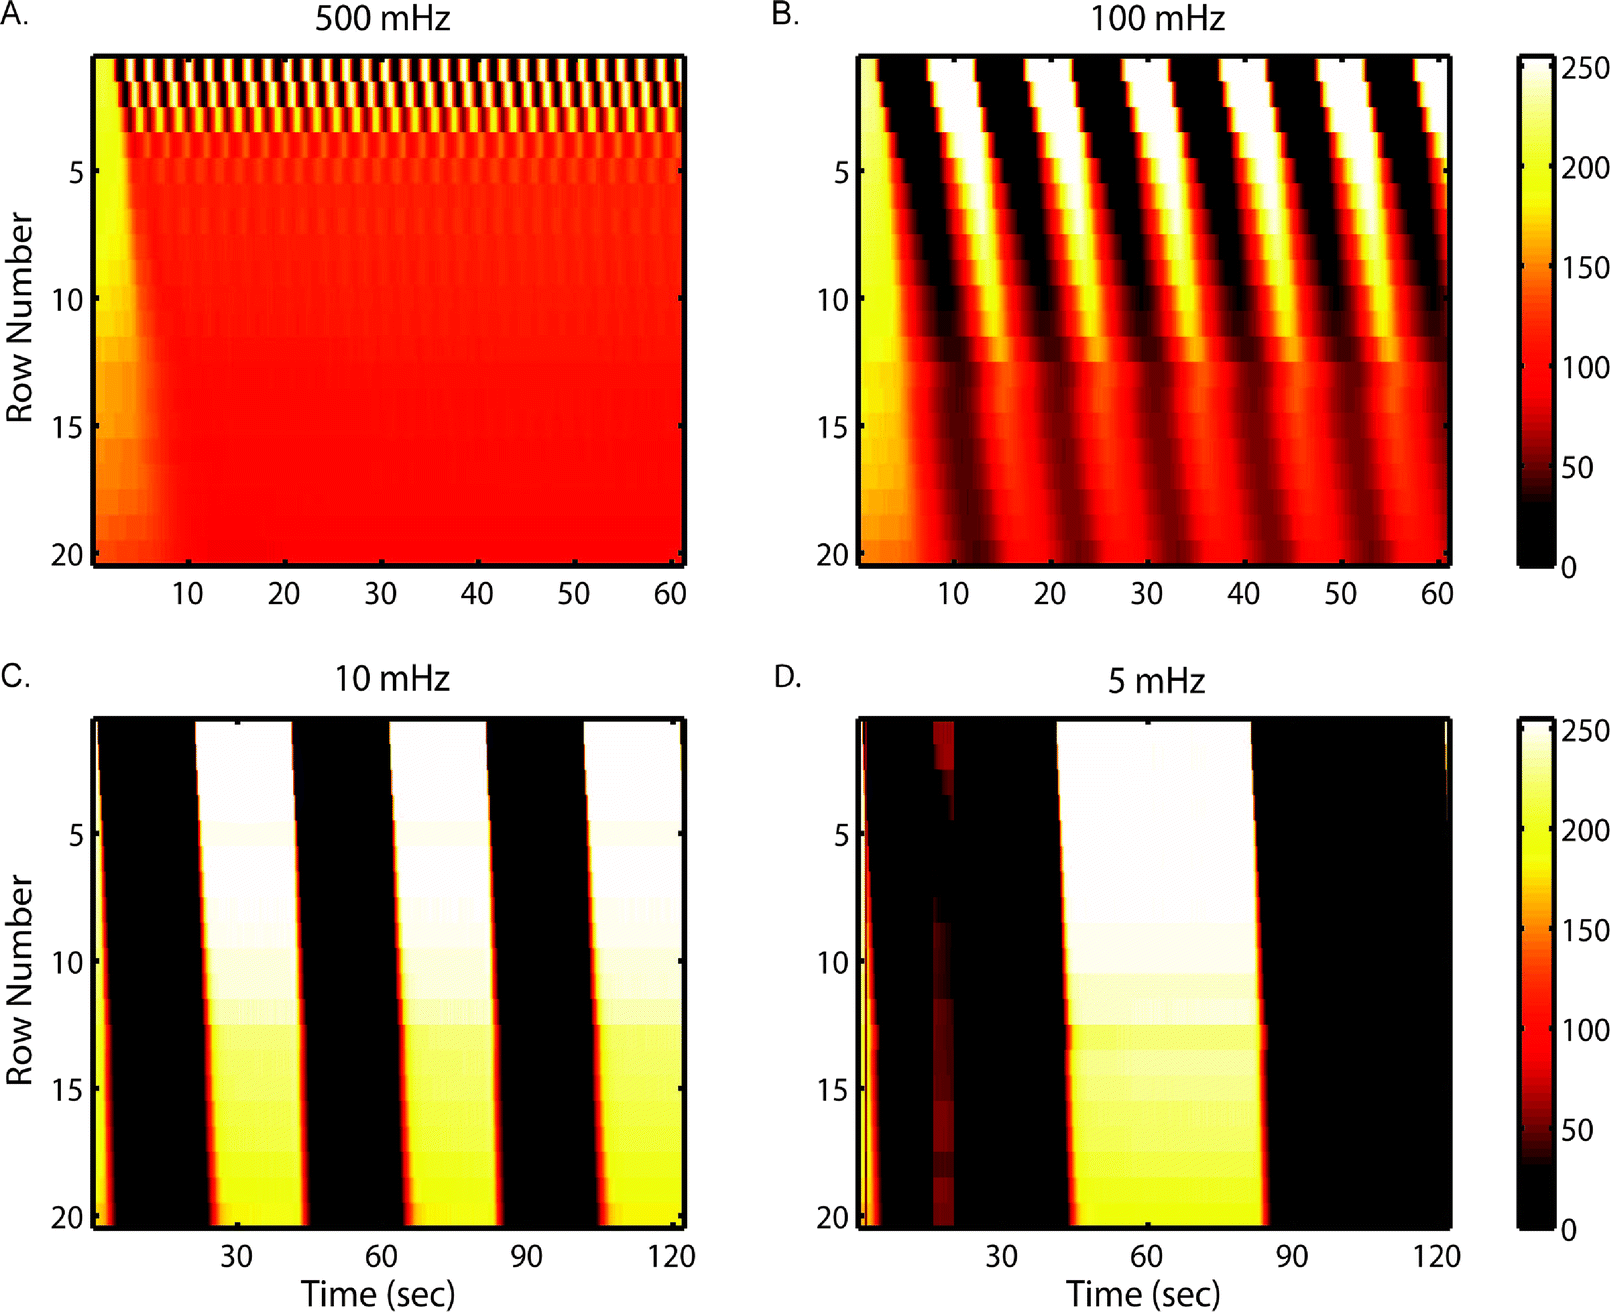 | ||
| Fig. 3 The temporal resolution is revealed by stimulus profiles oscillating in wide temporal ranges: (A) 500 mHz (2 s), (B) 100 mHz (10 s), (C) 10 mHz (100 s) and (D) 5 mHz (200 s). Profiles were generated by alternatively delivering fluorescein solution and PBS at a driving pressure of 3 psi. Heat maps show spatial (Y axis) and temporal (X axis) average ROI fluorescent intensity (color bar) in single observation chamber. | ||
We note that dispersion puts a physical limitation on attainable temporal resolution to all setups that use flow system to deliver oscillatory or other dynamic signals. Although as shown here and in other works11,35 that higher flow-rates can help improve the temporal resolution, it is at the cost of reagent expense, which can be significant when using biochemical cues such as cytokines, etc. Thus, this tradeoff should be carefully weighed for each application.
Moreover, since chemical cues transported in vivo are also subject to the same physical limitations posed by dispersion, we argue T cells are unlikely to utilize chemical signals with timescales shorter than 2 seconds to encode distinguishable information.14 If this hypothesis holds true, then the temporal resolution of our device should be sufficient for dynamic studies of T cell signaling pathways.
Molecular diffusivity dependence of dispersion
While the standard technique to perform device characterization is to use soluble fluorescent molecules (with molecular weight ranging from low hundreds to thousands), most biologically relevant stimuli are non-fluorescent and are often of small molecular weight (e.g. H2O2) or macromolecules (e.g. cytokines). As such, their dispersion patterns cannot be measured easily. To study how molecular weight (and more directly molecular diffusivity) affects stimulus profiles, we analyzed the dispersion patterns of various fluorescent molecules with distinct molecular sizes and shapes: fluorescein (mw 332), FITC–dextran (mw 4000), FITC–BSA (mw 66000), and FITC–dextran (mw 70000).
We find that similar conclusions can be made for profiles of other fluorescent molecules as those for fluorescein (Fig. S1†): (1) the stimulus profiles continuously evolve as a function of residence time (flow rate), and (2) the stimulus signal can be generated across wide timescales with an upper bound resolution of 2 seconds.
We first tested how similar the dispersion pattern is to the Taylor–Aris model.44,45 In the Taylor–Aris model, the effective dispersion coefficient is a linear function of U2w2/D,42 where the slope k is only dependent on cross-section geometry as in eqn (4). This model predicts that molecules with smaller diffusivity have a larger Deff. However, the cell chamber in our design is a “leaky” serpentine channel where flow splits and recombines as compared to the “long straight channel” assumption in Taylors' model.20 This “leakiness” did not result in visually dramatic changes in the concentration profiles, i.e. we did observe the Gaussian-like dispersion profile as in Taylor dispersion.44,45 Next we quantified how the flow in our device deviated from the Taylor's model. Tayor–Aris model predicts that the parameter k is only dependent on cross-section geometry and independent of (or a very weak function of) molecular weight.
In order to experimentally measure and quantify the dispersion patterns of various fluorescent molecules, we used the framework by Bontoux et al.42 We delivered a short pulse of fluorescent solution of 500 ms, the shortest pulse we can generate that gives reliable fluorescent measurements (Fig. 4A and eqn (1)). We measured and calculated mean flow velocity (U), effective dispersion coefficient (Deff) and rise time (t) at various locations in a cell chamber (Table S1†). The rise time serves as a direct measurement of the extent of dispersion patterns. Fig. 4B plots the experimentally determined Deff against U2w2/D for each fluorescent molecule.42 This result shows that k is not constant; it tracks the trend of various molecular weights and diffusivities, indicating that the dispersion deviates significantly from Taylor's model. We repeated this experiment and found consistent results across experiment repeats (Fig. S2†), thus the deviation from theory was unlikely caused by experiment-to-experiment variation. It is also interesting to note that the value of k is between 0.01 and 0.2 (Fig. 4B), which is much larger than the prediction of 0.003 in Taylor's model,42,43 indicating the complex flow path significantly increases the extent of dispersion.
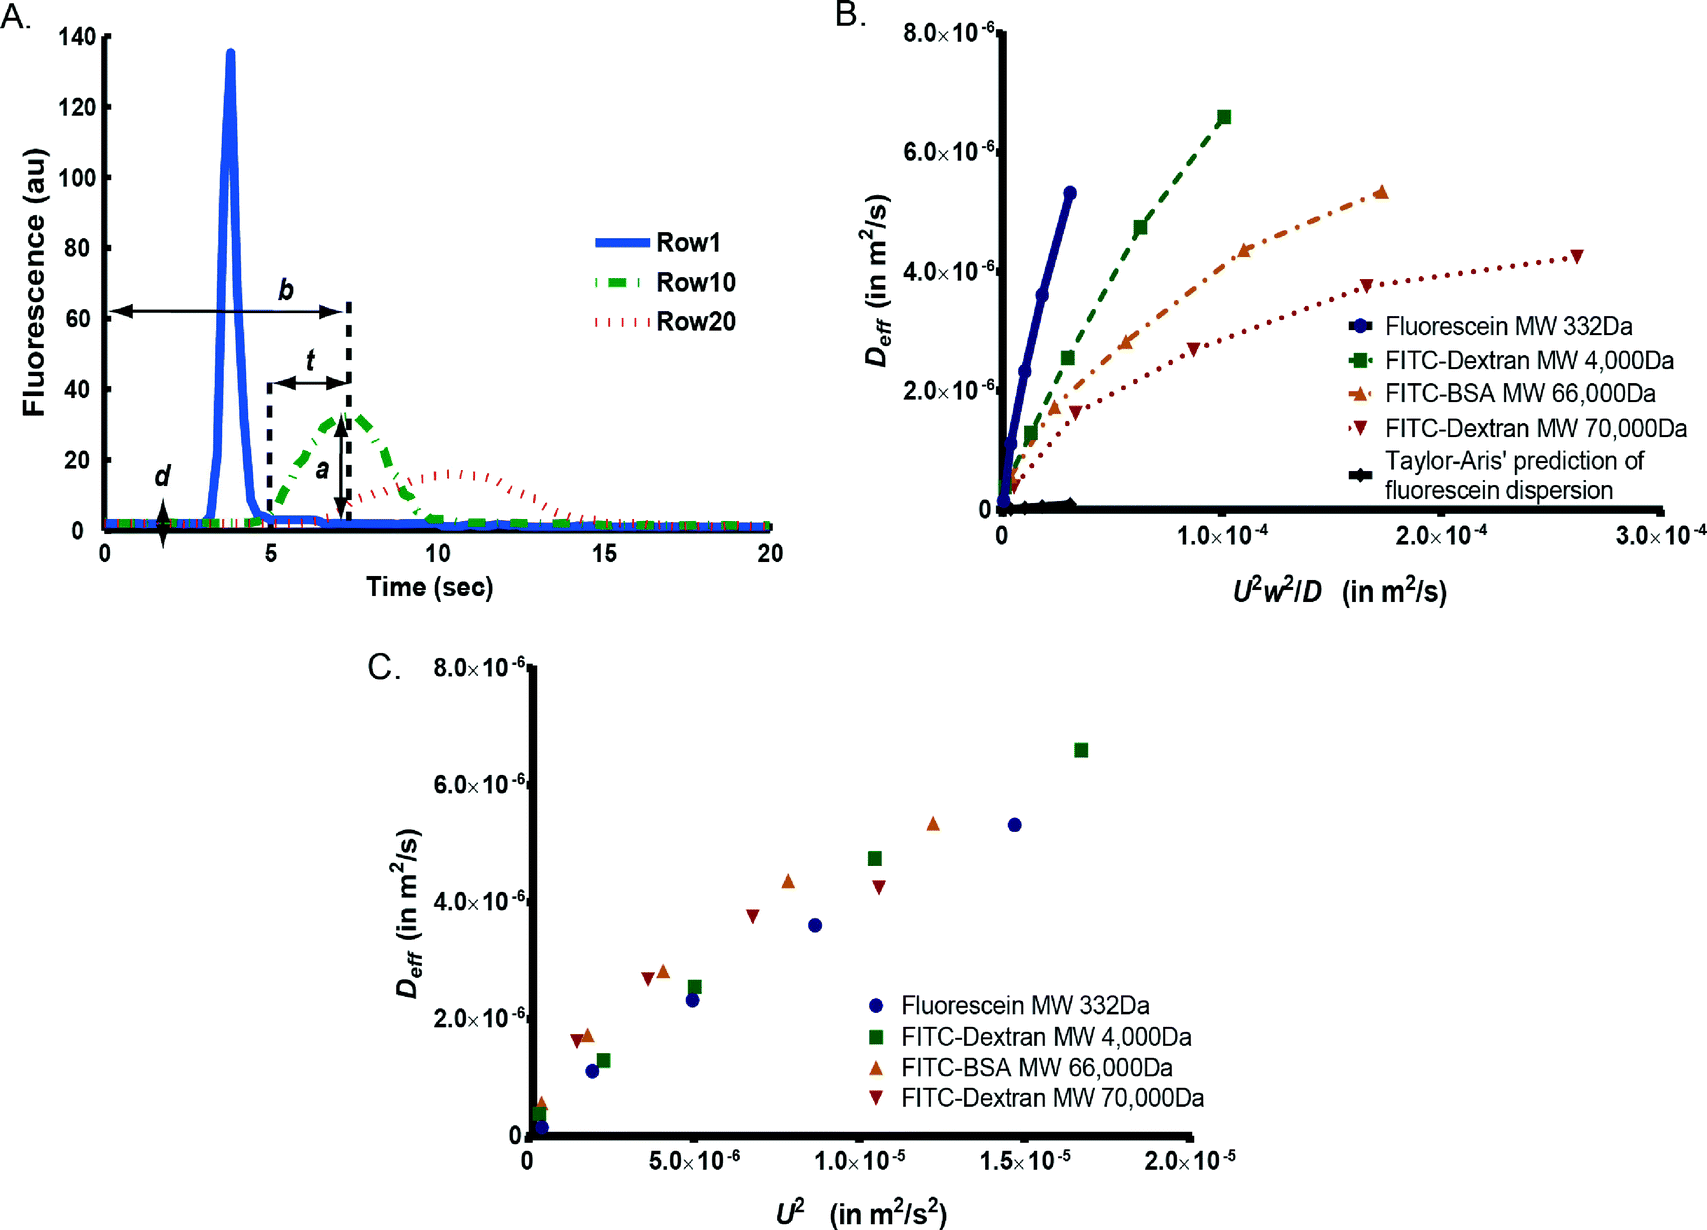 | ||
| Fig. 4 Quantification of the effective dispersion in a cell trapping chamber. (A) A 500 ms pulse of fluorescein solution was delivered in PBS solution. A Gaussian fit was applied to the spatial–temporal intensity function to extract parameters that described effective dispersion: a is peak intensity, d is background intensity, b is peak time, t is rise time. (B) Effective dispersion of various fluorescent molecules shows large deviation from Taylor's model, which predicts constant slope k for all molecules. (C) Under the same flow velocity, molecules with smaller intrinsic diffusivity have larger effective dispersion in accordance with the Taylor dispersion model. Nevertheless, the effect of complex flow pattern dominates in shaping effective dispersion, rendering effect of molecular diffusivity not apparent. | ||
We next ask to what extent and how molecular weight contributes to the effective dispersion because stimuli molecules may not be fluorescently labeled. When plotting Deff against U2w2/D, the lumped term makes it difficult to assess the contribution of each variable to Deff. In order to isolate the contribution of intrinsic diffusivity, we compare Deff for various fluorescent molecules as only function of U2 (Fig. 4C and eqn (5)). Fluorescent molecules with higher molecular diffusivity (usually smaller molecular weight) have slightly smaller Deff as characteristic of Taylor dispersion (eqn (4)). Accordingly, we would predict that stimuli with small molecular weight such as H2O2 are less dispersed compared to the fluorescent molecules tested. This implies that the observed patterns are worst-case scenarios for experiments that require well-defined temporal patterns throughout the trap array.
Interestingly, the observed dependence on molecular diffusivity is much smaller than that in Taylor dispersion (as in eqn (4)). We speculate that because the complex flow pattern unselectively increases the extent of dispersion regardless of molecular size, the effect of flow splitting and recombination dominates over the effect of molecular diffusivity in determining the apparent dispersion as pattern. This renders the effective dispersion as almost only a function of flow velocity (Fig. 4C), which is convenient to control experimentally. This suggests that once k′ (eqn (5)) is quantified using any fluorescent molecule, the effective dispersion of arbitrary molecule can be estimated, and we can predict the microenvironment as perceived by cells. This knowledge of stimulus profile is important to correlate with cellular responses to multiplexing stimulus conditions.
Generating dynamic stimulus profile varying in both time and concentration
Our ultimate goal is to be able to deliver dynamic stimuli with arbitrary waveforms that can simultaneously vary in time and concentration. Analogous to pulse-density modulation in signal processing where the amplitude of analog signal is represented by the relative density of digital signal, here we modulate the relative pulse duration of stimulus and buffer to encode various concentration levels. By controlling the dispersion in the microfluidic channel, binary pulses can be homogenized into uniform concentration of various levels.To demonstrate this idea, we generated a ramp signal with 10 concentration levels (Fig. 5A). Pure buffer corresponded to a signal of 0 and originally prepared stimulus solution corresponded to a signal of 10. In order to generate other concentration levels, we first defined a base pulse duration. We applied the base pulse duration to either stimulus or buffer, and assign the other solution a relative duration corresponding to each concentration level. For example, we first defined a base pulse of 100 ms; to generate a signal of 1, we delivered 100 ms of stimuli and 900 ms of buffer; to generate a signal of 2, we delivered 100 ms of stimuli and 400 ms of buffer; to generate a signal of 9, we delivered 900 ms of stimulus and 100 ms of buffer, etc. Each concentration level lasted for 10 seconds by repeating the corresponding combinatory pattern of pulses. We repeated this experiment at four different base pulses: 50 ms, 100 ms, 200 ms and 500 ms (Fig. 5B, C & Fig. S3†)
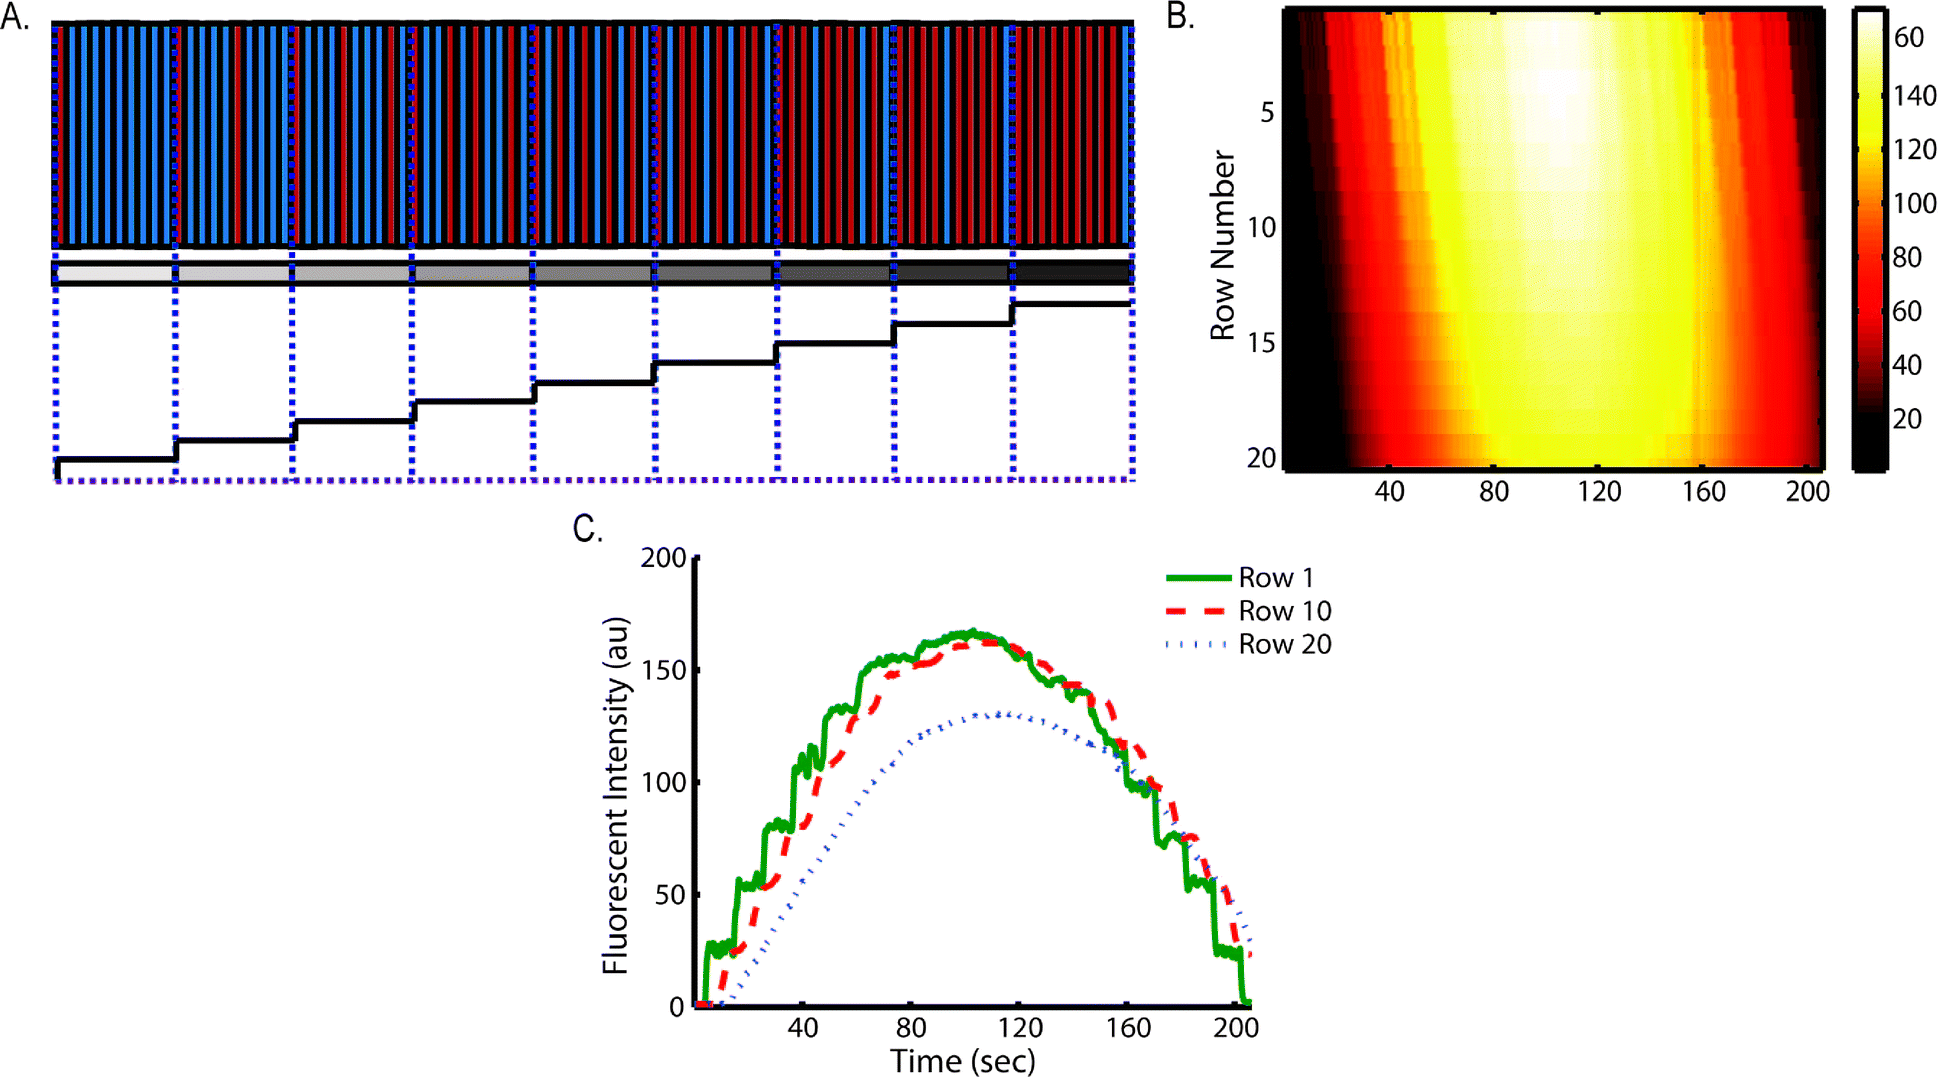 | ||
| Fig. 5 Dynamic stimulus varying in both time and concentration is automatically generated using only one concentration of stimulus and buffer. (A) Schematic for signal synthesis by pulse-density modulation. Each color bar represents a base pulse duration: stimulus (red) and buffer (blue). Nine relative durations of binary solutions are delivered and converted to 9 corresponding stimulus concentration levels by controlling dispersion in microfluidic channels. (B & C) A ramp signal with 10 concentration level is generated by FITC–BSA solution and PBS using a base duration of 50 ms. (B) The spatial temporal heat map of average ROI fluorescent intensity within a cell chamber. (C) The corresponding fluorescent intensity profile shows the evolution of waveform from a step-like waveform to a linear waveform. | ||
For base pulse durations of 50 ms and 100 ms (Fig. 5B, C, and Fig. S3A†), the device generated a step-like profile with 10 distinguishable concentration levels in the first row. This step-like waveform continuously dispersed out to be a more linear profile as it propagated through the chamber. However, for base pulse duration of 200 ms and 500 ms (Fig. S3B & C†), we saw prominent oscillations at the first row. This indicated that signals with period longer than 2 s (200 ms × 10) cannot be homogenized by the time it reached the first row of the trapping chamber, which was consistent with previous results on temporal resolution of stimulus profiles. Since temporal resolution is the product of base pulse duration and the total number of concentration levels, the shorter the base pulse duration, the more concentration levels can be discerned. The minimal base pulse duration is ultimately limited by mechanical properties of the valve actuation and switching speed between two solutions, which is below 50 ms in our device. Nevertheless, even using a base pulse duration longer than 200 ms, a ramp signal can be created. This implies that our device can support a wide dynamic range of base pulse duration, temporal resolution and total concentration levels. Since there are 40 cell trapping sites on each row, a small region of the trap is sufficient to collect a large number of cellular responses. Depending on the time span, temporal resolution, and total concentration levels required by a particular experiment, proper base pulse duration and portion of the trapping chamber can be chosen for cellular responses under the same desired stimulus waveform.
Since there are only two input solutions, our device substantially simplifies experimental operation by eliminating the need to prepare multiple solutions and switch solutions of discrete concentrations manually during experiments. Most existing schemes achieve concentration modulation through mixing of volume fractions, where mixing happens in the perpendicular-to-flow direction through natural diffusion or facilitated by auxiliary structures.40,41 These schemes require either long residence time or complicated circuit design and operation. In contrast, our device achieves concentration modulation by using an on-chip valve enabled clock. The dispersion facilitates mixing in the direction along the flow direction without any auxiliary structures. The synthesis and delivery of dynamic signals to trapped cells are automated by a Matlab GUI controlled pressure box, both of which are custom made. Desired stimulus waveform can be easily programmed on spot in the Matlab GUI. Since timing is more flexible to modulate compared to volume fraction, our device allows more rapid and precise modulation of stimulus concentration with less complexity. This feature of modulating concentration level is unique to this device, as it would be difficult for the previous work by Chingozha et al.35 to modulate concentration level through pore structures with off-chip valves and large reagent flow rate.
Calcium signaling in response to dynamic stimulation of H2O2
Ca2+ is actively sequestered in the endoplasmic reticulum (ER) until T cell activation triggers its release.46 Upon stimulation, cytoplasmic Ca2+ concentration has been shown to oscillate through time, which is thought to be the result of stochastic distribution of receptor proteins within the membrane.47,48 This dynamic calcium signaling ultimately leads to nucleation of NFAT and production of cytokine interleukin-2 (IL-2).2 Studies suggest a role of ROS in T cell activation, especially involved in calcium flux that follows TCR recognition.49–51We used our device to examine the response of Jurkat cells to dynamic stimulation by alternating 100 μM H2O2 solution with white RPMI media without Phenol Red at 2 psi. The shear stress experienced by these cells is estimated from flow velocity data (Table S1†) to be around 1 dyne cm−2, much lower than the high shear stress blood cells are subjected to normally in the bloodstream.52 Our previous reports also indicated no recognizable effect on T cell signaling with the shear stresses estimated in the cell trapping chamber.20,53 Thus we assume signaling is unimpaired with the observed continuous flow conditions. Cytoplasmic Ca2+ concentration was monitored using fluorescence microscopy of Fluo-3 while cells experienced stimulation at a frequency of either 5 mHz or 50 mHz. Under 10× magnification (e.g. for monitoring of cytosolic calcium dye such as Fluo-3), only a few rows within an observation chamber can be monitored at the same time. These cells are assumed to be under approximately the same stimulation profiles, because for each of the two frequencies the concentration profile has been experimentally shown to be similar in adjacent rows (Fig. 3). Individual cell traces were analyzed over time, and a heat map of fluorescent intensity from 50 cells is shown in Fig. 6A & B. The cell number is not associated with location information.
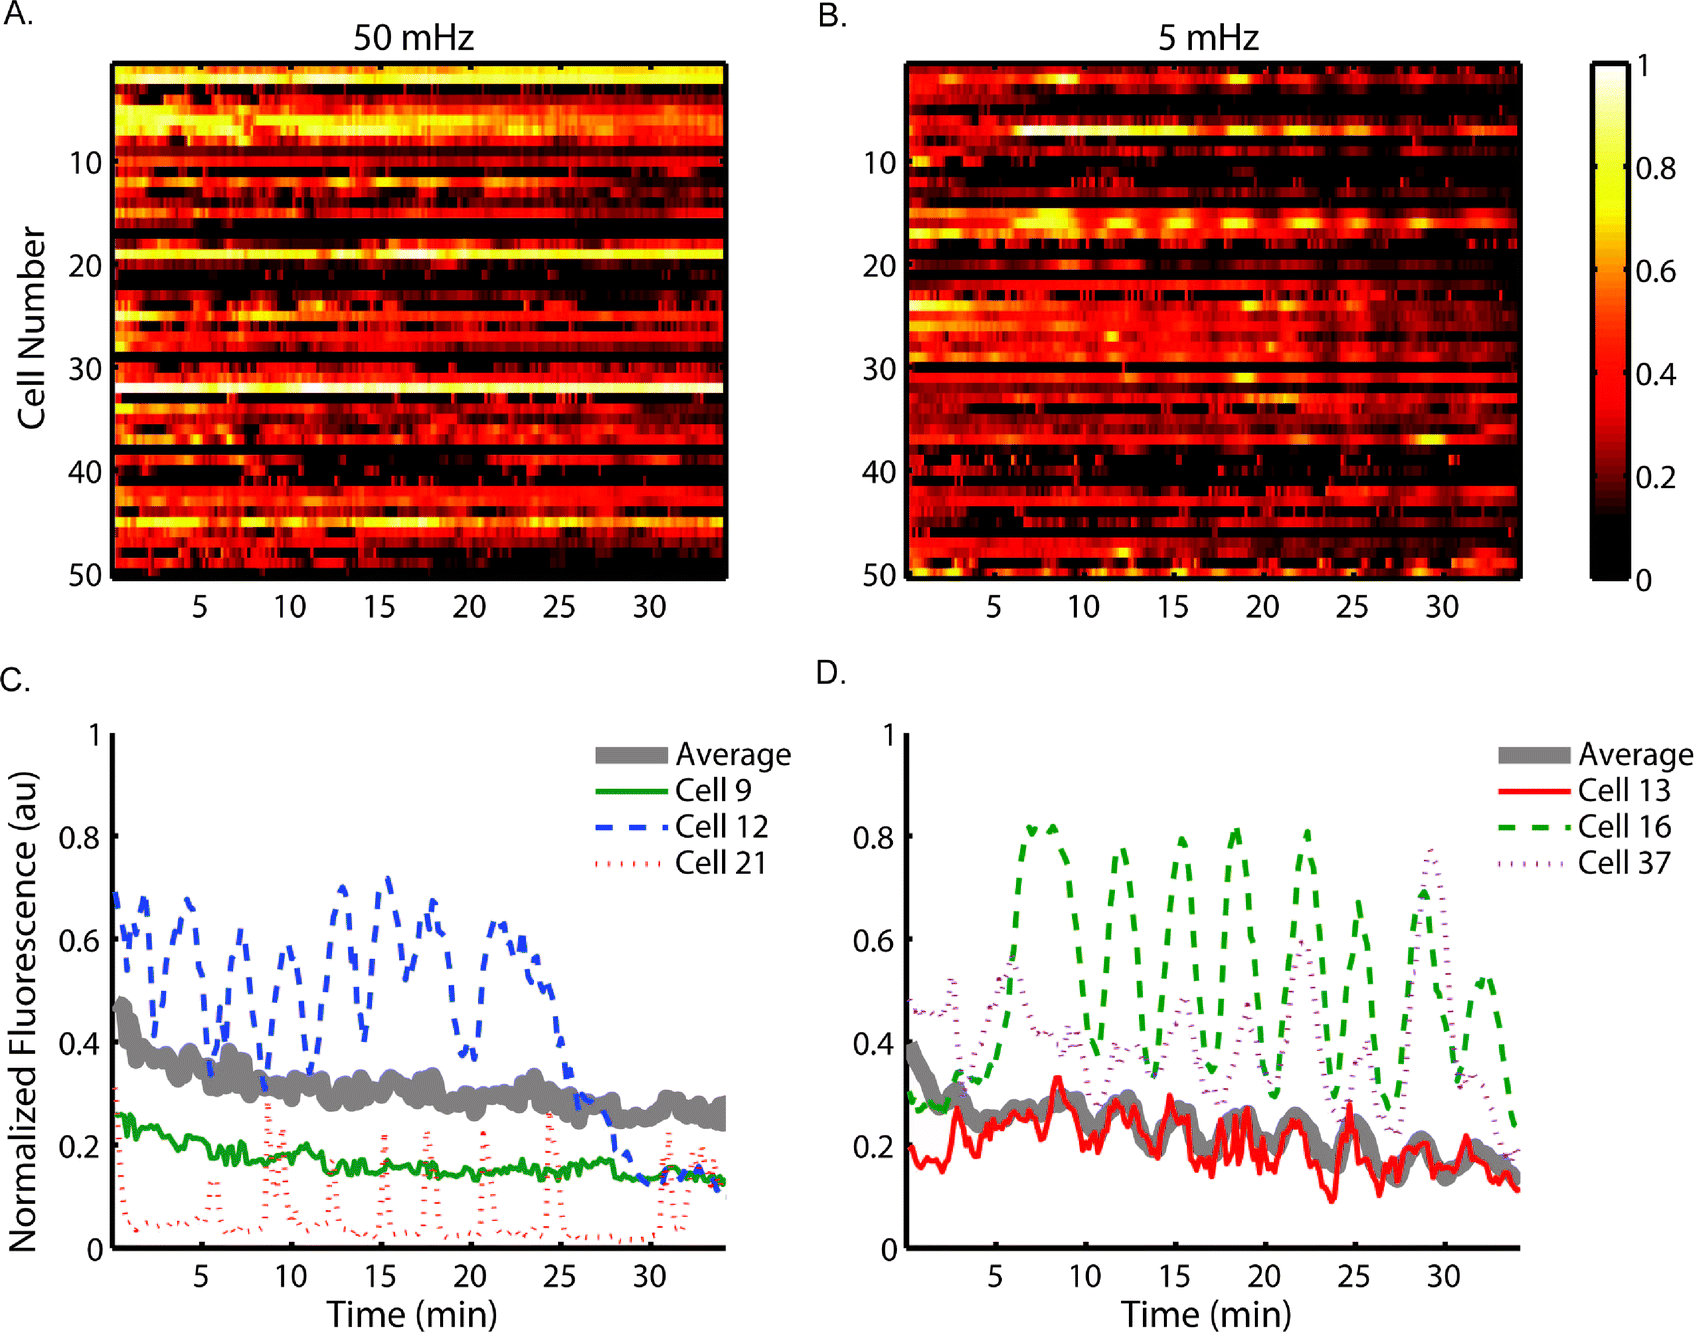 | ||
| Fig. 6 Cytoplasmic calcium signalling synchronizes with low frequency oscillating stimulus. Heat map of 50 cells responding to (A) 50 mHz (20 s) and (B) 5 mHz (200 s) stimulation of 100 μM H2O2. Single cell traces are graphed from selected cells responding to (C) 50 mHz and (D) 5 mHz stimulation of 100 μM H2O2. The population is visibly synchronizing to the stimulus at 5 mHz, while response heterogeneity exists among populations under each stimulation condition. | ||
The heat maps clearly show heterogeneity within the population of monitored cells under each stimulation condition and select individual cell traces are shown in Fig. 6C & D. The 5 mHz signal entrained some cells within the population to exhibit cytoplasmic Ca2+ concentration oscillations at approximately the same frequency. In contrast, the cells experiencing 50 mHz stimulation do not appear to exhibit oscillations of cytoplasmic Ca2+ concentration at the same frequency as the driving frequency. These results suggest the calcium signaling pathway of Jurkat cells acts as a low-pass filter, not responding to stimulation at high frequencies while faithfully reflecting low frequency signals. The cut-off frequency of this particular pathway was shown to be between 50 mHz and 5 mHz.
Given these results, we demonstrated the value of this device to generate biologically relevant signals in order to interrogate cellular signaling pathways and probe its signal transduction properties. With a full spectrum of frequencies sampled, this device is capable of garnering the experimental data necessary for frequency response analysis and provides a more systematic approach to analyzing the underlying feedback control in a complex biological network.
Conclusions
Here we present an automated platform capable of delivering an arbitrary dynamic stimulus and simultaneous monitoring of high throughput T cell signaling studies at single-cell resolution. We thoroughly characterized the stimulus profile at various flow rates, temporal resolution and concentration levels. We also developed a quantitative method to determine the effective dispersion from the complex flow in our microfluidic device. This result allows us to estimate the dispersion pattern of any arbitrary, non-fluorescent stimulus of interest and correlate cell response to multiplex stimulation conditions. Mixing based on binary activation of on-chip valves enables a more precise and rapid way to modulate stimulus concentration, which is essential in interrogating fast cellular signaling. Finally, we investigated the role of ROS in Jurkat human T cells' calcium signaling network by stimulating cells with two dynamic patterns of H2O2 signals. The results showed the heterogeneity among cell population and allowed us to estimate the cut-off frequency of the calcium signaling network in Jurkat cells. Our results would not be observable in population-average based, bulk experiments and emphasized the unique value of our platform to enable the study of cellular signaling network properties. Although we demonstrated the concept of this device with T cells, as the signal generation module is independent from the cell trapping module, the cell trapping module can be replaced to adapt to most cell sizes and types. We envision this platform to be applied to broad single-cell analyses, such as in pharmacodynamics, immunology, stem cells and cancer research.Acknowledgements
The authors acknowledge the funding from NIH R01AI088023 to H.L. and M.L.K. and NSF Graduate Research Fellowship to A.K. A.K. is also supported by NIH Training Grant T32GM105490 and P.E.O. Scholar Award. We also thank Loice Chingozha, Mei Zhan, Maggie Phillips Gran, Linda Kipper and other members of the Kemp and Lu labs for advice and help along this project.Notes and references
- J. E. Smith-Garvin, G. A. Koretzky and M. S. Jordan, Annu. Rev. Immunol., 2009, 27, 591 CrossRef CAS PubMed.
- S. Feske, Nat. Rev. Immunol., 2007, 7, 690–702 CrossRef CAS PubMed.
- R. E. Dolmetsch, R. S. Lewis, C. C. Goodnow and J. I. Healy, Nature, 1997, 386, 855–858 CrossRef CAS PubMed.
- R. E. Dolmetsch, K. Xu and R. S. Lewis, Nature, 1998, 392, 933–936 CrossRef CAS PubMed.
- S. Finotto, M. F. Neurath, J. N. Glickman, S. Qin, H. A. Lehr, F. H. Green, K. Ackerman, K. Haley, P. R. Galle, S. J. Szabo, J. M. Drazen, G. T. De Sanctis and L. H. Glimcher, Science, 2002, 295, 336–338 CrossRef CAS PubMed.
- J. Zhu and W. E. Paul, Blood, 2008, 112, 1557–1569 CrossRef CAS PubMed.
- R. J. DiPaolo, C. Brinster, T. S. Davidson, J. Andersson, D. Glass and E. M. Shevach, J. Immunol., 2007, 179, 4685–4693 CrossRef CAS.
- A. Perl, R. Hanczko and E. Doherty, Methods Mol. Biol., 2012, 900, 61–89 CAS.
- J. Zhu, H. Yamane and W. E. Paul, Annu. Rev. Immunol., 2010, 28, 445–489 CrossRef CAS PubMed.
- J. T. Mettetal, D. Muzzey, C. Gomez-Uribe and A. van Oudenaarden, Science, 2008, 319, 482–484 CrossRef CAS PubMed.
- P. Hersen, M. N. McClean, L. Mahadevan and S. Ramanathan, Proc. Natl. Acad. Sci. U. S. A., 2008, 105, 7165–7170 CrossRef CAS PubMed.
- M. R. Bennett, W. L. Pang, N. A. Ostroff, B. L. Baumgartner, S. Nayak, L. S. Tsimring and J. Hasty, Nature, 2008, 454, 1119–1122 CrossRef CAS PubMed.
- P. R. LeDuc, W. C. Messner and J. P. Wikswo, Annu. Rev. Biomed. Eng., 2011, 13, 369–396 CrossRef CAS PubMed.
- J. E. Toettcher, O. D. Weiner and W. A. Lim, Cell, 2013, 155, 1422–1434 CrossRef CAS PubMed.
- O. Brandman and T. Meyer, Science, 2008, 322, 390–395 CrossRef CAS PubMed.
- D. G. Spiller, C. D. Wood, D. A. Rand and M. R. H. White, Nature, 2010, 465, 736–745 CrossRef CAS PubMed.
- S. J. Altschuler and L. F. Wu, Cell, 2010, 141, 559–563 CrossRef CAS PubMed.
- M. R. Bennett and J. Hasty, Microfluidic devices for measuring gene network dynamics in single cells, Nat. Rev. Genet., 2009, 10(9), 628–638 CrossRef CAS PubMed.
- S. Faley, K. Seale, J. Hughey, D. K. Schaffer, S. VanCompernolle, B. McKinney, F. Baudenbacher, D. Unutmaz and J. P. Wikswo, Lab Chip, 2008, 8, 1700–1712 RSC.
- K. Chung, C. A. Rivet, M. L. Kemp and H. Lu, Anal. Chem., 2011, 83, 7044–7052 CrossRef CAS PubMed.
- J. C. Love, J. L. Ronan, G. M. Grotenbreg, A. G. van der Veen and H. L. Ploegh, Nat. Biotechnol., 2006, 24, 703–707 CrossRef CAS PubMed.
- D. D. Carlo and L. P. Lee, Anal. Chem., 2006, 78, 7918–7925 CrossRef.
- G. Wang, G. Shi, H. Wang, Q. Zhang and Y. Li, Adv. Funct. Mater., 2014, 24, 1017–1026 CrossRef CAS.
- B. M. Taff and J. Voldman, Anal. Chem., 2005, 77, 7976–7983 CrossRef CAS PubMed.
- J. Voldman, M. L. Gray, M. Toner and M. A. Schmidt, Anal. Chem., 2002, 74, 3984–3990 CrossRef CAS.
- J. Enger, M. Goksör, K. Ramser, P. Hagberg and D. Hanstorp, Lab Chip, 2004, 4, 196–200 RSC.
- D. Irimia and M. Toner, Lab Chip, 2006, 6, 345–352 RSC.
- A. R. Wheeler, W. R. Throndset, R. J. Whelan, A. M. Leach, R. N. Zare, Y. H. Liao, K. Farrell, I. D. Manger and A. Daridon, Anal. Chem., 2003, 75, 3581–3586 CrossRef CAS.
- J. R. Rettig and A. Folch, Anal. Chem., 2005, 77, 5628–5634 CrossRef CAS PubMed.
- N. Varadarajan, B. Julg, Y. J. Yamanaka, H. Chen, A. O. Ogunniyi, E. McAndrew, L. C. Porter, A. Piechocka-Trocha, B. J. Hill and D. C. Douek, J. Clin. Invest., 2011, 121, 4322–4331 CAS.
- D. Di Carlo, N. Aghdam and L. P. Lee, Anal. Chem., 2006, 78, 4925–4930 CrossRef CAS PubMed.
- W.-H. Tan and S. Takeuchi, Proc. Natl. Acad. Sci. U. S. A., 2007, 104, 1146–1151 CrossRef CAS PubMed.
- N. L. Jeon, S. K. W. Dertinger, D. T. Chiu, I. S. Choi, A. D. Stroock and G. M. Whitesides, Langmuir, 2000, 16, 8311–8316 CrossRef CAS.
- O. Lipan and W. H. Wong, Proc. Natl. Acad. Sci. U. S. A., 2005, 102, 7063–7068 CrossRef CAS PubMed.
- L. Chingozha, et al., A generalizable, tunable microfluidic platform for delivering fast temporally varying chemical signals to probe single-cell response dynamics, Anal. Chem., 2014, 86(20), 10138–10147 CrossRef CAS PubMed.
- K. W. Oh, K. Lee, B. Ahn and E. P. Furlani, Lab Chip, 2012, 12, 515–545 RSC.
- Y. Xie, Y. Wang, L. Chen and C. Mastrangelo, Lab Chip, 2008, 8, 779–785 RSC.
- X. Zhang, A. Grimley, R. Bertram and M. G. Roper, Anal. Chem., 2010, 82, 6704–6711 CrossRef CAS PubMed.
- F. Azizi and C. H. Mastrangelo, Lab Chip, 2008, 8, 907–912 RSC.
- L. Chen, F. Azizi and C. Mastrangelo, Lab Chip, 2007, 7, 850–855 RSC.
- A. D. Stroock, S. K. Dertinger, A. Ajdari, I. Mezić, H. A. Stone and G. M. Whitesides, Science, 2002, 295, 647–651 CrossRef CAS PubMed.
- N. Bontoux, A. Pépin, Y. Chen, A. Ajdari and H. Stone, Lab Chip, 2006, 6, 930–935 RSC.
- A. Ajdari, N. Bontoux and H. A. Stone, Hydrodynamic dispersion in shallow microchannels: the effect of cross-sectional shape, Anal. Chem., 2006, 78(2), 387–392 CrossRef CAS PubMed.
- G. Taylor, Proc. R. Soc. London, Ser. A, 1953, 219, 186–203 CrossRef CAS.
- R. Aris, Proc. R. Soc. London, Ser. A, 1956, 235, 67–77 CrossRef.
- K. D. Omilusik, L. L. Nohara, S. Stanwood and W. A. Jefferies, Front. Immunol., 2013, 4, 164 Search PubMed.
- A. Skupin, H. Kettenmann and M. Falcke, Calcium signals driven by single channel noise, PLoS Comput. Biol., 2010, 6(8), e1000870 Search PubMed.
- A. Skupin, H. Kettenmann, U. Winkler, M. Wartenberg, H. Sauer, S. C. Tovey, C. W. Taylor and M. Falcke, Biophys. J., 2008, 94, 2404–2411 CrossRef CAS PubMed.
- J. Kwon, K. E. Shatynski, H. Chen, S. Morand, X. De Deken, F. Miot, T. L. Leto and M. S. Williams, Sci. Signaling, 2010, 3, ra59 CrossRef PubMed.
- L. A. Sena, S. Li, A. Jairaman, M. Prakriya, T. Ezponda, D. A. Hildeman, C.-R. Wang, P. T. Schumacker, J. D. Licht and H. Perlman, Immunity, 2013, 38, 225–236 CrossRef CAS PubMed.
- M. Reth, Nat. Immunol., 2002, 3, 1129–1134 CrossRef CAS PubMed.
- A. M. Malek, S. L. Alper and S. Izumo, JAMA, 1999, 282, 2035–2042 CrossRef CAS.
- A. M. Hirsch, C. A. Rivet, B. Zhang, M. L. Kemp and H. Lu, Lab Chip, 2009, 9, 536–544 RSC.
Footnotes |
| † Electronic supplementary information (ESI) available. See DOI: 10.1039/c4lc01070a |
| ‡ Authors contributed equally to this work. |
| This journal is © The Royal Society of Chemistry 2015 |