
Imprinted gold 2D nanoarray for highly sensitive and convenient PSA detection via plasmon excited quantum dots†
Hong Yan
Song
a,
Ten It
Wong
a,
Anton
Sadovoy
a,
Lin
Wu
b,
Ping
Bai
b,
Jie
Deng
a,
Shifeng
Guo
a,
Yi
Wang
 c,
Wolfgang
Knoll
acd and
Xiaodong
Zhou
*a
c,
Wolfgang
Knoll
acd and
Xiaodong
Zhou
*a
aInstitute of Materials Research and Engineering, A*STAR (Agency for Science, Technology and Research), 3 Research Link, Singapore 117602. E-mail: donna-zhou@imre.a-star.edu.sg
bElectronics and Photonics Department, Institute of High Performance Computing, A*STAR (Agency for Science, Technology, and Research), 1 Fusionopolis Way, Singapore 1386323
cCentre for Biomimetic Sensor Science, Nanyang Technological University, 50 Nanyang Drive, Research Techno Plaza 6th Storey, XFrontiers Block, Singapore 637553
dAustrian Institute of Technology (AIT), Donau-City-Straße 1, 1220 Vienna, Austria
First published on 16th October 2014
Abstract
We designed and fabricated two new nanostructured biosensing chips, with which the sensitive detection of prostate specific antigen (PSA) as low as 100 pg ml−1 can be achieved, by measuring the plasmon enhanced fluorescence through a conventional dark field microscope. The gold nanostructure arrays, one with gold nanopillars of 140 nm, the other with gold nanoholes of 140 nm, were fabricated via nanoimprinting onto glass substrate, as localized surface plasmon resonance (LSPR) generators to enhance the fluorescent emission of fluorophore, e.g. quantum dot (QD). A sandwich bioassay of capture anti-PSA antibody (cAb)/PSA/detection anti-PSA (dAb) labeled by QD-655 was established on the nanostructures, and the perfect LSPR excitation distance (10–15 nm) between the nanostructure and QD-655 was simulated and controlled by a cleft cAb fragment and streptavidin modified QD. QD was chosen in this study due to its photo stability, broad Stokes shift, and long lifetime. As far as we know, this is the first time that QD is applied for PSA detection on the uniform nanostructured sensing chips based on the LSPR enhanced fluorescence. Due to the miniaturized nanoarray sensing chip (1.8 mm × 1.8 mm), the convenience and specificity for the detection of PSA via the sandwich assay, and the high optical detection sensitivity, the platform has great potential for the development of a portable point-of-care (POC) system for outpatient diagnosis and treatment monitoring.
1. Introduction
The development of point-of-care system (POC) provides the possibility for fast, timely, low-cost health diagnosis and treatment monitoring outside the hospital, e.g. home, clinics, health centre. A small and disposable sensor chip is an essential part of a POC system, where the analytes are captured and quantified by electrical,1–4 optical,5–8 or mechanical tools.9,10 The quantification of the analytes is determined either by the assistance of labels to transmit or amplify the detection signals, or by physical or chemical change induced by analyte attachment under label-free conditions.Fluorescent immunoassay is popularly used in biology, because of a broad range of commercially available organic fluorescent dyes and well established labeling process for in situ measurements in the laboratory. However, the fluorescent signal from an organic dye is very weak, and it is prone to be photo bleached after several measurements, which leads to reduced sensitivity. To overcome the drawbacks of the organic fluorophore, researchers have developed methods to pre-concentrate samples prior to its on-chip detection, fabricate 3D chips to increase sample loading, or utilize plasmon generated on a noble metal surface to amplify the fluorescence signal. In recent years, Baba's group developed a three-dimensional (3D) hydrogel pillar-chip to increase the protein loading for multi-proteins' detection,11 and Knoll's group applied a long-range surface plasmons (LRSPs) – enhanced fluorescence microscopy to magnify the detection sensitivity of PSA in human serum.12 But the 3D chip needs further user development to be a practical POC component, and for the LRSPs – enhanced fluorescence microscopy detection, a highly sensitive but expensive photomultiplier tube (PMT) is required. As an alternative, localized surface plasmon resonance (LSPR) generated by gold nanostructures was selected to enhance the fluorescence signal in recent years.13–15 However, as reported, the plasmonic enhancement of the fluorescence dye emission is only 10–100 times,16,17 and the still weak fluorescent signal has to be detected by an expensive PMT,17 avalanche photodiode,18 or by exciting the plasmons with a strong laser beam.19
In this work, we have developed two kinds of uniform and mass fabricated gold nanostructure sensor chips for highly sensitive and facile fluorescent biomarker detection with a conventional fluorescent microscope (Scheme 1). As illustrated in the bottom right inset, a sandwich immuno-assay, e.g. capture anti-PSA antibody (cAb)/prostate specific antigen (PSA)/biotinylated detection anti-PSA antibody (biotin-dAb)/streptavidin conjugated quantum dot (QD), was established on the newly developed gold nanopillar or nanohole array fabricated on a glass substrate. QD was excited by plasmon generated by a gold nanopillar/nanohole (140 nm), and both the fluorescent image of the chip and the emission spectrum from an optical slit were recorded for each PSA concentration. Compared to organic fluorescence dyes, QD provides a brighter signal, prolonged lifetime, and broader Stokes shift. Our study demonstrated that the QD-655 in the PSA bioassay can be excited by LSPR at the wavelength of 540 nm with an emission peak at 655 nm, and the intensity of QD emission signal is proportional to the concentration of PSA, as measured by a microscope with a white light source and a short integration time of 20–100 ms. The fluorescence image recorded by the microscope camera on a gold nanopillar chip can discern PSA at 5 ng ml−1 by the naked eye, and the QD emission spectra taken by the microscope with 100 ms of signal integration indicated a limit of detection (LOD) below 10 pg ml−1 for PSA. Considering the medical screening cut-off of PSA for prostate cancer at 4 ng ml−1, our developed sandwich bioassay on the nanostructured sensing chip has great potential to be used in a miniaturized POC system for PSA early stage diagnosis.
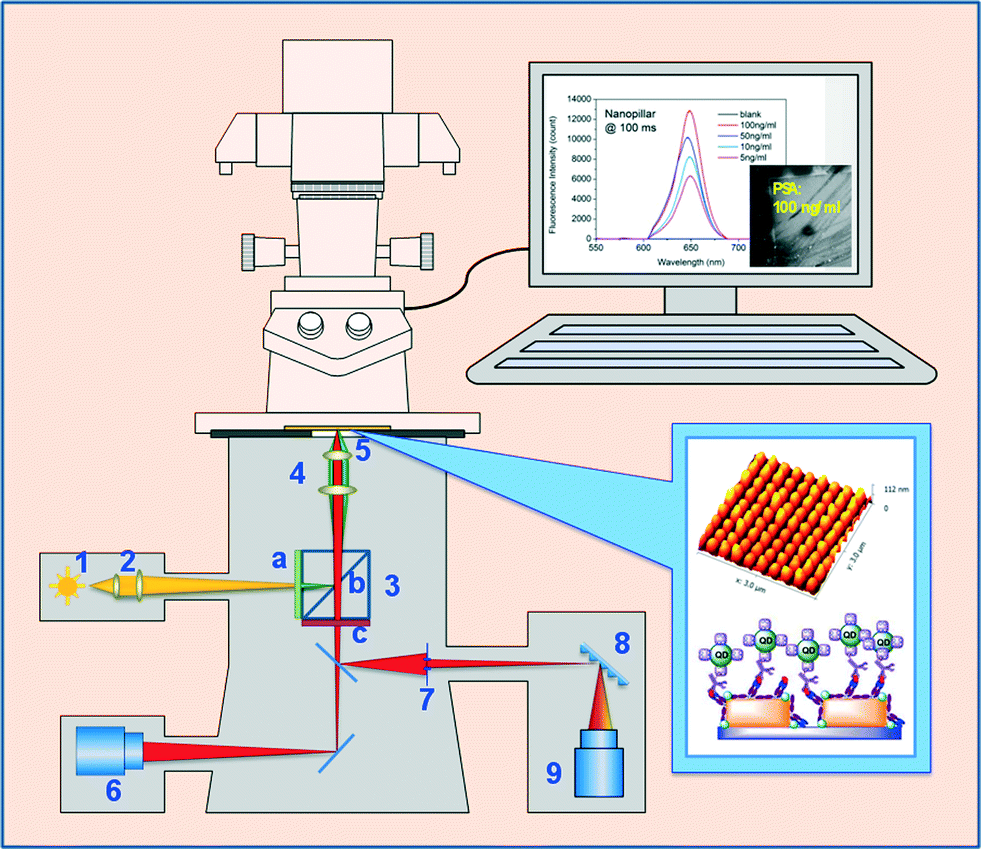 | ||
| Scheme 1 Schematic representation of our immunodetection set-up using a Nikon Ti Eclipse microscope. 1 – Mercury lamp 130 W; 2 – collimator; 3 – filter cube with beam splitter (a – band-pass filter 540 nm/25 nm, b – dichroic beam splitter long-pass 565 nm, c – band-pass filter 605 nm/55 nm); 4 – objective plan flour × 20 0.45 NA; 5 – sample; 6 – iXON EMCCD camera; 7 – optical slit of 500 μm width; 8 – diffraction grating; 9 – Newton 920 CCD detector. The computer screen shows the QD emission spectra (PSA at different concentrations) and the dark-field image of the sensor chip (PSA, 100 ng ml−1, 100 ms integration time); bottom right inset shows the schematic illustration of QD-655 sandwich immunoassay and the AFM image of the sensor chip (gold nanopillar array, 100 ng ml−1 of PSA). | ||
To the best of our knowledge, this is the first time that a uniform and mass fabricated nanostructured sensor chip was designed and fabricated on a glass substrate using nanoimprinting technology, and a QD based fluorescent sandwich bioassay was developed on the nanostructures to quantify the PSA concentration. Although there are reports describing the plasmon excited QD fluorescence enhancement, they are only limited to assembling the QDs close to the gold nanoparticles in liquid,20,21 or spin coating the QDs on the gold nanostructures.22,23 There is no report of a sandwich immunoassay, e.g. cAb/antigen/dAb labeled with QD, based on LSPR enhanced fluorescence on gold nanopillar/nanohole arrays, using a conventional fluorescent microscope to read-out.
Normally, it is challenging to position the QDs (2–10 nm in size) in the plasmonic field (<30 nm) of noble metal nanostructures, preferably 10–20 nm to the gold nanostructure surface, for optimal LSPR enhanced QD emission. The fluorescence from QD will be quenched when it is too close to the gold surface. We optimized the distance by immobilizing a cleft antibody fragment cAb onto the nanostructures to lower the cAb layer and at the same time, controlling the antibody active part (Fab) facing towards the analytes.24 Such a design maintains a desired distance for strong QD fluorescence signal read-out when detecting the biomarker PSA via the sandwich immunoassay cAb/PSA/dAb/QD.
2. Materials and methods
Materials
Purified human prostate specific antigen (PSA), PSA monoclonal capture antibody G3D6 (cAb) and PSA monoclonal detection antibody G1E3 (dAb) were purchased from BBI Solutions (Sittingbourne, UK). Biotinylated dAb (bio-dAb) was prepared using a standard protocol with NHS-PEG4-biotin as biotinylation reagent (Pierce protocols). Qdot® 655 streptavidin conjugate (QD-655) and NHS-PEG4-biotin were purchased from Life Technologies (Singapore). Bovine serum albumin (BSA) and tris(2-carboxyethyl) phosphine (TCEP) were purchased from Sigma-Aldrich (Singapore).4-(2-Hydroxyethyl)-1-piperazineethanesulfonic acid (HEPES) buffer (10 mM HEPES, 150 mM NaCl, prepared) was used as dilution buffer for PSA antibody immobilization, and HBS buffer (HEPES, with 3.4 mM EDTA, 0.05% P20) was used as binding buffer for PSA detection.
Plasmonic nanostructure simulation
The gold nanopillar and nanohole arrays were simulated with the COMSOL software, which is based on the finite element method to provide total plasmonic field information, including the reflection, transmission and absorption light intensity as well as the plasmonic near-field distribution around the gold nanostructures at different wavelengths. For the gold nanostructure array, only a unit cell composed of one gold nanostructure embedded in a square whose length equals the array pitch, needs to be calculated. For round or square gold nanostructures, only a quarter of the unit cell was simulated due to the geometrical symmetry.17,25In the simulation, the frequency-dependent dielectric function of gold was taken from Palik handbook,26 and the refractive indices for glass, air and water were taken as 1.52, 1.0, and 1.33, respectively. The simulation method was described in our previous publications,17,27 and also in ESI† Section 1.
To ensure the accuracy of the simulations, the sum of the calculated reflected, transmitted and absorbed power was checked against the input incident power, controlled within <2% error.
Gold nanopillar/nanohole array chip fabrication
The gold nanopillar array chip was fabricated by direct e-beam writing on a 4" glass wafer, followed by resist development, gold film coating and resist lift-off. The fabricated glass wafer was diced into chips, and each gold nanopillar array chip is 1 cm × 1 cm with a central 1.8 mm × 1.8 mm area covered by gold nanopillars.The gold nanohole array chip was fabricated by nanoimprinting. To fabricate a nickel mold, the nanopattern array was first written by e-beam lithography on a 4" silicon wafer. Following the resist development, a seed metal layer was coated, and a nickel layer up to 300 μm thick was electroplated on the silicon wafer. A 4" nickel mold was obtained by the separation of the silicon wafer and the nickel layer. The nickel mold was UV nanoimprinted on a 4" glass wafer coated with UV curable photoresist, and the gold nanohole array was obtained after gold film deposition and photoresist lift-off. Later, the glass wafer was diced into 1 cm × 1 cm chips, with a central 1.8 mm × 1.8 mm area covered by gold nanoholes and the outside area covered with gold film. The gold film is a good reference for analyzing the performance of the QD immune-assay on the gold nanohole array.
Reduction of anti-PSA cAb
Anti-PSA cAb was reduced according to a previously reported method.24 TCEP solution to reduce cAb was prepared in H2O at the concentration of 250 μM. A volume of 5 μL TCEP solution was added to 50 μL of the anti-PSA cAb in PBS (1.26 mg ml−1, 8.4 μM), and the mixture was incubated at room temperature for 30 min. After reaction, the mixture was purified by G25 column. The purified cleft cAb was stored at 4 °C, and diluted with HEPES buffer to the concentration of 50 μg mL−1 before use.Sandwich detection of PSA on the nanoarray sensor chip
Gold nanohole/nanopillar array chips were treated in a UV/O3 chamber for 7 min. The freshly cleaned chips were rinsed with water, then a drop of the reduced anti-PSA cAb in HEPES buffer (30 μl, 50 μg ml−1) was dripped onto the centre of each chip. The soaked chip was kept at 4 °C for overnight. After that, the chip was cleaned by HEPES. BSA solution (3 mg ml−1) was applied for 10 min to block the uncovered area. The chip was rinsed 3 times with HEPES buffer to remove the unbound proteins before the PSA detection.PSA was prepared at various concentrations in HBS (100 ng ml−1, 50 ng ml−1, 10 ng ml−1, 5 ng ml−1, 1 ng ml−1, 100 pg ml−1). A volume of 30 μl PSA solution was pipetted onto each sensor chip, whose surface was pre-modified with cleft cAb, and incubated for 1 h at room temperature. After that, the chip was rinsed three times with HBS, followed by adding a drop (20 μl) of biotin-dAb (20 μg ml−1) for 30 min incubation. Next, the chip was rinsed again with HBS, followed by applying a drop (15 μl) of streptavidin conjugated QD-655 (20 nM) for 30 min for efficient binding between biotin-dAb and the QD. The unbound QD-655 was flushed away, and the sandwich cAb/PSA/biotin-dAb/QD-655 immunoassay was fabricated on the nanoarray chips. The immunosensor chips were used for fluorescent measurement by removing the buffer and placing the chip with the immune assay side facing down. The control sensor chip was fabricated without applying PSA in the sandwich assay; another control was made by applying the sandwich assay on the flat gold film without the nanoarray.
Atomic force microscopy (AFM) for layer characterization of the immunoassay
A NanoWizard II instrument (JPK Instruments AG, Berlin, Germany) equipped with NanoWizard head and controller was used for the experiments. The triangular shaped silicon nitride cantilevers (Nano World, PNP-TR) were used throughout the scanning and the spring constant was calibrated using the thermal noise method, in the range of 0.07–0.09 N m−1. The experiments were performed in HBS buffer inside a fluid after 30–60 min equilibration.The quantitative imaging mode (QITM) in liquid was performed for the imaging. The QITM is a force spectroscopy based imaging mode enabling the user to have full control over the tip-sample force at each pixel of the image so that the lateral forces can be greatly minimized, which makes nondestructive imaging straightforward.
Fluorescent microscope for the immunodetection
To record fluorescent images and measure the spectra of the QD emissions, a fluorescent microscopy setup was used (Scheme 1). The setup consists of a Nikon Ti Eclipse fluorescent microscope equipped with an EMCCD camera (iXON EMCCD, Andor), which helps to capture very low fluorescent signals. The microscope is connected to a spectrograph (Andor Sherlock 300) equipped with a CCD detector 1024 × 512 (Newton 920 CCD detector, Andor). Both the camera and the detector were cooled down to −70 °C for noise reduction. A mercury lamp of 130 W was used as an excitation light source. Excitation wavelength 540 nm and emission signal >600 nm were obtained by utilizing a beam splitter consisting of a band-pass filter 540/25 nm, dichroic beam splitter long-pass 565 nm, and band-pass filter 605/55 nm. The biggest advantage of such a setup is that registration of image and fluorescent spectra can be obtained from the same area. The objective lens used for this experiment was plan fluor 20×, 0.45 NA. Exposure time was 20, 50, or 100 ms, and the input slit for spectra measurements was 500 μm.3. Results and discussion
Nanoarray sensor chip fabrication, characterization and simulation
The characterization and simulation of the fabricated gold nanopillar/nanohole array are summarized in Fig. 1. The gold nanopillar array is with a pitch of 320 nm and size of 140 nm × 140 nm; the gold nanohole array is with a pitch of 400 nm and size of 140 nm × 140 nm. Both nanoarrays include a film of 5 nm of chromium as the adhesive layer and 50 nm of gold for plasmon generation.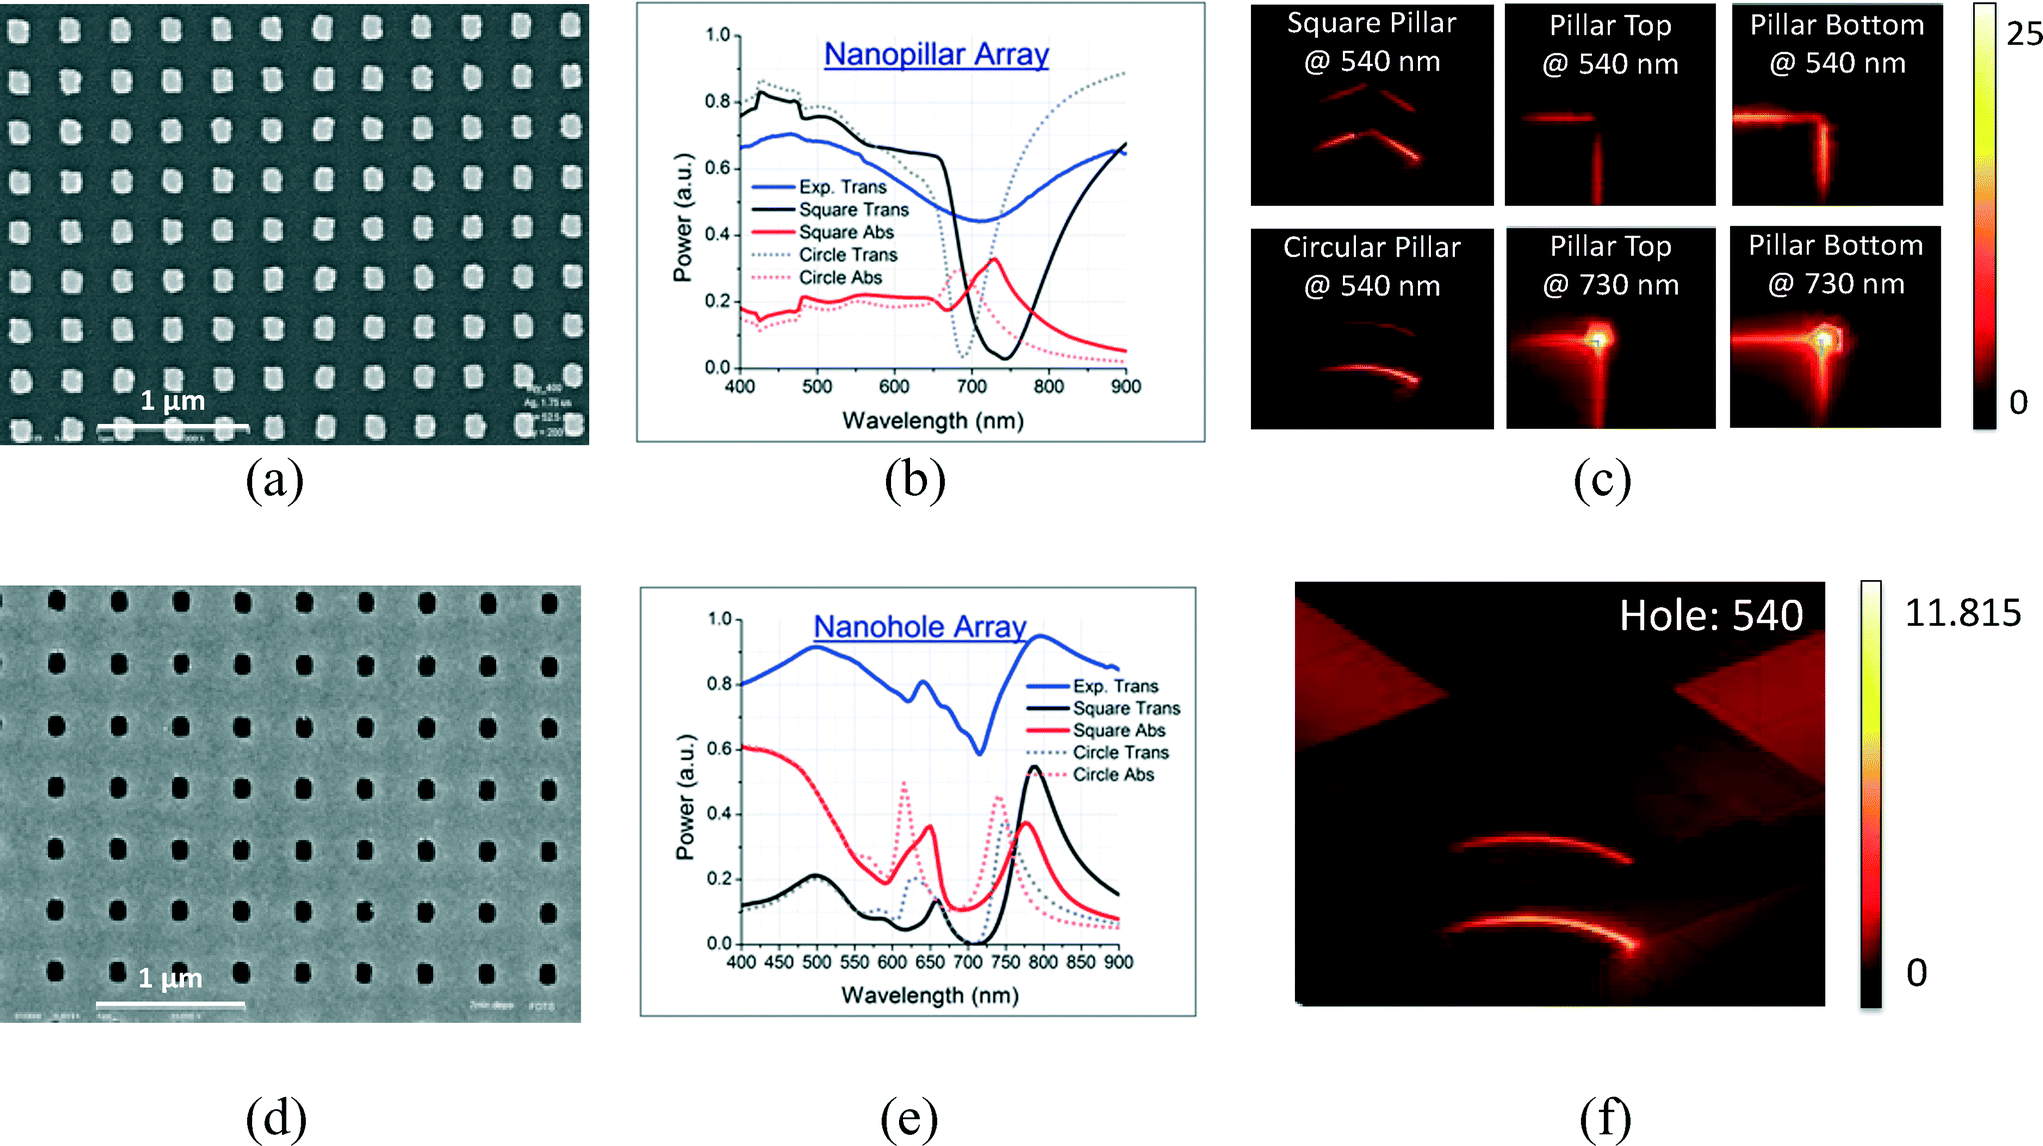 | ||
| Fig. 1 (a) SEM image of gold nanopillars array (320 nm pitch, 140 nm × 140 nm square) with 50 nm of gold and 5 nm of chromium. (b) Measured transmission spectrum (blue) of the fabricated nanopillar array in water, compared with the simulated (50 nm thickness of gold) transmission (black) and absorption (red) spectra for square (140 nm × 140 nm) and circular (140 nm in diameter) nanopillars. (c) Plasmonic field distributions at the wavelengths of 540 and 730 nm for the square and circular gold nanopillars. (d) SEM image of gold nanoholes (400 nm pitch, 140 nm × 140 nm square) with 50 nm of gold and 5 nm of chromium. (e) Measured transmission spectrum (blue) of fabricated nanoholes in water, compared with the simulated (50 nm of gold) transmission (black) and absorption (red) spectra for square (140 nm × 140 nm) and circular (140 nm in diameter) nanoholes. (f) Plasmonic field distributions at the wavelengths of 540 nm for circular gold nanoholes at a thickness of 50 nm. The light is illuminated from the gold nanoarray side in the experiments and simulations. | ||
Fig. 1(a) and (d) are scanning electron microscope (SEM) images of the gold nanoarrays, showing that the chips are of high quality and uniformity. The chips were further characterized by simulated and measured transmission spectra, with gold nanoarrays immersed in water and illuminated from the top, as plotted in Fig. 1(b) and (e). The adhesive chromium layer was not considered in the simulations, because this layer only slightly reduces the plasmonic intensity without shifting the peak wavelengths much. Both the square and round shapes of gold nanopillar and gold nanohole arrays were simulated.
The simulations of the transmission and plasmonic absorption (near-field) spectra in Fig. 1(b) and (e) showed that there is a blue shift for the round nanostructures compared to the square ones for both nanopillars and nanoholes. As shown in the SEM image, the fabricated gold nanostructures mostly maintain the original square shape in e-beam writing, and only a small part in the corner become round. Therefore, the measured transmission peaks/dips are in between the simulated ones for square and round nanostructures. This proves the high quality and satisfactory plasmon generation of our chips.
More detailed comparisons of the plasmonic enhancement factors for gold nanopillar and nanohole arrays are summarized in the ESI† [Section 1]. Simulations in Fig. 1(c) and (f) show that both the gold nanopillar and nanohole arrays will generate plasmonic amplification at the wavelength of 540 nm for QD excitation, and they have similar field distributions at the top and bottom rims of the nanostructures. At the wavelength of 540 nm, the gold nanoarrays have 4–8 (at the top rims) and 11–20 times (at the bottom rims) of enhancement, and the gold nanopillar array has 20–25% higher enhancement over the gold nanohole array. Considering the difficulty for analytes to reach the bottom of the nanostructures, the plasmonic enhancement on the top rims contributes more to the QD emissions.
Fig. 1(c) also exemplifies that at the wavelength of 540 nm, the round and square shaped nanostructures have similar plasmonic intensity at the bottom rims, but the square ones have a 50% stronger electromagnetic field at the top rims [ESI,† Section 1]. As presented in Fig. 1(b), (c) and (e), the strongest plasmonic peak for the gold nanopillar array is at the wavelength of 740 nm, while that for the gold nanohole array is at 650 or 750 nm. In the future, tuning the plasmonic peak of the gold nanostructures to 540 nm will further increase the QD emission enhancement.
Fig. 1(c) and (f) demonstrate that the plasmonic field decreases sharply as the distance to the gold nanostructure reduces. However, the fluorescence enhancement is the product of excitation enhancement and the dye's quantum yield defined as the fraction of radiative transitions from excited to ground state to the total decay rate. The quantum yield decreases up to zero as the dyes approach to the gold nanostructure surface, which is totally quenched by plasmon.28,29 For gold nanostructures, the optimal distance for maximal fluorescence enhancement is about 10–15 nm,30 which was well controlled in experiments by our sandwich immunoassay fabrication.
Sandwich immunoassay and layer-by-layer characterization
In our previous work, we had verified the thickness of cAb-SH on a dual polarization interferometry (DPI) sensor chip is 7.79 nm,24 which is more than half of the long axis of the Y shape antibody molecule (14.2 nm × 8.5 nm × 4.0 nm) and it adopts an end-on orientation.31 In addition, the cleft cAb fragments form a monolayer on the sensor chip, with each fragment occupying ~100 nm2 and a surface coverage of 2.47 ng mm−2.32In Fig. 2, AFM images were taken to inspect the layer-by-layer fabrication of the sandwich immunoassay cAb-SH/PSA (100 ng ml−1)/biotin-dAb/QD-655 on the nanoarray sensor chips [Fig. 2(a)]. As shown in Fig. 2(b) and (c), the cAb-SH layer did not exhibit much difference from the pristine gold nanostructures, which confirmed the formation of a homogenous monolayer of cAb-SH on the gold nanoarray. The AFM images also indicate the successful sandwich immunodetection, that the QDs are attached on the top of the sandwich cAb/PSA/biotin-dAb assay on the gold nano-arrays via biotin–streptavidin binding to the biotin-dAb.
 | ||
| Fig. 2 (a) Schematic illustration of sandwich immunoassay for PSA detection on gold nanoarray, with QD as labeling fluorophore. i, Blank gold nanoarray; ii, TCEP reduction of the cAb and self-assembly of the cAb-SH fragments on the gold nano-array, with BSA blocking; iii, PSA, biotin-dAb, and streptavidin conjugated QD-655 are applied sequentially to accomplish the sandwich immunoassay. (b) and (c) are AFM images of the layer-by-layer fabrication of the sandwich immunoassay on the gold nanohole and nanopillar arrays for i–iii in (a), the concentration of PSA is 100 ng ml−1. | ||
Fig. 2b shows that the QDs piled up to 320 nm on some areas of the gold nanohole array. This is because when two QDs were getting close and the wash was not stringent enough, biotin on one QD conjugated to the streptavidin of the other QD and formed closely-packed QD layers. QD-655 with streptavidin is a nano-rod of 13.1 ± 2.8 × 6.3 ± 0.9 nm,33 equivalent to a sphere with radius r = 4.6 nm. Assuming that the QDs are closely-packed spheres, for the nanoholes with 400 nm critical length of gold surface, the maximum QD height will be 280 and 323 nm, respectively, for the cubic and hexagonal closely-packed arrangements.34 Considering the QDs are actually nanorods and might not be ideally closely-packed, the actual QD thickness of 245–255 nm (320 nm minus the gold/chromium thickness of 55 nm and a rough cAb/PSA/dAb/QD thickness of 10–20 nm) is reasonable.
Fig. 2c displays the AFM images of the sandwich immunoassay on the gold nanopillar array. The third image (iii) shows that the QD height on the top of the bioassay is about 45–55 nm (120 nm minus 55 nm of metal and 10–20 nm of the cAb-PSA-dAb-QD complex), far below the possible heights of 98 and 113 nm when the QDs were fully closely-packed in cubic or hexagonal arrangements on top of the nanopillar with a critical length of 140 nm. The AFM image verifies that the QD aggregation is far less for the gold nanopillars compared to the nanoholes, probably due to its ease of flushing and removal of the unbound substances.
The QD aggregation leads to the nonlinearity of the QD signal to PSA concentration when the PSA concentration is high. In the following discussions, the nonlinearity of nanoholes is far more severe than nanopillars. The thickness of the aggregated QD is dependent on the surface wash stringency, PSA concentration, QD concentration and the shape of the nanostructures, so it is controllable by thoroughly washing, or lower PSA or QD concentration. The plasmon is highly localized within 10–20 nm distance on top of the nanostructures. The piled up QDs above the plasmon field are not enhanced by plasmons, but will be excited by microscopic light and the emission signal will be added to the enhanced fluorescence within the plasmon field. The emission signal from the aggregated QDs will contribute to the signal non-linearity to PSA concentration.
QD assay performance of gold nanopillars versus integration time
Fig. 3(a) shows the bright-field images and dark-field images of the QD based sandwich immunoassay for detection of different concentrations of PSA, under the Nikon Ti Eclipse microscope. The bright-field images did not show obvious differences, while the dark-field images with signal integrated at 100 ms indicate that the central nanopillar area demonstrated strong QD fluorescence emission compared with the outside glass substrate where there was no bioassay. A strong fluorescence image was observed at 100 ng ml−1 of PSA, while the chip with PSA as low as 5 ng ml−1 can be discerned by the naked eye in the dark-field image and 100 pg ml−1 is too weak to be discerned. The last column shows the images of a control chip (blank), which was also a gold nanopillar array chip with no PSA added in the sandwich assay. The totally dark image of the blank chip demonstrated that the non-specific binding in the bioassay was negligible. Because the measurement was performed by draining the buffer and with the immunoassay facing the incident light, the salt in some left-over tiny buffer droplets crystallized, causing some tiny bright dots in the dark-field images, which could be eliminated if the measurement was conducted in buffer.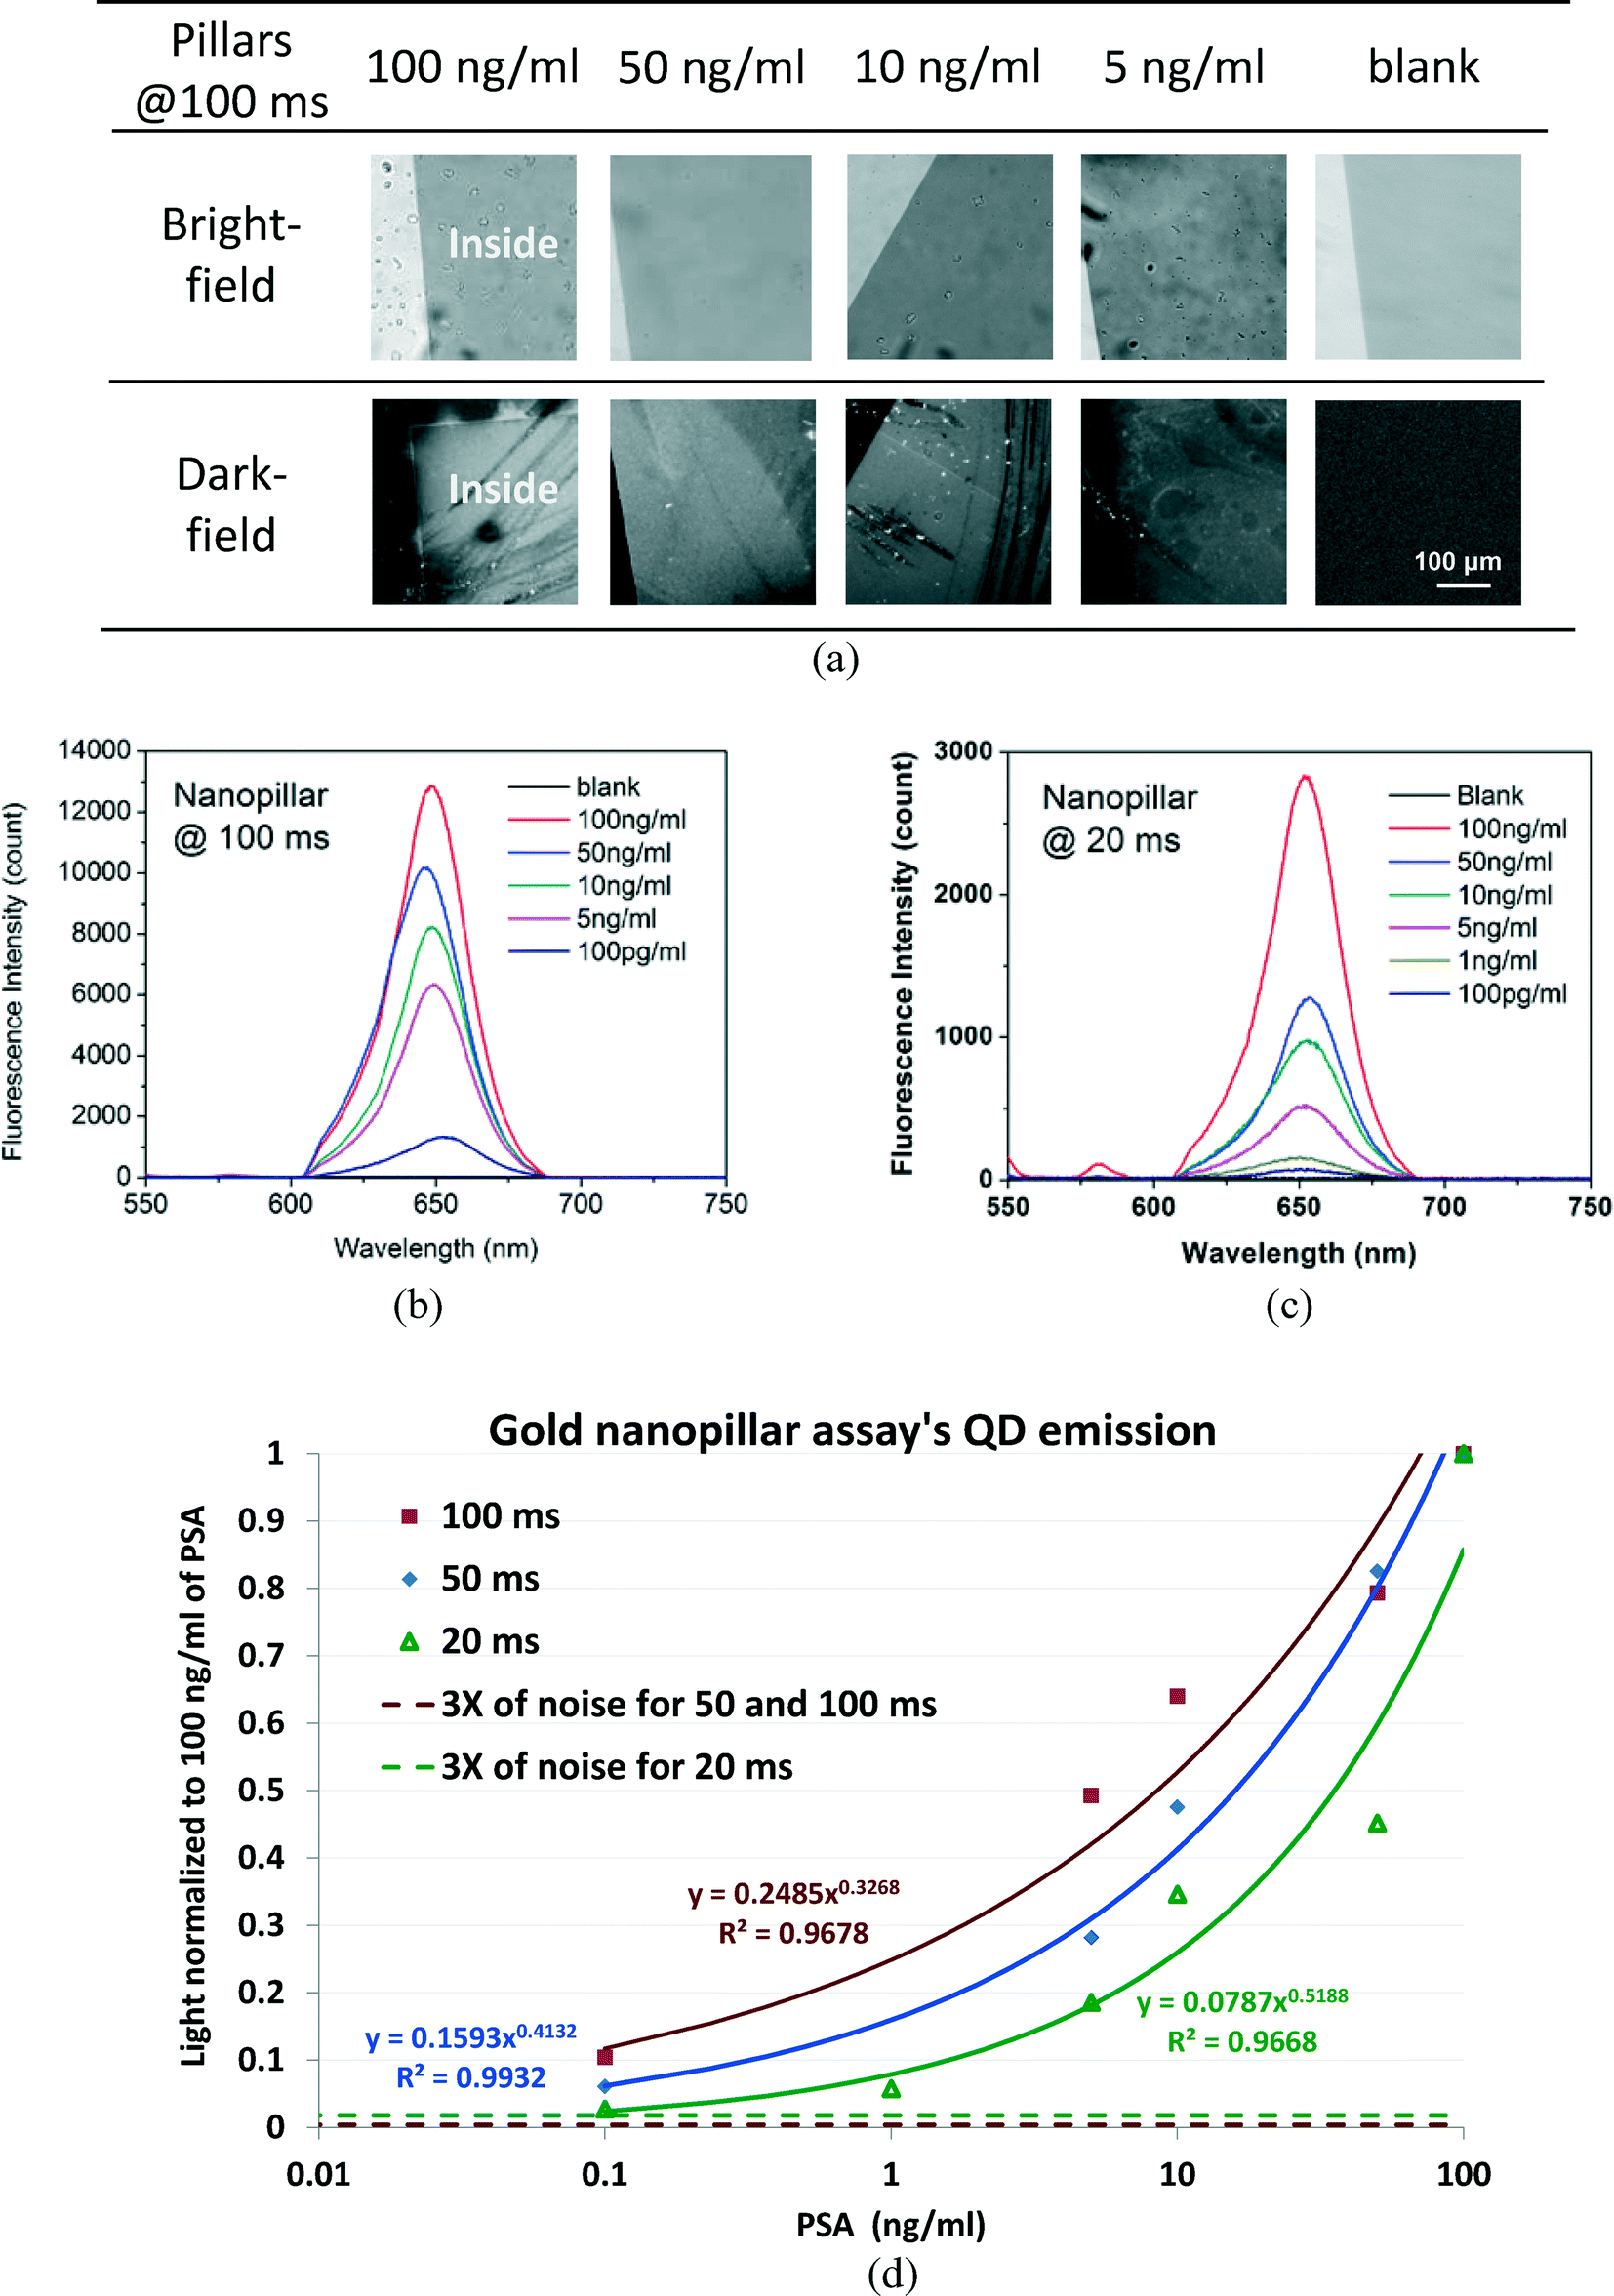 | ||
| Fig. 3 (a) Bright-field and dark-field fluorescent images (for all images, left shows glass area, right shows the gold nanopillar area) of QD based sandwich immunoassay on chips for different concentrations of PSA (100, 50, 10, 5 ng ml−1). The scale bar represents 100 μm and it is the same for all images. (b)–(c) are fluorescent spectra of QD bioassays for different concentrations of PSA (100, 50, 10, 5, 1 and 100 pg ml−1) on the gold nanopillar arrays, taken at (b) 100 and (c) 20 ms of integration time, where the blank is a control chip with no PSA added for the sandwich assay. (d) Characterization curves of the QD assay on gold nanopillars. | ||
Fig. 3(b)–(c) show the fluorescence spectra when different concentrations of PSA were applied in the sandwich immunoassay on the nanopillar sensor chip, at different integration times (100 ms and 20 ms) (Fig. S2, ESI†). The fluorescence spectra are used to quantify the PSA concentration as low as 100 pg ml−1, and the background noise was deducted by subtracting the minimum count in each spectrum. These spectra are less symmetric than the actual emissions of QD655,33 because the QDs have an emission peak at 655 nm, while the band-pass filter 605 nm/55 nm cuts off the light after 632.5 nm. The wavelengths of the QDs are also blue shifted due to the plasmonic effect.35,36
The characterization curves of the PSA detections (based on Table S2 in ESI†) are plotted in Fig. 3(d) with the count intensity normalized to 100 ng ml−1. The curves indicate that for the gold nanopillars, PSA concentration of 100 pg ml−1 can be detected at 20 ms of integration time at 3 times the noise level. However, based on a 3-time noise level, for 100 ms of integration time, the LOD of the sandwich PSA detection on our nanopillar chip will be less than 10 pg ml−1.
The QD emission curves at 50 and 100 ms are quasi-linear, while it is highly nonlinear at 20 ms at a high concentration. This is because the longer integration time suppresses the noise and enhances the weak signal. Since the QD bioassay is still quasi-linear after 100 ms, it seems even a longer integration time can further increase the detection sensitivity and the curve's linearity. Other minor issues affecting the linearity of the QD bioassay might be the co-effect of the QD aggregation at a high PSA concentration [Fig. 2(b)] and the tweezers effect of the plasmonic field.37,38 Due to the tweezers effect, the plasmonic field will attract the QD sandwich bioassay into the plasmonic area; however, it takes some time. Since the QDs are already piled up tightly at the high PSA concentration, the tweezers effect should be more obvious for lower PSA concentrations and longer integration times such as 100 ms.
Assuming the QD emission spectra are in Gaussian distribution in Fig. 3(b) and (c), 100, 50, 10, 5, and 0.1 ng m−1 of PSA concentrations have 1.53 × 10⁶, 1.40 × 10⁶, 1.30 × 10⁶, 121 × 106 and 9.55 × 10⁵ counts per second for each spectrum, respectively [ESI,† Section 3]. 1.53 × 10⁶ cps is considered to be a high fluorescent intensity, which is the reason for the QD images to be directly observed with the naked eye under a dark-field microscope.
The linear intensity of the QD emission is related with the brightness of the images in Fig. 3(a), based on the count differences for the QD emission peaks at different PSA concentrations, the linear light intensities for 50, 10, 5 and 0.1 ng ml−1 of PSA are 0.71, 0.55, 0.43 and 0.22 of the intensity for 100 ng ml−1 of PSA [ESI,† Section 3]. This estimation is very close to the image intensity difference shown in Fig. 3(a) for these PSA concentrations.
Although the correlations between the images and fluorescence spectra greatly helped us to analyze the QD bioassay's emissions, in real applications of the QD bioassay, it can be detected by a conventional optical detector for QD signal quantifications, as the QD emission is as strong as one million counts per second.
QD assay performance of gold nanoholes versus surface coverage
For the gold nanohole array, the QD bioassay is established on both the gold nanohole array and its outside gold film, and the unevenness of gold film also contributes to the QD excitation enhancement although not as strong as the gold nanoholes array. According to the fluorescence images of the QD bioassay in Fig. 4(a) for integration durations of 100 and 20 ms, the inside gold nanohole area showed a much stronger fluorescence emission than the outside gold film due to its higher plasmonic enhancement, and the signal difference between the outside and the inside decreases as the PSA concentration becomes lower. In the control experiment using the same kind of chip without applying PSA, the image was totally dark, representing very low non-specific binding in the bioassay. | ||
| Fig. 4 (a) Dark-field fluorescent images (for all images, left shows the gold film surface, right shows the gold nanohole area) of QD bioassay on chips for various PSA concentrations (100, 10 and 1 ng ml−1). The scale bar represents 100 μm and it is the same for all images. (b)–(c) Fluorescent spectra of QD bioassays for different PSA concentrations (100, 50, 10 and 1 ng ml−1) on the gold nanohole array, taken at (b) 100 and (c) 20 ms of integration time respectively, where the blank is the control chip with no PSA. (d) Characterization curves of the QD assay. | ||
Fluorescence spectra of the QD bioassays (with each spectral background noise deducted) inside and outside the gold nanohole array are plotted in Fig. 4(b) and (c), with the peak counts summarized in ESI.† For the images in Fig. 4(a), the fluorescence spectra can clearly discern the enhanced fluorescence of the bioassay as low as 1 ng ml−1 in the nanohole area (inside) from the outside gold film. The characterization curves of the QD bioassay on the gold nanohole array chips (based on Tables S3 and S4 in ESI,† Section 4) are plotted in Fig. 4(d), with the QD emission intensity normalized to the 100 ng ml−1 PSA QD emission for different integration times.
In Fig. 4(d), the response of the QD emission on the gold nanoholes is nonlinear to the PSA concentration at the integration time of 20 ms. On the gold film outside the nanoholes, the QD emission is very low, but it is relatively linear to the PSA concentration. According to the fitted characterization curves of the PSA concentration and the base line for 3 times of noise, it is very difficult to detect the PSA concentration of 1 ng ml−1 with 20 ms of integration time. However, when the integration time increased to 100 ms, the noise count was about the same, and the relative noise level normalized to the QD emission at 100 ng ml−1 of PSA was about 5 times smaller. Therefore, the PSA concentration of 1 ng ml−1 can be detected inside the nanoholes. On the gold film outside the nanoholes, the QD signal at 1 ng ml−1 of PSA is very close to the 3-time noise level for 100 ms of integration time, thus 1 ng ml−1 of PSA cannot be detected in the gold film area.
Because the microscope's optical system has the factor [A = 17![[thin space (1/6-em)]](https://www.rsc.org/images/entities/char_2009.gif) 770.65, in ESI† Section 3] for converting the optical intensity into counts, the gold nanoholes have the intensity of 1.81 × 10⁶ and 0.95 × 10⁶ counts per second for the whole spectrum for 100 and 1 ng ml−1 of PSA.
770.65, in ESI† Section 3] for converting the optical intensity into counts, the gold nanoholes have the intensity of 1.81 × 10⁶ and 0.95 × 10⁶ counts per second for the whole spectrum for 100 and 1 ng ml−1 of PSA.
The gold nanohole count of 18336.67 at 100 ms for 100 ng ml−1 of PSA is actually about 2 times brighter than that of the gold nanopillars. This is due to more severe QD aggregation on the gold nanoholes than on the gold nanopillars at high PSA concentrations, that more piled-up QDs on the gold nanoholes render brighter emissions. However, the nanohole QD emission at 100 ms drops 9.2 times (i.e., to 11%) when the PSA concentration is reduced to 1 ng ml−1. This drop is much faster than that with the gold nanopillars, which implies that the QD bioassay on the gold nanoholes is nonlinear and insensitive for PSA detection.
The gold nanopillar array performs better than the gold nanohole array with a much more linear PSA detection curve, higher sensitivity and lower noise level, because at the wavelength of 540 nm, the calculated plasmonic field intensity for the gold nanopillars is about 20–25% higher than that for the gold nanoholes.
Furthermore, the gold nanopillars also have a much higher surface and volume coverage of the QDs enhanced by the plasmonic field than the gold nanoholes. Based on the simulations of plasmonic field in Fig. 1, the quenching effect, and the geometry of our designed gold nanoholes and nanopillars, we can assume that only the QDs within a lateral distance of 15 nm to the rims and within a vertical distance of 5–15 nm to the gold surface are effectively excited by plasmon. Thus the surface coverage (ratio of the surface area of the QDs to the gold nanostructure area) of the QDs that can be excited by plasmons is about 18% for square gold nanoholes and 66% for gold nanopillars, while the volume coverage (ratio of the volume of QDs to the gold nanostructure volume) is about 4.8% for the square gold nanoholes, and 40% for the gold nanopillars (ESI,† Section 5). Because the AFM images in Fig. 2 show that gold nanoholes have more QDs on the surface than the nanopillars, this infers that it is the QDs excited by the plasmons which determine the bioassay performance. Therefore, we believe that once the gold nanostructures are designed with the strongest plasmonic peak coincident with the QD excitation wavelength, the QD bioassay's performance will be further improved.
4. Conclusions
We have established a novel QD-based bioassay for plasmonic sensor chips that can be detected by a conventional microscope within tens of milliseconds. The factors impacting the performance of the QD bioassay on the gold structures include: (1) the plasmonic field intensity at the QD excitation wavelength; (2) the design of the bioassay such as controlling the distance between the nanostructures and the QDs, and controlling the orientation of the PSA capturing links via cleft antibody fragments; (3) the number of QDs being excited by the plasmons; and (4) the optical integration time. In our proof-of-concept experiments, PSA are detected at 100 pg ml−1 and 1 ng ml−1 on gold nanopillar and nanohole arrays, respectively, for 100 ms of optical integration time. The LOD of the PSA detection is less than 10 pg ml−1 on the Nikon Ti Eclipse microscope due to the low noise of its camera. The nanostructures we used do not have strong plasmonic peaks for QD excitations at 540 nm, which leaves room to further improve the detection sensitivity by tuning the plasmonic peak with dimension optimized gold nanostructures.The QD bioassay we developed is robust and has a long shelf-life, i.e., the chip can be regenerated by applying glycine solution (pH 2.0), and the cAb modified chip can be kept in 4 °C for several days without affecting the performance of the sandwich bioassay. The QD bioassay is also suitable for detecting biomarkers with relatively low molecular weight, due to the QD's big size and brightness with effective plasmonic amplification. Furthermore, the large Stokes shift of the QD-655 facilitates the easy separation and detection of the weak QD emission at low PSA concentration from the strong excitation light. In future, this nanoarray chip can be incorporated with microfluidics to form a point-of-care system, which can use a laser beam as a light source and a microscope camera as its detector, without sacrificing much of the clinical required detection sensitivity.
Acknowledgements
The authors are grateful to the Science & Engineering Research Council (SERC) of Agency for Science, Technology and Research (A*STAR), for its financial support of the project 102 152 0014 on plasmonic biosensor research. The biosensing chips were fabricated and characterized in the SERC nano fabrication, processing and characterisation (SnFPC) at the Institute of Materials Research and Engineering (IMRE).References
- M. Arredondo, M. Stoytcheva, R. Zlatev and V. Gochev, Mini-Rev. Med. Chem., 2012, 12, 1301–1313 CrossRef CAS.
- G. Liu, Y. Zhang and W. Guo, Biosens. Bioelectron., 2014, 61, 547–553 CrossRef CAS PubMed.
- S. Patterson, K. Hsieh, H. T. Soh and K. W. Plaxco, Trends Biotechnol., 2013, 31, 704–712 CrossRef PubMed.
- S. Prakash, T. Chakrabarty, A. K. Singh and V. K. Shahi, Biosens. Bioelectron., 2013, 41, 43–53 CrossRef CAS PubMed.
- Y. Cheng, H. Xie, P. Sule, H. Hassounah, E. A. Graviss, Y. Kong, J. D. Cirillo and J. Rao, Angew. Chem., Int. Ed., 2014, 53, 9360–9364 CrossRef CAS PubMed.
- G. Gauglitz, Annu. Rev. Anal. Chem., 2014, 7, 297–315 CrossRef PubMed.
- K. N. Han, C. A. Li and G. H. Seong, Annu. Rev. Anal. Chem., 2013, 6, 119–141 CrossRef CAS PubMed.
- J. M. Klostranec, Q. Xiang, G. A. Farcas, J. A. Lee, A. Rhee, S. D. Lafferty, K. C. Perrault, W. C. Kain and W. C. Chan, Nano Lett., 2007, 7, 2812–2818 CrossRef CAS PubMed.
- R. Hao, D. Wang, X. Zhang, G. Zuo, H. Wei, R. Yang, Z. Zhang, Z. Cheng, Y. Guo, Z. Cui and Y. Zhou, Biosens. Bioelectron., 2009, 24, 1330–1335 CrossRef CAS PubMed.
- H. J. Lee, K. Namkoong, E. C. Cho, C. Ko, J. C. Park and S. S. Lee, Biosens. Bioelectron., 2009, 24, 3120–3125 CrossRef CAS PubMed.
- M. Ikami, A. Kawakami, M. Kakuta, Y. Okamoto, N. Kaji, M. Tokeshi and Y. Baba, Lab Chip, 2010, 10, 3335–3340 RSC.
- Y. Wang, A. Brunren, J. Dostalek and W. Knoll, Anal. Chem., 2009, 81, 9625–9632 CrossRef CAS PubMed.
- Q. Cui, F. He, L. Li and H. Möhwald, Adv. Colloid Interface Sci., 2014, 207, 164–177 CrossRef CAS PubMed.
- D. Darvill, A. Centeno and F. Xie, Phys. Chem. Chem. Phys., 2013, 15, 15709–15726 RSC.
- W. Deng, F. Xie, H. T. Baltar and E. M. Goldys, Phys. Chem. Chem. Phys., 2013, 15, 15695–15708 RSC.
- Y. Fu, J. Zhang and J. R. Lakowicz, Biochem. Biophys. Res. Commun., 2008, 376, 712–717 CrossRef CAS PubMed.
- T. I. Wong, S. Han, Y. Wang, J. Deng, C. Y. L. Tan, L. Wu, P. Bai, Y. C. Loke, X. D. Yang, M. S. Tse, S. H. Ng and X. Zhou, Lab Chip, 2013, 13, 2405–2413 RSC.
- A. Kinkhabwala, Z. Yu, S. Fan, Y. Avlasevich, K. Müllen and W. E. Moerner, Nat. Photonics, 2009, 3, 654–657 CrossRef CAS.
- Y. Liu and S. Blair, Opt. Lett., 2003, 28, 507–509 CrossRef CAS.
- L. Melo, C. Chaves, P. Filho, S. Saska, K. Nigoghossian, A. Gomes, Y. Messaddeq, S. Ribeiro, B. Santos, A. Fontes and R. Araujo, Plasmonics, 2013, 8, 1147–1153 CrossRef CAS.
- D. Nepal, L. F. Drummy, S. Biswas, K. Park and R. A. Vaia, ACS Nano, 2013, 7, 9064–9074 CrossRef CAS PubMed.
- H. Aouani, S. Itzhakov, D. Gachet, E. Devaux, T. W. Ebbesen, H. Rigneault, D. Oron and J. Wenger, ACS Nano, 2010, 4, 4571–4578 CrossRef CAS PubMed.
- J. H. Song, T. Atay, S. Shi, H. Urabe and A. V. Nurmiko, Nano Lett., 2005, 5, 1557–1561 CrossRef CAS PubMed.
- H. Y. Song, J. Hobley, X. Su and X. Zhou, Plasmonics, 2014, 9, 851–858 CrossRef CAS.
- L. Wu, P. Bai, X. Zhou and E. P. Li, IEEE Photonics J., 2012, 4, 26–33 CrossRef.
- E. Palik, Handbook of optical constants of solids, Elsevier, 1998 Search PubMed.
- L. Wu, P. Bai and E. P. Li, J. Opt. Soc. Am. B, 2012, 29, 521 CrossRef CAS.
- P. Bharadwaj and L. Novotny, Opt. Express, 2007, 15, 14266–14274 CrossRef CAS.
- J. Lakowicz, Y. Shen, S. D'Auria, J. Malicka, J. Fang, Z. Gryczynski and I. Gryczynski, Anal. Biochem., 2002, 301, 261–277 CrossRef CAS PubMed.
- W. Deng and E. M. Goldys, Langmuir, 2012, 28, 10152–10163 CrossRef CAS PubMed.
- A. Ahluwalia, D. D. Rossi and A. Schirone, Thin Solid Films, 1992, 210–211, 726 CrossRef.
- J. Buijs, J. W. T. Lichtenbelt, W. Norde and J. Lyklema, Colloids Surf., B, 1995, 5, 11 CrossRef CAS.
- H. Montón, C. Nogués, E. Rossinyol, O. Castell and M. Roldán, J. Nanobiotechnol., 2009, 7, 4 CrossRef PubMed.
- X. Zhou, K. Y. Liu, W. Knoll, C. Quan and N. Zhang, Plasmonics, 2010, 5, 141–148 CrossRef.
- T. Itoh, Y. S. Yamamoto, H. Tamaru, V. Biju, N. Murase and Y. Ozaki, Phys. Rev. B: Condens. Matter Mater. Phys., 2013, 87, 235408 CrossRef.
- E. C. Le Ru, P. G. Etchegoin, J. Grand, N. Félidj, J. Aubard and G. Lévi, J. Phys. Chem. C, 2007, 111, 16076–16079 CAS.
- K. Hirano, H. Shimizu, T. Enami, M. Terakawa, M. Obara, N. N. Nedyalkov and P. A. Atanasov, J. Nanotech. Diagn. Treat., 2013, 1, 2–10 CrossRef CAS PubMed.
- M. L. Juan, M. Righini and R. Quidant, Nat. Photonics, 2011, 5, 349–356 CrossRef CAS.
Footnote |
| † Electronic supplementary information (ESI) available. See DOI: 10.1039/c4lc00978a |
| This journal is © The Royal Society of Chemistry 2015 |