
 Open Access Article
 This Open Access Article is licensed under a
 Creative Commons Attribution 3.0 Unported Licence
A rapid and efficient ion-exchange chromatography for Lu–Hf, Sm–Nd, and Rb–Sr geochronology and the routine isotope analysis of sub-ng amounts of Hf by MC-ICP-MS†
R.
Bast
*a,
E. E.
Scherer
a,
P.
Sprung
b,
M.
Fischer-Gödde
c,
A.
Stracke
a and
K.
Mezger
d
aInstitut für Mineralogie, Westfälische Wilhelms-Universität Münster, Corrensstr. 24, D-48149 Münster, Germany. E-mail: Rebecca.Bast@uni-muenster.de
bInstitut für Geologie und Mineralogie, Universität zu Köln, Zülpicher Str. 49b, D-50674 Köln, Germany
cInstitut für Planetologie, Westfälische Wilhelms-Universität Münster, Wilhelm-Klemm-Str. 10, D-48149 Münster, Germany
dInstitut für Geologie, Universität Bern, Baltzerstraße 1+3, CH-3012 Bern, Switzerland
First published on 15th September 2015
Abstract
The development and improvement of MC-ICP-MS instruments have fueled the growth of Lu–Hf geochronology over the last two decades, but some limitations remain. Here, we present improvements in chemical separation and mass spectrometry that allow accurate and precise measurements of 176Hf/177Hf and 176Lu/177Hf in high-Lu/Hf samples (e.g., garnet and apatite), as well as for samples containing sub-nanogram quantities of Hf. When such samples are spiked, correcting for the isobaric interference of 176Lu on 176Hf is not always possible if the separation of Lu and Hf is insufficient. To improve the purification of Hf, the high field strength elements (HFSE, including Hf) are first separated from the rare earth elements (REE, including Lu) on a first-stage cation column modified after Patchett and Tatsumoto (Contrib. Mineral. Petrol., 1980, 75, 263–267). Hafnium is further purified on an Ln-Spec column adapted from the procedures of Münker et al. (Geochem., Geophys., Geosyst., 2001, DOI: 10.1029/2001gc000183) and Wimpenny et al. (Anal. Chem., 2013, 85, 11258–11264) typically resulting in Lu/Hf < 0.0001, Zr/Hf < 1, and Ti/Hf < 0.1. In addition, Sm–Nd and Rb–Sr separations can easily be added to the described two-stage ion-exchange procedure for Lu–Hf. The isotopic compositions are measured on a Thermo Scientific Neptune Plus MC-ICP-MS equipped with three 1012 Ω resistors. Multiple 176Hf/177Hf measurements of international reference rocks yield a precision of 5–20 ppm for solutions containing 40 ppb of Hf, and 50–180 ppm for 1 ppb solutions (=0.5 ng sample Hf 0.5 in ml). The routine analysis of sub-ng amounts of Hf will facilitate Lu–Hf dating of low-concentration samples.
Introduction
In addition to K–Ar, U–Pb, and Pb–Pb, the long-lived Lu–Hf, Sm–Nd, and Rb–Sr decay systems are among the most widely used chronometers for dating terrestrial rocks and meteorites. These systems often respond differently to heating and cooling, metamorphism, impact shock, or low-temperature alteration. Applying multiple chronometers to the same sample can therefore yield important information about its thermal history. In principle, many whole-rocks and minerals contain concentrations of trace elements that are sufficient to allow dating of <100 mg samples using multiple decay systems. In practice, however, it is often difficult to obtain enough pure mineral separates for this purpose, especially when the sample size is limited as is the case for many meteorites. Angrites, for example, are not only rare meteorites (23 specimens altogether, mostly <1 kg total mass, of which only a few g are typically available for destructive analysis), but also contain Hf-poor minerals such as plagioclase (<20 ppb), olivine (<150 ppb), and phosphates (down to a few ppb). The latter two have relatively high Lu/Hf and are therefore important for increasing the range in 176Lu/177Hf among internal isochron points and precisely constraining dates.Recent low-level Lu–Hf analyses (e.g., Herwartz et al.,4 Bast et al.5) have been performed following the chemical separation procedure of Münker et al.,2 which is currently used—at least in part—by many laboratories. This method simplified the Lu–Hf separation from 3 or 4 column stages1,6–9 to a single Ln-Spec column, greatly streamlining the chemical procedure for Lu–Hf work. During loading and initial rinsing, most major elements are not adsorbed onto Ln-Spec resin. Therefore, the elution profiles of Lu and Hf are not greatly affected by variable bulk sample compositions, and the Hf yield remains high even if large amounts (several grams) of sample are processed. A pre-separation of matrix elements by precipitation as described in earlier methods6,8–10 is therefore unnecessary. Unfortunately, the single-column separation is not sufficient for high-Lu/Hf samples because the heavy rare earth elements (HREE) tail into the Hf fraction, leading to significant isobaric interferences on 176Hf during MC-ICP-MS analysis. In addition, variable amounts of Zr and Ti may elute with Hf, depending on the exact molarity of the HCl–HF mixture used and perhaps also the condition or age of the Ln-Spec resin. The presence of these two elements in the Hf fraction can influence the mass bias behavior relative to that of Hf-only solution standards and thus compromise the accuracy of 176Hf/177Hf measurements.2,8,11,12 As a workaround, Hf cuts can be passed through Ln-Spec resin twice for an improved separation13 followed by an additional cation column to remove remaining HREE. Performing two passes through the Ln-Spec column has the additional advantage that a sample may be initially loaded without ascorbic acid,13 which would otherwise elute with the Sm, Nd, Rb, and Sr-bearing matrix, complicating the later separation of these geochronologically important elements. Overall, the chemical separation for multiple radioisotope systems from a single sample aliquot is possible when using the method of Münker et al.2 but requires the addition of at least 2 column stages, prolonging the procedure and increasing the analytical blank.
The purpose and goals of developing a new chemical separation method are to (1) decrease the amount of Lu in the Hf fraction to insignificant levels, (2) decrease the amount of acid required for efficient Ti elution, (3) improve the separation of Hf from Zr, (4) avoid ascorbic acid in eluted fractions that can be used for Rb, Sr, Sm, and Nd analyses, and (5) minimize the procedural blank. Each of these requirements will be explained in more detail below.
(1) Decreasing the amount of Lu (and Yb) in the Hf fraction
The isobaric interferences of 176Lu and 176Yb on 176Hf are monitored by measuring the 175Lu and 173Yb signals during Hf isotope analysis. The Lu–Hf system is analogous to the 87Rb–87Sr system in that the radioactive parent nuclides (176Lu, 87Rb) are also the spike isotopes, and they isobarically interfere with their respective daughter isotopes (176Hf, 87Sr). It is therefore crucial to achieve complete parent-daughter separation before MC-ICP-MS analysis.In the single-column procedure of Münker et al.,2 Lu is eluted from the Ln-Spec resin before Hf, and—at least for some batches of Ln-Spec resin—residual Lu has been observed to tail into the Hf cut, especially for high-Lu/Hf samples such as garnet and apatite (Table 1). Lutetium in the Hf fraction of a spiked sample comprises not only a mixture of natural sample Lu and 176Lu-enriched spike, but also any blank Lu accumulated after Lu elution, up to and including MC-ICP-MS sample introduction, i.e., the Lu blank along the Hf path through the chemistry. Over this relatively long path (120 ml of acid used), the residual spiked sample Lu, which has the same 176Lu/175Lu as measured in the Lu isotope dilution (ID) measurement, gets continually diluted with blank Lu of natural composition as it is gradually stripped from the column. The relative contributions of spiked sample Lu and the Hf-path Lu blank are highly variable and thus the 176Lu/175Lu of Lu in the Hf fraction is not easy to determine, leading to inaccurate interference corrections for spiked samples.
| Fraction | n | Yb monitor (173Yb/176Σ) | Lu monitor (175Lu/176Σ) | ||||
|---|---|---|---|---|---|---|---|
| Median | Min | Max | Median | Min | Max | ||
| a Mineral abbreviations: wr: whole-rock, grt: garnet, ap: apatite, cpx: clinopyroxene, opx: orthopyroxene, plag: plagioclase, ol: olivine, lws: lawsonite. 176Σ = 176Yb + 176Lu + 176Hf. Hafnium fractions that yielded unacceptably high interference monitors (see text) had to be passed through an additional X12 cation column to remove HREE and re-analyzed before the 176Hf/177Hf data could be published. | |||||||
| 3-stage anion exchange chromatography 7 with HF and H 2 SO 4 | |||||||
| wr | 8 | 0.00008 | 0.00007 | 0.0001 | 0.00005 | 0.00003 | 0.00009 |
![[thin space (1/6-em)]](https://www.rsc.org/images/entities/char_2009.gif) |
|||||||
| Single-pass Ln-Spec 2 | |||||||
| wr | 59 | 0.0001 | 0.00003 | 0.007 | 0.0002 | 0.00005 | 0.008 |
| grt | 103 | 0.0004 | 0.00006 | 0.1 | 0.001 | 0.0001 | 0.09 |
| ap | 6 | 0.001 | 0.0007 | 0.003 | 0.001 | 0.0004 | 0.007 |
| cpx | 29 | 0.0001 | 0.00002 | 0.008 | 0.0002 | 0.00005 | 0.007 |
| opx | 11 | 0.0003 | 0.00001 | 0.01 | 0.0002 | 0.00007 | 0.02 |
| plag | 6 | 0.0001 | 0.00000 | 0.0006 | 0.0001 | 0.00003 | 0.0007 |
| ol | 3 | 0.01 | 0.007 | 0.02 | 0.01 | 0.008 | 0.02 |
|
|||||||
| Double-pass Ln-Spec 2,13 | |||||||
| wr | 10 | 0.000002 | 0.000001 | 0.00001 | 0.00003 | 0.00001 | 0.00009 |
|
|||||||
| Single-pass Ln-Spec 2 , plus X12 cation column | |||||||
| grt | 19 | 0.00007 | 0.000008 | 0.001 | 0.0001 | 0.00005 | 0.0007 |
|
|||||||
| Double-pass Ln Spec, plus X12 cation column 33 | |||||||
| wr | 15 | 0.000003 | 0.00000 | 0.0004 | 0.00002 | 0.000007 | 0.001 |
| grt | 24 | 0.00006 | 0.00001 | 0.006 | 0.0002 | 0.00003 | 0.008 |
| ap | 4 | 0.00005 | 0.00000 | 0.0001 | 0.0001 | 0.00001 | 0.0002 |
| lws | 10 | 0.00002 | 0.00001 | 0.0002 | 0.00003 | 0.00001 | 0.0005 |
Isobaric interferences are typically corrected assuming natural isotope compositions (e.g., 176Lu/175Lu = 0.02656, 176Yb/173Yb = 0.7930).8,14 The subtraction of Yb can be done accurately,12,15 whereas the amount of 176Lu in the Hf fraction is often underestimated because the assumption of a natural Lu IC is not valid for samples spiked with a 176Lu-180Hf tracer. Simply using the 176Lu/175Lu of the spiked sample (measured during Lu ID analysis) for the interference correction16 may, on the other hand, overcorrect 176Hf/177Hf to low values. This is shown in Fig. 1 for an isochron data point for which an extremely high Lu interference monitor (175Lu/176Σ = 0.0042, where 176Σ = 176Yb + 176Lu + 176Hf, i.e., the total signal measured at mass 176) was observed during the Hf isotope ratio measurement. The required interference correction was applied assuming either natural Lu (point above reference line) or the 176Lu/175Lu measured for the Lu ID analysis (point below reference line). The sample, a 60 mg angrite plagioclase separate (29 ppb Hf and 6 ppb Lu), was inadvertently over-spiked for both Lu (176Lu/175Lu = 1.18) and Hf (180Hf/177Hf = 16.5). In this extreme case, the ∼50 ε-unit difference between the two end member corrections reveals a large uncertainty on the data point, which was consequently excluded from isochron calculations.
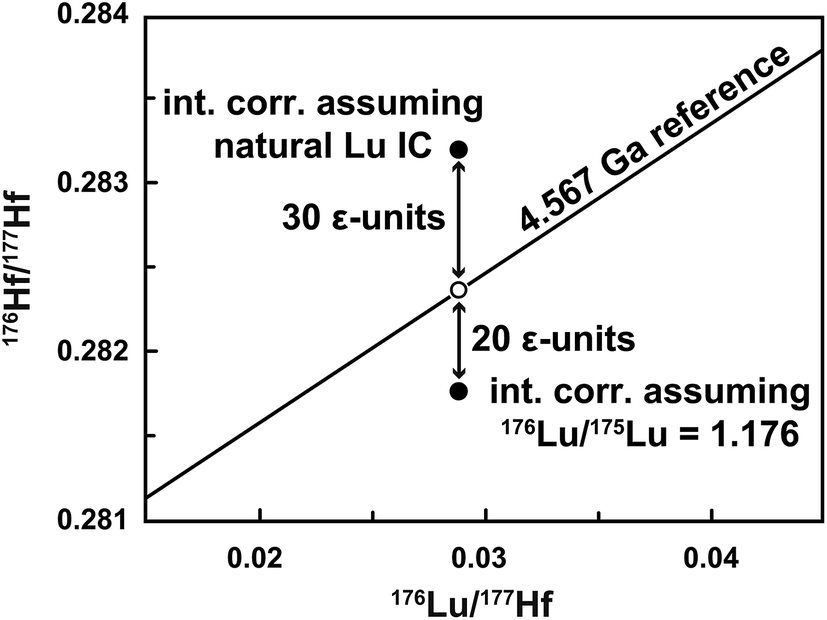 | ||
| Fig. 1 Uncertainty related to the Lu interference correction on the 176Hf/177Hf of a spiked sample. In this example, the Hf isotope analysis of the plagioclase fraction from an angrite meteorite was affected by an extremely high Lu interference monitor (175Lu/176Σ = 0.0042). Using natural Lu (176Lu/175Lu = 0.02656) for the interference correction8 results in a spuriously high 176Hf/177Hf value (undercorrection). Alternatively, assuming that the Lu has the same composition as that of the spiked sample (176Lu/175Lu = 1.176) results in an overcorrection and low 176Hf/177Hf. The solar system reference isochron is based on the chondritic uniform reservoir (CHUR) parameters of Bouvier et al.17 and the age of the solar system.18 The open circle indicates the expected position of the plagioclase data point. | ||
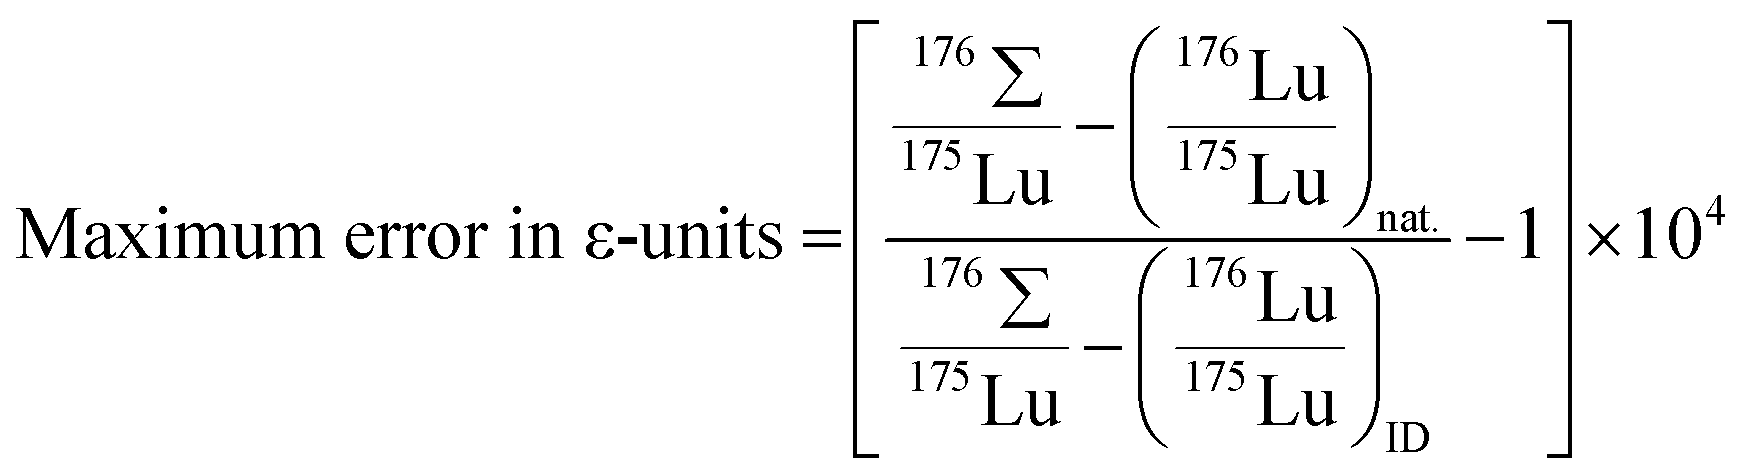
The effects of elevated Lu interference monitors are illustrated in Fig. 2. The error on 176Hf/177Hf arising from using a natural 176Lu/175Lu for the interference correction increases with elevated 175Lu/176Σ especially for over-spiked samples, and can be calculated using the equation
 | ||
| Fig. 2 Potential errors on 176Hf/177Hf stemming from elevated Lu interference monitors during Hf isotope analysis of spiked samples. Online interference corrections typically assume natural Lu composition (176Lu/175Lu = 0.02656),8 and will thus not correct for the contribution of 176Lu from the spike. The values for the sloping lines represent different 176Lu/175Lu of spiked samples; the green area shows the range of ideal spiking. These values are high enough to prevent unnecessary error magnification in Lu concentration, but low enough to avoid significant positive errors in 176Hf/177Hf at typical Lu-monitor values (i.e., 175Lu/176Σ < 0.0001). | ||
Ideally, any Lu contamination of the Hf fraction should be avoided and the 175Lu/176Σ interference monitor should then be below 0.0001. To demonstrate high data quality, it would be useful to report the observed interference monitors with 176Hf/177Hf values that are used for isochrons. The 175Lu/176Σ monitor is preferred over e.g., 175Lu/177Hf, because the former is proportional to the applied interference correction in ε-units regardless of how radiogenic the samples are (e.g., 176Hf/177Hfgarnet = 0.284 vs.176Hf/177Hfgadolinite = 260) and therefore allows direct comparison of interference effects on 176Hf/177Hf between non-radiogenic and extremely radiogenic samples.
A separation procedure that employs an initial cation column (e.g., Patchett and Tatsumoto,1 Wimpenny et al.,3 Vervoort et al.,14 Bizimis et al.19) is advantageous because the high field strength elements (HFSE) including Hf are not adsorbed onto the AG 50W-X8 cation resin whereas the REE are. Hence, the REE are eluted after Hf, which prevents tailing into the Hf fraction. However, care must be taken not to overload the column or breakthrough of the HREE might occur. The procedure outlined below adopts a miniaturized version of Patchett and Tatsumoto's1 cation column. The isolation of Hf from the HFSE cut is performed on an Ln-Spec column devoted to this purpose, which never gets loaded with REE-bearing bulk samples, thereby eliminating potential Lu (+Yb) contamination.
(2) Optimization of the Ti elution
Blichert-Toft et al.,8 Münker et al.2 and Weyer et al.11 have shown that the accuracy of the 176Hf/177Hf measurement by MC-ICP-MS is compromised by insufficient Ti removal. In the separation procedure of Münker et al.,2 Ti is eluted as a peroxide complex with up to 50 ml of 0.45 M HNO3—0.09 M citric acid—1 wt% H2O2. In other methods1,3,7 Ti is complexed with H2O2before loading the sample onto the column, which generally results in a more efficient elution of Ti and frees up resin capacity for the following separation of Zr from Hf. This is not feasible when loading in HCl,2 however, because HCl–H2O2 mixtures tend to form flow-blocking bubbles within the Ln-Spec resin. This problem is avoided by loading in HNO3–H2O2 as done by Wimpenny et al.3 in their procedure for isolating Lu and Hf from Fe-free matrices.(3) Improving the separation between Hf and Zr
For TIMS measurements of Hf isotope ratios, it was crucial to decrease the Zr/Hf to levels below ∼2 so that Hf would ionize efficiently.1,6,10 During MC-ICP-MS analysis, even a high Zr/Hf value (natural ≈ 35) does not significantly inhibit the ionization of Hf.8 Many analytical protocols therefore do not even attempt to separate these elements.8,20–24 Indeed, zircon analyses by laser ablation (LA)-MC-ICP-MS will always be subject to natural Zr/Hf, but in that case, zircon grains are also used as isotopic standards and their mass bias behavior is likely similar to that of the unknowns. The standards are thus matrix-matched to the samples. This is not always the case for solution-based MC-ICP-MS, where a Zr-free Hf solution (e.g., JMC-475) is used as a standard. Peters et al.12 reported that at a Zr/Hf above 10 there is an observable bias on 176Hf/177Hf when using X skimmer- and Jet sample cones on a Thermo Scientific Neptune MC-ICP-MS. We have also periodically observed up to 3 ε-unit positive shifts in 176Hf/177Hf in a specific Hf cut that had a Zr/Hf of ∼7.2. At the same time, the 175Lu/176Σ monitor was elevated independent of the actual amount of Lu in the Hf fraction. Other samples having lower Zr/Hf showed no such shifts during the same analysis sessions. However, re-measurement of the high-Zr/Hf sample solution during later analysis sessions showed no shifts, and tests using an AMES Hf standard doped with AMES Zr also showed no shifts: The 176Hf/177Hf of 20 ppb AMES Hf solutions reproduced within 30 ppm for Zr/Hf up to 10, and no significant correlation between 176Hf/177Hf and Zr/Hf was observed. It seems that observed shifts for the high-Zr/Hf solutions are intermittent and related to the specific conditions affecting some analysis sessions where X- and Jet cones are used. It is also unclear whether Zr is the cause of these shifts. To eliminate the possibility of biases arising from high Zr/Hf, the separation of those two elements can be optimized by carefully adjusting the HF molarity of the HNO3–HF mixture used to elute Zr. In addition, a high-Zr/Hf standard can be measured at the start of an analysis session to ensure that Hf isotope ratio measurements are insensitive to Zr.(4) Avoiding ascorbic acid in eluted fractions to be used for Rb, Sr, Sm, and Nd analyses
In the procedure of Münker et al.,2 the sample is loaded onto Ln-Spec resin in 3 M HCl—0.1 M ascorbic acid. The latter is used to avoid Fe in the Lu and Hf fractions by reducing Fe3+ to Fe2+, which is not adsorbed strongly by the Ln-Spec resin and is eluted with the bulk matrix. This matrix fraction, which also contains Rb, Sr, Sm, and Nd is eluted in the first 20 ml of 3 M HCl2 (including the loading volume and its ascorbic acid). However, drying down ascorbic acid-bearing solutions on a hot plate results in tarry residues that are difficult to re-dissolve for loading onto the next stage of chemistry. This difficulty is avoided by employing the first-stage cation column mentioned above in which the HFSE are eluted before Fe, and the HREE are eluted afterwards.
(5) Minimizing procedural blanks
When scaling down the amount of sample analyzed, the procedural blanks need to be reduced simultaneously to keep blank contributions negligible or correctable. This is especially important for Lu–Hf geochronological studies on small amounts of handpicked, low-Hf minerals. Miniaturizing the cation column and making the Ti elution more efficient can reduce the amount of reagents used significantly over previous methods.Ion-exchange chromatography
The 2-stage ion-exchange chromatography for Lu–Hf geochronology that is presented in detail below meets all the aforementioned requirements and works reliably for small samples but also up to 100 mg of digested whole-rock powder. The first-stage cation column allows the direct separation of Rb, Sr, and Sm + Nd fractions if needed. The HFSE (including Hf) and the HREE (including Lu) are completely separated from each other, eliminating potential interferences. The HREE cut can be used without further processing for Lu ID analysis, whereas the Hf fraction needs further purification. As a second stage, an Ln-Spec column adapted from Münker et al.2 and Wimpenny et al.3 is used to isolate Hf from Ti and Zr, typically resulting in Zr/Hf < 1 after a single pass through the column. Compared to the Lu–Hf separation method previously used in our laboratory,2 this optimized procedure yields cleaner Hf cuts while minimizing sample handling and the amount of acid consumed, and lowering the analytical blank to <10 pg.Materials and reagents
The ion-exchange chromatography is performed in a class 100 laminar flow hood in a class 10000 clean room environment. All columns are made from Kynar heat-shrink tubing (12.7–6.4 mm diameter; from Angst and Pfister) with the dimensions given in Fig. 3. Frits are cut from a 1.6 mm thick Thomapor® sintered plate made out of porous high-density polyethylene (HDPE, pore size 35 μm, from Reichelt Chemietechnik). All reagents except for H2O and H2O2 have been distilled once using a Savillex DST-1000 Acid Purification System and diluted with 18.2 MΩ cm H2O (Millipore Milli-Q®, hereafter “MQ”).
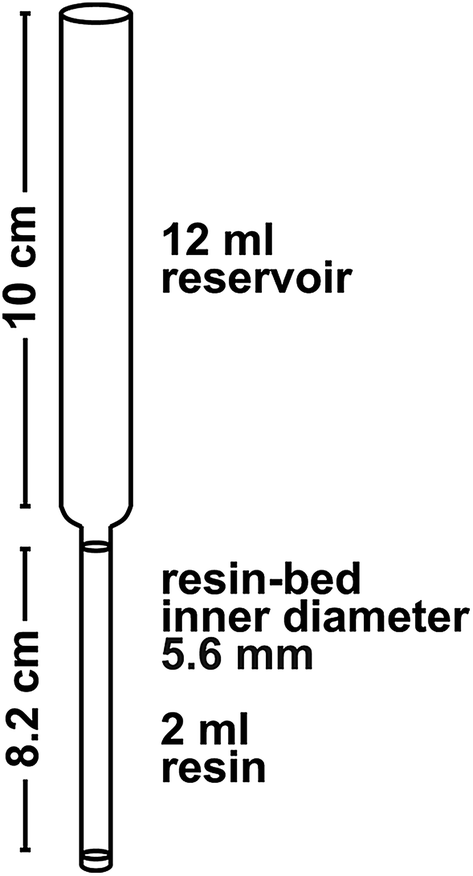 | ||
| Fig. 3 Column dimensions. | ||
Sample digestion
Up to 100 mg of whole-rock powder, or mineral grains (we tested garnet and apatite) are weighed into 15 ml Savillex Teflon® vials and covered with MQ H2O. Mixed spikes enriched in 176Lu–180Hf, 149Sm–150Nd, and 87Rb–84Sr are added before digesting the samples with concentrated HF–HNO3 (2:1) in capped vials on a hot plate at 120 °C. After 24–48 h, the vials are opened and the acids evaporated (such hot plate digestions are insufficient for the full digestion of zircon-bearing rocks. For such samples, other methods can be used, e.g., digestions in high-pressure autoclaves). Apatite is dissolved in 3 ml 6 M HCl—0.06 M HF instead of HF–HNO3. After decomposition, all samples are dried down with 1 ml of 15 M HNO3 three times to break down fluorides before being converted to chlorides by drying down with 1–5 ml of 10 M HCl.
Column I
The initial cation column is a miniaturized version of Patchett and Tatsumoto's column A1. It is filled with 2 ml of Bio-rad AG® 50W-X8 resin (200–400 mesh), which has an operating capacity of 2–3 meq. The resin is cleaned with 3–4 reservoir volumes (RV, ≈12 ml) of 6 M HCl and 1 RV of 2 M HF (Table 2). Between these two steps, the columns are backwashed with MQ H2O to prevent expulsion of the frit by resin expansion. For the cation-exchange chromatography, samples up to 50 mg are taken up in 170 μl 6 M HCl at 140 °C on a hot plate. Once the sample is completely dissolved, it is sequentially diluted with 780 μl H2O and then 50 μl 2 M HF to 1 M HCl—0.1 M HF, transferred to a test tube and centrifuged. (For larger sample sizes, the loading volume is scaled up accordingly, which may broaden the Rb and Sr peaks but does not influence the HFSE and REE elution.) Clear sample solutions are then pipetted onto the columns, leaving any undigested grains (e.g., refractory zircon and rutile inclusions from garnet) behind. The HFSE (including Hf) are eluted immediately and need to be collected already during loading. Following the elution scheme summarized in Table 2, the sample matrix rinses off first in 1.5 M HCl, followed by Rb and Sr. The Rb fraction can be analyzed using the method of e.g., Nebel et al.,25,26 whereas Sr generally requires further purification, for example using traditional cation exchange27 or a Sr-Spec column.28 Lutetium and other HREE are collected in 8 ml of 2.5 M HCl. After evaporating to dryness on a hot plate at 120 °C, this fraction is treated with 200 μl of 0.1 M HNO3—4% H2O2 and dried down at 80 °C to oxidize any organic residues from the resin and reagents. After redissolving in 0.1 M HNO3, the sample is ready for MC-ICP-MS analysis. The light rare earth elements (LREE) can also be eluted in 6 M HCl and dried down for further separation of Nd and Sm following the procedure of e.g., Richard et al.29 or Pin and Zalduegui.30| Step | Acid |
|---|---|
| a RV: reservoir volume (≈12 ml). | |
| Column I: 2 ml AG 50W-X8 (200-400 mesh) | |
| Preparation | 1 RV 6 M HCl |
| 2 × backwash with MQ H2O | |
| 1 RV 2 M HF | |
| 2 RV 6 M HCl | |
| 2 × backwash with MQ H2O | |
| Condition | 2 ml 1 M HCl—0.1 M HF |
| Load sample, collect HFSE (Hf) | 1–2 ml 1 M HCl—0.1 M HF |
| Collect HFSE (Hf) | 0.5 ml 1 M HCl—0.1 M HF |
| Collect HFSE (Hf) | 2 ml 1 M HCl—0.1 M HF |
| Elute matrix | 4 ml 1.5 M HCl |
| Collect Rb | 4 ml 1.5 M HCl |
| Rinse | 10 ml 1.5 M HCl |
| Collect Sr | 8 ml 1.5 M HCl |
| Rinse | 8 ml 1.5 M HCl |
| Collect HREE (Lu) | 8 ml 2.5 M HCl |
| Collect LREE (Sm, Nd) | 6 ml 6 M HCl |
|
|
| Column II: 2 ml Ln-Spec resin (100–150 μm) | |
| Preparation | 1 RV 6 M HCl |
| 1 RV 2 M HF | |
| 1 RV 6 M HCl | |
| 1 RV 2 M HF | |
| 2 ml MQ H2O | |
| Condition | 2 × 2 ml 3 M HNO3—1% H2O2 |
| Load HFSE cut from column I | 2 ml 3 M HNO3—1% H2O2 |
| Elute Ti | 4–6 × 2 ml 3 M HNO3—1% H2O2 |
| Wash off H2O2 | 2 ml 0.1 M HNO3 |
| Elute Zr | 6 × 4 ml 0.5 M HNO3—0.06 M HF |
| Collect Hf | 3 ml 0.56 M HNO3—0.3 M HF |
Column II
Columns dedicated to Hf purification are filled with 2 ml of Eichrom Ln-Spec resin (100–150 μm) and cleaned with 6 M HCl and 2 M HF steps (Table 2). The dried HFSE cuts from column I are treated with 200 μl of 0.56 M HNO3—0.3 M HF—4% H2O2 and dried gently at 80 °C to oxidize the organic contaminants derived from the resin and acids. If this step is omitted, the samples will not fully dissolve when taken up in 2 ml of 3 M HNO3—1% H2O2 for loading. To prevent breakdown of the H2O2, this loading mixture should not be heated. Instead, complete sample dissolution can be achieved by placing capped vials into an ultrasonic bath for 30 minutes. The clear yellow sample solutions are then loaded onto pre-conditioned Ln-Spec columns.3 Titanium is rinsed off with up to 12 ml 3 M HNO3—1% H2O2 (adding 2 ml at a time) until the eluate is colorless. The remaining H2O2 is washed off the columns using 0.1 M HNO3 before Zr is eluted with six 4 ml batches of 0.5 M HNO3—0.06 M HF. The HF molarity needs to be exact to achieve Zr/Hf < 1. The purified Hf cuts are then collected in 3 ml of 0.56 M HNO3—0.3 M HF, dried down and treated again with the oxidizing agent described above.Column calibration analysis
The effectiveness of the chemical separation was tested using a Thermo Scientific XSeries II quadrupole ICP-MS at the Institut für Planetologie at WWU Münster. The eluted fractions were doped with 10 ng In, which was used as an internal standard and scanned for a broad range of major and trace elements (Na, Mg, Al, Si, P, K, Ca, Ti, V, Cr, Mn, Fe, Co, Ni, Rb, Sr, Sc, Y, Zr, Nb, Mo, In, Ba, REE, Hf, Ta, and W). The samples were analyzed using a Peltier-cooled cyclonic quartz glass spray chamber and an ESI Microflow PFA nebulizer. Sample solutions were introduced using a peristaltic pump at an uptake rate of ∼670 μl min−1, yielding a sensitivity of ∼1300 kcps for a 10 ppb In solution. Signals were detected in standard resolution and acquired by peak-jumping using a single channel per peak with a dwell time of 10 ms for each individual mass. One analysis consisted of three main runs with 50 measurements (sweeps) per run. Solution standards with known element concentrations were measured under the same conditions and used to calculate the element concentrations in each eluted fraction.Isotope analysis
Hafnium
High precision Hf isotope analyses are performed on a Thermo Scientific Neptune Plus MC-ICP-MS at the Institut für Mineralogie at WWU Münster. The instrument is equipped with three 1012 Ω resistors, which allow a precise measurement of signals below 5 × 10⁻¹¹ A. The main isotopes of Hf (176Hf, 177Hf, 178Hf, 179Hf, and 180Hf) and one of each interfering element (173Yb, 175Lu, 181Ta, and 183W) are measured simultaneously using the Faraday cup configuration shown in Table 3. For high-concentration analyses (up to 40 ppb Hf), two of the sensitive resistors are used for the Yb and Lu interference monitors, whereas a 1010 Ω resistor is used for the spike isotope 180Hf (or 181Ta, whichever signal is generally higher). For low-concentration analyses (<10 ppb), however, the 1012 Ω resistors are used for measuring the 175Lu, 176Hf, and 177Hf signals.| Cup | L4 | L3 | L2 | L1 | C | H1 | H2 | H3 | H4 |
|---|---|---|---|---|---|---|---|---|---|
| High-concentration Hf analysis | |||||||||
| Isotope | 173Yb | 175Lu | 176Hf | 177Hf | 178Hf | 179Hf | 180Hf | 181Ta | 183W |
| Resistor (Ω) | 1012 | 1012 | 1011 | 1011 | 1011 | 1011 | 1010 | 1011 | 1011 |
|
|||||||||
| Low-concentration Hf analysis | |||||||||
| Isotope | 173Yb | 175Lu | 176Hf | 177Hf | 178Hf | 179Hf | 180Hf | 181Ta | 183W |
| Resistor (Ω) | 1011 | 1012 | 1012 | 1012 | 1011 | 1011 | 1011 | 1011 | 1011 |
|
|||||||||
| Lu ID analysis | |||||||||
| Isotope | 166Er | 167Er | 171Yb | 172Yb | 173Yb | 174Yb | 175Lu | 176Lu | 178Hf |
| Resistor (Ω) | 1011 | 1011 | 1011 | 1011 | 1011 | 1010 | 1011 | 1012 | 1012 |
An Aridus II™ Desolvating Nebulizer System equipped with a Cetac C-Flow PFA concentric nebulizer with a flow rate of ∼80 μl min−1 is used as the sample introduction system. This setup produces particularly stable signals. An X-skimmer and Jet sample cone are installed to enhance the sensitivity up to 2000 V ppm−1 for Hf, which corresponds to a signal of ≈0.35 V on 177Hf for 1 ppb Hf solutions. An autosampler is used to maintain consistent time intervals for the wash out (5 min in 1 M HNO3—0.6 M HF), on-peak zero measurements (4 min), and sample solution uptake (1 min before analysis). Baselines are measured at all masses without defocusing (“on-peak zeroes”, OPZ) while drawing trace element-free 0.56 M HNO3—0.3 M HF into the nebulizing system. Samples are dissolved in 0.5 ml of the same acid mixture and diluted to appropriate concentrations. The amounts of Hf and Zr (monitored on mass 90) in each sample are determined by manual peak-hopping on pre-dilutions (20 μl sample solution in 1 ml acid). The samples are then diluted to the same Hf concentrations as the respective standard. Each analysis comprises one block of 60 integrations of 4.2 s each. An exponential mass bias correction is applied using 179Hf/177Hf = 0.7325. Sample analyses are bracketed by analyses of the Münster AMES Hf solution (which is isotopically equivalent to JMC-475) and all values are normalized to a 176Hf/177Hf of 0.282160 for that standard.
Lutetium
The Lu concentrations were determined by isotope dilution (ID)-MC-ICP-MS on a Thermo Scientific Neptune Plus at the Institut für Mineralogie at WWU Münster. The utilized equipment and operating conditions are similar to those described above. Lutetium, which has only two naturally occurring isotopes (175Lu and 176Lu), is typically doped with a non-interfering element such as Er31 or Re2,32 for mass bias correction, or concomitantly eluted Yb may be used.8,15,33,34 In the HREE fraction obtained from column I, natural Yb and Er are quantitatively recovered. Ytterbium creates an isobaric interference on 176Lu that can be precisely corrected,12,15,34 whereas Er has several stable, non-interfering isotopes that can be used for mass bias correction (e.g., 167Er/166Er = 0.6841). Accordingly, all Lu- and Yb-standards used are doped with 5 ppb Er. Again, pre-dilutions are used to determine the HREE concentrations of the samples, which are then diluted to 1–2 ppb Lu for analysis. The cup configuration given in Table 3 is used for acquisition, collecting 30 cycles with an integration time of 4.2 s.Analytical uncertainties
Geochronological applications generally involve testing that the samples satisfy the isochron assumptions, namely that all samples had the same initial isotope composition, that they became closed systems simultaneously, and that they have remained closed systems. Samples meeting these criteria will define a linear trend on an isochron diagram whereby the observed scatter of points can be explained by the analytical uncertainties alone. Higher degrees of scatter—evidenced by MSWD values significantly greater than the expected value of 1—indicate that at least one of the isochron assumptions has been violated.35 Detecting such geologic scatter with MSWD values requires realistic assessments of the analytical uncertainties, which vary according to the amounts of daughter and parent elements available for measurement, as well as the degree of error magnification due to over- or under-spiking. For this reason, we recommend that the uncertainties on each isochron point be individually estimated rather than being assigned a “blanket” value.The external reproducibility of 176Hf/177Hf is estimated for each data point on the basis of its internal measurement statistics as described by Bizzarro et al.36 This method has previously been documented to yield realistic estimates for Hf isotope analyses.13 Multiple analyses of the AMES Hf solution standard measured at different concentrations are used to establish the relationship between internal measurement uncertainty (% 1 s.e. of the 60 integrations) and external reproducibility (% 2 s.d. of n ≥ 5 analyses; Fig. 4a). This trend is then used to transform the internal analytical uncertainty of samples that can only be measured once or twice into an estimated external uncertainty, i.e., 2 s.d. that would be expected if the sample were measured many times. In our laboratory, trend slopes are typically between 2.5 and 3.0. Repeated analyses of terrestrial reference rocks yield trends that agree with those of solution standards, indicating that the latter can be applied to rock samples that have been spiked and processed through chemistry (Fig. 4b). Any additional uncertainty on 176Hf/177Hf arising from the Lu interference corrections (equation above) is added quadratically to the 2 s.d. external reproducibility.
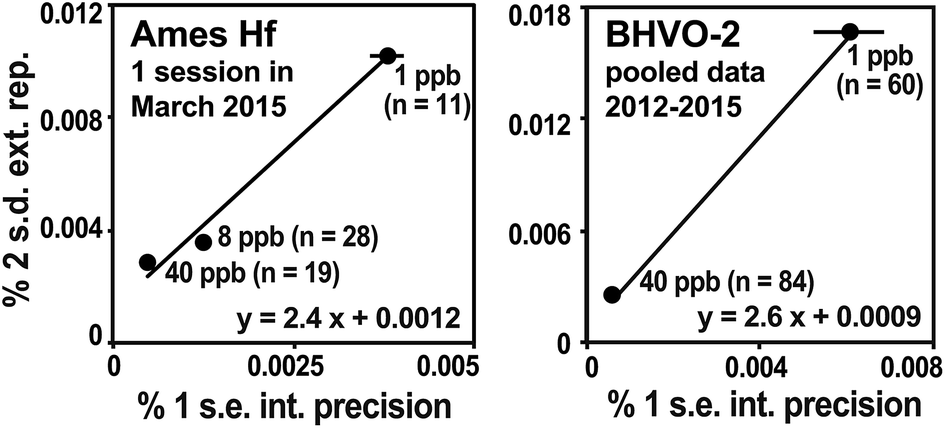 | ||
| Fig. 4 The external reproducibility of 176Hf/177Hf is estimated from the relationship between the average internal analysis statistics (% 1 s.e. of 60 cycles) and the external reproducibility of replicate analyses (% 2 s.d. of multiple analyses) of the Münster AMES Hf standard (left) analyzed at different concentrations, following the method of Bizzarro et al.36 The relationship holds e.g., for replicate analyses of BHVO-2 (right). The resulting trends are used to estimate the % 2 s.d. uncertainties for samples that can only be analyzed once. The slopes of the trends are typically in the range of 2.5 to 3.0. | ||
The analytical uncertainty of 176Lu/177Hf includes an error magnification that accounts for the effects of over- and underspiking.37 The error magnification factor F is calculated following the equation

Results and discussion
Efficiency of the chemical separation
Hafnium is eluted in 1 M HCl—0.1 M HF from the cation column together with Na, Mg, Al, Ti, Fe, Nb, Zr, Mo, Ta and W (Fig. 5). The REE are fully adsorbed to the cation resin in this acid, resulting in complete separation of Lu and Hf. Lutetium, Yb and Er are collected in 2.5 M HCl after eluting the major elements and Rb and Sr in 1.5 M HCl. For up to 100 mg of whole-rock, phosphate, or garnet, no breakthrough of HREE was observed before switching from 1.5 M to 2.5 M HCl, even if the columns were left overnight or another 2 ml of 1.5 M HCl were added before collecting Lu.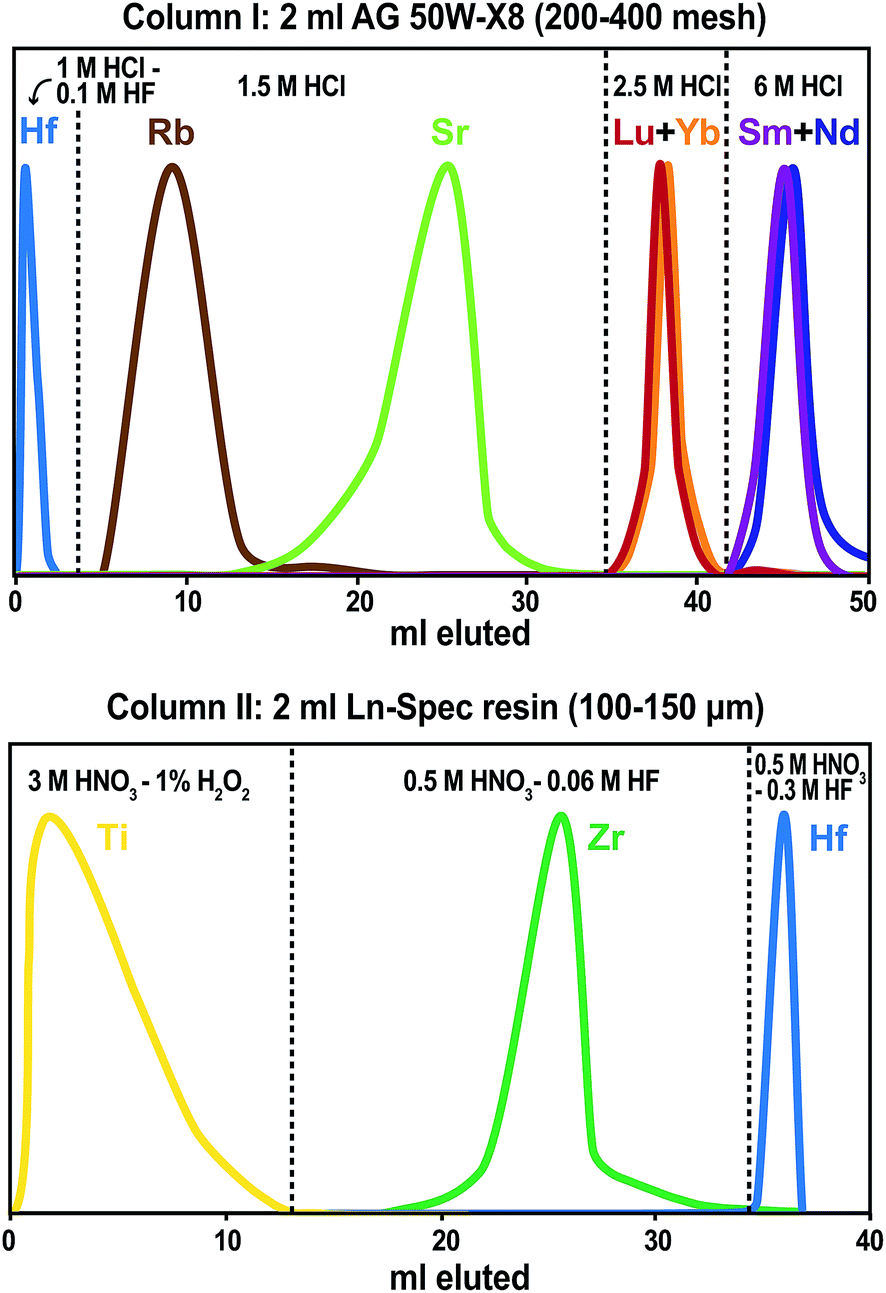 | ||
| Fig. 5 Elution curves for the described ion-exchange chromatography. The peak shapes have been normalized to the same maximum value. Top: column I (2 ml AG 50W-X8, 200–400 mesh), and bottom: column II (2 ml Ln-Spec resin, 100–150 μm). | ||
In addition to Lu–Hf, fractions for Rb–Sr and Sm–Nd geochronology can also be collected from the cation column. A fraction containing 90% of the sample Rb, together with various amounts of Mg, K, Mn, Fe, Co, and Ni, is collected in 4 ml of 1.5 M HCl (Table 2, Fig. 5). Although the additional elements do not have isotopes that isobarically interfere with 85Rb or 87Rb, they may affect mass bias behavior during MC-ICP-MS analysis. This is not the case for thermal ionization mass spectrometry (TIMS), but an additional cleanup of the Rb fraction25,26 is advisable for either measurement method. Only about 70–80% of the total Sr is collected to avoid large quantities of Ca, which is mostly eluted in between Rb and Sr. For high-Ta samples (such as BIR-1), we observed an elevated Ta/Sr of 0.3. For Sr isotope analyses by MC-ICP-MS or TIMS, the Sr fraction should be further purified.27,28 The LREE, including Sm and Nd, are eluted in 6 M HCl and can also be separated further for geochronological applications.29,30
Hafnium is purified on an Ln-Spec column that never gets loaded with REE-bearing samples, which is important for keeping the 175Lu/176Σ monitor below 0.0001. Titanium forms a yellow to orange complex in 3 M HNO3—1% H2O2, and is immediately eluted during loading.3 Up to 12 ml of this acid mixture are added in 2 ml steps until the eluate is colorless, indicating that Ti has been almost quantitatively eluted from the column. Using this simple criterion, a sufficient separation of Ti and Hf is achieved, resulting in Ti/Hf < 0.1. Zirconium is rinsed off effectively with six 4 ml batches of 0.5 M HNO3—0.06 M HF, whereas Hf remains on the column until the HF molarity is increased to 0.3 M. Separation techniques previously used at our laboratory2 yielded Zr/Hf in the range of 2 to 15, whereas the method reported here consistently yields values <1. For up to 100 mg basalt, the total Hf recovery is typically 98% or more. Deliberate overloading of the initial cation column with 200 mg of digested BHVO-2 powder still produces a clean Hf fraction (175Lu/176Σ monitor < 0.0001, Ti/Hf = 0.05, and Zr/Hf = 0.1) and a yield of 78%. Tests on 100–200 mg of garnet result in Hf yields of about 75%. For 100 mg garnet samples, the Hf is efficiently purified, whereas a 200 mg garnet sample resulted in an elevated Lu monitor (175Lu/176Σ) of 0.0017. This breakthrough of HREE indicates that the operating capacity of the cation resin is not sufficient for sample sizes above 3 meq. Such overloading of column I can be avoided by either dividing large sample loads among several first-stage columns or using a larger first-stage cation column.1 Alternatively, a 1 ml Ln-Spec column2 could also be used to separate the HFSE and HREE from the matrix before processing through cation column I. Special care should be taken to keep the Ln-Spec resin in column II REE-free. For phosphates, the Hf cuts are very clean with respect to other elements, but the Hf recovery is only in the range of 25 to 50 %, which is probably caused by Hf sequestration by precipitates that formed when the samples were dried down after the digestion. We therefore suggest dissolving phosphates in 6 M HCl and diluting this acid to molarities appropriate for direct loading onto the first column, i.e. 1 M HCl—0.1 M HF, without drying down in between.
Reference materials
The analytical procedure described in this study was tested on four different international reference rocks (BHVO-2, JB-1, BIR-1, and G-2). For comparison, each material was also processed once using the Münker et al.2 method. Most samples were fully spiked before digestion for simultaneous IC and ID analysis, with the exception of two BHVO-2 aliquots (“E” and “F”), which were analyzed unspiked. Solution aliquots equivalent to ca. 50 mg digested whole-rock powder were typically loaded onto the columns. The 200 mg BHVO-2 fractions “D”, “E” and “F” were split into aliquots after digestion and loaded onto four individual ion-exchange columns to test for possible variations in isotope composition induced by the chemical separation. No resolvable variations were observed.For all individually processed digestions of the investigated reference materials, the Hf isotope compositions, as well as the Lu and Hf concentrations, are summarized in Fig. 6 and Table S1† in the online repository. Literature values1,2,16,23,39–76 are given for comparison. For all materials investigated, the results for a total of 14 separate digestions of 50–200 mg powder aliquots are in good agreement with the recommended values, independent of the separation procedure used. The following 176Hf/177Hf values are given with their 2 s.d. uncertainties in the least significant digits in parentheses. The average 176Hf/177Hf for all of our 40 ppb BHVO-2 analyses (eight digestions divided into 1–4 solution aliquots each) is 0.283103 (8), which is indistinguishable from the recommended value of 176Hf/177Hf = 0.283105 (11).57 Two individual digestions of JB-1 processed through different separation techniques have an average 176Hf/177Hf of 0.282978 (8), whereas literature values range from 0.282951 (9)2 to 0.282997 (18).69 Three individual hot plate digestions of BIR-1 have 176Hf/177Hf values that vary from 0.283266 (15) to 0.283312 (3). Literature values range from 0.283244 (63)75 to 0.283293 (4),44 which overlaps with those of two of our digestions. The remaining digestion of BIR-1 yielded a slightly higher 176Hf/177Hf, which was reproduced in repeated analyses and is therefore most likely caused by sample heterogeneity (2 ε-unit variation for BIR-1). For G-2, two individual autoclave digestions were processed individually through different chemical separation methods, yielding an average 176Hf/177Hf of 0.282524 (8), which is indistinguishable from the recommended value of 176Hf/177Hf = 0.282522 (3).57
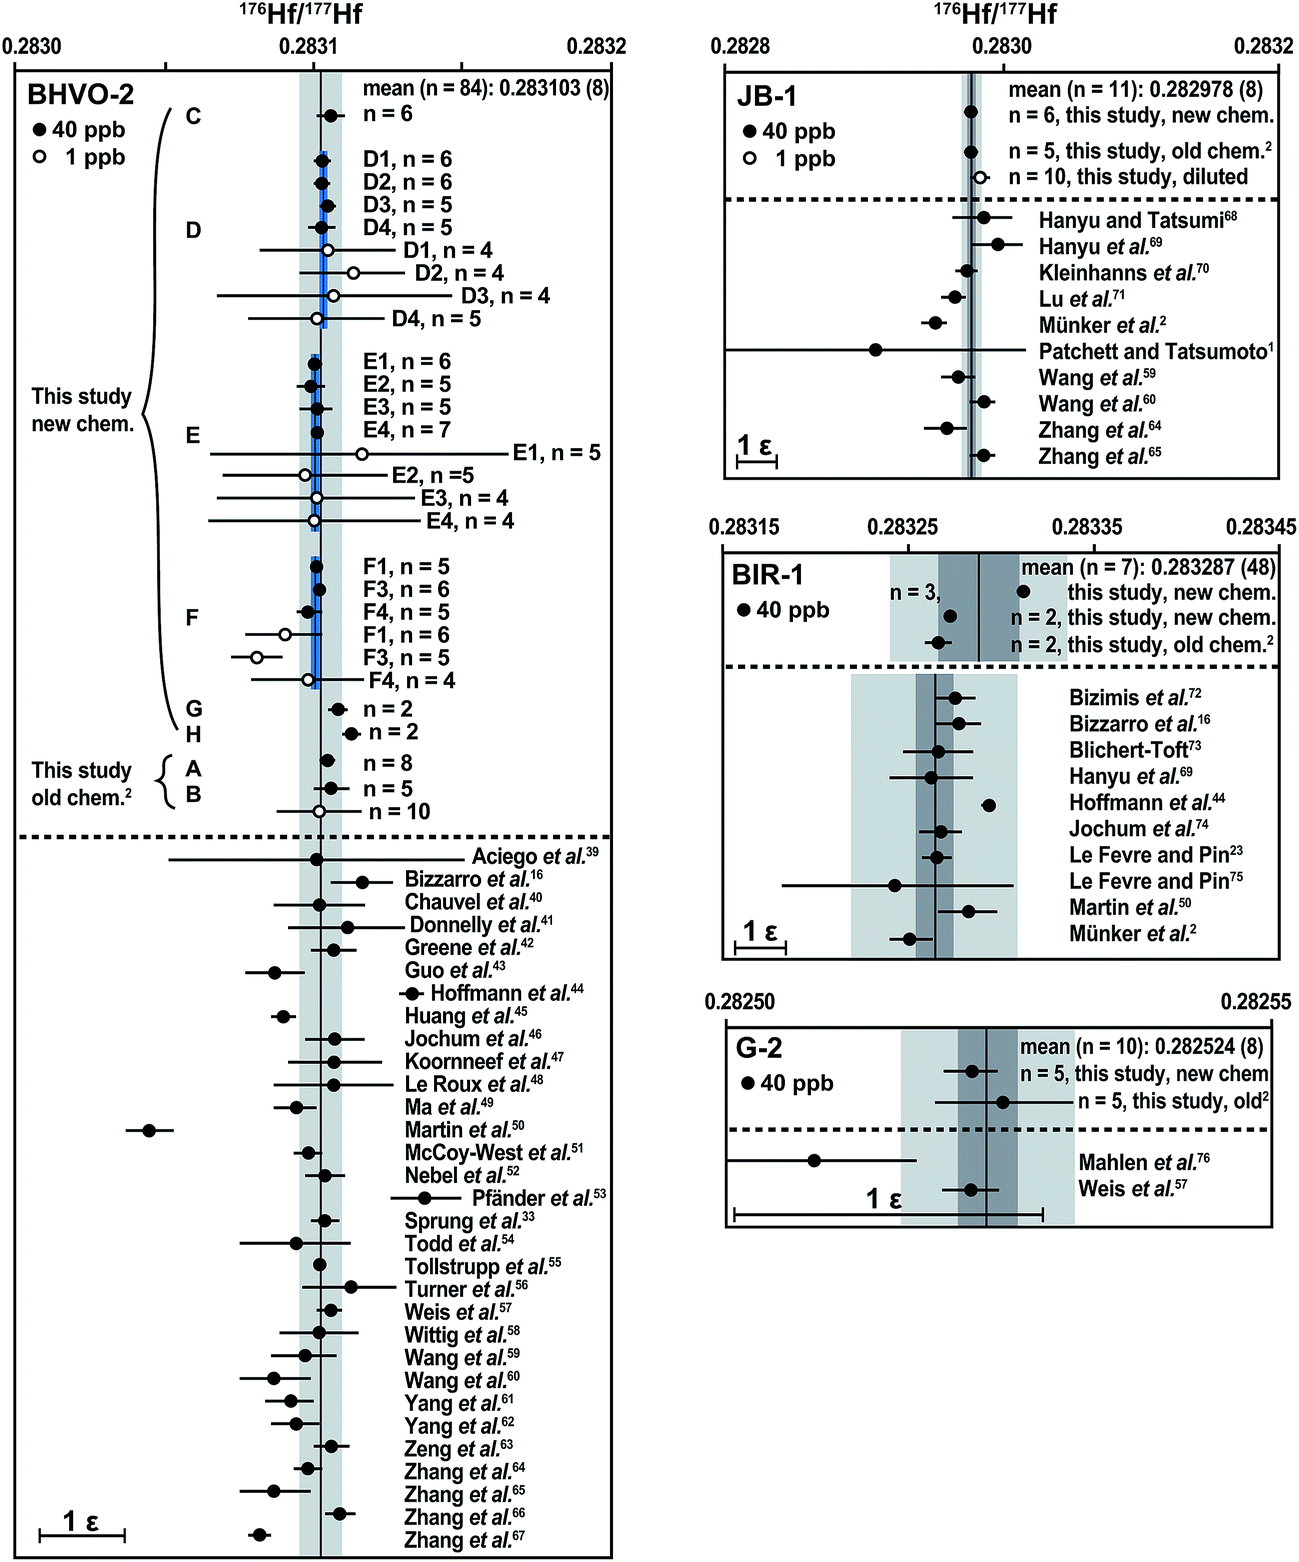 | ||
| Fig. 6 Average Hf isotope composition for each individual digestion of the international reference rocks BHVO-2, JB-1, G-2 and BIR-1. Vertical black lines through the data represent the grand mean of all of our 40 ppb analyses with 95% confidence limits (dark grey bars). The 2 s.d. external reproducibility is shown with light grey bars and given in parentheses as uncertainties in the least significant digits. For BHVO-2, four aliquots of digestions D, E, and F were processed through four individual columns and measured separately. The average of the 40 ppb analyses for each digestion (D–F) is shown (short black lines) along with 95% confidence limits (blue bars). The scale bar on the lower left side of each diagram measures 1 ε-unit. All data have been normalized to a 176Hf/177Hf of 0.282160 for the JMC-475 Hf standard. For literature data, the quoted uncertainties on mean values were converted to 95% confidence limits when the number of measurements and type of uncertainty (s.e. vs. s.d.) could be ascertained. For n = 1–3, we converted 2 s.e. internal analysis statistics to 2 s.d. external reproducibility by multiplying by 2 assuming reproducibility behavior observed by Bizzarro et al.36 | ||
To test the instrument performance on small sample sizes, the Münster Ames Hf standard solution and several BHVO-2 Hf solutions (“B”, “D”, “E”, and “F”) were diluted to a concentration of 1 ppb (0.5 ng Hf per 0.5 ml solution per analysis). Repeated analyses of the 1 ppb BHVO-2 solutions yielded an average 176Hf/177Hf of 0.283101 (41), i.e., a precision of 1.5 ε-units. All individual 1 ppb analyses are within uncertainty of the mean of 40 ppb analyses and therefore accurate. In upcoming tests, small sample aliquots (e.g., 1 mg WR powder) will be digested and processed individually. The BHVO-2 reference material appears to be well suited for testing the accuracy of Hf isotope compositions measured on such small sample sizes because this recently formed basalt has a homogeneous Hf isotope composition.
Conclusions
Lutetium–hafnium geochronological studies require an efficient chemical separation to avoid subtle errors in 176Hf/177Hf and resulting isochron scatter caused by inaccurate corrections for the 176Lu and 176Yb interferences on 176Hf. The ion-exchange method presented here lowers the HREE/Hf in the Hf fractions to insignificant levels, while also providing efficient removal of Ti and Zr, which may adversely affect the mass bias behavior of Hf during isotope analysis. The presented chromatography is thus especially well suited for Lu–Hf geochronology on high-Lu/Hf phases. Low procedural blanks are possible because of the reduced amount of acids required. These improvements over previous techniques, coupled with the use of sensitive 1012 Ω resistors during isotope ratio measurement by MC-ICP-MS, allow the use of Lu–Hf chronology for demanding applications where only ng quantities of Hf are available, e.g., dating of small amounts of phosphate minerals,34,77–81 single garnet grains, or even individual garnet growth-zones sampled by micro milling.82 Furthermore, the employment of a first-stage cation column simplifies the application of multiple radioisotope systems (Lu–Hf, Sm–Nd, and Rb–Sr) to the same sample aliquot.Acknowledgements
We gratefully acknowledge funding from the Deutsche Forschungsgemeinschaft (SCHE 1579/1). Heidi Baier, Alessandro Maltese, Sebastian Hackler, and Frank Deipenwisch provided valuable assistance in the clean laboratory and with mass spectrometry. We thank Harriet Brewerton for editorial handling of the manuscript and two anonymous reviewers for their helpful comments.References
- P. J. Patchett and M. Tatsumoto, Contrib. Mineral. Petrol., 1980, 75, 263–267 CrossRef.
- C. Münker, S. Weyer, E. E. Scherer and K. Mezger, Geochem., Geophys., Geosyst., 2001, 2 DOI:10.1029/2001gc000183.
- J. B. Wimpenny, Y. Amelin and Q.-Z. Yin, Anal. Chem., 2013, 85, 11258–11264 CrossRef CAS PubMed.
- D. Herwartz, T. J. Nagel, C. Münker, E. E. Scherer and N. Froitzheim, Nat. Geosci., 2011, 4, 178–183 CrossRef CAS PubMed.
- R. Bast, E. E. Scherer, K. Mezger, M. Fischer-Gödde and P. Sprung, Mineral. Mag., 2013, 77, 665 Search PubMed.
- V. J. M. Salters and S. R. Hart, Earth Planet. Sci. Lett., 1991, 104, 364–380 CrossRef CAS.
- K. M. Barovich, B. L. Beard, J. B. Cappel, C. M. Johnson, T. K. Kyser and B. E. Morgan, Chem. Geol., 1995, 121, 303–308 CrossRef CAS.
- J. Blichert-Toft, C. Chauvel and F. Albarède, Contrib. Mineral. Petrol., 1997, 127, 248–260 CrossRef CAS.
- E. E. Scherer, K. L. Cameron, C. M. Johnson, B. L. Beard, K. M. Barovich and K. D. Collerson, Chem. Geol., 1997, 142, 63–78 CrossRef CAS.
- V. J. M. Salters, Anal. Chem., 1994, 66, 4186–4189 CrossRef CAS.
- S. C. Weyer, C. Münker, M. Rehkämper and K. Mezger, Chem. Geol., 2002, 187, 295–313 CrossRef CAS.
- S. T. M. Peters, C. Münker, F. Wombacher and B.-M. Elfers, Chem. Geol., 2015, 413, 132–145 CrossRef CAS PubMed.
- P. Sprung, E. E. Scherer, D. Upadhyay, I. Leya and K. Mezger, Earth Planet. Sci. Lett., 2010, 295, 1–11 CrossRef CAS PubMed.
- J. D. Vervoort, P. J. Patchett, U. Söderlund and M. Baker, Geochem., Geophys., Geosyst., 2004, 5 DOI:10.1029/2004gc000721.
- J. Blichert-Toft, M. Boyet, P. Télouk and F. Albarède, Earth Planet. Sci. Lett., 2002, 204, 167–181 CrossRef CAS.
- M. Bizzarro, J. A. Baker and D. Ulfbeck, Geostand. Newsl., 2003, 27, 133–145 CrossRef CAS PubMed.
- A. Bouvier, J. D. Verwoort and P. J. Patchett, Earth Planet. Sci. Lett., 2008, 273, 48–57 CrossRef CAS PubMed.
- J. N. Connelly, M. Bizzarro, A. N. Krot, A. Nordlund, D. Wielandt and M. A. Ivanova, Science, 2012, 338, 651–655 CrossRef CAS PubMed.
- M. Bizimis, V. J. M. Salters and J. B. Dawson, Contrib. Mineral. Petrol., 2003, 145, 281–300 CrossRef CAS.
- N.-C. Chu, R. N. Taylor, V. Chavagnac, R. W. Nesbitt, R. M. Boella, J. A. Milton, C. R. German, G. Bayon and K. Burton, Anal. At. Spectrom., 2002, 17, 1567–1574 RSC.
- J. N. Connelly, D. G. Ulfbeck, K. Thrane, M. Bizzarro and T. Housh, Chem. Geol., 2006, 233, 126–136 CrossRef CAS PubMed.
- K. David, J. L. Birck, P. Telouk and C. J. Allègre, Chem. Geol., 1999, 157, 1–12 CrossRef CAS.
- B. le Fèvre and C. Pin, Anal. Chem., 2001, 73, 2453–2460 CrossRef.
- Y. H. Yang, H. F. Zhang, Z. Y. Chu, L. W. Xie and F. Y. Wu, Int. J. Mass Spectrom., 2010, 290, 120–126 CrossRef CAS PubMed.
- O. Nebel, K. Mezger, E. E. Scherer and C. Münker, Int. J. Mass Spectrom., 2005, 246, 10–18 CrossRef CAS PubMed.
- O. Nebel, E. E. Scherer and K. Mezger, Earth Planet. Sci. Lett., 2011, 301, 1–8 CrossRef CAS PubMed.
- S. R. Hart and C. Brooks, Geochim. Cosmochim. Acta, 1974, 38, 1799–1806 CrossRef CAS.
- E. P. Horwitz, R. Chiarizia and M. L. Dietz, Solvent Extr. Ion Exch., 1992, 10, 313–336 CrossRef CAS PubMed.
- P. Richard, N. Shimizu and C. J. Allégre, Earth Planet. Sci. Lett., 1976, 31, 269–278 CrossRef CAS.
- C. Pin and J. F. S. Zalduegui, Anal. Chim. Acta, 1997, 339, 79–89 CrossRef CAS.
- T. J. Lapen, N. J. Mahlen, C. M. Johnson and B. L. Beard, Geochem., Geophys., Geosyst., 2004, 5 DOI:10.1029/2003gc000582.
- E. E. Scherer, C. Münker and K. Mezger, Science, 2001, 293, 683–687 CrossRef CAS PubMed.
- P. Sprung, T. Kleine and E. E. Scherer, Earth Planet. Sci. Lett., 2013, 380, 77–87 CrossRef CAS PubMed.
- G. H. Barfod, O. Otera and F. Albarède, Chem. Geol., 2003, 200, 241–253 CrossRef CAS.
- I. Wendt and C. Carl, Chem. Geol., 1991, 86, 275–285 Search PubMed.
- M. Bizzarro, J. A. Baker, H. Haack, D. Ulfbeck and M. Rosing, Nature, 2003, 421, 931–933 CrossRef CAS PubMed.
- A. Stracke, E. E. Scherer and B. C. Reynolds, Treatise on Geochemistry, 2nd edn, 2014, pp. 71–86 Search PubMed.
- R. K. Webster, in Methods in geochemistry, ed. A. A. Smales and L. R. Wager, Interscience Publishers, New York, 1960, pp. 202–246 Search PubMed.
- S. M. Aciego, B. Bourdon, M. Lupker and J. Rickli, Chem. Geol., 2009, 266, 194–204 CrossRef PubMed.
- C. Chauvel, S. Bureau and C. Poggi, Geostand. Geoanal. Res., 2011, 35, 125–143 CrossRef CAS PubMed.
- C. L. Donnelly, W. L. Griffin, S. Y. O'Reilly, N. J. Pearson and S. R. Shee, Contrib. Mineral. Petrol., 2011, 161, 351–371 CrossRef CAS.
- A. R. Greene, J. S. Scoates and D. Weis, Geochem., Geophys., Geosyst., 2008, 9 DOI:10.1029/2008gc002092.
- J. Guo, F. Guo, C. Y. Wang and C. Li, Lithos, 2013, 170–171, 1–16 CrossRef CAS PubMed.
- J. E. Hoffmann, C. Münker, A. Polat, M. T. Rosing and T. Schulz, Geochim. Cosmochim. Acta, 2011, 75, 6610–6628 CrossRef CAS PubMed.
- X.-L. Huang, Y. Niu, Y.-G. Xu, J.-L. Ma, H.-N. Qiu and J.-W. Zhong, Contrib. Mineral. Petrol., 2013, 165, 437–455 CrossRef CAS.
- K. P. Jochum, S. A. Wilson, W. Abouchami, M. Amini, J. Chmeleff, A. Eisenhauer, E. Hegner, L. M. Iaccheri, B. Kieffer, J. Krause, W. F. McDonough, R. Mertz-Kraus, I. Raczek, R. L. Rudnick, D. Scholz, G. Steinhoefel, B. Stoll, A. Stracke, S. Tonarini, D. Weis, U. Weis and J. D. Woodhead, Geostand. Geoanal. Res., 2011, 35, 193–226 CrossRef CAS PubMed.
- J. M. Koornneef, A. Stracke, B. Bourdon, M. A. Meier, K. P. Jochum, B. Stoll and K. Grönvold, J. Petrol., 2012, 53, 127–157 CrossRef PubMed.
- V. le Roux, J.-L. Bodinier, O. Alard, S. Y. O'Reilly and W. L. Griffin, Earth Planet. Sci. Lett., 2009, 279, 76–85 CrossRef CAS PubMed.
- J. Ma, G. Wei, Y. Xu and W. Long, Chem. Geol., 2010, 269, 376–385 CrossRef CAS PubMed.
- C. Martin, S. Duchêne, B. Luais, P. Goncalves, E. Deloule and C. Fournier, Contrib. Mineral. Petrol., 2010, 159, 437–458 CrossRef CAS.
- A. J. McCoy-West, J. A. Baker, K. Faure and R. Wysoczanski, J. Petrol., 2010, 51, 2003–2045 CrossRef CAS PubMed.
- O. Nebel, M. L. A. Morel and P. Z. Vroon, Geostand. Geoanal. Res., 2009, 33, 487–499 CrossRef CAS PubMed.
- J. A. Pfänder, C. Münker, A. Stracke and K. Mezger, Earth Planet. Sci. Lett., 2007, 254, 158–172 CrossRef PubMed.
- E. Todd, J. B. Gill, R. J. Wysoczanski, J. Hergt, I. C. Wright, M. I. Leybourne and N. Mortimer, Geochem., Geophys., Geosyst., 2011, 12 DOI:10.1029/2011gc003683.
- D. Tollstrup, J. Gill, A. Kent, D. Prinkey, R. Williams, Y. Tamura and O. Ishizuka, Geochem., Geophys., Geosyst., 2010, 11 DOI:10.1029/2009gc002847.
- S. Turner, M. Handler, I. Bindeman and K. Suzuki, Chem. Geol., 2009, 266, 187–193 CrossRef PubMed.
- D. Weis, B. Kieffer, D. Hanano, I. Nobre Silva, J. Barling, W. Pretorius, C. Maerschalk and N. Mattielli, Geochem., Geophys., Geosyst., 2007, 8 DOI:10.1029/2006gc001473.
- N. Wittig, J. A. Baker and H. Downes, Geochim. Cosmochim. Acta, 2007, 71, 1290–1311 CrossRef CAS PubMed.
- X.-C. Wang, Z.-X. Li, X.-H. Li, Q.-L. Li and Q.-R. Zhang, Lithos, 2011, 127, 427–440 CrossRef CAS PubMed.
- Y. Wang, Z.-F. Zhao, Y.-F. Zheng and J.-J. Zhang, Lithos, 2011, 125, 940–955 CrossRef CAS PubMed.
- Y.-H. Yang, F.-Y. Wu, S. A. Wilde, X.-M. Liu, Y.-B. Zhang, L.-W. Xie and J.-H. Yang, Chem. Geol., 2009, 264, 24–42 CrossRef CAS PubMed.
- Y. H. Yang, F.-Y. Wu, S. A. Wilde and L.-W. Xie, Int. J. Mass Spectrom., 2011, 1, 47–52 CrossRef PubMed.
- G. Zeng, L.-H. Chen, S.-L. Hu, X.-S. Xu and L.-F. Yang, Geochem., Geophys., Geosyst., 2013, 14 DOI:10.1002/ggge.20127.
- L.-C. Zhang, X.-H. Zhou, J.-F. Ying, F. Wang, F. Guo, B. Wan and Z.-G. C. Zhang, Chem. Geol., 2008, 256, 12–23 CrossRef CAS PubMed.
- J.-J. Zhang, Y.-F. Zheng and Z.-F. Zhao, Lithos, 2009, 110, 305–326 CrossRef CAS PubMed.
- Y.-L. Zhang, C.-Z. Liu, W.-C. Ge, F.-Y. Wu and Z.-Y. Chu, Lithos, 2011, 126, 233–247 CrossRef CAS PubMed.
- G.-L. Zhang, L.-H. Chen and S.-Z. Li, Earth Planet. Sci. Lett., 2013, 383, 153–163 CrossRef CAS PubMed.
- T. Hanyu and Y. Tatsumi, Geophys. Res. Lett., 2002, 29 DOI:10.1029/2002gl015856.
- T. Hanyu, S. Nakai and R. Tatsuta, Geochem. J., 2005, 39, 83–90 CrossRef CAS.
- I. C. Kleinhanns, K. Kreissig, B. S. Kamber, T. Meisel, T. F. Nägler and J. D. Kramers, Anal. Chem., 2002, 74, 67–73 CrossRef CAS.
- Y. Lu, A. Makishima and E. Nakamura, J. Anal. At. Spectrom., 2007, 22, 69–76 RSC.
- M. Bizimis, G. Sen, V. J. M. Salters and S. Keshav, Geochim. Cosmochim. Acta, 2005, 69, 2629–2646 CrossRef CAS PubMed.
- J. Blichert-Toft, Geostand. Newsl., 2001, 25, 41–56 CrossRef CAS PubMed.
- K. P. Jochum, B. Stoll, K. Herwig, M. Willbold, A. W. Hofmann, M. Amini, S. Aarburg, W. Abouchami, E. Hellebrand, B. Mocek, I. Raczek, A. Stracke, O. Alard, C. Bouman, S. Becker, M. Dücking, H. Brätz, R. Klemd, D. de Bruin, D. Canil, D. Cornell, C.-J. de Hoog, C. Dalpé, L. Danyushevsky, A. Eisenhauer, Y. Gao, J. E. Snow, N. Groschopf, D. Günther, C. Latkoczy, M. Guillong, E. H. Hauri, H. E. Höfer, Y. Lahaye, K. Horz, D. E. Jacob, S. A. Kasemann, A. J. R. Kent, T. Ludwig, T. Zack, P. R. D. Mason, A. Meixner, M. Rosner, K. Misawa, B. P. Nash, J. Pfänder, W. R. Premo, W. D. Sun, M. Tiepolo, R. Vannucci, T. Vennemann, D. Wayne and J. D. Woodhead, Geochem., Geophys., Geosyst., 2006, 7 DOI:10.1029/2005gc001060.
- B. le Fèvre and C. Pin, Anal. Chim. Acta, 2005, 543, 209–221 CrossRef PubMed.
- N. J. Mahlen, B. L. Beard, C. M. Johnson and T. J. Lapen, Geochem., Geophys., Geosyst., 2008, 9 DOI:10.1029/2007gc001605.
- E. Scherer, C. Münker and K. Mezger, Science, 2001, 293, 683–687 CrossRef CAS PubMed.
- U. Söderlund, P. J. Patchett, J. D. Vervoort and C. E. Isachsen, Earth Planet. Sci. Lett., 2004, 219, 311–324 CrossRef.
- Y. Amelin, Science, 2005, 310, 839–841 CrossRef CAS PubMed.
- G. H. Barfod, E. J. Krogstad, R. Frei and F. Albarède, Geochim. Cosmochim. Acta, 2005, 69, 1847–1859 CrossRef CAS PubMed.
- D. Larsson and U. Söderlund, Chem. Geol., 2005, 224, 201–211 CrossRef CAS PubMed.
- A. D. Pollington and E. F. Baxter, Chem. Geol., 2011, 281, 270–282 CrossRef CAS PubMed.
Footnote |
| † Electronic supplementary information (ESI) available. See DOI: 10.1039/c5ja00283d |
| This journal is © The Royal Society of Chemistry 2015 |