
 Open Access Article
 This Open Access Article is licensed under a Creative Commons Attribution-Non Commercial 3.0 Unported Licence
Investigation of the electrical properties of standard and low-gas-flow ICPs using novel probes for the direct measurements of RF voltage and current in the load coil and the corresponding calculation of the ICP power†
M.
Voronov
*a,
V.
Hoffmann
a,
D.
Birus
b,
C.
Engelhard
 c and
W.
Buscher
d
c and
W.
Buscher
d
aIFW Dresden, Institute for Complex Materials, P.O. Box 270116, D-01171 Dresden, Germany. E-mail: VoronovMV@mail.ru
bIngenieurbüro Dr. Dietrich Birus, Steinsetzerweg 2, D-04442 Zwenkau, Germany
cUniversity of Siegen, Department of Chemistry & Biology, Adolf-Reichwein-Str. 2, D-57076 Siegen, Germany
dUniversity of Münster, Institute of Inorganic and Analytical Chemistry, Corrensstrasse 30, D-48149 Münster, Germany
First published on 14th July 2015
Abstract
New probes for the direct measurement of high radio-frequency (RF) voltage and current in the load coil of an inductively coupled plasma (ICP) are presented. Based on these measurements, a method for the calculation of power in the ICP is developed. Electrical parameters of the ICP are measured for a wide range of operational conditions in a standard ICP torch with wet aerosol introduction. Further, changes of the electrical parameters are monitored when operating the ICP with a very low argon flow rate of only 0.6 L min−1 using a so-called “Static High-Sensitivity ICP” (SHIP) torch. Direct measurements with the new RF probes allow following the evolution of plasma properties as a function of time. Noteworthy, it is found that there is a strong correlation between the plasma power and temperature changes in the RF generator itself. Depending on the plasma parameters, the measured plasma power was shown to differ significantly from the applied power (in the vendor software settings).
1 Introduction
The inductively coupled plasma (ICP) is a well-established source for optical emission spectrometry (OES) or mass spectrometry (MS) analysis for several decades.1 Both the plasma source and radio-frequency (RF) generator are very important parts of the ICP apparatus. The stability of operation of these components defines the stability of analytical signals and hence the accuracy and reproducibility of the measurements. Typically, an error of less than 1% of the forwarded RF power is considered to be required for quantitative analysis.2 However, the electrical parameters of the RF generator and plasma are still considered difficult to measure and indirect methods are still used today. If a crystal-controlled or solid-state generator is employed, it requires a matching network to match the load impedance. In this case, the power consumed by the plasma can be estimated by the forward RF power, which can be measured. However, this measurement will also include power losses in the RF matching system, coil, and connecting cables, and, in turn, complicates the estimation of the power consumed by the ICP. In the case of a free-running RF generator, the measurement of power is even more complicated because of difficulties of the measurement of high voltage and current at high frequencies.The measurement of the plasma impedance is possible and was reported in the past to help in the construction of RF matching networks.3 However, determining the plasma impedance alone does not help to understand all plasma properties. Inductive probes were successfully used by Chan et al. as plasma diagnostic tools in the study of matrix effects and single aerosol droplets in the ICP, respectively.4,5 Wiltsche et al. reported the use of inductive probes for an accurate measurement of the RF frequency of a free-running generator.6 To the best knowledge of the authors, a design for the accurate and direct measurement of voltage and current in a load coil of analytical ICPs is not described in the literature until today. Commercially available voltage and current probes do exist but have limitations in either the accessible voltage range or RF frequency. This limits their applicability to analytical ICPs. Existing measurement techniques do not allow direct and transient measurements of the RF voltage and current in the load coil while the plasma is in operation. Such data, however, would be of great interest in several areas including plasma diagnostics, coupling of the ICP to a mass analyzer, and for theoretical calculations. For example, in published theoretical models of the ICP, the coil current is often empirically varied until a desired plasma power is achieved.7–9
The aim of this work is the systematic investigation of the electrical properties of an inductively coupled plasma (ICP) by the direct measurement of the RF voltage (U) and RF current (I) in the load coil. Additionally, these measurements allow the calculation of the ICP's power P from the U and I values and are performed under different plasma conditions. Parameters U and I are obtained from novel probes for the direct measurement of high RF voltage and current. Because such direct electrical measurements have not been developed before, special attention was paid to the characterization of the used probes and substantiation of the power calculation technique. Two different ICP torches were used: a standard ICP torch with wet aerosol introduction and a low-argon-flow torch, termed Static High Sensitivity ICP (SHIP),10 operating at only 0.6 L min−1. Special attention is paid to the comparison of the measured power and indicated power supplied by the software manufacturer . Also, the measured electrical parameters of the ICP are very valuable as input parameters for numerical ICP simulations and can be used for comparison with the simulation results.
2 Experimental setup
A commercial ICP-OES instrument (model CIROSCCD, SPECTRO Analytical Instruments GmbH, Kleve, Germany) was used in this study. Radiation from the ICP torch is detected end-on (axial viewing) by a spectrometer through an optical plasma interface (OPI). A counter gas flow of argon towards the ICP torch is used to flush the optical path. This extends the spectral range of the instrument into the ultraviolet region. An ICP torch is positioned in a solid silver plasma load coil with a coil diameter of 5 mm and 2.5 turns for operation. Two fundamentally different ICP torch geometries were used in the study. One geometry is a standard ICP torch used with wet aerosol sample introduction (CIROS EOP quartz torch with 2.5 mm injector, 19 mm i.d.). Another one is a low-flow ICP setup, the so-called SHIP torch.10 In the coil area, it is bubble-shaped with a slightly larger maximum diameter than the standard torch (22 mm i.d.). The argon consumption is 0.6 L min−1. Detailed information about geometrical, analytical and physical characteristics of the SHIP torch can be found in ref. 11–13. The optimal conditions for the torches are presented in Table 1. The power mentioned in the table is the power indicated by the CIROS software. Below it is shown that the indicated power can differ from the real ICP power. The sample introduction system includes a cyclonic spray chamber (Tracey HF Resistant Spray Chamber, iCAP 6000 Radial, Thermo Fisher Scientific Inc.) and a pneumatic nebulizer. With the standard torch, a pneumatic nebulizer with a sample uptake rate of 2 mL min−1 (Meinhard TR-30-A3) was used. The SHIP torch requires a pneumatic micronebulizer with an uptake rate of 200 μL min−1 (Micro Mist AR27-04-FM02E, Glass Expansion, West Melbourne, Australia).| SHIP torch | Standard torch | |
|---|---|---|
| Indicated RF power (W) | 1100 | 1200 |
| Center carrier gas flow (L min−1) | 0.4 | 1 |
| Auxiliary plasma gas flow (L min−1) | 0.2 | 1 |
| Outer plasma gas flow (L min−1) | — | 12 |
| External cooling air flow (L min−1) | 245 | — |
| Ar counterflow (L min−1) | 0 | 0.6 |
| Distance from OPI (cm) | 1 | 1 |
| Sample uptake rate (mL min−1) | 0.2 | 2 |
Probes for voltage and current measurements were manufactured at Ingenieurbüro Dr Dietrich Birus, see Table 2. The voltage probe is a capacitive-resistive transmitter of the measured value using high voltage high frequency capacitors with a broadband matching circuit. The current probe is an inductive transmitter of the measured value with Rogowski coil using ferrite cores and a matching circuit. Both probes converted the measured values to low voltage signals, which were directed through BNC cables to an oscilloscope with 50 ohm input resistance (HMO3524, Hameg Instruments GmbH, Mainhausen, Germany, bandwidth 350 MHz, 4 channels, 8 bit digital resolution, sampling rate up to 50 GS per s; 10 GS per s was used in our experiments). The probes were incorporated into the RF generator of the ICP instrument, which has a frequency of 27.12 MHz and uses a tube-based Huth–Kühn circuit. Most importantly, the probes were installed in a way so that they measure voltage and current directly in the ICP coil. In Fig. 1, a schematic diagram of the probe connections is presented. The bodies of the probes were well grounded to the generator. Because a high current flows in the chassis of the generator, the connecting BNC cables were positioned completely outside the generator (voltage probe) or additionally shielded (current probe). The certified frequency range of the probes is from 1 to 50 MHz and allows the measurement of the 2nd harmonic (54.24 MHz) of the RF oscillations. Higher harmonics can be observed but only qualitatively.
| Voltage probe | Current probe | |
|---|---|---|
| Frequency range | 1–50 MHz | 1–50 MHz |
| Input at 30 MHz | ≤5 kVrms | 5–50 A |
| Sensitivity at 50 ohm load | 3000![[thin space (1/6-em)]](https://www.rsc.org/images/entities/char_2009.gif) :1 :1 |
10 A V−1 |
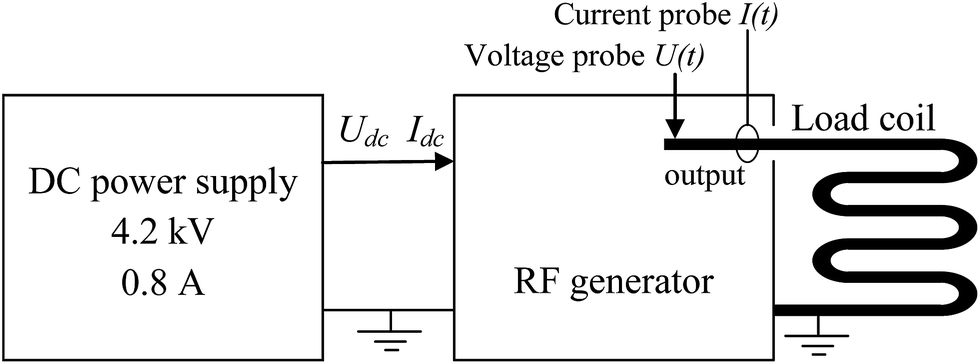 | ||
| Fig. 1 Schematic diagram of the RF power supply and connections of the probes. | ||
To prove the quality of the probe measurements, voltage and current in the coil were measured without plasma. The impedance of the coil Z was calculated from the measured data, see Fig. 2: Z = U/I ≈ 55 ohm, where U is the amplitude of the 1st harmonic of the measured voltage and I is the amplitude of the 1st harmonic of the measured current (details on harmonics are given in Section 3.1). Alternatively, the coil impedance was estimated from the geometry of the coil using the formula for a solenoid: Zs = ωL, L ≈ μ0(N/l)2V, where ω = 2π × 27.12 MHz is the angular frequency of the RF oscillations, L is the inductivity of the coil, μ0 is the vacuum permeability, N ≈ 2.5 is the number of turns of the coil, l is the axial length of the coil, and V is the volume covered by the coil. The resulting Zs ≈ 70 ohm is in good agreement with Z, indicating the good quality of the probe measurements.
 | ||
| Fig. 2 Amplitudes of the 1st harmonic of the measured voltage and current without plasma. | ||
The temperature of the chassis of the RF generator was measured to investigate a potential correlation between the heating of the RF generator and the measured electrical properties (see Section 3.3 for details). The precise absolute temperature value of the generator was not relevant for these investigations, but rather the relative correlation. Therefore, the temperature could be measured at any point of the chassis. Here, an upward surface part of the generator was used, which was easily reachable for the measurements. The temperature was measured with an infrared thermometer IR-365RF (Voltcraft). In IR measurements, the emissivity of the surface, where the temperature is measured, is an essential parameter for the calculation of the temperature. Therefore, the surface of the chassis was covered with a graphite powder (GRAPHIT 33, Kontakt Chemie) to obtain a surface emissivity of approximately 1.
The dc voltage and current applied to supply the RF generator were measured using built-in converters. For the determination of the intensities of Fe and Mg spectral lines, a standard solution containing 100 mg L−1 Fe and 100 mg L−1 Mg was prepared from the following standards: Fe CGFE1-125 mL, inorganic ventures, Christiansburg, Virginia, USA; Mg Certipur 1000 mg L−1, Merck KGaA, Darmstadt, Germany.
3 Results and discussion
3.1 Harmonics
Harmonics in the measurements are important in two aspects. First, the RF generator and electrical circuits are designed for the fundamental frequency. Thus, higher harmonics can reduce the efficiency of the generator and thus also the plasma excitation. Second, in models of spectroanalytical ICPs, it is often assumed that the current has a purely sinusoidal form.1,7–9 This assumption should be investigated in this study.Examples of the measured voltages and currents are presented in Fig. 3a. High harmonics are seen in the measured voltage with and without plasma. Fig. 3b shows the Fourier spectra of the measured signals. The 11th harmonic of the voltage reaches 12% of the fundamental wave and is clearly visible in the time domain. Half of the wavelength of the 11th harmonic is about 50 cm, which corresponds approximately to the dimensions of the RF generator. Therefore, standing waves are probably excited in the chassis of the generator. The highest harmonic of the current is the 5th one. It reaches 3.5% of the fundamental wave. Note that the strongest 11th and 12th harmonics of the voltage come with weak 11th and 12th harmonics of the current. Similarly, the strongest 5th harmonic of the current is accompanied with a relatively low amplitude of the corresponding voltage harmonic. Based on these observations, it is concluded that harmonics are distinguished in the time and frequency domain but they do not consume much power.
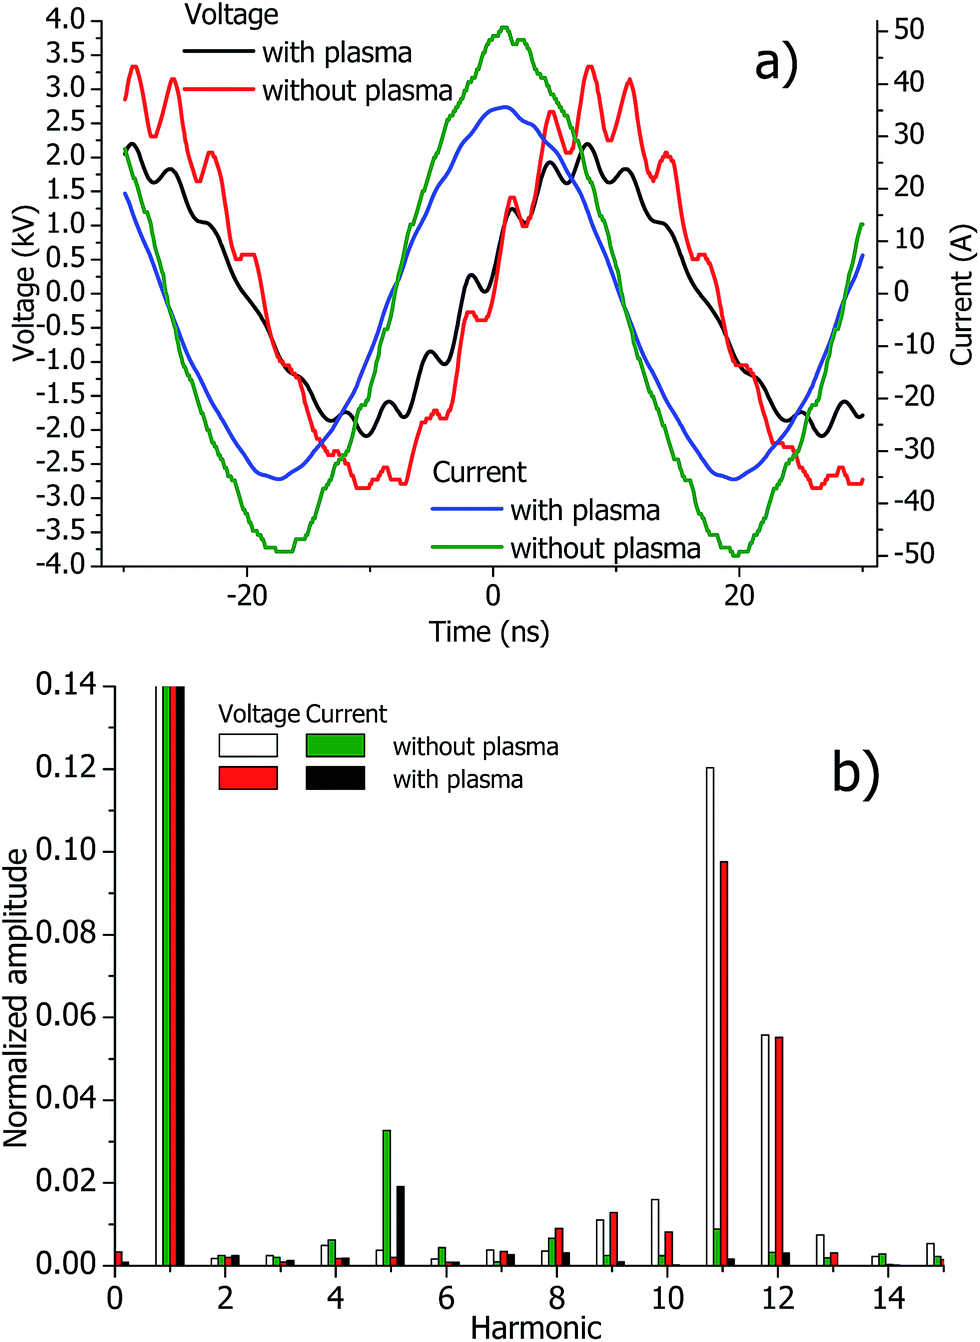 | ||
| Fig. 3 Measured coil voltages and currents as functions of time (a) and their normalized Fourier spectra (b). The normalization makes the amplitudes of the fundamental wave of all the presented spectra equal to 1. A standard torch with optimal plasma conditions was used. | ||
Amplitudes of the harmonics of the current do not exceed 3.5% of the fundamental frequency. This confirms the assumption in spectroanalytical ICP models that the electrical current has a clean sinusoidal form, as discussed above. However, the interpretation of the measured harmonics should be made cautiously because the frequencies of the measured harmonics are higher than the certified frequency of the probes used here.
3.2 Measurement of power
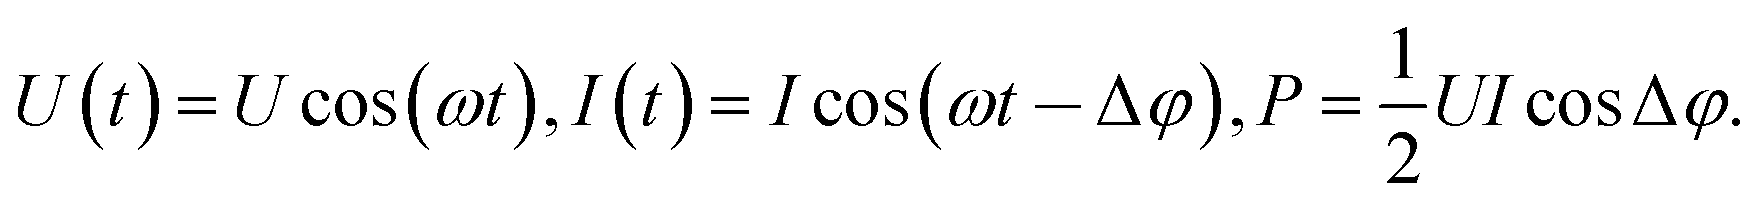
Having measured the voltage U(t) and current I(t) in the coil, the power can be calculated as follows: | (1) |
 | (2) |
(1) Measurement of the phase difference of the measurement system. For this, the RF power is applied to the coil without plasma; U0(t) and I0(t) are measured. Assuming no power losses in the coil, the power calculated in (1) should be zero. This gives us the condition for the calculation of Δφprobes:
 | (3) |
(2) Measurement of U1(t) and I1(t) with plasma.
(3) Numerical calculation of the plasma power with a correction of Δφprobes:
 | (4) |
In Appendix A, a mathematical substantiation of this method is given.
Similarly, knowing the measured U1(t) and I1(t), and the previously calculated Δφprobes, the power P(Δφprobes) in (4) is calculated numerically using the trapezoidal rule and the linear interpolation between the points Δφi and Δφi+1.
For better accuracy of the power measurements, the measured U0(t), I0(t), U1(t), and I1(t) are averaged 128 times by the oscilloscope during the measurements.
| One by one measurement with the standard torch, no sample introduction, dry plasma | One measurement per day with the standard torch, wet aerosol introduction | One measurement per day in SHIP, wet aerosol introduction | ||
|---|---|---|---|---|
| Voltage without plasma | Mean (V) | 2840 | 2800 | 2760 |
| STD (V) | 8.7 | 0.3 | 6 | |
| RSD | 0.3% | 0.01% | 0.2% | |
| Current without plasma | Mean (A) | 52.2 | 53.55 | 52.9 |
| STD (A) | 0.08 | 0.5 | 0.09 | |
| RSD | 0.15% | 0.9% | 0.2% | |
| Phase without plasma | Mean (rad) | 0.39773 | 0.3956 | 0.3955 |
| STD (rad) | 0.00082 | 0.009 | 0.0015 | |
| Voltage with plasma | Mean (V) | 1630 | 1990 | 1410 |
| STD (V) | 0.7 | 23 | 15 | |
| RSD | 0.04% | 1.1% | 1% | |
| Current with plasma | Mean (A) | 30.55 | 38 | 27.8 |
| STD (A) | 0.01 | 0.5 | 0.3 | |
| RSD | 0.04% | 1.3 | 1% | |
| Phase with plasma | Mean (rad) | 0.351961 | 0.36119 | 0.35269 |
| STD (rad) | 0.0003 | 0.008 | 0.003 | |
| Power | Mean (W) | 940 | 1240 | 840 |
| STD (W) | 24 | 225 | 65 | |
| RSD | 2.5% | 18% | 8% |
A likely reason for the relatively high variation of the phases is the influence of the RF generator temperature on the properties of the RF generator and the probes. In Table 4, the measured phase difference between U(t) and I(t) without plasma is presented. There is a significant change of the phase difference before plasma ignition and immediately after the plasma is switched off. After power off, the instrument was idle for 2 hours before and U(t) and I(t) were measured again (plasma off). Interestingly, the phase difference comes back to the initial value. This can be explained by a temperature change of the RF generator: before plasma ignition, the RF generator is relatively cold. During plasma operation, the temperature of the RF generator and probes increases and results in a distinct change of the phase difference. After the plasma is switched off, the RF generator cools down, and the phase difference comes back to the initial value. In Fig. 4, the temperature of the RF generator measured at the surface of the chassis as a function of time is presented together with the measured voltage and current in the coil. A good correlation of the data is seen, confirming the influence of temperature.
| Before plasma ignition | 0.4008 ± 0.002 rad |
| Just after plasma switch off | 0.3948 ± 0.001 rad |
| 2 hours after the plasma was switched off | 0.3999 ± 0.0005 rad |
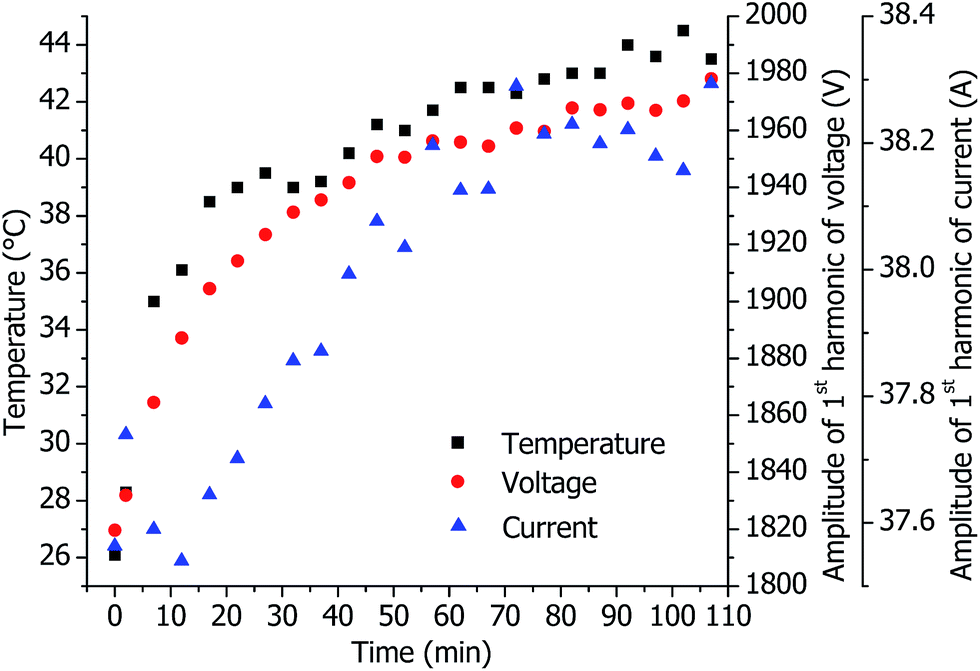 | ||
| Fig. 4 Measured temperatures of the chassis of the RF generator, coil voltage and current as functions of time. Plasma with the standard torch under optimal conditions. | ||
The change of the RF generator temperature can result in a change of the RF power and the plasma properties. Additionally, the temperature of the probes changes, which alters their properties. This can introduce an additional error to the measurements of the power. To estimate this error, let us apply eqn (2) with a phase difference caused by the probe temperature in Table 4 and typical plasma properties (Fig. 3). This results in ΔP ≈ 210 W. Thus, the estimated additional error caused by the probe temperature can reach 15–20% of the measured power when using a standard torch. This is in agreement with the everyday power reproducibility presented in Table 3. A better reproducibility when using a low-flow torch can be explained by the temperature of the RF generator: the applied plasma power used here is lower compared to conventional ICP operation (see Section 3.3, Table 6). This results in less severe heating of the RF generator and probes and hence to a smaller error of the power measurements. Certainly, the measurement of the power from U(t) and I(t) could be improved by the stabilization of the RF generator temperature in future experiments. In doing so, it is assumed that a long-term precision of 2–3% could be achieved.
3.3 Electrical properties of the ICP source under different plasma conditions
To study the evolution of the ICP properties in a time-resolved fashion, the electrical parameters were measured simultaneously with the optical plasma emission. These measurements were done with standard and SHIP torches under optimal conditions. Sample solutions containing 100 mg L−1 Fe and 100 mg L−1 Mg were introduced into the plasma and plasma radiation was detected by a built-in spectrometer of the CIROS instrument. From the recorded optical spectra, background corrected intensities of OH, Mg, Fe and Ar lines were measured. Based on this, the rotational temperature of the OH band,14,15 and the excitation temperature of the Fe levels14,16 were measured using the Boltzmann plot method. A list of the used spectral lines and fundamental data is provided in the ESI (see the ESI, Tables S-1 and S-2†). Additionally, the electron temperature was measured from the ratio of Ar I 430.01 nm line and background.14,17 Note that the detection system of the CIROS instrument does not provide any lateral resolution. The emission is measured axially and the OPI acts as an aperture to select only light from the central analytical channel of the plasma. Because of this, the measured temperatures are calculated from the spectral lines emitted by the plasma volume inside the central channel, and therefore can characterize the internal plasma properties only approximately.The time-resolved profile of the measured electrical and spectral properties of the ICP with standard and SHIP torches is presented in Fig. 5. Evolution of the measured voltage and current does not contribute significantly to the evolution of the resulting power (see Fig. 5a and b). The power is affected much more by the measured phase shift, which confirms the crucial role of the phase in the formation of power.
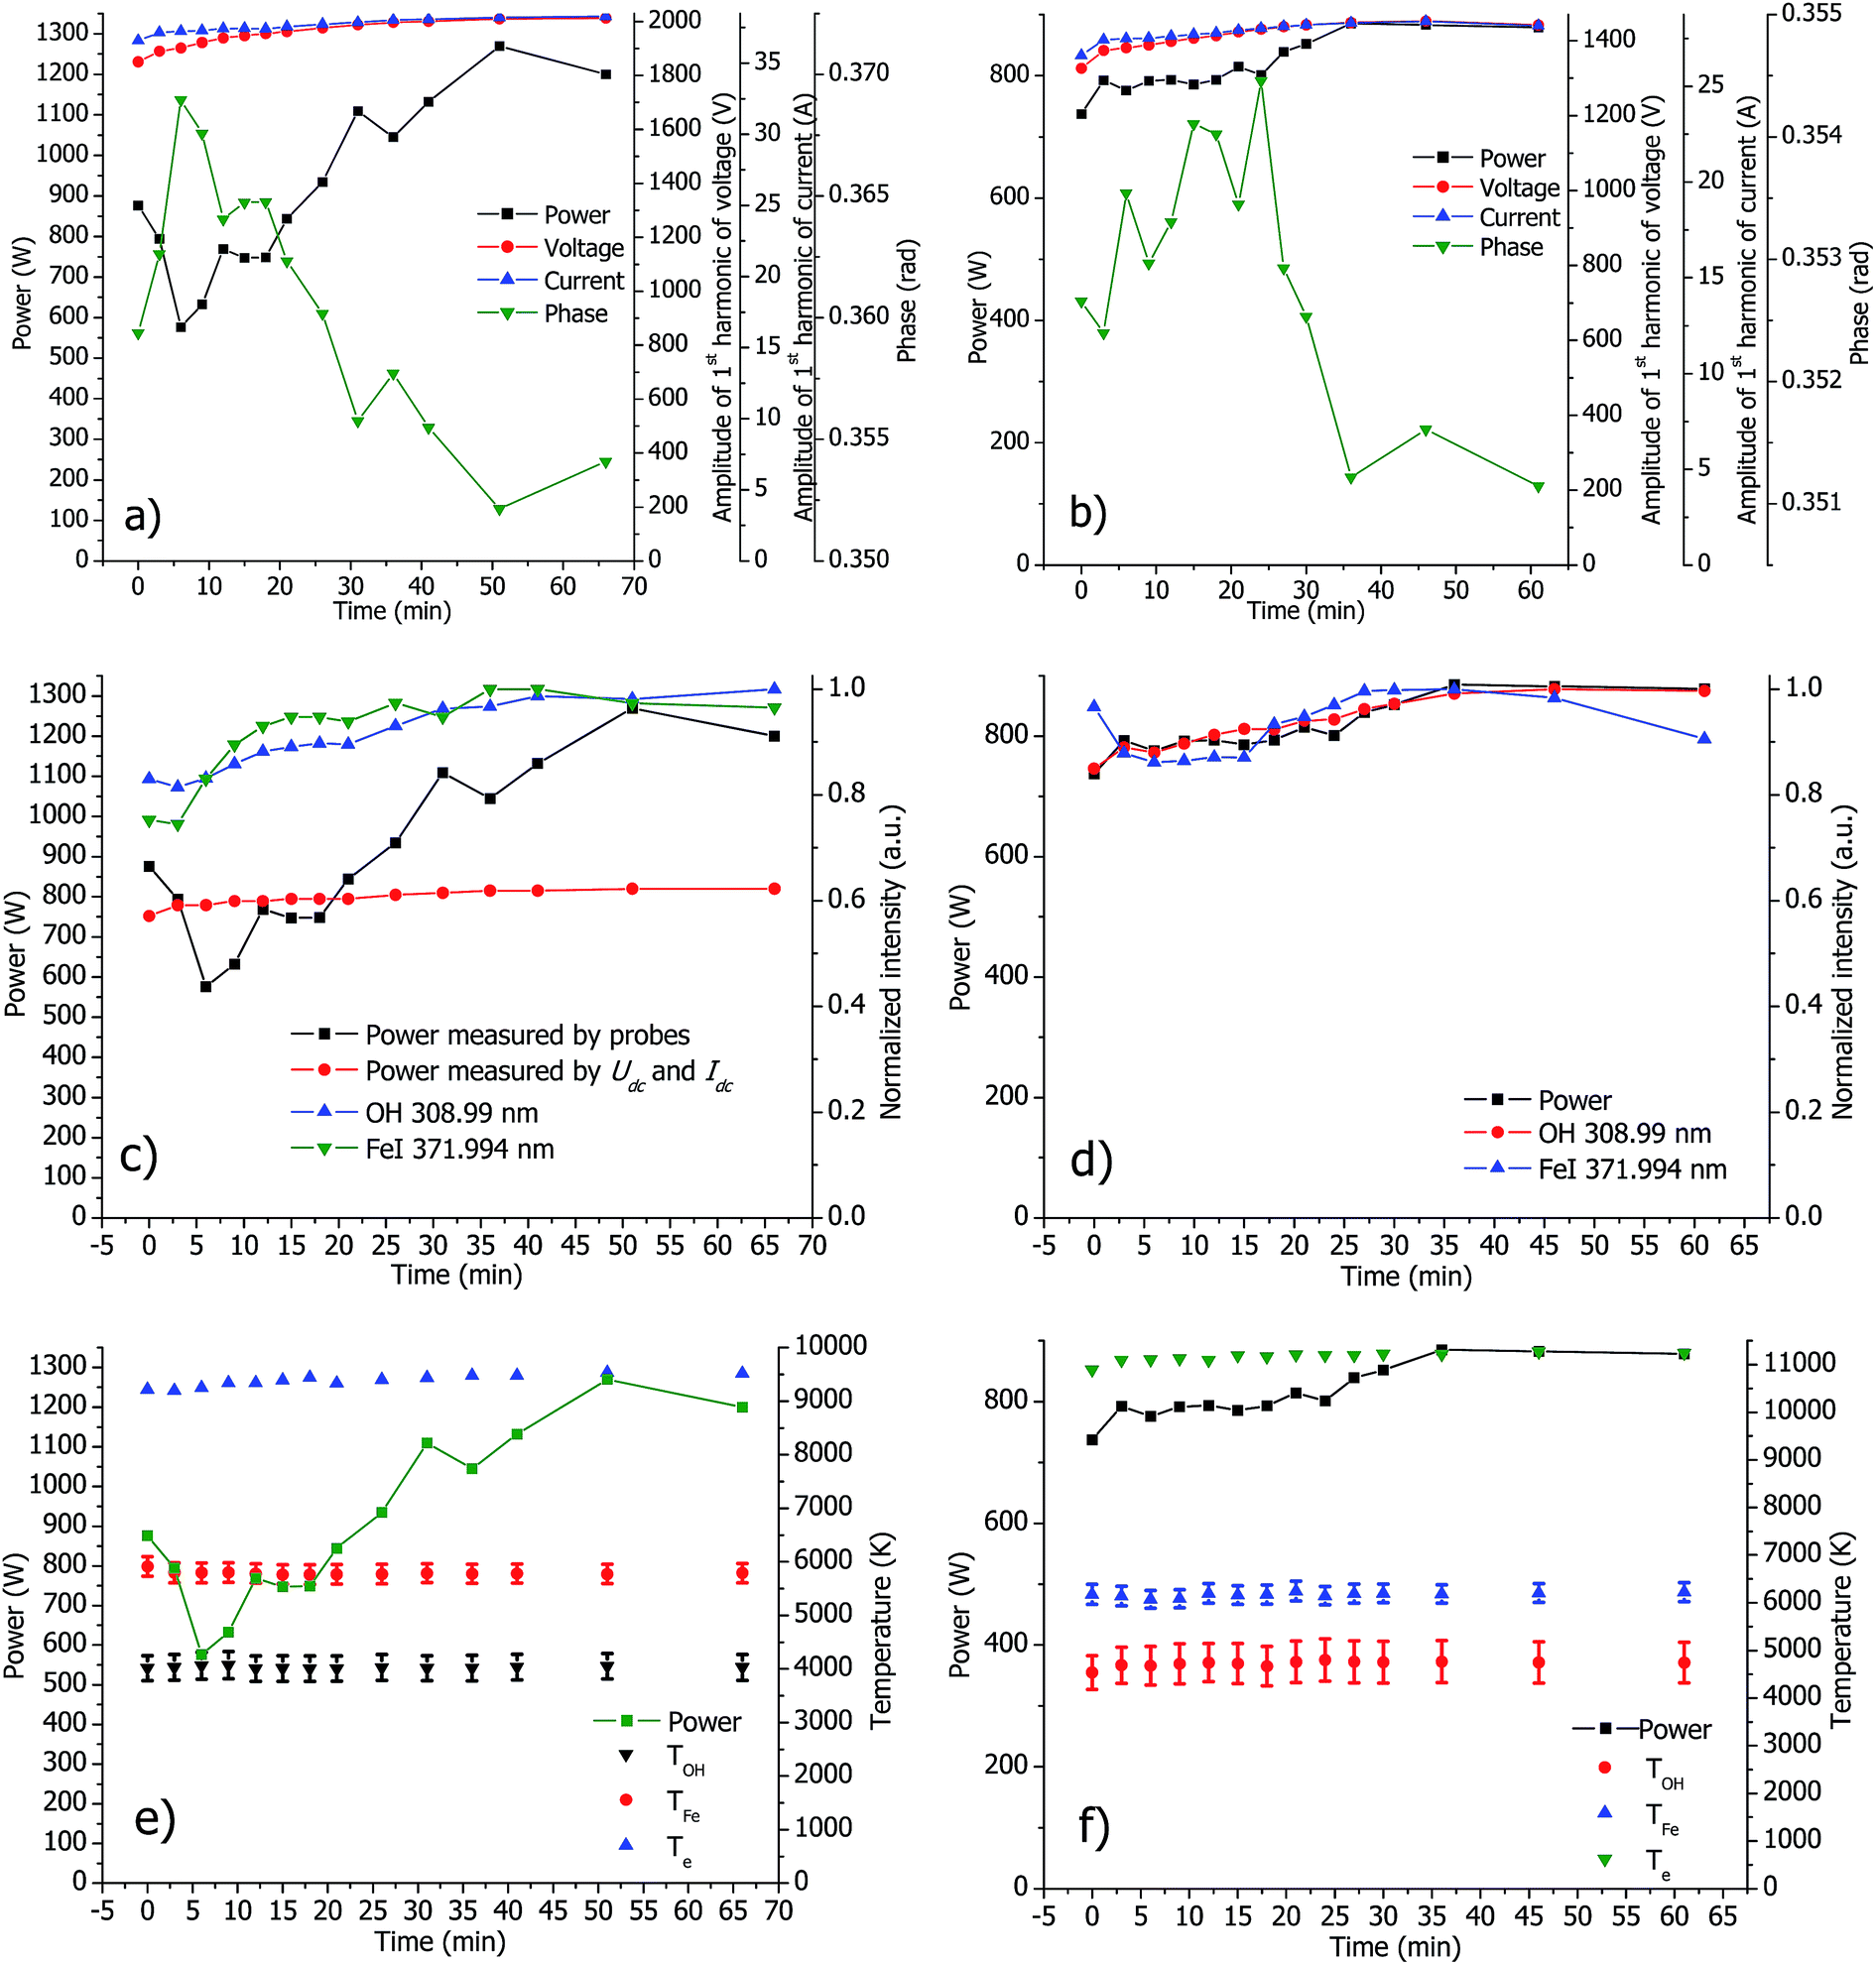 | ||
| Fig. 5 Evolution of the measured power (all figures), measured voltage, current and phase (a and b), emission lines (c and d) and the measured plasma temperatures (e and f) in standard (a, c and e) and SHIP (b, d and f) torches. The plasma is under optimal conditions. (c) Contains additionally the power measured from the dc current Idc and dc voltage Udc applied to supply the RF generator.18 | ||
A correlation of ICP power with the measured line intensities is clearly seen in Fig. 5c and d. The plasma reaches a steady state in about 30 minutes, which is in agreement with analytical practice. The power indicated by the instrument's software remains, however, constant over that time. Note that the measured evolution of power includes the influence of temperature of the probes, as discussed above. Surprisingly, the measured plasma temperatures exhibit only small changes over the course of the measurements (see Fig. 5e and f).
The measured power with standard and SHIP torches at different power settings is presented in Table 5. As a general observation, it was found that the power value that is indicated by the vendor's software differs significantly from the true plasma power depending on the plasma conditions. In Table 6, electrical parameters under different plasma conditions are presented. Although the indicated power remains constant, the measured one is greatly changed. From here arises the question: how is the power controlled in the instrument?
| Indicated power (W) | Power in standard torch (W) | Power in standard torch without sample (W) | Power in SHIP (W) |
|---|---|---|---|
| 1000 | 780 | ||
| 1100 | 960 | 740 | |
| 1200 | 1170 | 860 | 800 |
| 1400 | 1440 | 1160 |
| Parameter | Measured voltage (V) | Measured current (A) | Measured power (W) |
|---|---|---|---|
| Standard torch | |||
| Optimal conditions | 1980 | 37.1 | 1150 |
| Indicated power 1100 W | 1920 | 35.6 | 950 |
| Indicated power 1400 W | 2200 | 41.4 | 1450 |
| Nebulizer flow 0 L min−1 | 1670 | 31.4 | 700 |
| Nebulizer flow 1.5 L min−1 | 1870 | 35.9 | 1200 |
| Auxiliary flow 0.6 L min−1 | 1940 | 35.9 | 1500 |
| Auxiliary flow 2 L min−1 | 2140 | 39.2 | 1350 |
| Cooling flow 11 L min−1 | 1960 | 37.3 | 1250 |
| Cooling flow 20 L min−1 | 1760 | 33.9 | 1100 |
| Counterflow through OPI 0 L min−1 | 2030 | 37.9 | 1200 |
| Counterflow through OPI 0.8 L min−1 | 2040 | 37.9 | 1150 |
| Without sample | 1580 | 30.7 | 950 |
| Distance to OPI 3.5 cm | 1970 | 36.2 | 1050 |
|
|||
| SHIP | |||
| Optimal conditions | 1590 | 30.2 | 750 |
| Indicated power 1000 W | 1520 | 29.0 | 500 |
| Indicated power 1200 W | 1510 | 29.2 | 800 |
| Nebulizer flow 0 L min−1 | 900 | 18.1 | 550 |
| Nebulizer flow 0.6 L min−1 | 1610 | 30.6 | 800 |
| Auxiliary flow 0.4 L min−1 | 1320 | 25.8 | 600 |
| Auxiliary flow 0.6 L min−1 | 1320 | 25.7 | 600 |
| Air cooling flow 150 L min−1 | 1480 | 28.3 | 750 |
| Air cooling flow 340 L min−1 | 1540 | 29.5 | 750 |
| Without sample | 1180 | 23.3 | 600 |
By information from SPECTRO, the power in the CIROS is not controlled directly. Instead, the dc current Idc applied to supply the RF generator is used to control the RF generator. This is confirmed by the measurements in Fig. 6, where the indicated power as a function of Idc is presented. The plasma power is calibrated by Idc under optimal plasma conditions in the factory; this calibration is then used to indicate the plasma power. However, if plasma conditions are far from the optimum or a standard ICP torch is not used, then this power calibration approach fails and somewhat misleading power values will be shown in vendor's software. As it was discussed above, to our knowledge, all the ICP instruments in the market do not measure the power directly,2 leaving a lot of room for further improvements.
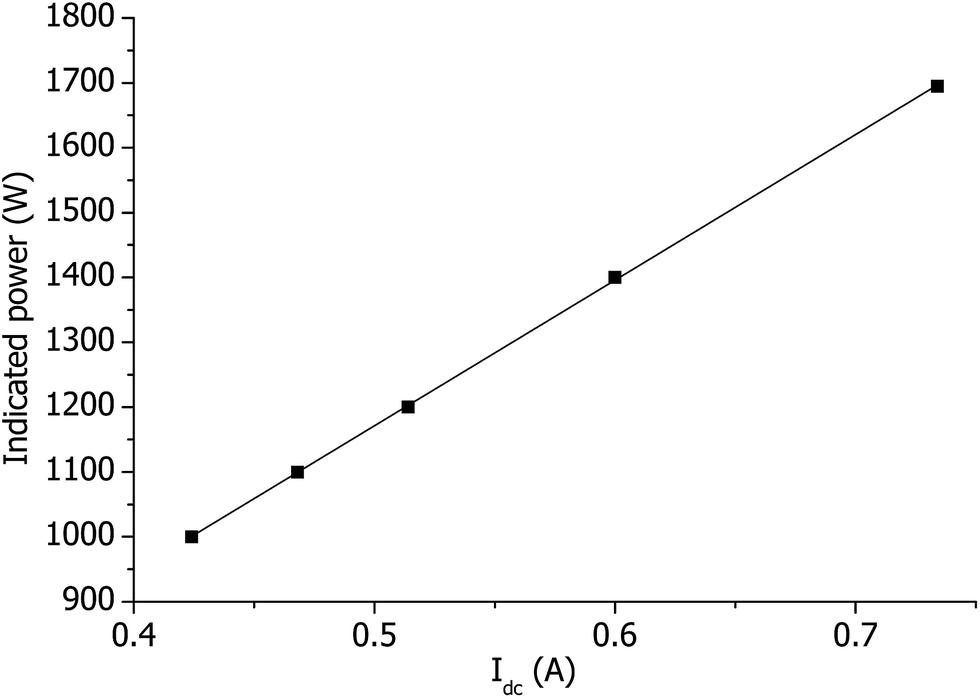 | ||
| Fig. 6 Indicated power as a function of the measured dc current Idc applied to supply the RF generator. | ||
Alternatively, the ICP power can be measured knowing the dc current Idc and dc voltage Udc applied to supply the RF generator (see Fig. 1). Because the product of Idc and Udc results in the total power consumed by the plasma and the RF generator, the power of the RF generator without plasma must be measured and subtracted from the result. This technique is used sometimes in RF glow discharge18 but can only be used for an approximate estimation of the power. In Fig. 5, the evolution of the power calculated from the Idc and Udc is presented. It was found to correlate with the plasma emission but results in lower power values than expected.
An important question is if changes in the sample and matrix concentration will have an influence on the electrical parameters in the CIROS ICP-OES. To get a first impression, four fundamentally different scenarios were investigated: (a) analysis of a 100 mg L−1 Mg and Fe solution under wet plasma conditions, (b) the latter sample but with the addition of matrix (1 mass percent NaCl), (c) dry plasma conditions with a closed off inlet capillary, and (d) dry plasma conditions and an open sample introduction tube to allow air entrainment from the atmosphere. The results are listed in Table 7. It is clearly seen that the plasma power is different under different sampling scenarios. Thus, it is assumed that the measured U, I, and P will be useful in the future for fundamental plasma studies and as potential indicators for changing matrices and matrix effects.
| Matrix | Standard torch (indicated power 1200 W) | SHIP (indicated power 1100 W) | ||||
|---|---|---|---|---|---|---|
| U (V) | I (A) | P (W) | U (V) | I (A) | P (W) | |
| 100 mg L−1 Mg and Fe solution | 2010 | 38.3 | 1200 | 1460 | 28.4 | 890 |
| No sample | 1590 | 31.0 | 980 | 900 | 18.1 | 630 |
| Air | 2500 | 47.7 | 1080 | 1600 | 31.2 | 950 |
| 100 mg L−1 Mg and Fe solution + 1 m m−1 % solution of NaCl | 1970 | 37.8 | 1090 | 1390 | 27.4 | 760 |
An interesting result is the statistics of all measured U and I under different plasma conditions. In Fig. 7, U as a function of I is presented for all operational conditions, i.e. the presented points include all measurements under different plasma conditions, different torches, different matrices, and even the measurements without plasma. The linear relationship between the voltage and current indicates that the coil impedance dominates the impedance of the ICP. Thus, the plasma load (including the capacitive coupling of the plasma to the coil) has a much larger resistance compared to the impedance of the coil, which is about 50 ohm.
 | ||
| Fig. 7 Measured coil voltage vs. measured coil current for all operational conditions, i.e. the presented points include all measurements under different plasma conditions, different torches and different matrices, and even the measurements without plasma. | ||
4 Conclusions
Voltage and current probes were successfully incorporated into the RF generator of an ICP instrument and allowed the measurement of the voltage and current directly at the ICP load coil. Based on these measurements, a method for the calculation of the plasma power was developed. The plasma power can now be measured with acceptable precision. Voltage, current, and plasma power are measured for a wide range of different plasma parameters. It is found that the measured power can differ significantly from the one stated in the vendor software. This is because the instrument controls the plasma power indirectly, and therefore, the indicated power matches the real power value only if the ICP operates near optimal conditions. Furthermore, it was found that the voltage, current, and plasma power are sensitive to matrix effects and could be used as indicators for changes in the ICP. Also, they are considered suitable as input parameters and data for comparison for future numerical ICP simulations. Harmonics in the measured voltage and current are found, which, however, do not seem to have a significant influence on the plasma power. With respect to the computer modeling of the ICP, the amplitude of the current harmonics is negligible in comparison with the fundamental wave. This confirms the suggestion used in many ICP models, i.e., that the current is thought to have a purely sinusoidal form.In general, the measurement of electrical parameters in an ICP is difficult for all types of RF generators and ICPs that are used today. The probes presented here are considered very useful tools to gain further insight into fundamental processes in the ICP and to optimize the overall analytical performance and stability. For example, time-profiles of the ICP power show that the power reaches a stable plateau after approximately 30 min, which is in agreement with the analytical ICP experience and practice. The time profile of the plasma power was also found to correlate with an observed temperature change of the RF generator chassis. It is assumed that the generator heating is the reason for a relatively long stabilization phase of the plasma properties. Thus, the measured electrical properties of the plasma are sensitive to the internal plasma properties.
Appendix A
We have to consider two points:(1) According to the result of the Fourier transformation (see Fig. 3), there is only the fundamental wave existing in both voltage U(t) and current I(t), simultaneously. In this case, the harmonics do not contribute to the power, and we will consider only a purely sinusoidal form of U(t) and I(t) with a certain phase difference between them for the power calculation:
(2) The product of U and I is much higher than the expected plasma power. This means that Δφ ≈ π/2. In our case, this is well satisfied for all measurements with and without plasma (see Fig. 3).
With these assumptions, in the 1st step of the power determination procedure, U0(t) = U0cosωt and I0(t) = I0cos(ωt − Δφ0measured) are measured without plasma, where Δφ0measured is the measured phase difference between voltage U0(t) and current I0(t). Δφ0measured includes the actual phase difference Δφ0 and Δφprobes: Δφ0measured = Δφ0 + Δφprobes. The condition in eqn (3) gives Δφprobes = π/2 − Δφ0measured.
In the 2nd step, U1(t) = U1cosωt and I1(t) = I1cos(ωt − Δφ1measured) are measured with plasma, where Δφ1measured is the phase difference between U1(t) and I1(t). Again, Δφ1measured includes the actual phase difference Δφ1 and Δφprobes: Δφ1measured = Δφ1 + Δφprobes.
In the 3rd step, eqn (4) is converted to

In this presentation, it becomes clear that the calculated power depends on the actual phase differences Δφ0 and Δφ1 rather than on the measured ones, Δφ0measured and Δφ1measured.
Taking into account the 2nd assumption, sinΔφ0 ≈ sinΔφ1 ≈ 1. Thus, 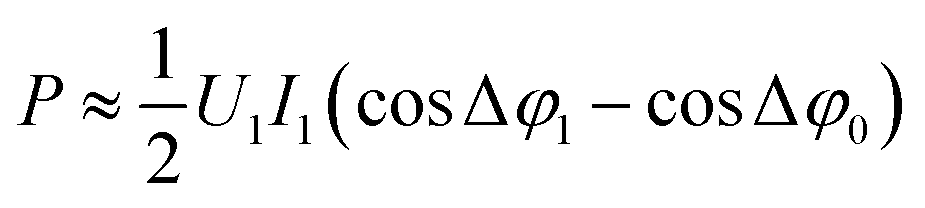 within the 1st order of accuracy of the approximation by Taylor raw near π/2. In the last expression, P consists of the difference of two terms. The 1st term is
  – the total power, which includes the plasma power and the power losses in the coil. The second term is
  , where
 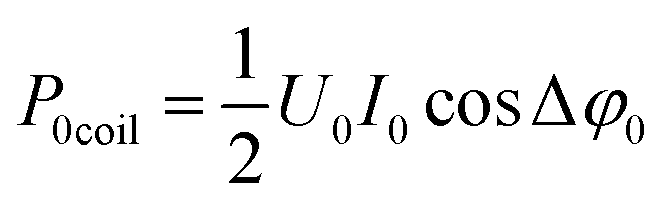 is the power loss in the coil without plasma. Pcoil agrees with P0coil scaled with the amplitudes of the voltage and current with plasma. Therefore, Pcoil represents the power loss in the coil with plasma. Hence, the calculated P is the total power Ptotal minus the loss of power in the coil, i.e. P is the pure plasma power.
Acknowledgements
The authors would like to acknowledge Dr Dirk Ardelt from SPECTRO for the support and very useful discussion during the course of this study. Financial support from the German Research Foundation, grant No. BU 1140/5-1, HO 2062/9-1 is gratefully acknowledged.References
- Inductively Coupled Plasma in Analytical Atomic Spectrometry, ed. A. Montaser and D. W. Golightly, VCH Publishers, New York, 2nd edn, 1992 Search PubMed.
- S. Greenfield and A. Montaser, Common RF Generators, Torches, and Sample Introduction Systems, in Inductively Coupled Plasmas in Analytical Atomic Spectrometry, ed. A. Montaser and D. W. Golightly, VCH Publishers, Inc., New York, 1992, pp. 187–247 Search PubMed.
- C. D. Allemand and R. M. Barnes, Spectrochim. Acta, Part B, 1978, 33, 513 CrossRef.
- G. C.-Y. Chan and G. M. Hieftje, J. Anal. At. Spectrom., 2008, 23, 181 RSC.
- G. C.-Y. Chan, Z. Zhu and G. M. Hieftje, Spectrochim. Acta, Part B, 2012, 76, 87 CrossRef CAS PubMed.
- H. Wiltsche, F. Moradi and G. Knapp, Spectrochim. Acta, Part B, 2012, 71–72, 48 CrossRef CAS PubMed.
- S. Xue, P. Proulx and M. I. Boulos, J. Phys. D: Appl. Phys., 2001, 34, 1897 CrossRef CAS.
- D. Bernardi, V. Colombo, E. Ghedini and A. Mentrelli, Eur. Phys. J. D, 2003, 27, 55 CrossRef CAS PubMed.
- H. Lindner and A. Bogaerts, Spectrochim. Acta, Part B, 2011, 66, 421 CrossRef CAS PubMed.
- A. Klostermeier, C. Engelhard, S. Evers, M. Sperling and W. Buscher, J. Anal. At. Spectrom., 2005, 20, 1 RSC.
- C. Engelhard, A. Scheffer, S. Nowak, T. Vielhaber and W. Buscher, Anal. Chim. Acta, 2007, 583, 319 CrossRef CAS PubMed.
- C. Engelhard, A. Scheffer, T. Maue, G. M. Hieftje and W. Buscher, Spectrochim. Acta, Part B, 2007, 62, 1161 CrossRef PubMed.
- C. Engelhard, G. C.-Y. Chan, G. Gamez, W. Buscher and G. M. Hieftje, Spectrochim. Acta, Part B, 2008, 63, 619 CrossRef PubMed.
- T. Hasegawa, M. Umemoto, H. Haraguchi, C. Hsiech and A. Montaser, Fundamental properties of inductively coupled plasmas, in Inductively Coupled Plasmas in Analytical Atomic Spectrometry, ed. A. Montaser and D. W. Golightly, VCH Publishers, Inc., New York, 1992, pp. 373–449 Search PubMed.
- I. Ishii and A. Montaser, Spectrochim. Acta, Part B, 1991, 46(8), 1197 CrossRef.
- J. Jarosz, J. M. Mermet and J. P. Robin, Spectrochim. Acta, Part B, 1978, 33, 55 CrossRef.
- G. J. Bastiaans and R. A. Mangold, Spectrochim. Acta, Part B, 1985, 40(7), 885 CrossRef.
- C. M. Horwitz, J. Vac. Sci. Technol., A, 1983, 1(4), 1795 CAS.
Footnote |
| † Electronic supplementary information (ESI) available. See DOI: 10.1039/c5ja00154d |
| This journal is © The Royal Society of Chemistry 2015 |