
 Open Access Article
 This Open Access Article is licensed under a
 Creative Commons Attribution 3.0 Unported Licence
Chlorine isotope determination via the monitoring of the AlCl molecule by high-resolution continuum source graphite furnace molecular absorption spectrometry – a case study
F. V.
Nakadi
ab,
M. A. M. S.
da Veiga
ab,
M.
Aramendía
ac,
E.
García-Ruiz
a and
M.
Resano
*a
aDepartment of Analytical Chemistry, Aragón Institute of Engineering Research (I3A), University of Zaragoza, Pedro Cerbuna 12, 50009, Zaragoza, Spain. E-mail: mresano@unizar.es
bWhile on leave from Departamento de Química, Faculdade de Filosofia, Ciências e Letras de Ribeirão Preto, Universidade de São Paulo, 14040-901, Ribeirão Preto-SP, Brazil
cCentro Universitario de la Defensa-Academia General Militar de Zaragoza, Carretera de Huesca s/n, 50090, Zaragoza, Spain
First published on 8th April 2015
Abstract
This work investigates the possibility of obtaining isotopic information via the monitoring of the absorption spectra of a gaseous diatomic molecule generated in a graphite furnace and using a high-resolution (approx. 1.5 pm per pixel) monochromator (HR CS GFMAS). To test this concept, Cl was chosen as the analyte and AlCl as the target species. The results demonstrate that, unlike what occurs with atomic spectra, under optimum conditions it is possible to acquire isotopic information by HR CS GFMAS in a straightforward way, as it is feasible to observe band heads for each Cl isotope (actually, for Al35Cl and Al37Cl) that are separated, i.e., they act like two different molecules absorbing at different wavelengths. The method proposed, based upon the addition of both Pd and Al and the selection of peak height values, enables Cl isotopic analysis with precision values around 2% RSD for solutions with Cl contents at the mg L−1 level. Accurate values, within this uncertainty, can be directly obtained without requiring any method for mass bias correction. The potential of isotope dilution for calibration is also explored, and it is proven how this approach can help in providing accurate results in situations where the occurrence of chemical interferences, a case frequently encountered for the HR CS GFMAS technique, hampers the use of other calibration approaches, as demonstrated for water analysis.
1 Introduction
Despite its toxicity, chlorine is a widely used industrial commodity. Chlorine is used in many different fields, such as production of chlorinated solvents and other chemicals, water purification, plastics production and pulp and paper manufacture,1 thus making it necessary to control the presence of this element at trace levels in a wide variety of samples.2–9In addition to controlling the elemental content, investigating the isotopic composition of Cl can be of interest in different situations, as it may help, for instance, to track the source or the fate of different Cl species in the environment, or in biological fluids, or help in elucidating geochemical processes.10 Some recent articles, based on the use of different techniques such as gas source mass spectrometry (often referred to as IR-MS11), thermal ionization mass spectrometry,12,13 laser ablation multicollector-inductively coupled plasma mass spectrometry (MC-ICPMS),14 ion chromatography MC-ICPMS,15 gas chromatography-MS,16 and high performance liquid chromatography-MS/MS,17 have evaluated the isotope content of Cl in different matrices. These techniques rely on the high sensitivity and selectivity of mass spectrometry, which typically requires rigorous sample preparation to avoid matrix interferences.18
Some interesting alternatives to MS techniques, which may be worth exploring, are appearing in the literature recently. For instance, laser ablation molecular isotopic spectrometry (LAMIS), developed by Russo et al., explores the concept of wavelength isotopic shifts between diatomic molecules.19,20 This technique can be seen as an evolution of LIBS, but instead of aiming at the monitoring of the emission spectra of elemental species, which are well-known to show very small isotopic variations, its goal is to evaluate and quantify isotopic shifts occurring for diatomic molecules, in which one of the atoms is the target analyte. These shifts are significantly larger than their atomic counterparts,19 thus permitting to determine boron,19,21,22 carbon,19,23 hydrogen,19,24 oxygen,19 and strontium25 isotopes, without requiring extensive sample preparation or a vacuum environment.
In principle, not only emission but also absorption could be used to obtain isotopic information. When the goal is to monitor atomic absorption, high-resolution continuum source atomic absorption spectrometry (HR CS AAS) offers very significant advantages when compared to classic line source instrumentation,26 such as improved possibilities to detect and correct for interferences and lower limits of detection.27–32 In addition, this technique offers enough resolution (down to approx. 1 pm) to quantify different portions of an atomic line; however, even with such an instrument, it is very challenging to detect the small energy variations occurring for different isotopes, owing to a number of well-known factors (i.e., collisional broadening, Doppler and Stark effects) that result in the broadening of the peaks.
So far, only one study has intended to attain isotopic information using HR CS AAS.33 In such pioneering work, Wiltsche et al. used a flame as the atomizer and tried to take advantage of the large mass difference existing between the two isotopes of B, 10B and 11B, to determine B ratios in steel samples. The authors found a less sensitive atomic line (around 208.9 nm) that shows a higher isotopic shift than the most sensitive one (249.8 nm): 208.95898 nm for 10B and 208.95650 nm for 11B. This difference is still too small to observe two fully resolved peaks with a HR CS FAAS instrument. However, it can still be appreciated that the B absorption profile shifts as a function of the boron isotopic ratio: the higher the % of 10B, the higher the wavelength at which the peak maximum is found. Thus, it is in principle possible to determine the B isotopic composition. Nevertheless, since the isotopic shift of boron is very small, it is necessary to correct for possible instabilities of the monochromator in order to achieve sufficient precision and accuracy, which was done using a suitable internal standard (Fe or Ni) that was monitored in truly simultaneous mode. This approach was found satisfactory to distinguish different enrichment levels of 10B (within 5%) in steel samples.
There is another advantage of HR CS instrumentation that should not be overlooked. That is the potential to monitor not only atomic but also complex and transient molecular spectra, as generated from a graphite furnace, which offers more sensitivity than a flame as the atomizer. The resulting technique, high-resolution continuum source graphite furnace molecular atomic spectrometry (HR CS GFMAS) opens new ways to determine non-metals,34–36 for which it is hardly feasible to get access to their main atomic lines because they are located in the vacuum UV. But the use of HR CS GFMAS can also be beneficial for isotopic analysis, because, in the same way as explained before for LAMIS and emission spectrometry, the isotopic shifts found when monitoring molecular absorption spectra are expected to be much larger than those found for atomic absorption spectra.
This work aims at exploring this idea, the evaluation of the absorption of diatomic molecules, as a new possibility to acquire isotope data by means of HR CS GFMAS. In order to investigate this new concept, which to the best of our knowledge has not been reported before in the literature, Cl has been selected as the analyte, owing to its relevance, as discussed before. Al has been chosen as the pair to create the AlCl molecule, which will be the target of the HR CS GFMAS monitoring, with the goal of producing isotopic transitions that could be spectrally resolved.
2 Experimental
2.1 Instrumentation
All the AlCl measurements were performed with a high-resolution continuum source atomic absorption spectrometer, ContrAA 700, commercially available from Analytik Jena AG (Jena, Germany). The optical system comprises a xenon short-arc lamp (GLE, Berlin, Germany) operating in “hot-spot” mode as the radiation source, a high-resolution double echelle monochromator (DEMON) and a linear CCD array detector with 588 pixels, 200 of which are used for analytical purposes (monitoring of the analytical signal and BG correction), while the rest are used for internal functions, such as correcting for fluctuations in the lamp intensity. More details on this type of instrumentation can be found elsewhere.26 This instrument is also equipped with a transversely heated graphite tube atomizer, pyrolytic graphite tubes, and both automated solid sampling and liquid sampling accessories. In this work, only liquids were introduced in the graphite furnace.Moreover, an ICP mass spectrometer, NexION 300X (Perkin Elmer, USA) was used to validate the results obtained for the water samples by means of HR CS GFMAS.
2.2 Standards, reagents and samples
Two reference materials with a certified Cl isotopic composition (CRMs) were used in this work: SRM 975a Isotopic Standard for Chlorine (35Cl atom percent: 75.774 ± 0.028%; 37Cl atom percent: 24.226 ± 0.028%; absolute abundance ratio 35Cl/37Cl: 3.1279 ± 0.0047), available from the National Institute of Standards and Technology (NIST, USA), and ERM-AE642 Cl in water (37Cl content: 4.375 ± 0.026 10−6 mol g−1; absolute abundance ratio 35Cl/37Cl: 0.01914 ± 0.00048), available from the Institute for Reference Materials and Measurements (IRMM, Belgium). A stock standard Cl solution, 1000 mg L−1 (Merck, Germany) was also used. In all of these materials, Cl was present as NaCl.Other Cl solutions were prepared with diclofenac sodium (2-[(2,6-dichlorophenyl)amino]benzeneacetic acid sodium salt, Fluka, Switzerland), KCl, NH4Cl and HCl (Merck). High-purity water (Trace Select Ultra, Cl level lower than 1 μg kg−1, Fluka) was used for the preparation of all solutions. A stock standard Pd solution of 10 g L−1 (Merck) was diluted to 2 g L−1, and this solution was applied as the chemical modifier. A stock standard Al solution of 1000 mg L−1 (Merck) was also used to generate the AlCl molecule. A 10 g Ca L−1 solution was prepared by dissolving CaCO3 (Merck) in 5% (v/v) HNO3 (Merck), and used for an interference study. All the reagents were of analytical grade purity or higher.
Finally, two CRM samples with certified Cl levels were analyzed in this work: ION-915, natural water from Lake Superior (lot 1109), and KEJIM-02, soft water from Kejimkujik Lake (lot 0914), both available from Environment Canada (Canada). Five mineral water samples were acquired at local stores and analyzed as well.
2.3 Analysis of the samples
Samples were directly analyzed without any dilution step by means of HR CS GFMAS, using the instrumental parameters shown in Table 1. Both a calibration curve prepared with five Cl standards covering the interval 1–10 mg L−1 and isotope dilution (using a spike of 0.509 35Cl/37Cl molar ratio and a Cl content of 1.09 mmol L−1) were used for quantitation.| Electronic transition | X1Σ+ → A1Π |
| Wavelengths | 262.238 nm (Al35Cl) |
| 262.222 nm (Al37Cl) | |
| Number of detector pixels summed per line | 3 (4.65 pm) |
| Reactant/chemical modifier | Al (10 μg)/Pd (20 μg) |
| Sample volume | 10 μL |
| Temperature program | ||||
|---|---|---|---|---|
| Step | Temperature/°C | Ramp/°C s−1 | Hold/s | Ar gas flow/L min−1 |
| Drying | 90 | 3 | 20 | 2.0 |
| Drying | 110 | 5 | 20 | 2.0 |
| Pyrolysis | 500 | 300 | 25 | 2.0 |
| Vaporization | 2200 | 1500 | 5 | 0 |
| Cleaning | 2500 | 500 | 4 | 2.0 |
On the other hand, mineral water samples were also analyzed by means of ICPMS for validation purposes. The ICPMS parameters are shown in Table 2. In this case, samples were diluted using high-purity water and the calibration curve was constructed using five Cl standards that covered the interval between 100 and 1000 μg L−1. In all cases, three different sample aliquots were analyzed.
| RF power/W | 1600 |
| Plasma gas flow rate (Ar)/L min−1 | 18 |
| Nebulizer gas flow rate (Ar)/L min−1 | 1.0 |
| Auxiliary gas flow rate (Ar)/L min−1 | 1.2 |
| Scan mode | Peak hopping |
| RPq | 0.25 |
| Dwell time/ms | 150 |
| Sweeps/reading | 1 |
| Readings/replicate | 20 |
| Number of replicates | 10 |
| Nuclides monitored | 35Cl+ |
3 Results and discussion
3.1 Cl monitoring by HR CS GFMAS
The theoretical isotopic shift can be derived from the equation available in the classic book of Herzberg,38 in a similar way as described by Russo et al.,19 as shown below:
 | (1) |
The only difference with the equation used in ref. 19 is that we observed that, for the AlCl molecule and for the type of transitions investigated in our work (transitions between different vibrational levels), it is necessary to add a third term. In theory, the number of terms is infinite, but with these three terms shown above an excellent agreement between theoretical and experimental shifts can be obtained (R2 = 0.99987).
Table 3 shows this comparison. The isotopic shift of the 261.418 nm transition could not be observed because the shift is too small for the resolution provided by the instrument (every pixel covers 1.47 pm in this wavelength region). For the rest of the transitions, the difference between the theoretical and experimental shifts was always lower than 2%.
| λ /nm | λ exp/nm | v′,v′′ | Δλcalc/pm | Δλexp/pm | Relative sensitivity/% |
|---|---|---|---|---|---|
| a Data obtained from ref. 44. | |||||
| 261.44 | 261.418 | 0,0 | 1.37 | — | 100 |
| 261.70 | 261.695 | 1,1 | 4.86 | 4.8 | 62 |
| 261.82 | 261.819 | 2,2 | 9.61 | 9.6 | 30 |
| 262.24 | 262.238 | 3,3 | 16.0 | 15.6 | 26 |
| 262.70 | 262.697 | 4,4 | 24.2 | 24.3 | 16 |
| 263.22 | 263.216 | 5,5 | 34.8 | 35.3 | 7.4 |
| 263.81 | 263.807 | 6,6 | 48.0 | 48.1 | 3.2 |
| 264.49 | 264.490 | 7,7 | 64.3 | 64.5 | 1.1 |
It is important to stress that, unfortunately, the isotopic shift is inversely proportional to the sensitivity of the transition. This is probably due to the fact that the higher shifts occur for higher vibrational levels, which exhibit a lower population even at the relatively high temperature of a graphite furnace.
In order to better evaluate the potential of these transitions for isotopic analysis, a series of 2D spectra (abs. versus wavelength) were acquired for a Cl solution with a 35/37 molar ratio close to unity (except for Fig. 1B, as will be discussed below). These spectra are shown in Fig. 1. As previously discussed, Fig. 1A shows that for the 261.418 nm transition only a broad band can be detected, as the signals for the two isotopes are not resolved. This transition is the one typically selected for Cl elemental analysis.4,37 The next transition in terms of sensitivity, located at 261.695 nm, still did not show two different peaks, but it could be seen that the peak maximum shifts as a function of the isotopic composition. This aspect can be appreciated in Fig. 1B, which compares the signal obtained for a spike enriched in 37Cl with that occurring for another solution richer in 35Cl. This is similar to the situation found by Wiltsche et al. when monitoring atomic lines for B isotopic analysis.33 The next transition, 261.819 nm (Fig. 1C), already shows two different peaks, the left one corresponding to Al37Cl and the right one to Al35Cl, although they are not well resolved. That would affect the ratio finally obtained, as the tailing of the Al37Cl peak has a clear effect on the Al35Cl signal, thus resulting in a 35/37 ratio that is biased high.
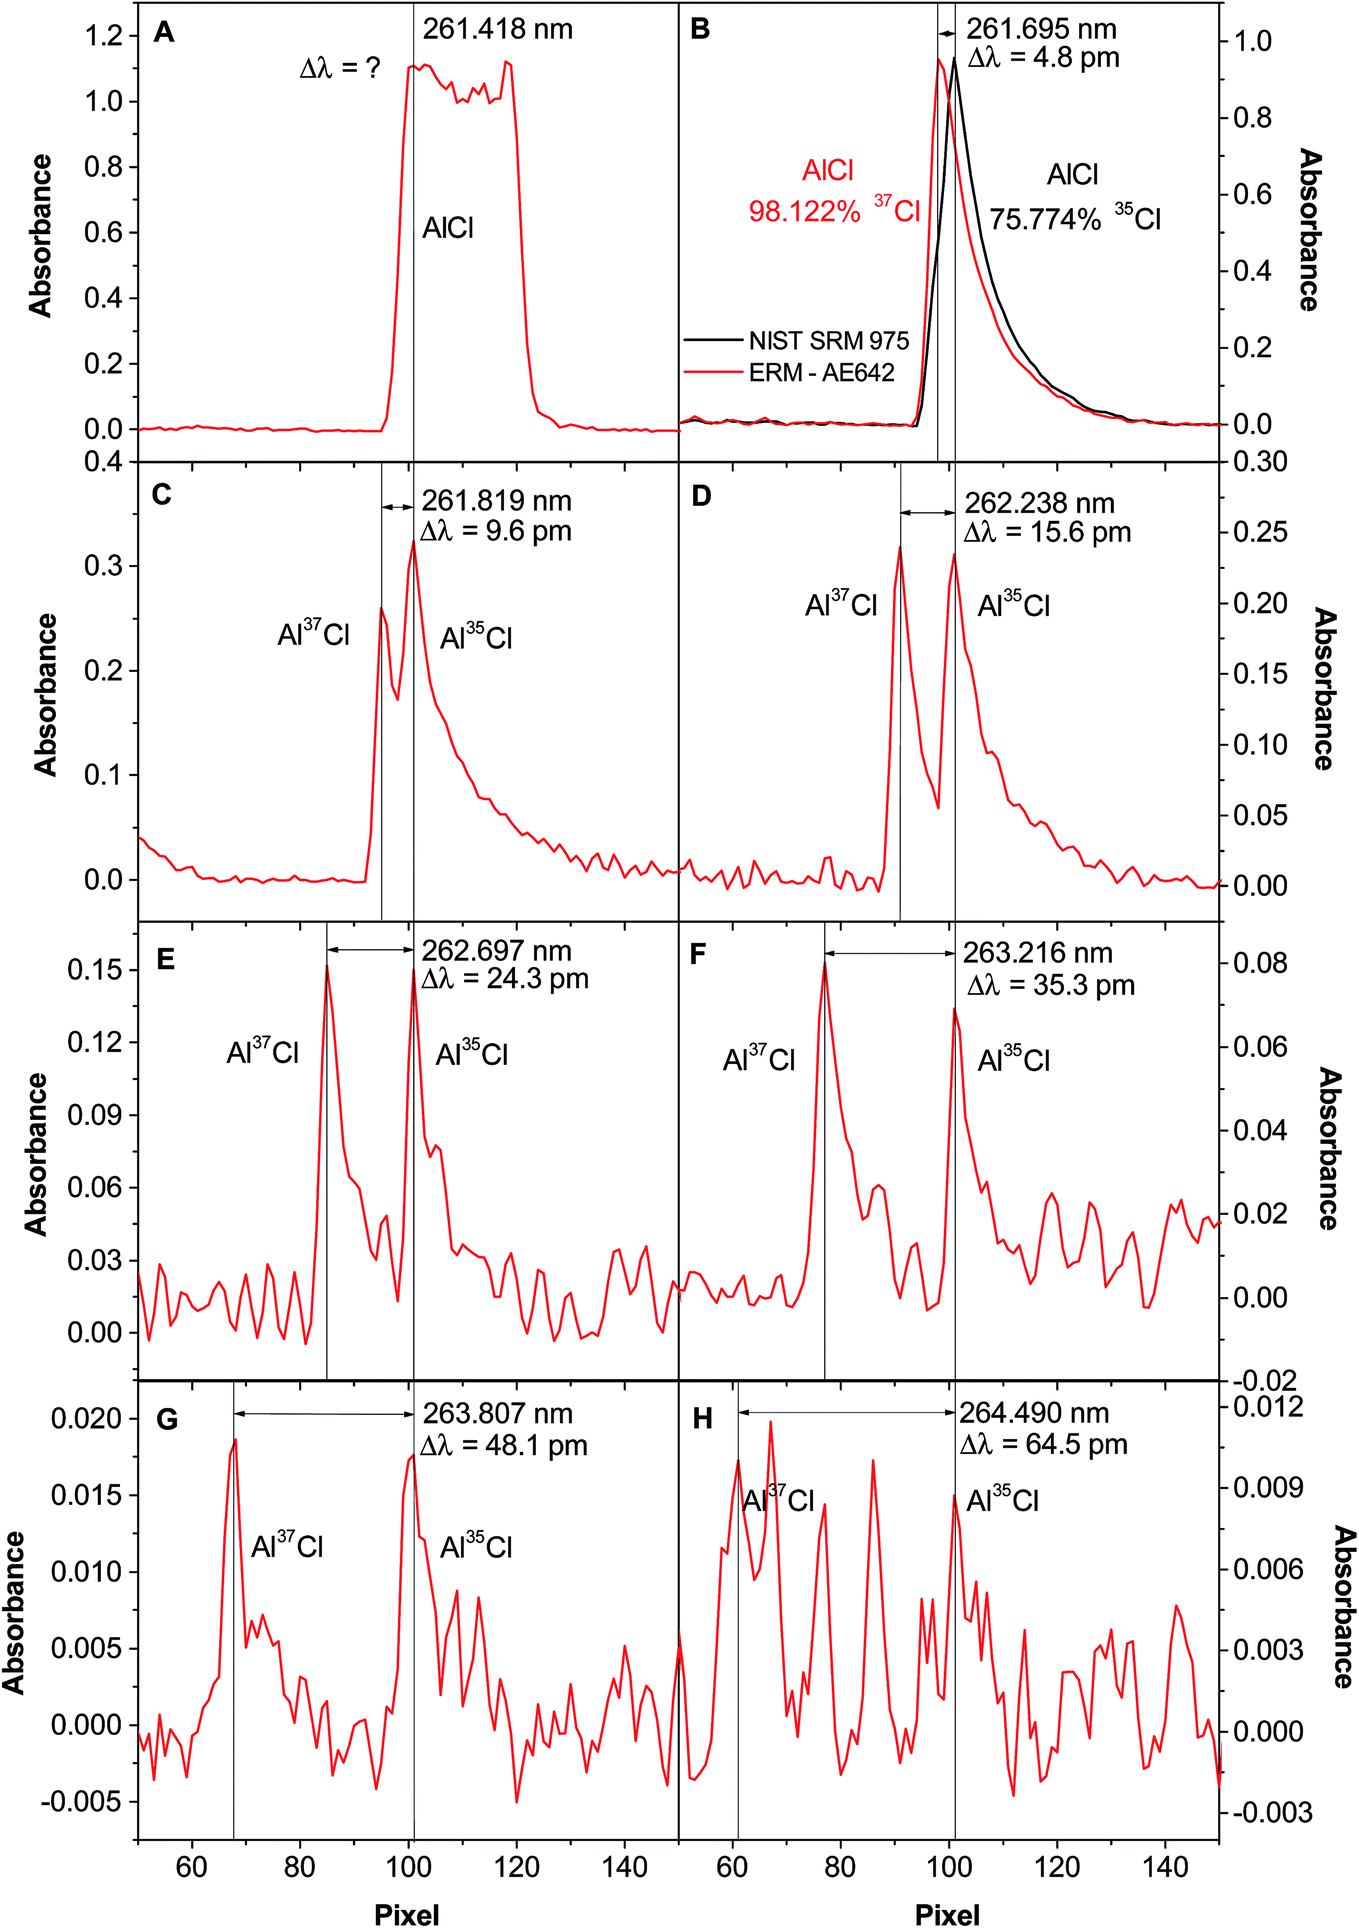 | ||
Fig. 1 Spectra of AlCl (1![[thin space (1/6-em)]](https://www.rsc.org/images/entities/char_2009.gif) :1, 35Cl/37Cl molar ratio solution) at wavelengths of: (A) 261.418 nm; (B) 261.695 nm; (C) 261.819 nm; (D) 262.238 nm; (E) 262.697 nm; (F) 263.216 nm; (G) 263.807 nm; and (H) 264.490 nm. They were obtained for 400 ng of Cl, 10 μg of Al and 20 μg of Pd. However, 1B shows two different spectra: in black, the one obtained for 400 ng of Cl of CRM NIST 975a (35Cl, 75.774%), and in red, the one obtained for 400 ng of Cl of CRM AE642 (37Cl, 98.122%). :1, 35Cl/37Cl molar ratio solution) at wavelengths of: (A) 261.418 nm; (B) 261.695 nm; (C) 261.819 nm; (D) 262.238 nm; (E) 262.697 nm; (F) 263.216 nm; (G) 263.807 nm; and (H) 264.490 nm. They were obtained for 400 ng of Cl, 10 μg of Al and 20 μg of Pd. However, 1B shows two different spectra: in black, the one obtained for 400 ng of Cl of CRM NIST 975a (35Cl, 75.774%), and in red, the one obtained for 400 ng of Cl of CRM AE642 (37Cl, 98.122%). | ||
The 261.238 nm transition (Fig. 1D) shows a better situation, as the peaks, while still not fully resolved, do not seem to overlap sufficiently to influence the ratio obtained in a significant way, since the ratio of both peaks is close to unity. This spectrum hints for the first time at the possibility of carrying out isotopic analysis by HR CS MAS with good resolution and in a straightforward manner, as the band head of each Cl isotope is separated, i.e., they act like two different molecules absorbing at different wavelengths. The situation for the next transitions (Fig. 1E–H) shows an even higher separation between the peaks, but at the cost of a decreasing signal. This can be problematic as the effect of the background structure may begin to affect the ratios obtained. Still, these transitions may be useful for higher Cl levels. For determinations at the mg L−1 level, the transition shown in Fig. 1D was considered as the most suitable and was further used throughout the work.
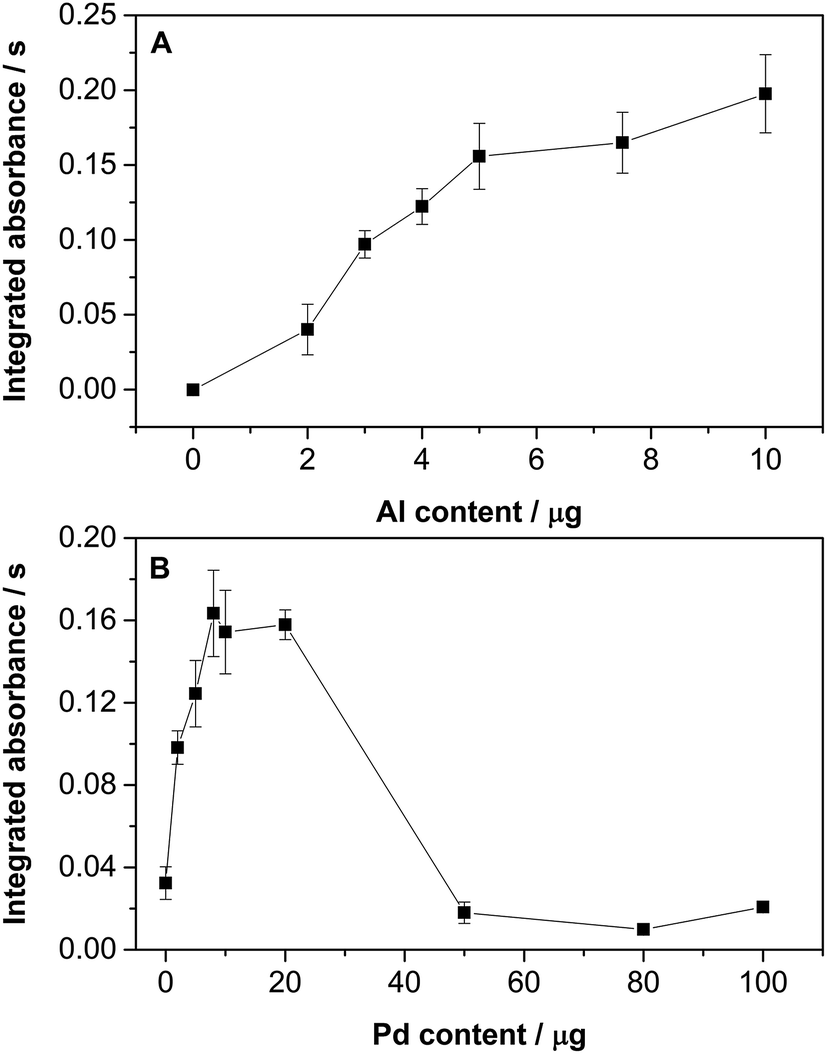 | ||
| Fig. 2 Optimization of the (A) Al and (B) Pd amount used to monitor Al35Cl by HR CS GFMAS for 200 ng of Cl at the 262.238 nm line. 20 μg of Pd were added during the Al optimization, and 10 μg of Al were added during the Pd optimization. The three central pixels were summed for quantitation. Error bars represent the standard deviation (n = 5). | ||
Only a small AlCl absorbance variation was observed for Al contents greater than 5 μg (Fig. 2A). Nonetheless, an amount of 10 μg was chosen for further studies to ensure the correct formation of the AlCl molecule. As for the Pd content (see Fig. 2B), it is clear that it has a significant influence on the AlCl signal. Low Pd levels lead to poor sensitivity, while very high contents also provide a very low signal, probably because AlCl is no longer formed in significant amounts owing to the strong Pd competition. The optimum values range from 5 to 20 μg of Pd. A value of 20 μg was chosen for further studies.
The temperature program was subsequently optimized as well (see Fig. 3). In the presence of Pd, a stable signal was obtained for a pyrolysis temperature of up to 500 °C, with good agreement between the theoretical and experimental isotopic ratios. As for the vaporization temperature, a plateau is reached for temperatures of 2100 °C or higher. The use of 2200 °C guarantees maximum sensitivity, a good peak definition while still preserving the lifetime of the graphite parts.
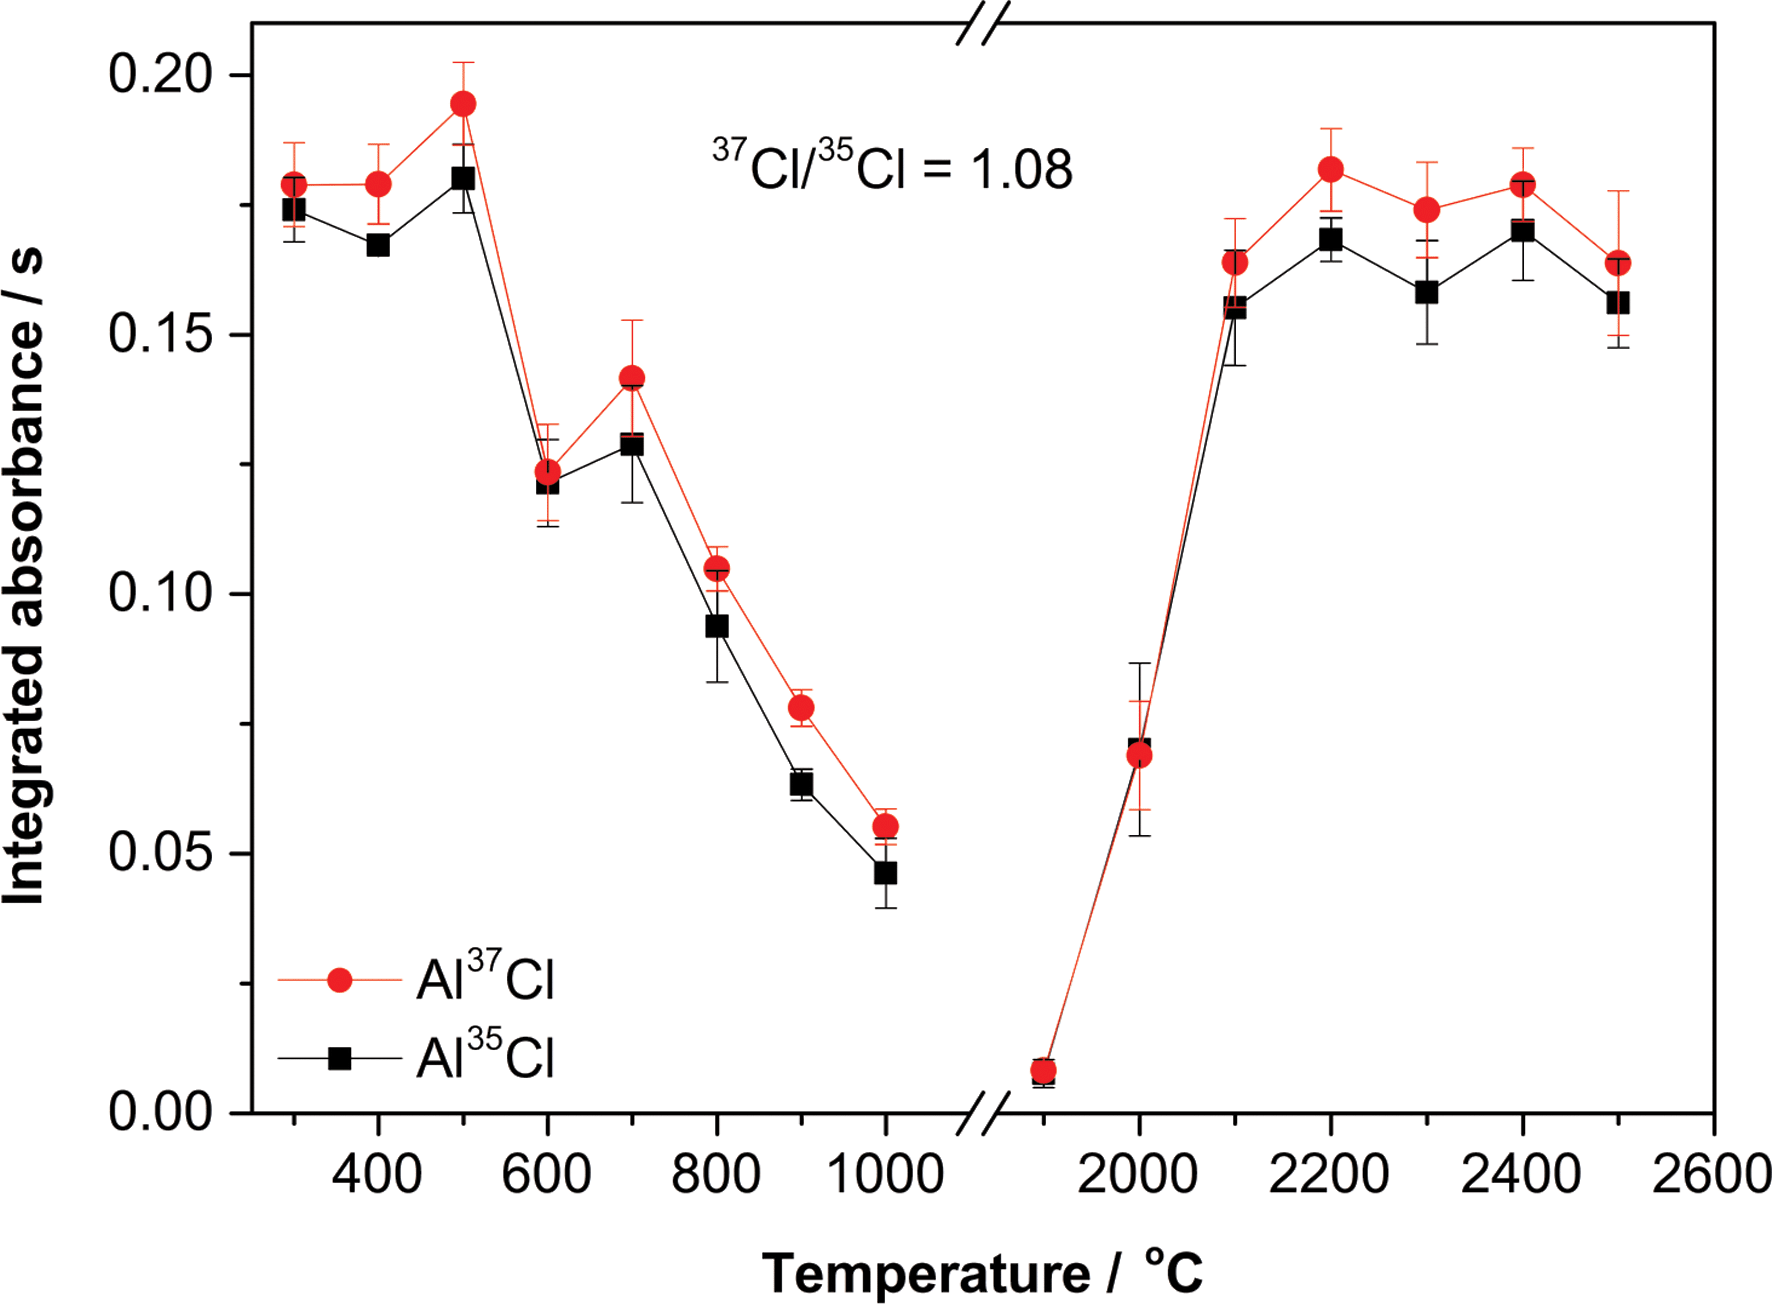 | ||
| Fig. 3 Optimization of the pyrolysis and vaporization temperatures to monitor AlCl by HR CS GFMAS for 200 ng of Cl (37Cl/35Cl molar ratio, 1.08) at the 262.222 (Al37Cl) and 262.238 (Al35Cl) nm transitions when adding 10 μg of Al and 20 μg of Pd. A pyrolysis temperature of 300 °C was set for the vaporization study, and a vaporization temperature of 2400 °C for the pyrolysis study. The three central pixels of each transition were summed for quantitation. Error bars represent the standard deviation (n = 5). | ||
Finally, the AlCl signal obtained for five very different Cl species (diclofenac sodium, HCl, KCl, NH4Cl and NaCl) under these optimum conditions was recorded. The temporal signal profiles obtained for Al35Cl are shown in Fig. 4. As can be seen, no significant difference between them was observed (variations of both the peak area and the peak height were smaller than 6%). The same conclusion was reached for the Al37Cl transition. This confirms that the method developed shows potential for the monitoring of Cl isotopes regardless of the particular form in which Cl is found in the samples.
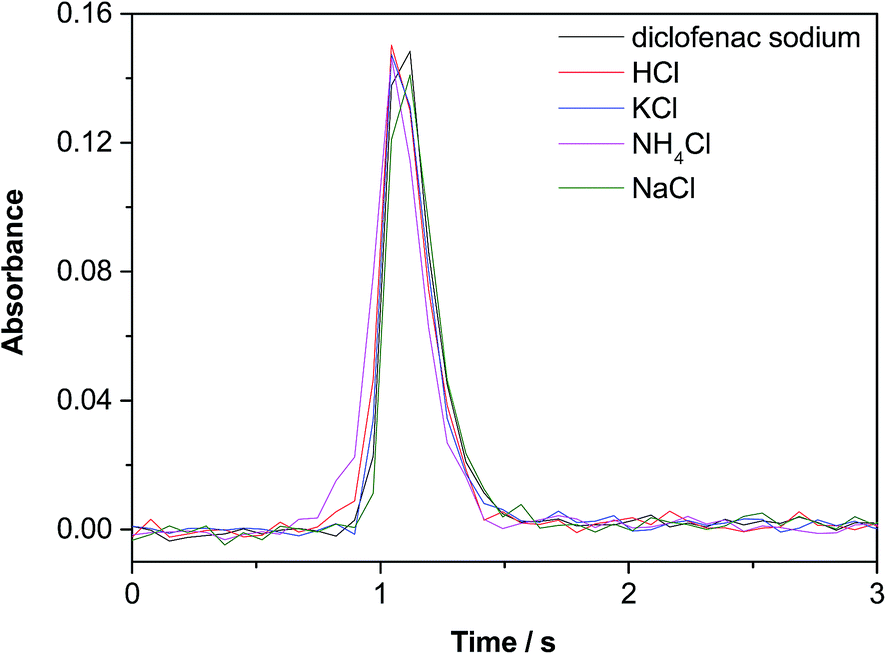 | ||
| Fig. 4 Comparison of the temporal peak profiles obtained for five different Cl species (250 ng of Cl) when monitoring the 262.238 nm Al35Cl transition. The three central detector pixels were summed to represent the profile. | ||
3.2 Quantification of the isotopic shift
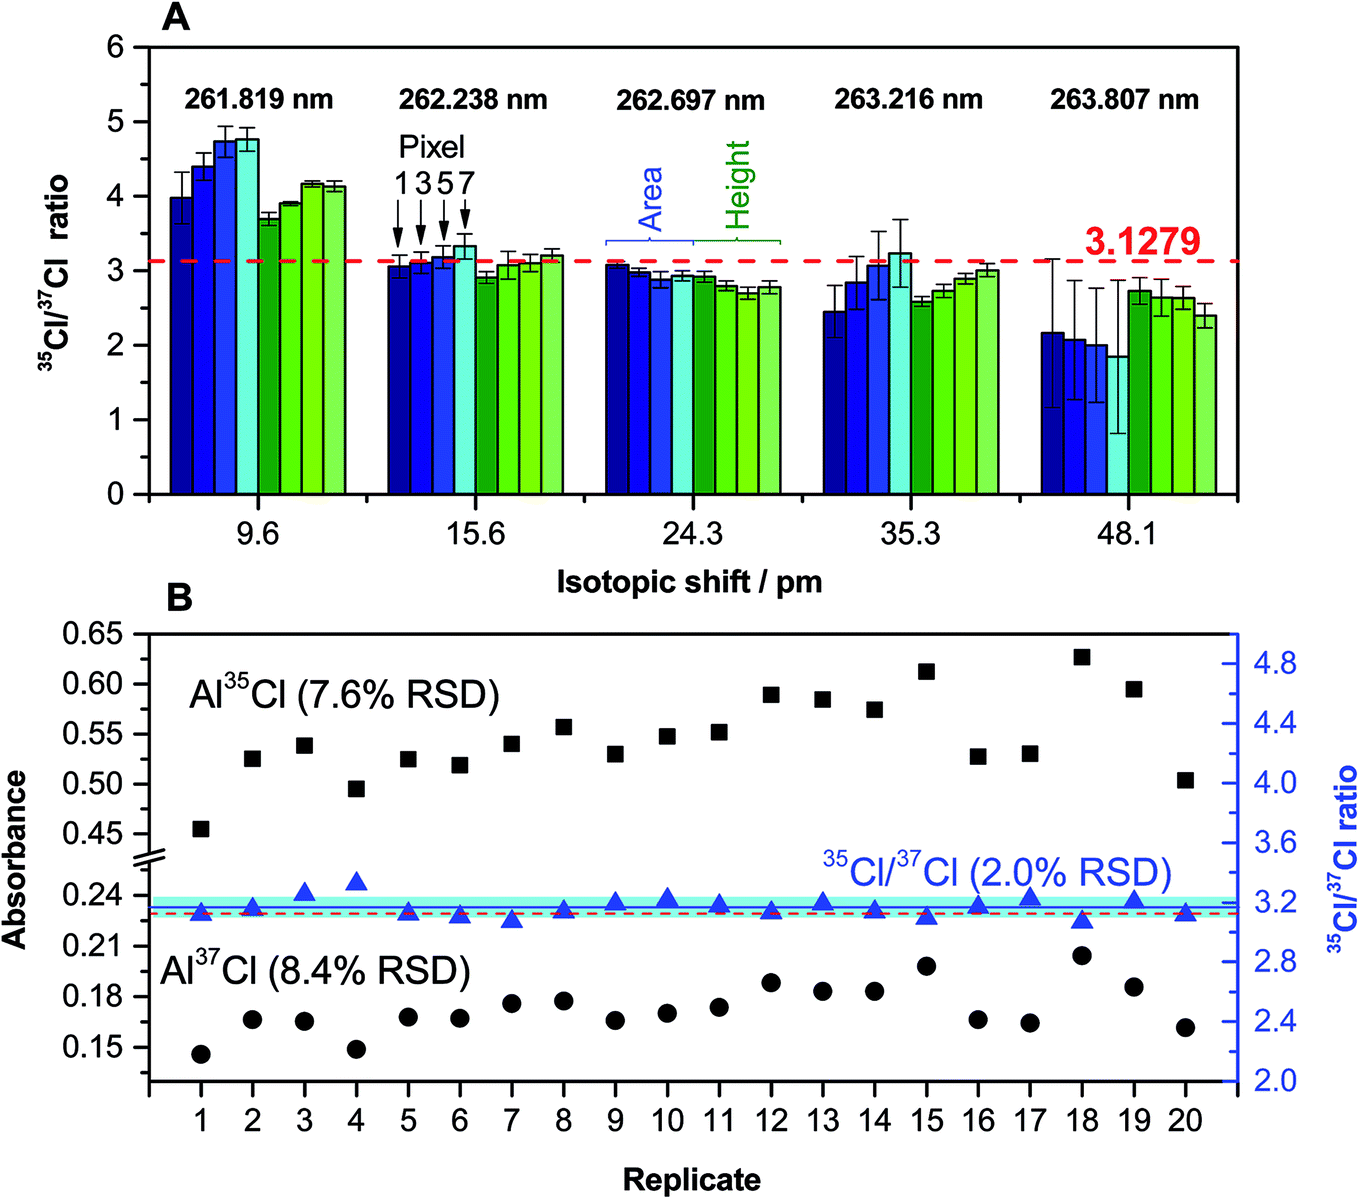 | ||
| Fig. 5 (A) Evaluation of the accuracy and precision obtained for the quantification of the Cl ratio for a solution (200 ng of Cl) of CRM NIST 975a (35/37 = 3.1279 ± 0.0047) for different AlCl transitions as a function of the way in which the signal is processed and quantified. The values in blue were obtained using the peak area, and the values in green using the peak height, while a lighter color intensity indicates a higher number of detector pixels (1, 3, 5 or 7) selected in both cases. In the case of using the peak height, the absorbance recorded by those detector pixels at the time at which the maximum peak height appears was summed. Error bars represent the standard deviation (n = 5). (B) Comparison of the variations observed for a series of 20 replicates for a solution (200 ng of Cl) of CRM NIST 975a when monitoring the individual 262.222 (Al37Cl) and 262.238 (Al35Cl) nm transitions (left y-axis) or when calculating the Cl ratio from the same set of data (right y-axis). The red dashed line represents the certified value. The blue line and the blue interval surrounding it represent the average value of the 20 replicates and its uncertainty (as the standard deviation), respectively. | ||
These results were obtained via analysis of a CRM (NIST 975a) with a certified Cl ratio that is shown in the figure (dotted line). As can be seen, the results for the first transition evaluated (around 261.82 nm) are biased high. This was expected because the two peaks for Al37Cl and Al35Cl are not well resolved in this case (see Fig. 1C). However, the difference with the certified value is lower when the peak height is selected. This difference increases with the number of detector pixels chosen for quantitation (which is logical, because the degree of peak overlap is reduced when less pixels are selected). The precision obtained is also better for the peak height.
The results obtained for the next transition (around 262.24 nm, spectrum shown in Fig. 1D) are significantly better, and they are in good agreement with the reference value using both the peak area and the peak height. This is the transition that was initially selected as most promising, and these results confirmed its selection for Cl monitoring at the mg L−1 level.
The following transitions offer results that tend to be biased low. As discussed before, the problem of such transitions is that the sensitivity decreases with every one of them and the influence of the structured background on the ratio becomes more pronounced (see Fig. 1E–G). This influence is more significant when the peak area is selected instead of the peak height, as could be anticipated. The precision, as shown by the error bars, is also significantly better when using the peak height. Therefore, overall, the use of the peak height seems to be preferable for this type of analysis, and was adopted for further work. As for the number of pixels, it seems to be a critical aspect only if the Al37Cl and Al35Cl peaks are closely located. As a general rule, a number of 3 pixels was selected (central pixel ±1), but this is a parameter that should be evaluated also depending on the analyte content for every particular situation, as higher contents may lead to peak broadening and a higher chance of spectral overlap.
The precision that can be achieved under these optimum conditions was evaluated by isotope analysis of a solution of NIST 975a with a Cl concentration of 20 mg L−1. The results obtained after 20 replicates are shown in Fig. 5B. As can be seen, the typical variation observed for a particular individual isotopic AlCl transition is rather high (approx. 8%), but when isotope ratios are calculated a much better value is obtained, as all the correlated sources of noise are compensated. In this way, a 2% RSD value can be considered as typical for Cl isotopic analysis under these conditions. This value is clearly insufficient if the goal is to monitor natural isotopic variations, which for Cl are expected to be much lower, but it may be enough for performing tracer experiments or to use isotope dilution for calibration, thus opening new possibilities for the HR CS GFMAS technique. Furthermore, it can be stressed that, unlike what occurs with most MS techniques, in which at least correction for the instrumental mass bias is required, the results demonstrate that an accurate ratio, within the uncertainty mentioned above, can be directly obtained without performing any type of correction.
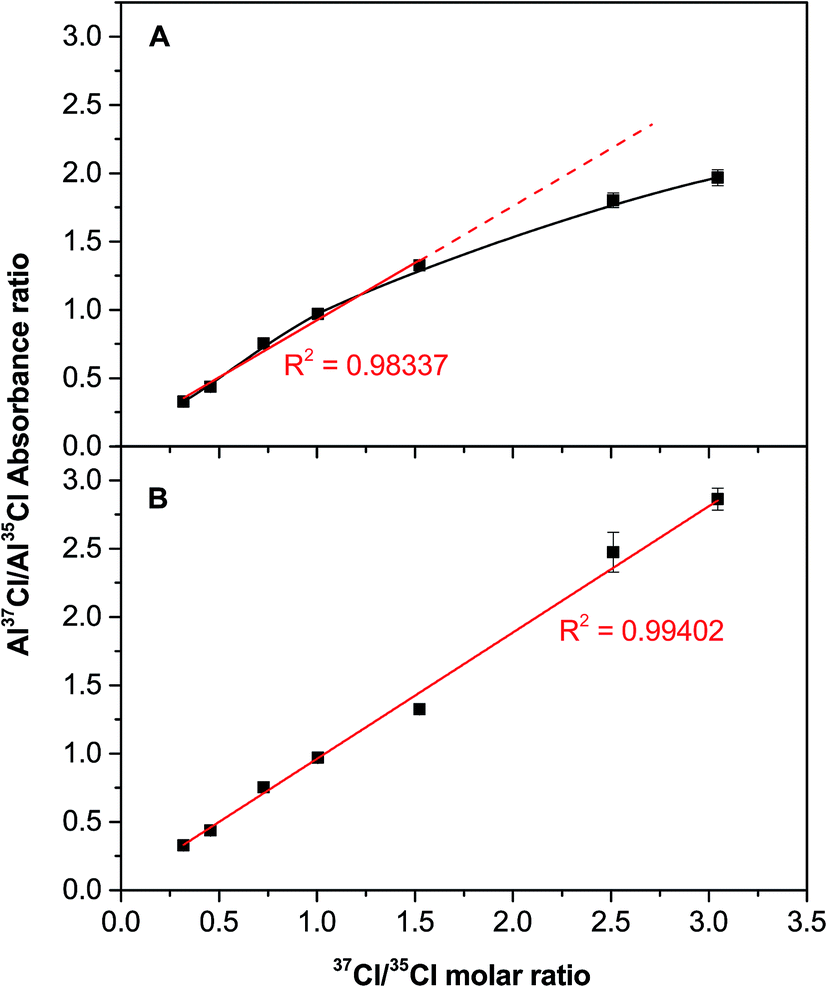 | ||
| Fig. 6 Correlation between the experimental (as obtained via HR CS GFMAS) and theoretical (as prepared by properly mixing two certified reference materials) 37Cl/35Cl ratio when monitoring the 262.222 nm (Al37Cl) and 262.238 nm (Al35Cl) transitions for solutions containing 200 ng of Cl. (A) without any mathematical deconvolution and (B) after mathematical deconvolution, as shown in Fig. 7. Error bars represent the standard deviation (n = 5). | ||
This problem could be solved using signal deconvolution. However, most deconvolution approaches are not really suitable for this particular situation, because they are based on Gaussian or Lorentzian functions, which assume symmetric peak profiles. That is clearly not the case in this work, as the peaks show a longer right tail (see Fig. 1). Thus, a different model was evaluated to circumvent this problem, following the steps shown in Fig. 7. Fig. 7A shows the initial peak profile, which shows a potential overlap of the Al37Cl tail on the Al35Cl signal. Fig. 7B shows the same data in more detail, focusing in the range between pixel 91 and pixel 150, and also showing the individual detector pixels recorded. After examining this area, those values that could be affected by the presence of the Al35Cl molecule are removed, and the rest of the data is fitted using an asymptotic regression model (Fig. 7C). Then, finally, the contribution of the Al37Cl signal can be subtracted.
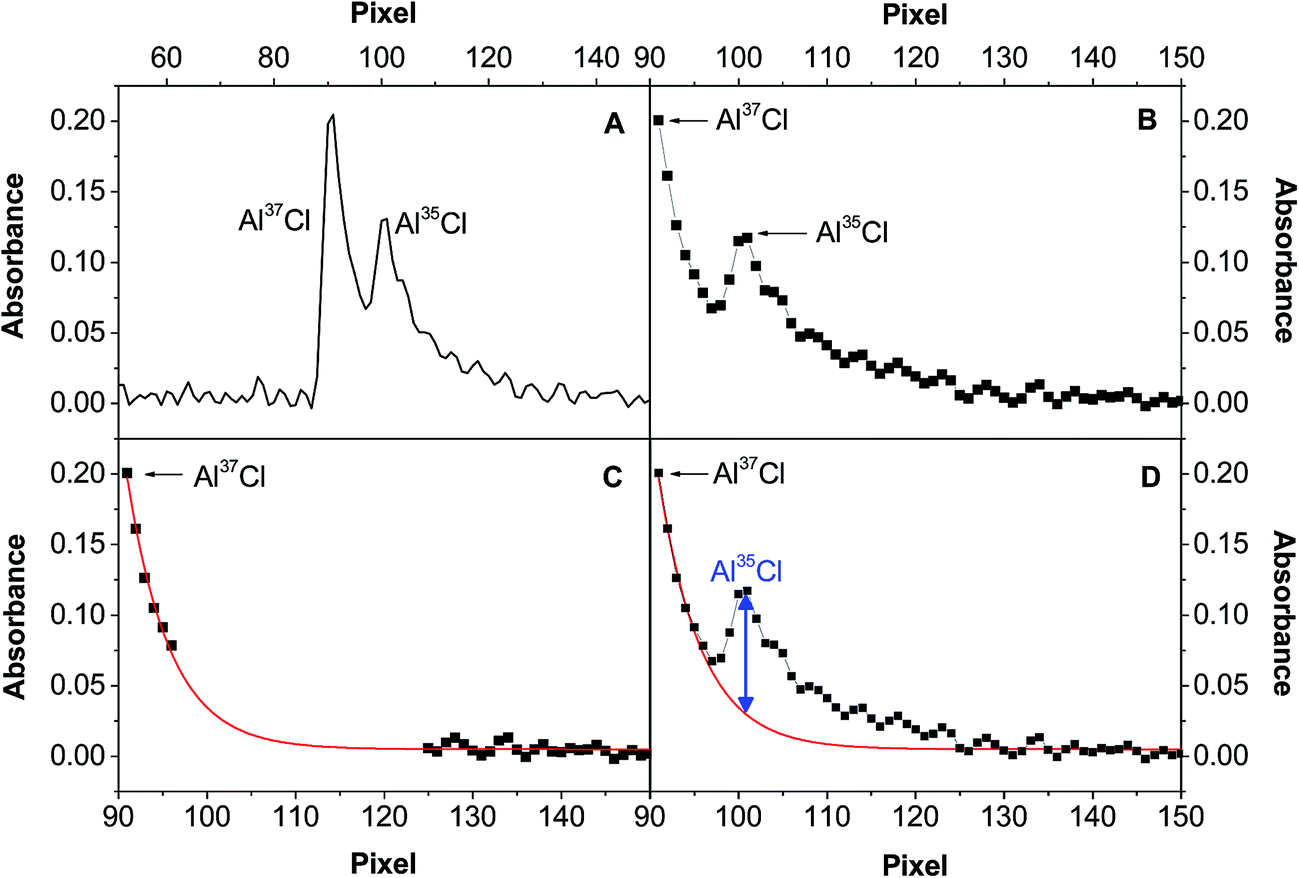 | ||
| Fig. 7 Spectral overlap correction performed at 262.238 nm for a Cl (500 ng) spike with a 37Cl/35Cl molar ratio = 2.5. (A) Raw spectrum obtained at the time that provides the peak maximum; (B) effect of the Al37Cl signal tail on the Al35Cl peak; (C) application of the asymptotic regression model (y = a − bcx) using Origin 9.1 software; (D) estimation of the actual Al35Cl peak. | ||
Fig. 6B shows the results obtained when this correction is applied to those values with a 37/35 ratio higher than 1.5. As can be seen, a good agreement between theoretical and experimental data is now obtained for the entire interval investigated. Therefore, this model can be considered as suitable for spectral overlap correction.
3.3 Ca interference
One of the main differences between HR CS GFMAS and HR CS GFAAS is that the former is more prone to suffer from chemical interferences, because the presence of other elements in the matrix may result in the formation of a molecule different from the target one at some point of the pyrolysis and/or vaporization steps. This fact can affect the absorbance finally obtained and make it difficult to develop a straightforward calibration procedure. Therefore, it is important to choose a target molecule that is stable even at high temperatures, such as the case of AlCl (bond dissociation energy, 511 kJ mol−1), to minimize this effect. However, that is not the only issue to consider, because the concentration of the competing species may also play a role. One element that is usually present at high levels in many types of samples and can interact with Cl is Ca (CaCl bond dissociation energy, 409 kJ mol−1). Thus, this potential issue was investigated in more detail for varying amounts of Ca.Fig. 8A shows that, indeed, the presence of a high amount of Ca may represent a problem. As can be seen, for low levels of Ca the signal of AlCl is hardly affected. However, for Ca/Cl molar ratios higher than 2, the AlCl signal tends to rise. Even though ultimately the AlCl molecule is formed (which is logical because it is more stable and there is more Al available – 10 μg – than Ca), Ca seems to act like a chemical modifier,42 helping in forming AlCl with more efficiency. However, for Ca/Cl ratios higher than 90 the signal for AlCl begins to decrease, until it reaches a point where AlCl is practically not formed owing to the higher availability of Ca atoms.
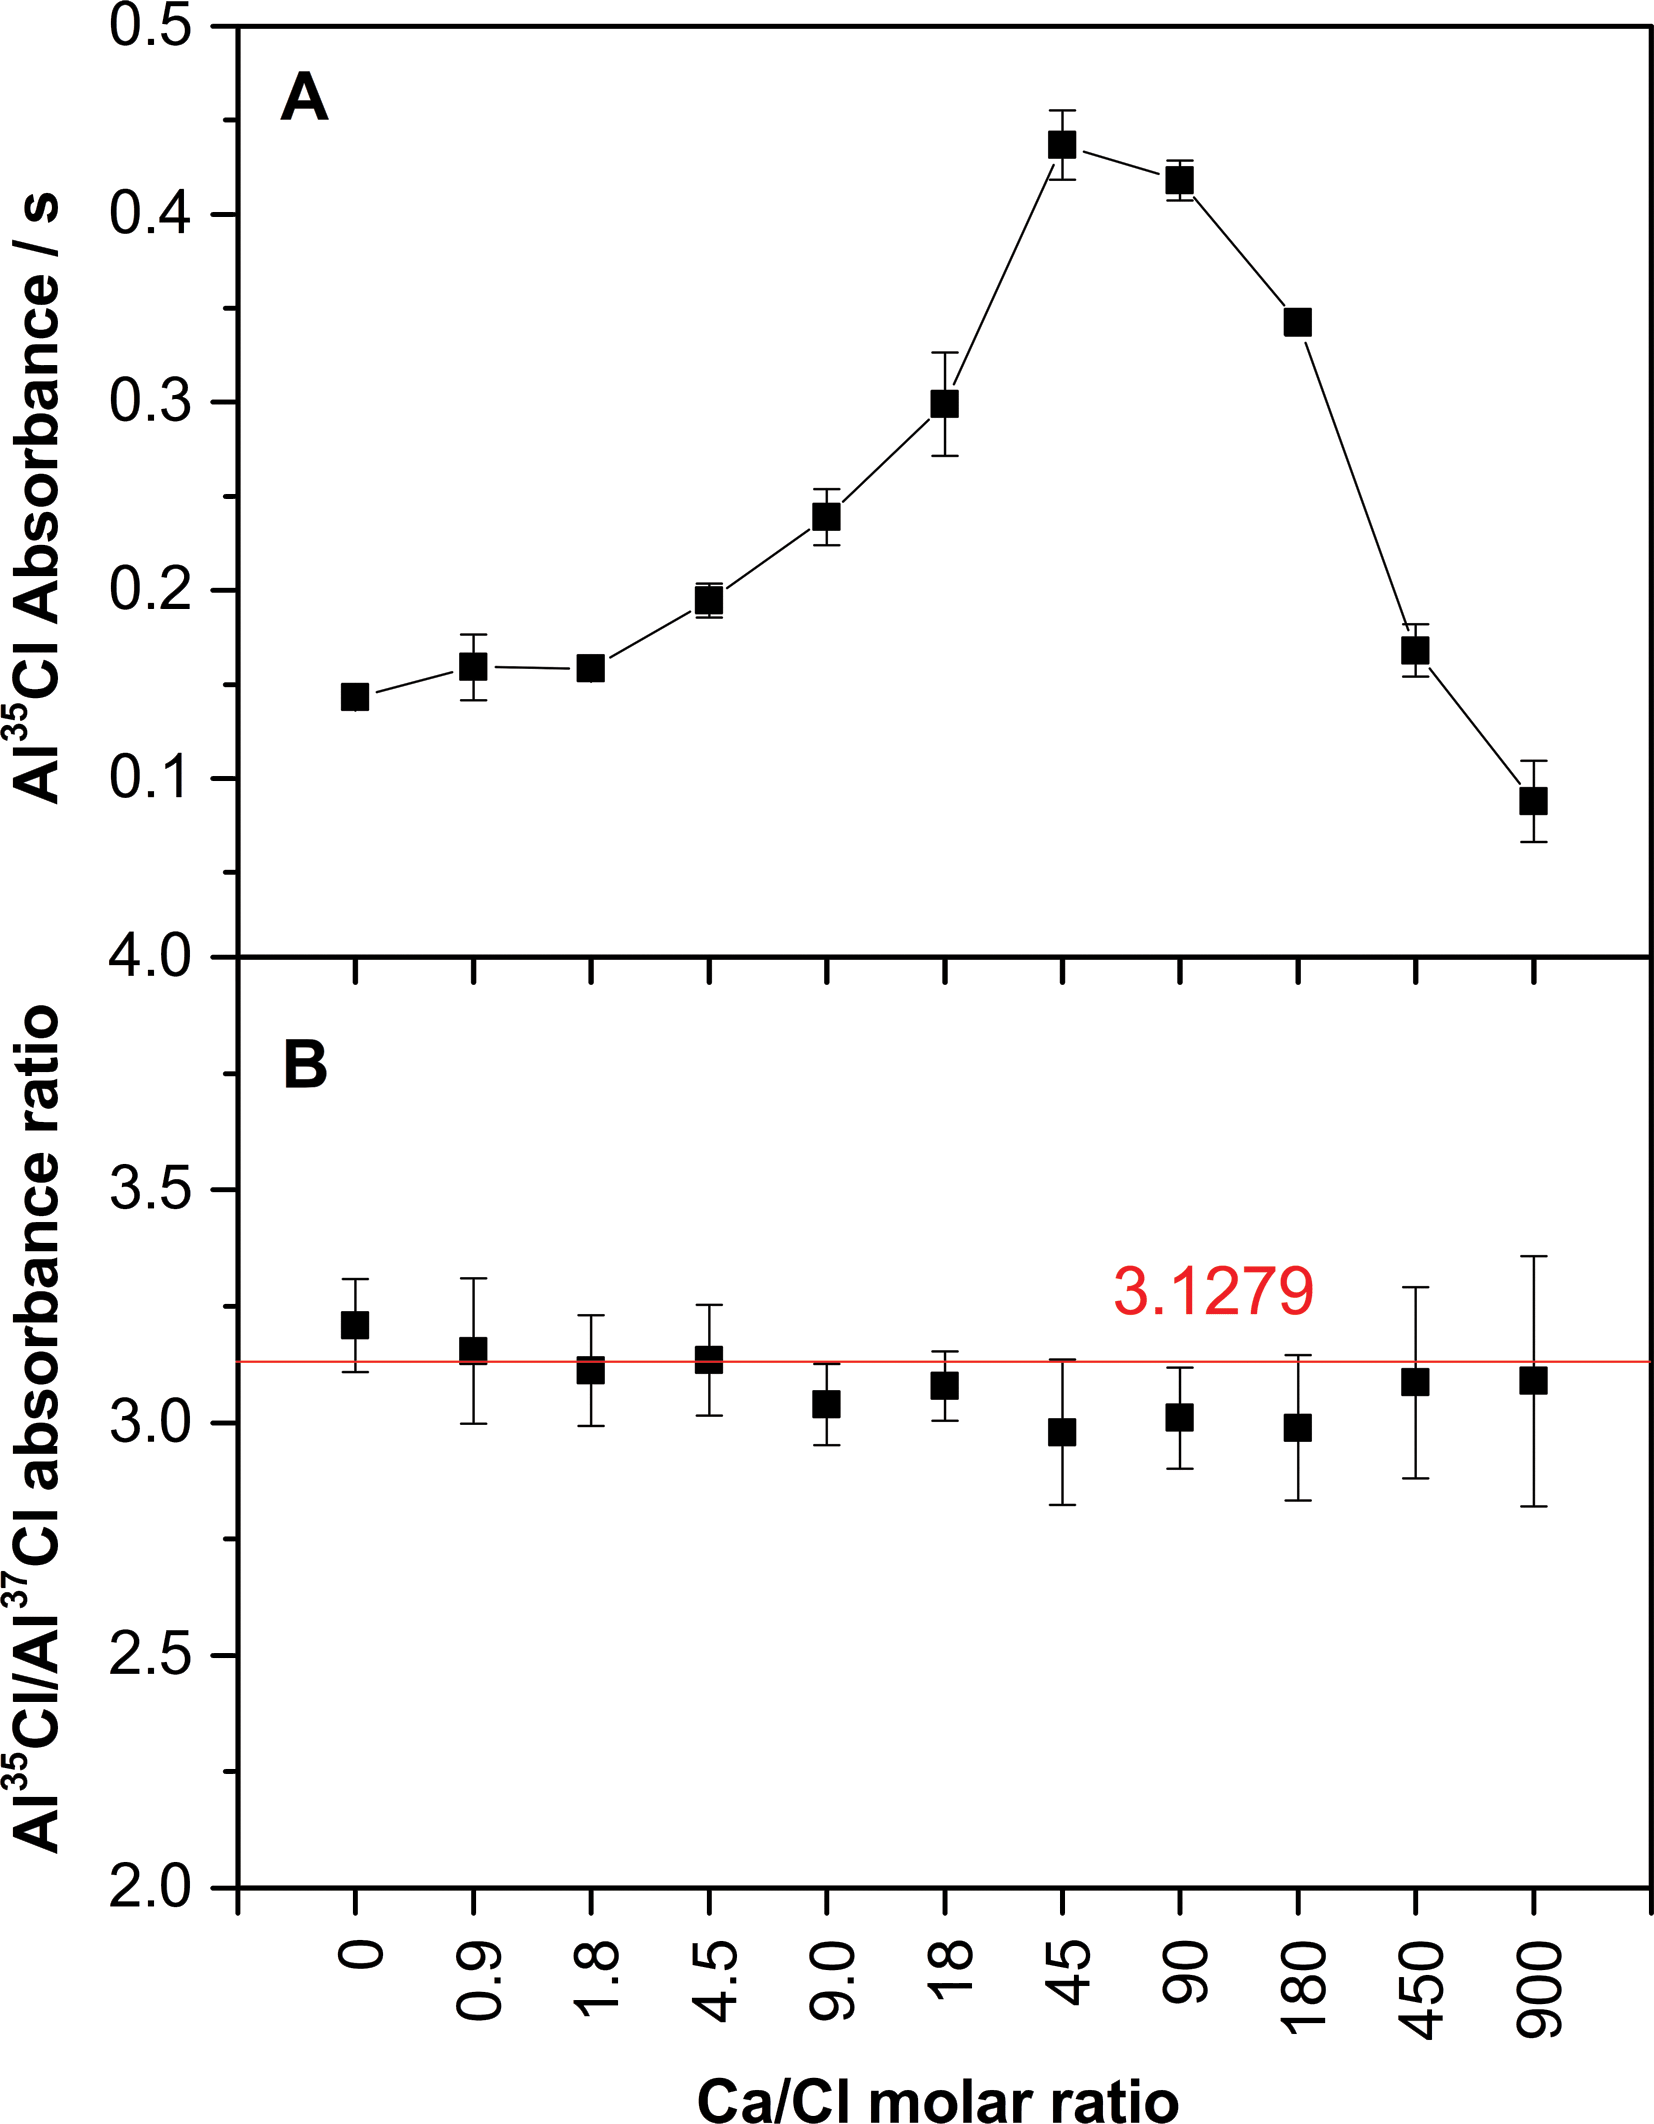 | ||
| Fig. 8 Study of the Ca interference. (A) Al35Cl absorbance signal, as recorded at 262.238 nm, and (B) Al35Cl/Al37Cl absorbance ratio as a function of the Ca content, for solutions containing 100 ng of Cl, 10 μg of Al and 20 μg of Pd. Error bars represent 2 s (n = 5). | ||
While it could be interesting to further investigate on the vaporization mechanism of AlCl in the presence of Ca and Pd, such aspect is out of the scope of the present work. What is relevant here is to stress that the presence of a high but unknown amount of Ca in the sample will make it very difficult to obtain accurate results when constructing the calibration curve with aqueous standards, as this element will have a clear impact on the AlCl absorbance finally obtained.
Isotope analysis brings a new possibility to circumvent this kind of problem, which so far has been limited to MS techniques. Instead of using the cumbersome standard addition method, or matrix-matched standards, the use of isotope dilution (ID) can help in successfully overcoming this type of interference. In fact, Fig. 8B shows that, despite the high fluctuations observed for the individual AlCl signal for varying amounts of Ca, the value obtained for the Al35Cl/Al37Cl ratio remains very stable, which clearly indicates that ID may provide satisfactory results in this case.
3.4 Cl determination in water using ID for calibration
To explore the robustness of an ID method in comparison with a conventional calibration strategy, two different natural water CRMs (ION-915 and KEJIM-02) were selected for analysis. For the latter approach, a calibration curve was prepared with 5 points ranging from 1 to 10 mg L−1. The calibration curve showed a R2 coefficient of 0.9998, a limit of detection (LOD) of 0.30 mg L−1 and a limit of quantification (LOQ) of 1.0 mg L−1. The results obtained for the samples are shown in Table 4. As can be seen, a result that is in good agreement with the Cl certified value was obtained for KEJIM-02, but the same was not true for the other sample, ION-915, for which a result biased high was found. This fact could be explained considering the Ca/Cl content of the samples, which is much higher in the case of ION-915 (13.7 mg L−1 Ca) than that of KEJIM-02 (0.852 mg L−1 Ca), thus likely influencing the absolute AlCl absorbance signal, as demonstrated in the previous section.| Sample | Cl concentration/mg L−1 | ||
|---|---|---|---|
| Certified | HR CS GFMAS | ID-HR CS GFMAS | |
| ION-915 | 1.42 ± 0.02 | 2.04 ± 0.15 | 1.49 ± 0.08 |
| KEJIM-02 | 5.79 ± 0.41 | 5.72 ± 0.77 | 5.78 ± 0.07 |
Alternatively, the same samples were also analyzed using the conditions shown in Table 1 and ID for calibration, as described in Section 2.3. The calculations for the ID technique and for the estimation of the LOD are discussed elsewhere.43 The LOD was estimated to be of 0.25 mg L−1. As also shown in Table 4, the concentrations found by means of ID for both samples were in good agreement with the certified values, proving that this calibration technique can circumvent the interference detected in a simple way.
To further test the robustness of the ID approach, five commercial mineral water samples covering a wide range of Cl levels were also subjected to analysis. The results obtained are shown in Table 5. As can be seen, an excellent agreement with the expected values (as indicated by the producer in the label) was always attained. No difference could be drawn by means of the t-Student test (95% confidence interval). The results obtained by means of ICPMS are also provided as a means of further validation.
| Sample | Cl concentration/mg L−1 | ||
|---|---|---|---|
| Label | ID-HR CS GFMAS | ICPMS | |
| Veri | 1.9 | 1.99 ± 0.15 | 1.87 ± 0.07 |
| Fonter | 5.1 | 5.27 ± 0.35 | 5.06 ± 0.38 |
| Solán de Cabras | 7.4 | 7.33 ± 0.30 | 7.17 ± 0.30 |
| Aquarel Abetos | 8.5 | 8.52 ± 0.17 | 8.08 ± 0.52 |
| Fontecabras | 49.5 | 49.9 ± 2.5 | 54.5 ± 2.8 |
4 Conclusion
This work explores for the first time the potential of HR CS GFMAS for isotope analysis, focusing on Cl monitoring after the formation of the AlCl molecule. The results obtained confirm that, by monitoring molecular instead of atomic spectra, it is possible to observe an isotopic shift that is large enough to appreciate two different peaks, each one corresponding to an isotope, which are sufficiently resolved to allow their quantification, regardless of the chemical form in which Cl is present in the sample.The method developed, based on the addition of Pd and Al, and the monitoring of peak height values, enables the isotopic analysis of Cl at the mg L−1 level with precision values around 2% RSD, not requiring any method for mass bias correction. However, if a spike with a high 37/35 ratio is to be monitored and a spectral overlap is detected, it is necessary to perform a deconvolution to correct for this interference.
Furthermore, it was demonstrated that using ID for calibration is feasible in this context and provides a novel – so far only used by MS techniques – and a very powerful strategy to determine Cl in samples in which otherwise chemical interferences are detected, as demonstrated for water analysis.
Acknowledgements
This work has been funded by the Spanish Ministry of Economy and Competitiveness (project CTQ2012-33494) and the Aragón Government (Fondo Social Europeo). The authors are also grateful to Capes/PDSE for the mobility grant under process BEX 4250/14-1.References
- R. B. Evans, Lung, 2004, 183, 151–167 CrossRef PubMed.
- M. D. Huang, H. Becker-Ross, S. Florek, U. Heitmann and M. Okruss, Spectrochim. Acta, Part B, 2006, 61, 959–964 CrossRef PubMed.
- A. Doyle, A. Saavedra, M. L. B. Tristão, L. A. N. Mendes and R. Q. Aucélio, Spectrochim. Acta, Part B, 2013, 86, 102–107 CrossRef CAS PubMed.
- M. Fechetia, A. L. Tognon and M. A. M. S. da Veiga, Spectrochim. Acta, Part B, 2012, 71–72, 98–101 CrossRef CAS PubMed.
- J. S. de Gois, É. R. Pereira, B. Welz and D. L. G. Borges, Spectrochim. Acta, Part B, 2015, 105, 12–17 CrossRef CAS PubMed.
- M. U. Rahim, X. Gao and H. Wu, Fuel, 2014, 129, 314–317 CrossRef CAS PubMed.
- T. A. Labutin, A. M. Popov, S. M. Zaytsev, N. B. Zorov, M. V. Belkov, V. V. Kiris and S. N. Raikov, Spectrochim. Acta, Part B, 2014, 99, 94–100 CrossRef CAS PubMed.
- P. A. Mello, J. S. Barin, F. A. Duarte, C. A. Bizzi, L. O. Diehl, E. I. Muller and E. M. M. Flores, Anal. Bioanal. Chem., 2013, 405, 7615–7642 CrossRef CAS PubMed.
- É. R. Pereira, B. Welz, A. H. D. Lopez, J. S. de Gois, G. F. Caramori, D. L. G. Borges, E. Carasek and J. B. de Andrade, Spectrochim. Acta, Part B, 2014, 102, 1–6 CrossRef PubMed.
- Handbook of Environmental Isotope Geochemistry, ed. M. Baskaran, Springer-Verlag, Berlin-Heidelberg, 2012 Search PubMed.
- N. C. Sturchio, J. K. Böhlke, A. D. Beloso Jr, S. H. Streger, L. J. Heraty and P. B. Hatzinger, Environ. Sci. Technol., 2007, 41, 2796–2802 CrossRef CAS.
- A. Sun, Q. Xu, S. Xu, H. Shen, J. Sun and Y. Zhang, Chem. Geol., 2014, 381, 21–25 CrossRef CAS PubMed.
- C. Luo, Y. Xiao, H. Wen, H. Ma, Y. Ma, Y. Zhang, Y. Zhang and M. He, Appl. Geochem., 2014, 47, 141–149 CrossRef CAS PubMed.
- J. Fietzke, M. Frische, T. H. Hansteen and A. Eisenhauer, J. Anal. At. Spectrom., 2008, 23, 769–772 RSC.
- Y. Zakon, L. Halicz and F. Gelman, Anal. Chem., 2014, 86, 6495–6500 CrossRef CAS PubMed.
- C. Wiegert, M. Mandalakis, T. Knowles, P. N. Polymenakou, C. Aeppli, J. Macháčková, H. Holmstrand, R. P. Evershed, R. D. Pancost and Ö. Gustafsson, Environ. Sci. Technol., 2013, 47, 6449–6456 CAS.
- M. Wu, Y. Qian, J. M. Boyd, S. E. Hrudey, X. C. Le and X.-F. Li, J. Chromatogr. A, 2014, 1359, 156–161 CrossRef CAS PubMed.
- Isotopic Analysis: Fundamentals and Applications Using ICP-MS, ed. F. Vanhaecke and P. Degryse, Wiley-VCH, Weinheim, 2012 Search PubMed.
- R. E. Russo, A. A. Bol'shakov, X. Mao, C. P. McKay, D. L. Perry and O. Sorkhabi, Spectrochim. Acta, Part B, 2011, 66, 99–104 CrossRef PubMed.
- R. E. Russo, X. Mao, J. J. Gonzalez, V. Zorba and J. Yoo, Anal. Chem., 2013, 85, 6162–6177 CrossRef CAS PubMed.
- X. Mao, A. A. Bol'shakov, D. L. Perry, O. Sorkhabi and R. E. Russo, Spectrochim. Acta, Part B, 2011, 66, 604–609 CrossRef CAS PubMed.
- A. Sarkar, X. Mao and R. E. Russo, Spectrochim. Acta, Part B, 2014, 92, 42–50 CrossRef CAS PubMed.
- M. Dong, X. Mao, J. J. Gonzalez, J. Lu and R. E. Russo, Anal. Chem., 2013, 85, 2899–2906 CrossRef CAS PubMed.
- A. Sarkar, X. Mao, G. C. Y. Chan and R. E. Russo, Spectrochim. Acta, Part B, 2013, 88, 46–53 CrossRef CAS PubMed.
- X. Mao, A. A. Bol'shakov, I. Choi, C. P. McKay, D. L. Perry, O. Sorkhabi and R. E. Russo, Spectrochim. Acta, Part B, 2011, 66, 767–775 CrossRef CAS PubMed.
- B. Welz, H. Becker-Ross, S. Florek and U. Heitmann, High-Resolution Continuum Source AAS. The Better Way to Do Atomic Absorption Spectrometry, Wiley-VCH, Weinheim, 2005 Search PubMed.
- M. Resano, F. Vanhaecke and M. T. C. de Loos-Vollebregt, J. Anal. At. Spectrom., 2008, 23, 1450–1475 RSC.
- B. Welz, S. Morés, E. Carasek, M. G. R. Vale, M. Okruss and H. Becker-Ross, Appl. Spectrosc. Rev., 2010, 45, 327–354 CrossRef CAS.
- M. Resano and E. García-Ruiz, Anal. Bioanal. Chem., 2011, 399, 323–330 CrossRef CAS PubMed.
- M. Resano, M. R. Flórez and E. García-Ruiz, Spectrochim. Acta, Part B, 2013, 88, 85–97 CrossRef CAS PubMed.
- B. Welz, M. G. R. Vale, É. R. Pereira, I. N. B. Castilho and M. B. Dessuy, J. Braz. Chem. Soc., 2014, 25, 799–821 CAS.
- M. Resano, M. Aramendía and M. A. Belarra, J. Anal. At. Spectrom., 2014, 29, 2229–2250 RSC.
- H. Wiltsche, K. Prattes, M. Zischka and G. Knapp, Spectrochim. Acta, Part B, 2009, 64, 341–346 CrossRef PubMed.
- B. Welz, F. G. Lepri, R. G. O. Araujo, S. L. C. Ferreira, M. D. Huang, M. Okruss and H. Becker-Ross, Anal. Chim. Acta, 2009, 647, 137–148 CrossRef CAS PubMed.
- D. J. Butcher, Anal. Chim. Acta, 2013, 804, 1–15 CrossRef CAS PubMed.
- M. Resano, M. R. Flórez and E. García-Ruiz, Anal. Bioanal. Chem., 2014, 406, 2239–2259 CrossRef CAS PubMed.
- U. Heitmann, H. Becker-Ross, S. Florek, M. D. Huang and M. Okruss, J. Anal. At. Spectrom., 2006, 21, 1314–1320 RSC.
- G. Herzberg, Molecular Spectra and Molecule Structure. I. Spectra of Diatomic Molecules, D. Van Nostrand, 2nd edn, New York, 1950 Search PubMed.
- U. Heitmann, B. Welz, D. L. G. Borges and F. G. Lepri, Spectrochim. Acta, Part B, 2007, 62, 1222–1230 CrossRef PubMed.
- M. Resano, J. Briceño and M. A. Belarra, Spectrochim. Acta, Part B, 2009, 64, 520–529 CrossRef PubMed.
- J. Briceño, M. A. Belarra, K. A. C. de Schamphelaere, S. Vanblaere, C. R. Janssen, F. Vanhaecke and M. Resano, J. Anal. At. Spectrom., 2010, 25, 503–510 RSC.
- R. Nowka, K. Eichardt and B. Welz, Spectrochim. Acta, Part B, 2000, 55, 517–524 CrossRef.
- M. Resano, M. Aramendía and F. Vanhaecke, J. Anal. At. Spectrom., 2006, 21, 1036–1044 RSC.
- R. W. B. Pearse and A. G. Gaydon, The Identification of Molecular Spectra, Chapman & Hall, 3rd edn, London, 1963 Search PubMed.
| This journal is © The Royal Society of Chemistry 2015 |