 Open Access Article
Creative Commons Attribution 3.0 Unported Licence
A transient signal acquisition and processing method for micro-droplet injection system inductively coupled plasma mass spectrometry (M-DIS-ICP-MS)
Takahiro
Iwai†
a,
Kaori
Shigeta
b,
Mari
Aida
c,
Yukiko
Ishihara
c,
Hidekazu
Miyahara
c and
Akitoshi
Okino
*c
aThird Department of Forensic Science, National Research Institute of Police Science, 6-3-1, Kashiwanoha, Kashiwa, Chiba 277-0882, Japan
bResearch Institute for Environmental Management Technology, National Institute of Advanced Industrial Science and Technology (AIST), 16-1 Onogawa, Tsukuba, Ibaraki 305-8569, Japan
cDepartment of Energy Sciences, Tokyo Institute of Technology, J2-32, 4259 Nagatsuta, Midori-ku, Yokohama 226-8502, Japan. E-mail: aokino@es.titech.ac.jp; Fax: +81-45-924-5689; Tel: +81-45-924-5689
First published on 23rd April 2015
Abstract
An optimal signal acquisition and processing method for use with intermittent small-sized sample introduction techniques, such as the micro-droplet injection system (M-DIS), was investigated. This type of system is expected to play an important role in environmental and medical fields by enabling analysis of single cells or nanoparticles. A model signal was formed based on an analog signal that was acquired using an inductively coupled plasma mass spectrometer coupled to the M-DIS. Using this model signal, signal-to-noise ratios (SNRs) were evaluated in the cases where the sampling interval and the integration time of the detector were equal, where the analog signal from the detector was acquired using an analog recorder, and where the analog signal from the detector was acquired digitally using a digital oscilloscope. The behavior indicated by the simulation results was different in each case and gave optimal filter time constants of approximately 1.40, 0.99 and 1.36 times the full width at half maximum value, respectively. The characteristics of the three cases were discussed based on their SNRs, and it was found that the highest SNR for the transient signal would be obtained when the analog signal was acquired digitally using a high sampling frequency and a digital filter with an optimal time constant (288 μs in this study). In this case, the sodium limit of detection of 85 ag was obtained using a raw droplet signal when the sampling frequency was 107 Hz and the moving average time constant was 288 μs.
Introduction
In recent years, high-sensitivity and multi-elemental analytical methods that use inductively coupled plasma (ICP), such as ICP atomic emission spectrometry (ICP-AES) and ICP mass spectrometry (ICP-MS), have been used for trace elemental analysis.1,2 In analytical devices that use ICP, the technique used to introduce the sample into the plasma is important, because the analytical sensitivity is strongly affected by the efficiency of the sample excitation and ion generation processes.1 Various sample introduction techniques have therefore been developed and applied for each analytical method. Nebulization is conventionally used for aqueous solution introduction3 because it enables high-precision and high-sensitivity (sub-ppt) analysis. However, relatively large quantities of the sample solution (e.g., a few 100 μL min−1) are continuously introduced into the plasma and this makes it difficult to analyze small quantities of elements (of the order of ag) contained in the sample solution. However, the need for trace elements analysis of minute sample quantities is increasing, and intermittent methods for small-sized sample introduction into plasmas for nanoparticle or single cell analysis have drawn increased research attention. A conceptual diagram of the intermittent sample introduction process is shown in Fig. 1. During the intermittent sample introduction, the sample is both temporally and spatially compressed (red line), and the peak signal value increases in comparison to that obtained with continuous sample introduction methods (blue line), even though the total signal is identical. The signal peak exceeds the background noise and thus can be detected. The laser ablation method, in which a minute quantity of a solid sample is ablated by a high-power pulsed laser and the resulting sample is then introduced into the analytical device, is one example of an intermittent sample introduction technique. This technique is often applied to elemental mapping of small solid samples.4,5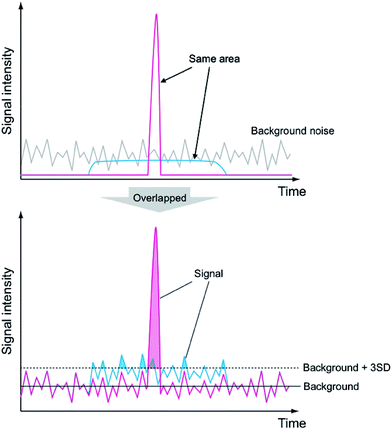 | ||
| Fig. 1 Comparison of transient signal and continuous signal when the total sample signal and the background noise level are the same. | ||
In our laboratory, a monodisperse droplet sample introduction system called the micro-droplet injection system (M-DIS) has been developed and applied to ICP-MS (M-DIS-ICP-MS).6–10 In this system, an ultrasmall single droplet (minimum volume of 14 pL and maximum volume of 180 pL) contains minute samples that can be introduced into the plasma individually. This system is expected to play an important role in environmental and medical applications for trace elemental analysis of ultrasmall individual samples, such as single cells or single nanoparticles. Many other groups have therefore actively researched trace elemental analysis using droplet sample introduction systems that operate in modes similar to our proposed mode.11–17
However, problems occur with the signal processing method if these intermittent sample introduction techniques are simply applied to conventional analytical devices. In a continuous sample introduction method, such as liquid sample nebulization, the signal-to-noise ratio (SNR) is theoretically improved by a longer signal integration process. In contrast, the SNR decreases in intermittent sample introduction techniques if the integration time is too long. Therefore, an appropriate integration time and appropriate signal processing method should be selected for the transient signal; otherwise, the signal cannot be measured when using the intermittent sample introduction method.
For this reason, analytical instruments have been developed that can obtain high time resolution sample signals with hyphenation of the intermittent sample introduction technique, and some of these instruments have been demonstrated in the literature.18–20 However, it is difficult to determine whether appropriate signal acquisition and processing methods for transient signal measurement in ICP-MS have been discussed sufficiently. For ICP-AES, Chan et al. discussed the operating parameters required for individual droplet analysis.21 To establish a mass analytical technique using M-DIS for practical use, discussion of the appropriate signal acquisition and processing methods is therefore essential. In this study, the effects of the signal detection and signal processing methods on the SNR were evaluated using a model signal that was formed from analytical results produced by M-DIS-ICP-MS for a droplet sample, where the model signal represents a signal obtained when using the intermittent sample introduction process.
Experimental
Chemicals and reagents
A multi-element solution prepared from standard solutions (10 mg mL−1 Ba, Ca, K, Mg, Na, Sr; Kanto Chemical Co., Inc., Tokyo, Japan) was diluted using ultra-pure water (>18.4 MW cm−1) by a Milli-Q (Direct-Q UV 3, Millipore, Bedford, MA, USA) system, and a 500 μg L−1 standard solution was used as a sample. The argon gas (99.99%) that was used for plasma generation and as the carrier gas was obtained from Daiho Sangyo Inc. (Tokyo, Japan).Mass spectrometric measurements using M-DIS-ICP-MS
A commercial micro-droplet generator system (MD-E-3000, Microdrop Technologies GmbH, Norderstedt, Germany), which had also been used previously by Iwai et al.,10 was used here. The dispenser head consisted of a glass capillary with a nozzle tip, and this tip was surrounded by a piezo-actuator. Short voltage pulses were applied to the piezo-actuator by the driver electronics and the droplet samples were ejected from the nozzle tip. The sample solution was discharged in the form of droplets with diameters of 70 μm (droplet volume of 180 pL) by M-DIS, and these droplets were introduced directly into the ICP-MS (HP4500, Agilent Technologies, Tokyo, Japan) system from the axial direction of the plasma torch with an Ar carrier gas flow of 1 L min−1. The instrumental conditions used for ICP-MS were as follows: plasma gas flow of 15 L min−1, auxiliary gas flow of 1 L min−1, and RF power of 1000 W. The ion current output from the detector that was derived from these droplet samples was measured directly with a sampling frequency of 107 Hz using a digital oscilloscope (TDS-680B, Sony/Tektronix Corp., Tokyo, Japan).Results and discussion
Development of the model waveform
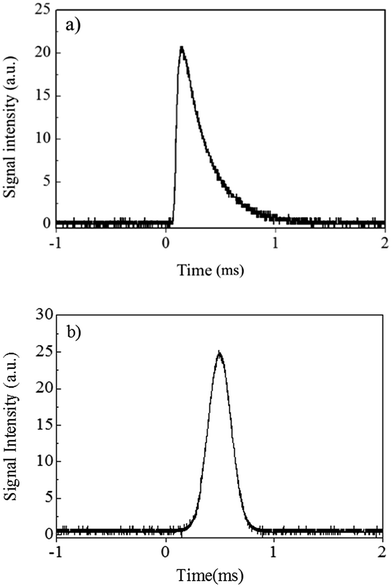
The signal waveform that was obtained by M-DIS-ICP-MS is shown in Fig. 2a. Based on this signal, a Gaussian-shaped signal with the same full width at half maximum (FWHM) of 212.3 μs as the signal shown in Fig. 2a was developed for use in the discussion section of this paper as a model transient signal. The developed model signal is shown in Fig. 2b. In the signal obtained from the analytical instruments, white noise, 1/f noise, and discrete frequency noise, which were derived from noise sources such as the AC line voltage, are typically observed.22 Because it was difficult to evaluate these noises in detail separately, the actual experimental noise was simply combined with the model signal. To reduce the computational load for the calculations, the sampling frequency of the model signal was computationally reduced to 106 Hz. The peak height of the model signal was also adjusted to have an SNR of 100. This model signal, as shown in Fig. 2b, can be assumed to be a raw signal in the state before conversion into an electric signal in the detector. We used this model signal as a basis for the discussion below.Comparison of signal detection methods
To discuss the proposed signal acquisition method with improved SNR for application to transient signals from small-sized samples, it is essential to know the processing sequence used for the ion signal in ICP-MS. From this perspective, the relationship between the sampling frequency and the integration time in the signal acquisition process is particularly important. Depending on the type of detector and the signal processing method used, there are two cases where the sampling frequency of the signal obtained represents the integration time; otherwise, these are different quantities. The SNR of the droplet signal was calculated in each case and the effect of the relationship between the signal acquisition method and the integration time on the analysis was then evaluated.Sampling frequency = integration time
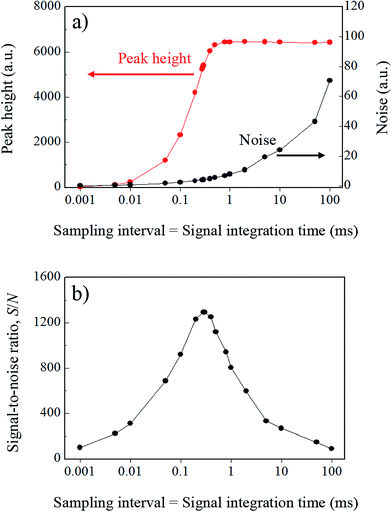
In the case where the sampling frequency is equal to the integration time, an array-type detector such as a charge-coupled device (CCD) is often used as the emission detector. In principle, the signal acquisition time, i.e., the sampling time, and the signal integration time become equal in a CCD-type detector. Therefore, in CCD ion detection, discrete data can be obtained at each integration time. When the integration time is increased for improved detection sensitivity, the sampling interval of the signal obtained also increases to the same duration. In conventional ICP-MS, a secondary electron multiplier (SEM) is used as the ion detector, and the sample ions are measured by signal processing of the pulse-counting method. In this case, the counting time interval, i.e., the integration time, and the interval between the obtained signals, i.e., the sampling time, are also equal. Results of simulation of this variation in the model signal with varying integration times from 1 μs to 100 ms are shown in Fig. 3. The signal integration was carried out by summing uniformly and symmetrically over the signal range from the center of the Gaussian. As the integration time increases, the true signal waveform is reflected less accurately in the processed signal. To evaluate the effects of the signal integration time on the droplet sample analysis, the peak heights and noise levels at each integration time were calculated. The relationship between these parameters is shown in Fig. 4a. The noise was estimated by calculating the standard deviation of the background signal. The peak height increased with increasing integration time, but the signal that was derived from the sample was not integrated further when the integration time exceeded the time range of that sample signal. If the integration time was extended even further, then the same increases in the background signal with integration time were integrated, and the peak height did not change any further. In contrast, the noise continued to increase with increasing integration time. Theoretically, in random noise, the noise level increases -fold for a tenfold increase in the integration time. The SNR calculation results are shown in Fig. 4b. In this case, S and N represent the peak height and the standard deviation of the background signal, respectively. The peak height maintains its value with increasing integration time over a certain time period, but the noise continues to increase. Therefore, there is an optimum integration time for the SNR, which enables the sample signal to be integrated as much as possible while integrating as little noise as possible. When the signal can be approximated as a Gaussian, then the optimal integration time for the SNR is approximately 1.4 times longer than the FWHM of the signal, and the time for the model signal used in this paper is 297 μs. Under these conditions, the SNR was 1290. The calculated SNR will vary, depending on the number of sampling points used in the model signal, because the digital signals were simply summed in this study. Note that the SNRs that were obtained in this study cannot be obtained in reality, because the charges are stored and integrated as analog signals in an actual CCD. Additionally, it is impossible to know the optimal integration time at the instant at which the measurements are taken, because we can never know the real signal waveform before we detect it, and the optimal integration time is different for different signal waveforms. It is therefore necessary to determine the optimal condition by performing the measurement repeatedly while varying the integration time.
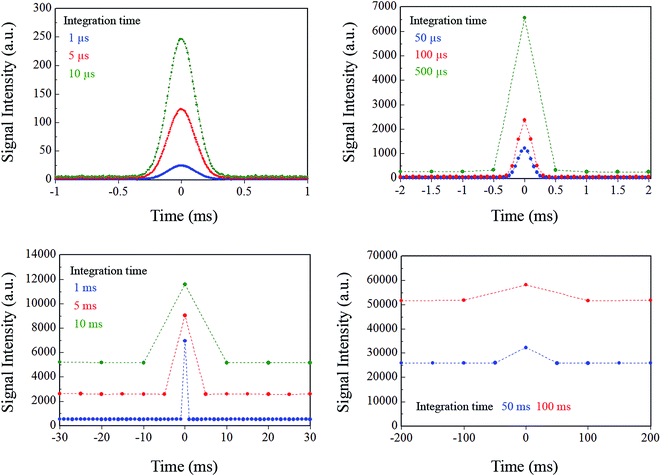 | ||
| Fig. 3 Variation of signal waveform for each integration time when the measurement system integration time and sampling interval are the same. | ||
Obtaining an analog signal from the detector by an analog method
In the case of detectors such as the SEM, the electric charge is not accumulated but is in fact amplified, and the sample signal is then obtained as a current. In analog measurement methods, e.g., using a pen recorder, signal integration is performed to derive the ion current from the SEM by installing an analog integrating circuit in the current path. The signal variations caused by the effects of the resistor–capacitor (RC) integrating circuit used for this purpose were simulated by processing the weighted moving average of the model signal. The weighting factor was determined using eqn (1) below.23 | (1) |
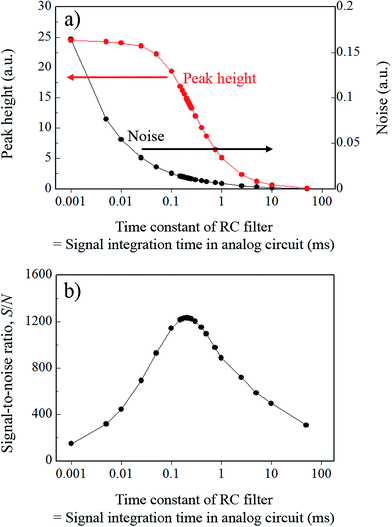
In eqn (1), t and RC represent the time and the time constant of the RC integrating circuit, respectively. The weighting factor was determined by assigning specific values (ranging from 1 μs to 5 ms) to RC, and a moving average was applied to the model signal using this factor. The calculated results for signal variation with change in the time constant of the integrating circuit are shown in Fig. 5. To evaluate the effects of the changes in the integrating circuit time constant on the droplet sample analysis, the peak height and the noise were calculated for each integration time, and the relationship between these parameters is shown in Fig. 6a. As shown in Fig. 6, the signal tailed off as the integrating circuit time constant increased and the peak height therefore decreased. However, the high frequency noise component was also eliminated and the total noise level was thus reduced. The SNR values that were calculated from the peak heights and the noise values in Fig. 6a are shown in Fig. 6b. The highest SNR of 1230 was obtained using a time constant of 210 μs, which is almost the same time as the FWHM value of the model signal. Note that the SNRs are dependent on the sampling frequency of the model signal because the SNRs were calculated using digital signals in this study. In practical measurements, it can be assumed that the sampling frequency of the model signal is unlimited. Therefore, better SNRs than the value obtained in this study can be obtained if an analog measurement device with a sufficiently high frequency response is used and if the time constant of the analog integrating circuit is set at the optimal value (which was 210 μs in this study). However, the frequency response of a commercial pen recorder is a few hundreds of Hz at the most, so it is difficult to measure signals at higher frequencies than this. Additionally, the optimal time constant is unknown at the time at which the measurements are performed in this case. Therefore, the measurements must also be repeated while the time constant of the analog integrating circuit is varied, as stated earlier. Analog devices are thus not used for high-precision measurements.
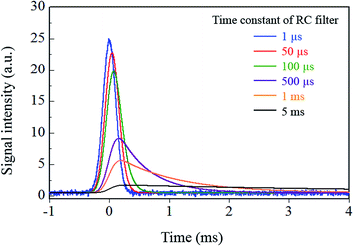 | ||
| Fig. 5 Variation of signal waveform for each integration time when the analog signal from the detector was recorded using analog instruments. | ||
Obtaining an analog signal from the detector by a digital method
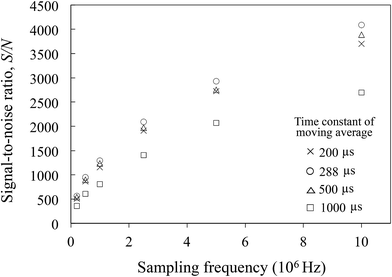
For the CCD detector, which has a sampling interval that is the same as its integration time, the signal integration time must be close to the signal time range to perform higher SNR measurements of the transient signal, as stated above. For this reason, high-time-resolution ICP-MS was developed. However, the integration time cannot be reduced to a few ms in conventional ICP-MS when using the pulse-counting method or CCDs, because they are designed under the assumption of continuous sample introduction.In this case, the signal can be obtained in the optimal sampling interval by obtaining the analog signal from the detector by a digital method, and the signal processing can then be carried out using a digital filter with an optimal time constant after signal acquisition. In this case, the optimal time constant for the model signal that is used in this study is 288 μs. The SNRs were then calculated by setting time constants for the moving average of 200, 288, 500 and 1000 μs, and by varying the sampling frequency from 0 to 107 Hz. The results of this process are shown in Fig. 7. At each of the sampling frequencies, the highest SNRs were obtained with a moving average time constant of 288 μs. Increased numbers of sampling points lead to increased noise averaging, and the SNR was 4090 at a sampling frequency of 10 MHz. This result shows that a high SNR can be achieved for a transient signal by obtaining the analog signal from the detector by a digital method at a high sampling frequency and then processing the digital signal with an optimal filter.
To confirm the analytical capability of this method, the limit of detection (LOD) of a real sodium signal (Fig. 2a) was estimated on the basis of an SNR of 3, and the values were compared before and after the application of the optimal filter described in this section. As a result, the LOD improved after filtering from 2.9 fg to 85 ag. This result shows the effectiveness of this method for analyzing small-sized samples.
Conclusion
A model signal was formed based on an analog signal from M-DIS-ICP-MS, and this signal was used as a basis to compare SNRs among the cases where the signal sampling frequency was equal to the integration time, where the analog signal was obtained from the detector via an analog method, and where the analog signal was obtained from the detector via a digital method. The filtered signal behavior was different in each case, and the optimal filter time constants for these three cases were approximately 1.4, 0.99 and 1.36 times the FWHM, respectively. It was confirmed that the highest SNR value for a transient signal would be obtained easily when the analog signal was acquired digitally while using a high sampling frequency and applying an optimal filter. The LOD of sodium was estimated using a raw droplet signal under high sampling frequency and optimal filter conditions for the highest SNR, and a LOD of the order of 85 ag was achieved. In recent years, mass spectrometers with short integration times have become commercially available, including those where the sampling frequency and the integration time are equal, as in the pulse-counting method; it is thus expected that the SNR can be improved by acquiring signals with high time resolution and processing these signals using digital filters. In this study, we have only discussed the solution sample analysis process from the perspective of M-DIS-ICP-MS. However, this discussion is equally applicable to analysis by methods such as LA-ICP-MS or nanoparticle analysis.Acknowledgements
The authors thank the two anonymous reviewers for their thoughtful and constructive suggestions, which helped us to improve the quality of this manuscript.References
- Inductively Coupled Plasma Mass Spectrometry, ed. A. Montaser, Wiley-VCH, New York, 1998 Search PubMed.
- C. Vandecasteele and C. B. Block, Modern Methods for Trace Element Determination, Wiley-VCH, New York, 1997 Search PubMed.
- J. Mora, S. Maestre, V. Hermandis and J. L. Todoli, Trends Anal. Chem., 2003, 22, 3 CrossRef.
- C. Giesen, L. Waentig, T. Mairinger, D. Drescher, J. Kneipp, P. H. Roos, U. Panne and N. Jakubowski, J. Anal. At. Spectrom., 2011, 26, 2160 RSC.
- D. Drescher, C. Giesen, H. Traub, U. Panne, J. Kneipp and N. Jakubowski, Anal. Chem., 2012, 84, 9684 CrossRef CAS PubMed.
- H. Miyahara, K. Shigeta, N. Nakashima, Y. Nagata and A. Okino, Bunseki Kagaku, 2010, 59, 363 CrossRef CAS.
- Y. Kabraki, A. Nomura, Y. Ishihara, T. Iwai, H. Miyahara and A. Okino, Anal. Sci., 2013, 29, 1147 CrossRef.
- H. Miyahara, Y. Kaburaki, T. Iwai and A. Okino, Bunseki Kagaku, 2014, 63, 101 CrossRef CAS.
- H. Miyahara, Y. Kaburaki, T. Iwai and A. Okino, Bunseki Kagaku, 2014, 63, 109 CrossRef CAS.
- T. Iwai, K. Okumura, K. Kakegawa, H. Miyahara and A. Okino, J. Anal. At. Spectrom., 2014, 29, 2108 RSC.
- C. C. Garcia, A. Murtazin, S. Groh, V. Horvatic and K. Niemax, J. Anal. At. Spectrom., 2010, 25, 645 RSC.
- S. Gschwind, L. Flamigni, J. Koch, O. Borovinskaya, S. Groh, K. Niemax and D. Gunther, J. Anal. At. Spectrom., 2011, 26, 1166 RSC.
- B. Franze, I. Strenge and C. Engelhard, J. Anal. At. Spectrom., 2012, 27, 1074 RSC.
- K. Shigeta, G. Koellensperger, E. Rampler, H. Traub, L. Rottmann, U. Panne, A. Okino and N. Jakubowski, J. Anal. At. Spectrom., 2013, 28, 637 RSC.
- A. Murtazin, S. Groh and K. Niemax, J. Anal. At. Spectrom., 2010, 25, 1114 RSC.
- A. Murtazin, S. Groh and K. Niemax, Spectrochim. Acta Part B, 2012, 67, 3 CrossRef CAS PubMed.
- S. Gschwind, H. Hagendorfer, D. A. Frick and D. Guenter, Anal. Chem., 2013, 85, 5875 CrossRef CAS PubMed.
- A. Hineman and C. J. Stephan, J. Anal. At. Spectrom., 2014, 29, 1252 RSC.
- O. Borovinskaya, B. Hattendorf, M. Tanner, S. Gschwind and D. Guenter, J. Anal. At. Spectrom., 2013, 28, 226 RSC.
- O. Borovinskaya, S. Gschwind, B. Hattendorf, M. Tanner and D. Guenter, J. Anal. At. Spectrom., 2014, 86, 8142 CAS.
- G. C. Y. Chan, Z. Zhu and G. M. Hieftje, Spectrochim. Acta Part B, 2012, 76, 77 CrossRef CAS PubMed.
- J. S. Crain, R. S. Houk and D. E. Eckels, Anal. Chem., 1989, 61, 606 CrossRef CAS.
- Wave Data Processing for Scientific Analysis, ed. S. Minami, CQ Press, Tokyo, 1986 (in Japanese) Search PubMed.
Footnote |
| † Current Address: Department of Applied Chemistry for Environment, Kwansei Gakuin University, 2-1 Gakuen, Sanda, Hyogo 669-1337, Japan. Email: t-iwai@kwansei.ac.jp, Fax: +81-79-565-9729, Tel: +81-79-565-9762 |
| This journal is © The Royal Society of Chemistry 2015 |

