
Elemental and molecular mass spectrometric strategies for probing interactions between DNA and new Ru(II) complexes containing phosphane ligands and either a tris(pyrazol-1-yl)borate or a pyridine bis(oxazoline) ligand†
M. Corte
Rodríguez‡
a,
L. López
Fernández‡
a,
A. García
Fernández
b,
A. Suárez
Rendueles
b,
E. Menendez
Pedregal
b,
J.
Bettmer
a,
E.
Blanco-González
a,
M.
Montes-Bayón
*a,
M. P.
Gamasa
b and
E.
Lastra
*b
aDepartment of Physical and Analytical Chemistry, Faculty of Chemistry. University of Oviedo, C/Julian Clavería 8, 33006 Oviedo, Spain. E-mail: montesmaria@uniovi.es
bDepartment of Organic and Inorganic Chemistry, Faculty of Chemistry. University of Oviedo, C/Julian Clavería 8, 33006 Oviedo, Spain. E-mail: elb@uniovi.es
First published on 14th November 2014
Abstract
In the present work we evaluate the potential as chemotherapeutic agents of two groups of new Ru(II) complexes containing water soluble phosphane ligands and either a tris(pyrazol-1-yl)borate (Tp) or a pyridine bis(oxazoline) (pybox) ligand and their interactions with DNA. Since the interaction of these drugs can be diverse (from binding to DNA nucleobases to intercalation within the DNA strands), different approaches need to be taken for addressing such possibilities. In this regard, mass spectrometry, MS (elemental and molecular), has been exploited in this study to unequivocally elucidate the structures of the interaction products (molecular MS) and their quantity (elemental MS). First, a systematic evaluation of the interaction of the four Ru–Tp complexes with the individual DNA nucleotides revealed the formation of the Ru–Tp complex containing the phosphane 1-CH3-PTA and chloride as ligands (Asr3), which is the most reactive species providing positive interactions with 2′-deoxyguanosine-5′-monophosphate (dGMP) in a 1![[thin space (1/6-em)]](https://www.rsc.org/images/entities/char_2009.gif) :1 stoichiometry confirmed by electrospray MS (ESI-MS). The further coupling of liquid chromatography to inductively coupled plasma mass spectrometric (ICP-MS) detection permitted Ru-specific detection to obtain quantitative data on the interaction showing reaction yields >75%. This interaction was also confirmed, when dGMP was present in an oligonucleotide structure, by both MS techniques and also in the case of DNA. On the other hand, if the Ru-complex interaction with DNA occurs through the intercalation between the DNA strands without specific binding, alternative analytical techniques need to be applied. Here, we illustrate the use of column-gel electrophoresis (GE) on-line coupled to ICP-MS which is a suitable technique to address conformational changes in plasmid DNA induced by interaction with the two assayed Ru–pybox complexes.
:1 stoichiometry confirmed by electrospray MS (ESI-MS). The further coupling of liquid chromatography to inductively coupled plasma mass spectrometric (ICP-MS) detection permitted Ru-specific detection to obtain quantitative data on the interaction showing reaction yields >75%. This interaction was also confirmed, when dGMP was present in an oligonucleotide structure, by both MS techniques and also in the case of DNA. On the other hand, if the Ru-complex interaction with DNA occurs through the intercalation between the DNA strands without specific binding, alternative analytical techniques need to be applied. Here, we illustrate the use of column-gel electrophoresis (GE) on-line coupled to ICP-MS which is a suitable technique to address conformational changes in plasmid DNA induced by interaction with the two assayed Ru–pybox complexes.
Introduction
The platinum antitumor drugs cisplatin, carboplatin and oxaliplatin are widely used components of modern cancer chemotherapy.1 However, their success is limited due to severe adverse effects2 and intrinsic or acquired resistance issues.3 Consequently, other metallodrugs have started to be investigated to improve these current limitations of the Pt-based therapies.4 In this regard, ruthenium complexes exhibit attractive properties such as the facility to exchange with O- and N-donor molecules in a way very similar to that of platinum drugs, the possibility to exchange oxidation states among II, III and even IV in the biological medium and the potential to be transported to tumour cells by different serum proteins.5,6 The pharmacological target of antitumor ruthenium complexes has not been unequivocally identified, but it is generally accepted that their cytotoxicity is related to their ability to bind DNA,7–9 although some exceptions have been reported.10 Thus, by analogy to platinum antitumor drugs, DNA interactions with new potential antitumor ruthenium complexes are of a great interest.There is a wide variety of Ru-containing compounds that have exhibited promising anticancer activity. Among them, the Ru(III) complexes, NAMI-A (imidazolium trans-[tetrachloro(dimethylsulfoxide)(1H-imidazole)-ruthenate(III)]) and KP1019 (indazolium trans-[tetrachlorobis(1H-indazole)ruthenate(III)]), have already successfully completed Phase I clinical trials and are now undergoing the Phase II.6 Following the assumption that the activity of these Ru(III) compounds is dependent on their in vivo reduction to the more reactive Ru(II) species,11,12 a wide variety of Ru(II) complexes have been synthesized and investigated in the last decades. In particular, Ru(II)-arene compounds containing the water-soluble 1,3,5-triaza-7-phosphaadamantane (PTA) ligand [Ru(η6-arene)Cl2(PTA)], termed RAPTA complexes, have shown promising anticancer activity.13,14 Although it has not yet been unequivocally established, the primary cellular target for these Ru(II) complexes is thought to be DNA.14 Moreover, their biological activity can be fine-tuned by changing the nature of the arene ligand, or by introducing a chelating ligand instead of chloride (e.g. triphenylphosphine, PPh3) in their structure.14 Modification of the PTA ligand with a methyl group (1-CH3-PTA) was also found to change the activity of the RAPTA complexes.15
Recently, two groups of new Ru(II) compounds containing phosphane ligands and either a tris(pyrazol-1-yl)borate (Tp) or a pyridine bis(oxazoline) (pybox) ligand instead of the arene ligand have been synthesized and characterized.16,17 The use of phosphanes, in particular PTA, as a ligand is favored by its water solubility and the catalytic applications of its metal complexes. In addition several of these synthesized Ru(II) complexes have shown cytotoxicity by inducing DNA modifications and have an inhibitory effect against human tumor cell lines.16,17 Therefore, it could be of interest to evaluate the effect of structural alterations caused by these complexes in DNA (e.g. complexes containing either PTA or 1-CH3-PTA as ligands) since they might come from intercalation between DNA bases by the organic moiety of the complexes and from Ru–N (nucleotide) bonding.
Several methods can be used for the characterization of transition metal complexes, as well as for monitoring their possible interaction with biomolecules; among them, ESI-MS has the potential to complement other structural methods (NMR spectroscopy and X-ray crystallography) by rapidly delivering information on DNA interactions with different chemicals including Ru complexes using only small amounts of the complex and DNA.9,18 Conversely, the use of inductively coupled plasma mass spectrometry (ICP-MS) as an ultrasensitive metal-specific detector in on-line combinations with separation methods such as liquid chromatography (HPLC) and capillary electrophoresis (CE) has emerged as an important tool for studying anticancer metallodrugs in complex biological samples and for characterising their interaction with biomolecules.19–21 However, very little work has been published regarding the use of ICP-MS for monitoring metallodrug–DNA interactions, particularly in the case of Ru-containing compounds.22,23 In this case, the main advantage would be the quantitative dimension that can be added to the interaction results when coupling on-line ICP-MS with different separation methods since direct information on the amount of free and DNA-associated (bound or intercalated) drugs can be obtained simultaneously.
Therefore, here we propose the complementary use of ICP-MS and ESI-MS techniques to study the reactivity of the synthesized Ru–tris(pyrazol-1-yl)borate (Ru–Tp) complexes with nucleotides and oligonucleotides as model compounds. Furthermore, the feasibility of using two different hyphenated ICP-MS strategies, gel electrophoresis (GE)-ICP-MS and size exclusion liquid chromatography (SEC)-ICP-MS, for monitoring the binding properties of some of the tested Ru–Tp and Ru–pyridine bis(oxazoline) (Ru–pybox) complexes towards polymeric double stranded DNAs (calf thymus DNA or plasmid DNA) will be investigated.
Experimental
Instrumentation
Two different chromatographic columns have been used for studying the interaction of Ru–Tp complexes (see ESI† for structural information) with nucleotides: a narrow-bore column Zorbax Eclipse XDB-C18 (150 × 2.0 mm id, 5 μm) (Agilent, Agilent Technologies, Waldbronn, Germany) and a capillary column Zorbax SB C18 (150 × 0.3 mm id, 5 μm) (Agilent Technologies). The narrow-bore column was connected to a conventional 1100 Series HPLC system (Agilent Technologies) consisting of a four channel on-line degasser, a standard binary pump, a micro-well plate auto-sampler and a diode array detector. The capillary column was connected to a 1100 Series Capillary HPLC system (Agilent Technologies). The ICP-MS instrument used as a detector was a double focusing magnetic sector field mass analyzer, Element 2 (Thermo Fisher Scientific, Bremen, Germany), which allowed the simultaneous and interference free detection of 31P and 102Ru in the medium resolution mode of 4000. For connecting the capillary HPLC system, the ICP-MS instrument was fitted with an interface based on a total consumption nebulizer DS-5 (CETAC, Omaha, USA) and a spray chamber, which allows the direct connection of the nebuliser and the torch maintaining the lowest possible internal volume. Experimental working conditions for the HPLC-UV/VIS and HPLC-ICP-MS methodologies used are summarized in Table 1.| HPLC parameters | |
|---|---|
| Reversed phase column (narrow bore HPLC-UV/VIS) | Agilent ZORBAX Eclipse XDB-C18 narrow bore 5 μm (250 × 2.1 mm i.d.) |
| Reversed phase column (capillary HPLC-ICP-MS) | Agilent ZORBAX SB-C18 capillary 5 μm (150 × 0.3 mm i.d.) |
| Mobile phases | A: 0.05% TFA/H2O |
| B: A + 90% ACN | |
| Flow rate | 0.2 mL min−1 (narrow bore HPLC) |
| 10 μL min−1 (capillary HPLC) | |
| Injection volume | 10 μL (narrow bore HPLC) |
| 2 μL (capillary HPLC) | |
| Gradient | 0–3 min: 3% B |
| 2–27 min: 3–100% B | |
| 27–30 min: 100% B | |
| 30–31 min: 3% B | |
| ICP-MS parameters | |
|---|---|
| Instrument | Thermo Element 2 |
| Radiofrequency power | 1350 W |
| Cooling gas flow | 15.5 L min−1 |
| Carrier gas flow | 0.9 L min−1 |
| Auxiliary gas flow | 0.9 L min−1 |
| Sampler | Ni, 0.7 mm |
| Skimmer | Ni, 1 mm |
| Monitored isotopes | 31P, 102Ru, 104Ru |
| Resolution | Medium (4000) |
| Pump flow | 6 μL min−1 |
| Nebulizer | Total consumption nebulizer |
ESI-MS experiments were carried out on a quadrupole-time-of-flight mass spectrometer (ESI-q-TOF), QStar XL (Applied Biosystem, Langen, Germany), operated in the positive ionization mode and fitted with a MicroSpray® ion source, using N2 as the nebulization gas. The samples were diluted in CH3CN–H2O–HCOOH (50:49.9:0.1) and were introduced into the mass spectrometer by direct infusion at a flow rate of 5 μL min−1. The capillary voltage was set at 3.5 kV and the instrument was daily calibrated using a standard solution of reserpine (peptide of m/z 609.28121 Da). The measured mass range was 200 to 2000 Da. Data were processed using the MassLynx 4.1 software.
SEC-ICP-MS experiments were performed on a dual-piston liquid chromatographic pump (Shimadzu LC-10AD, Shimadzu Corporation, Kyoto, Japan) equipped with a sample injection valve (Rheodyne, Model 7125, Cotati, CA, USA) fitted with a 50 μL injection loop and a SEC column Superdex Peptide HR 10/30 (300 × 10 mm id) (GE Healthcare, Amersham Biosciences AB, Uppsala, Sweden). The applied ICP-MS conditions are summarized in Table 1.
A continuous elution gel electrophoretic (GE) system (Mini Prep Cell including a high-voltage power supply PowerPac3000, BioRad Laboratories, Munich, Germany) described in detail elsewhere24,25 has been used to study the interaction of Ru–pybox complexes (see ESI† for structural information) with a plasmid DNA. In this work, the outlet of the GE system was connected to a concentric nebulizer with a flow rate of 0.7 mL min−1. Unless otherwise stated, the parameters of the gel housed in glass tubes (ID: 2.2 mm) were as follows: 0.8% (w/v) agarose SeaKem LE prepared in 50 mmol L−1 ammonium acetate buffer (pH 8.0), which served also as an electrode and an elution buffer. The gel length was 32 mm and DNA separations were carried out at a voltage of 250 V. Sample volume injected on the top of the gel was 10 μL. The conditions for ICP-MS detection of 31P and 102Ru can be found in Table 1.
Chemicals
All solutions were prepared using ultra-pure water (Milli-Q Water Purification System, Millipore, Bedford, MA, USA). The two groups of Ru(II)-complexes under study have been synthesized and characterized as previously described.16,17 For reversed phase HPLC separation, water containing 0.05% TFA (Merck, Darmstadt, Germany)/acetonitrile (HPLC grade, Merck) gradients was used. A mobile phase of 50 mM ammonium acetate (pH 7.4) (Sigma–Aldrich, St. Louis, MO, USA) was used for SEC. For the preparation of GE running buffer solutions, ammonium acetate (Acros, Geel, Belgium) and sodium hydroxide (Merck) were used. The customized oligonucleotide (609.53 μg) was synthesized by Invitrogen (Invitrogen, Barcelona, Spain) with the sequence 5′-TCCTGTCC-3′ (MW 2337.6 g mol−1). Calf thymus DNA and the sodium salts of the four nucleotides: 2′-deoxyguanosine-5′-monophosphate (dGMP), 2′-deoxyadenosine-5′-monophosphate (dAMP), 2′-deoxythymidine-5′-monophosphate (dTMP) and 2′-deoxycytidine-5′-monophospate (dCMP) were purchased from Sigma-Aldrich. The plasmid DNA pBluescript (Dept. of Biochemistry and Molecular Biology, University of Oviedo) was transformed in competing bacterial cells Tuner (DE3) pLacI obtained from the scientific services of the University of Oviedo and purified with the use of a Plasmid Maxi-kit (Izasa, Barcelona, Spain).Procedures
For the incubation of the different Ru–Tp complexes with the four deoxynucleoside-5′-monophosphates (dNMPs), stock standard solutions of the individual nucleotides were prepared by dissolving the commercial products in Milli-Q water to a final concentration of 1 mg mL−1. Individual standard solutions of the different Ru–Tp complexes were also prepared in water to a final concentration of 1 mg mL−1. These solutions were mixed with the corresponding dNMP solution at a molar ratio of dNMP:Ru-complex of 5:1 and the mixture was incubated for 24 h at 37 °C in a water bath. The generated products were then separated by reversed phase HPLC using the acetonitrile gradient that is shown in Table 1 in order to address the presence of the free drug. The molecular structure of the obtained species was simultaneously evaluated by ESI-q-TOF after adequate dilution of the incubation product in 10 mM ammonium acetate buffer (pH 6.5) containing 20% methanol.
For the interaction of the Ru–Tp complex named Asr3 (see ESI†) with a custom oligonucleotide with the sequence (5′-TCCTGTCC-3′), an aliquot of 200 μL of the dissolved oligonucleotide in ultrapure water (total volume, 2 mL) was mixed with 20 μL of the Asr3 aqueous solution (1 mg mL−1) and the mixture was vigorously shaken and left to react for 24 hours at 37 °C before being analyzed by ESI-q-TOF.
Similarly, calf thymus DNA solution was prepared at 1 mg mL−1 in water and then incubated with the Ru–Tp complex (Asr3) aqueous solution at the molar ratio of DNA:Asr3 of 5:1 for 24 hours at 37 °C. The DNA-bound and unbound Ru-complexes were then chromatographically separated by SEC-ICP-MS with a mobile phase of 50 mM ammonium acetate (pH 7.4) at a flow rate of 0.6 mL min−1. This experiment was conducted with double stranded DNA samples, and also with single stranded DNA obtained by heating the calf thymus DNA aqueous solution at 90 °C for 30 minutes before incubation with the Asr3 complex.
For the binding experiments of the Ru–pybox complexes with plasmid DNA, individual standard solutions of the two Ru–pybox complexes were prepared in ultrapure water to a final theoretical concentration of 1 mg mL−1. These solutions were mixed with an aqueous solution of the plasmid DNA at a molar ratio of plasmid DNA:Ru–pybox complex of 1:1000 and the mixture was left to react in the dark at 37 °C for 2 hours and 18 hours before being analyzed by GE-ICP-MS.
Results and discussion
Nucleotide interaction studies by HPLC-UV/VIS and HPLC-ICP-MS
In the first part, a systematic study on the interaction of the different Ru–Tp complexes (see ESI† for structural information) with the four dNMPs was conducted. To do that, incubation of the four dNMPs with each Ru–Tp complex was carried out independently as described previously. The reaction products obtained after incubation were then chromatographically separated using reversed-phase HPLC and detected using two different detectors: UV/VIS at 260 nm and ICP-MS (monitoring Ru and P). Fig. 1 shows the obtained results for the incubation products of Asr3 with dGMP (Fig. 1A) and with dCMP (Fig. 1B) using UV/VIS detection. As it can be seen, in the case of a positive interaction between the nucleotide and the Ru–Tp complex, as observed for dGMP (Fig. 1A), it is possible to detect a peak in the chromatogram (at 21 min in the red trace of Fig. 1A) corresponding to the adduct formed between dGMP and Asr3, separated from the un-reacted Asr3 complex (at 23 min in black and red traces) and the excess of dGMP eluting at the void volume of the column (red trace). When no interaction occurs, as shown in Fig. 1B for dCMP, the chromatogram shows mainly the presence of the peak corresponding to the pure Asr3 complex (at 23 min in both chromatograms) before and after incubation. | ||
| Fig. 1 Chromatograms obtained by HPLC-UV (260 nm) corresponding to the products of the interaction between: (A) Asr3 and dGMP and (B) Asr3 and dCMP. Operating conditions are summarized in Table 1. | ||
From a qualitative point of view, these results show already a positive interaction of Asr3 with dGMP. However, for the quantitative evaluation of complex formation ICP-MS is a more suitable detector (the Ru signal in the separated peaks can be directly correlated with the complexation rate). The elution conditions initially used for UV/VIS detection (Table 1) were not suitable for ICP-MS due to the high organic content of the mobile phase. Therefore, in order to preserve the separation conditions as close as possible to the UV/VIS experiments, a capillary liquid chromatography system with a reversed-phase column was coupled to the ICP-MS. In this case, a total consumption nebulizer and a spray chamber were used as described in previous publications.19 This set-up permits the continuous introduction of high amounts of organic solvents in the mobile phase (90% acetonitrile) to the ICP-MS at very low flow rates (10 μL min−1). The results obtained for the separation of the reaction products of the interaction of Asr3 with dGMP by capillary HPLC-ICP-MS can be seen in Fig. 2. A main peak containing Ru and P can be observed at about 23 min in this case, which can be ascribed to the Asr3–dGMP adduct formed. Additionally, at 26 min it is possible to observe the peak corresponding to the un-reacted Ru complex (Asr3), as verified by injecting the pure compound in the same system (data not shown). The presence of P in this latter peak is due to the fact that the Asr3 complex contains also this element (see ESI†). Minor P and Ru-containing peaks (around 20 min in Fig. 2) could be ascribed to other less abundant reaction products. In order to obtain quantitative data of the interaction, several inorganic standards of Ru (at different concentrations from 0 to 50 ppb Ru) were injected into the ICP-MS system by flow injection. Since ICP-MS provides species independent ionization (a unique feature of ICP-MS that cannot be achieved with other molecular sources like ESI) but matrix dependent, the standards are injected into a carrier flow of 95% acetonitrile (similar composition to that of chromatography at the retention time of the Ru-containing species). With these data, direct Ru concentration in the adduct and in the peak corresponding to the free drug can be obtained. In addition, once the stoichiometry between Ru and dGMP is established, the Ru concentration can also provide the concentration of the formed adduct. In this regard, quantitative data showed that the peak at 23 minutes in Fig. 2 corresponding to the adducted species contained 8.5 ppb of Ru while the free Asr3 complex corresponds to 2.45 ppb of Ru (about 77% and 22.4% of the total Ru respectively). This result confirms the quantitative formation of the adduct under the assayed conditions.
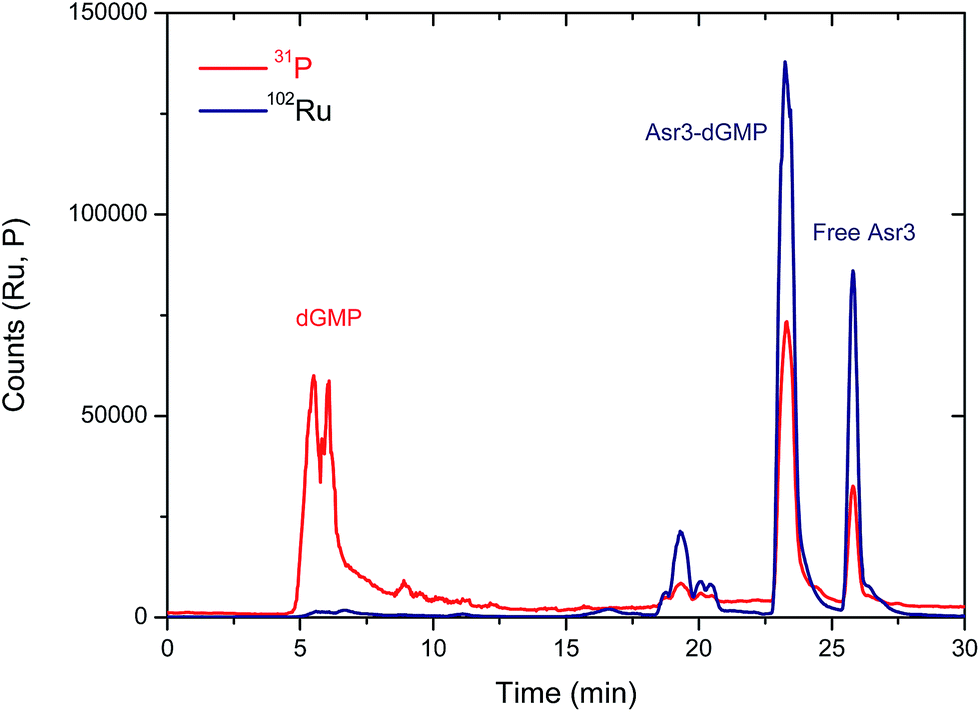 | ||
| Fig. 2 Chromatogram obtained by capillary-HPLC with ICP-MS detection of 31P (red trace) and 102Ru (blue trace) corresponding to the products of the interaction between Asr3 and dGMP. Operating conditions are summarized in Table 1. | ||
Similar studies were conducted with all the different Ru–Tp compounds and the four dNMPs with the finding that Asr3, Asr7 and Asr12 showed a positive interaction with dGMP. Among them Asr3 showed the highest yield in adduct formation. No detectable interactions were observed when any of the Ru–Tp complexes were incubated with dCMP and dTMP and just a minor product was obtained when Asr3 interacted with dAMP. Finally, the neutral complex Asr14 turned out to be highly retained in the chromatographic column and could not be eluted. Therefore, no evidence on its reactivity can be provided. On the view of these results we can conclude that the most reactive species towards DNA nucleotides, particularly dGMP, seems to be the Asr3 complex. This reaction was found to be quite specific to dGMP as in the case of some other Ru(II) arene complexes.26
Nucleotide and oligonucleotide binding studies by ESI-MS
To verify the structure of the product obtained by the reaction of the Asr3 complex with dGMP, the incubated mixture was analysed by direct infusion electrospray (ESI-q-TOF). The observed mass spectrum can be seen in Fig. 3. As can be seen the most abundant species (observed at m/z 1094.220 Da) corresponded to the monoadduct formed by the interaction between one molecule of dGMP and one molecule of Asr3 that has lost the labile chloride ligand. It is also possible to observe the doubly charged species (at m/z 548.131 Da) and the sodium adduct (at m/z 558.618 Da). The Ru isotope pattern could be observed at both masses. It could be concluded that a mono-adducted species between dGMP and Asr3 is formed and that is the predominant reaction product.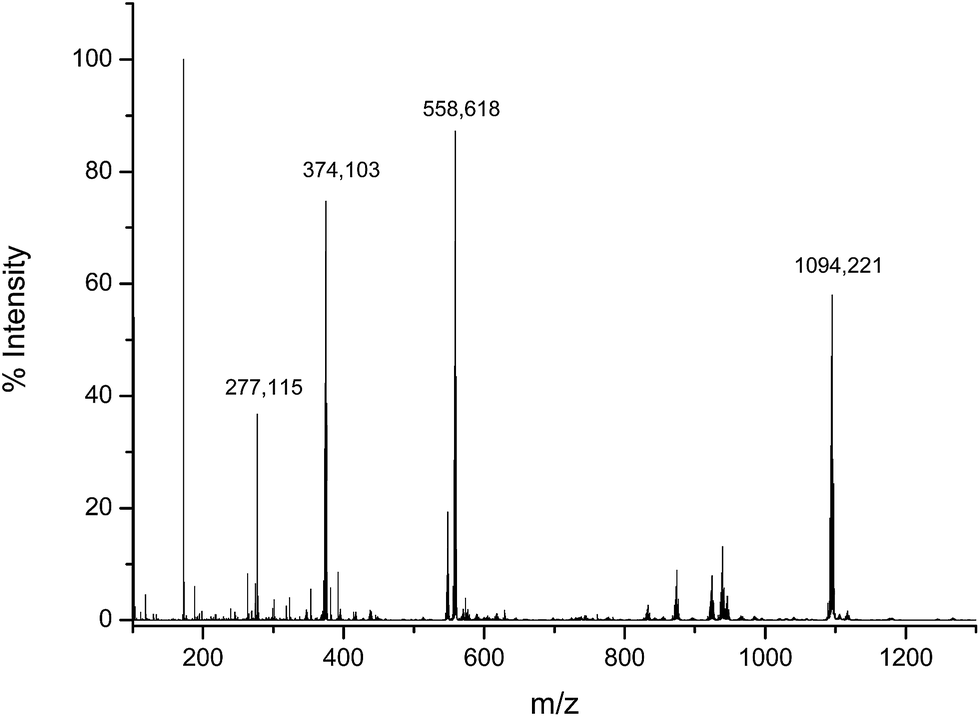 | ||
| Fig. 3 Electrospray MS spectrum corresponding to the products of the interaction between Asr3 and dGMP. Experimental conditions are summarized in the text. | ||
In order to provide further information on the observed preferential binding of Asr3 to dGMP, this complex was made to react with a custom oligonucleotide (at a molar ratio of oligonucleotide:Asr3 of 5:1) containing the sequence 5′-TCCTGTCC-3′ and just one guanine residue within the structure. The reaction products obtained were analyzed by ESI-q-TOF and the resulting spectrum can be seen in Fig. 4.
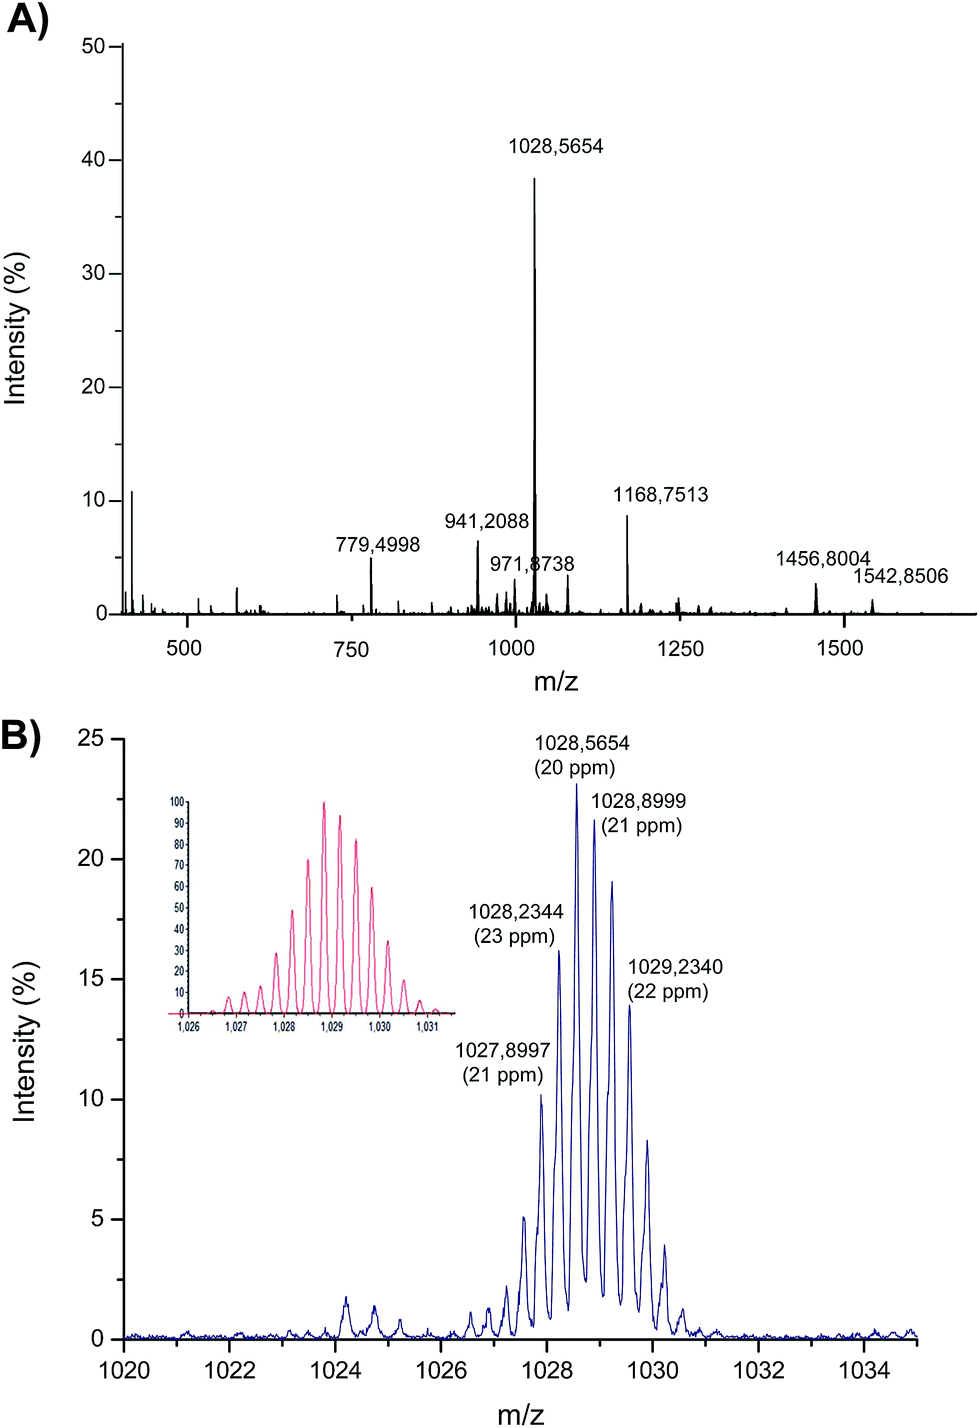 | ||
| Fig. 4 Electrospray MS spectrum corresponding to the products of the interaction between Asr3 and the oligonucleotide (5′-TCCTGTCC-3′). (A) The observed mass spectrum (identification of the different masses is shown in Table 2) and (B) magnification of the ion at m/z 1028 that shows the Ru-isotope pattern (the calculated theoretical pattern is shown in the inset). | ||
Most of the ions shown in Fig. 4A have been identified and are listed in Table 2. In summary, the interaction of just one Asr3 molecule with the oligonucleotide has been detected showing peaks at m/z 1542 and 1028 that correspond to the doubly and triply charged ions, respectively, of Asr3 that has lost the chloride ligand to react with the oligonucleotide. The m/z 1028 (the most abundant ion in the spectrum) is magnified in Fig. 4B and compared with the calculated theoretical pattern (shown in the inset) to clearly observe the Ru isotope pattern in the molecules. Secondary reaction products were also detected that corresponded to the loss of the 1-CH3-PTA ligand (in addition to the chloride) and that can be seen at m/z 1457 and 971 (doubly and triply charged, respectively). Similarly, the ion at m/z 941 (triply charged) corresponds to the loss of the chloride and the PPh3 ligands. The doubly and triply charged ions of the excess of the oligonucleotide could be also detected at m/z 1166 and 779, respectively. These results pointed out also the attachment of a single Asr3 molecule to just one nucleotide (presumably dGMP) of the oligonucleotide even when the mass accuracy is relatively low (about 20 ppm) probably due to the low intensity of the obtained signals in the ESI-q-TOF (below 10% of the total intensity in most cases).
| m/z | z | Molecular structure | Lost ligands | Error (ppm) |
|---|---|---|---|---|
| 1542.8506 | 2 | [Ru{κ3(N,N,N)-Tp}(PPh3)(1-CH3-PTA)(Oligo)]2+ | Cl− | 22 |
| 1028.5654 | 3 | [Ru{κ3(N,N,N)-Tp}(PPh3)(1-CH3-PTA)(Oligo)]3+ | Cl− | 19 |
| 1456.8004 | 2 | [Ru{κ3(N,N,N)-Tp}(PPh3)(Oligo)]2+ | Cl−, 1-CH3-PTA | 23 |
| 971.8738 | 3 | [Ru{κ3(N,N,N)-Tp}(PPh3)(Oligo)]3+ | Cl−, 1-CH3-PTA | 25 |
| 1411.2840 | 2 | [Ru{κ3(N,N,N)-Tp}(1-CH3-PTA)(Oligo)]2+ | Cl−, PPh3 | 12 |
| 941.2088 | 3 | [Ru{κ3(N,N,N)-Tp}(1-CH3-PTA)(Oligo)]3+ | Cl−, PPh3 | 30 |
| 1168.7513 | 2 | [Oligo]2+ | — | 28 |
| 779.4998 | 3 | [Oligo]3+ | — | 24 |
Similarly to the case of the adduct of Asr3 and dGMP, the adduct between the oligonucleotide and Asr3 was chromatographically separated from the excess of the free drug (using size exclusion chromatography in this case, data not shown) and the concentration of Ru in both species was quantified using a similar strategy to that previously documented with inorganic Ru standards. In this case, only about 50% of the injected Ru concentration eluted from the column under the assayed conditions, probably due to the high hydrophobicity of the Asr3 complex. Out of it, less than 10% (about 91 ppb Ru) of the Ru was found as the free complex and the rest forms different adducts with the oligonucleotide (at higher molecular masses) in agreement with the qualitative results obtained by ESI-MS.
These results illustrate the complementary use of ICP-MS and ESI-MS that allows fully qualitative characterization of the adducts formed with the assayed Ru-containing compounds (mainly by ESI-MS) together with the quantitative aspects regarding the rate of formation of the complexes (unique feature of ICP-MS).
Tools to address other class of interactions of DNA with Ru-containing complexes
The hydrolysis of the metal–chloride bond in the synthesized Ru complexes appears to be important for activation, providing most likely aqua adducts that can bind to DNA, forming monofunctional adducts as previously observed. In fact, we have observed that Asr3 binds specifically to guanine when in competition with adenine, cytosine, and thymine nucleotides and similarly to the oligonucleotide. However, the possibility of complex intercalation between the DNA bases of similar compounds has also been recognized. To address if this was occurring simultaneously to DNA binding, a sample of calf thymus DNA was prepared and incubated with Asr3 for 24 h at 37 °C. The resulting products were analysed by SEC-ICP-MS (SEC fractionation range of 100–7000 Da) to detect potential adduct formations. Since the used Ru-complexes contain polycyclic planar aromatic or heterocyclic ring systems, they can potentially interact with double-stranded DNA by both coordination and intercalation modes of binding. Therefore, the same experiments were also conducted after DNA denaturalization before incubation (by heating at 95 °C). It was observed that the highest Ru-containing peak appears at the void volume of the column (>7000 Da) in both cases and contained also P (data not shown) revealing that this peak corresponds to the adducted product with DNA. Surprisingly, the highest Ru intensity (about 10-fold) has been observed when the incubation is conducted after DNA denaturalization (see ESI†). This could be due to the higher availability of the guanine containing residues in both DNA strands once they are separated by heat. Also, these results revealed that the intercalation of Asr3 between DNA strands did not seem to take place here. This could be concluded as the formed complex between Asr3 and calf thymus DNA increased upon the denaturation of DNA in contrast to the expected behaviour of metallo-intercalators.In this case, the use of SEC-ICP-MS permitted to address the absence of intercalation of Asr3 in DNA, however, modification of the DNA tertiary structure by drug intercalation is an important aspect of its molecular recognition by DNA processing proteins in the cell and therefore it is an important aspect of drug activity.27 Plasmid DNA is an excellent species to address such conformational changes since it may appear in one of the three following conformations: open-circular (OC), linear (L) and closed circular or supercoiled (SC) that run at different speeds in slab native agarose gel electrophoresis.27 A compound, that interacts with DNA and unwinds the DNA duplex, reduces the number of supercoils in closed circular DNA, which in turn causes a decrease in the rate of migration through the agarose gel and thus provides a means by which the effect can be monitored.27,28
Recently, the separation of the different isoforms of plasmid DNA by agarose gel electrophoresis coupled on-line to ICP-MS detection of P has been described.29 Here, the suitability of this new methodology to monitor the unwinding induced in supercoiled plasmid DNA by Ru-complexes was tested for the Ru–pybox complexes: [RuCl2 (PTA){κ3(N,N,N)-2,6-bis(4′-phenyl-oxazolin-2′-yl)pyridine}], Ru–Ph–pybox, and [RuCl2(PTA) {κ3(N,N,N)-2,6-bis(4′-isopropyl-oxazolin-2′-yl)pyridine}], Ru–iPr–pybox. It should be noticed that the Ru–Ph–pybox and Ru–iPr–pybox complexes studied have proved to be neutral in aqueous solution (they did not exhibit any trend to dissociate by losing the halide). Therefore, it is expected that their association with DNA should occur by intercalation rather by binding to the nucleobases. In this regard, Fig. 5 shows the GE-ICP-MS electropherograms obtained from experiments in which the Ru–Ph–pybox and Ru–iPr–pybox complexes were independently incubated in the dark for 2 and 18 h with the isolated plasmid pBluescript in its supercoiled form (natural form). After two hours of incubation (Fig. 5A and B) it is possible to observe only one peak containing Ru and P at 25 min of the plasmid in its supercoiled form. Therefore, this peak can be ascribed to a Ru complex associated with the supercoiled plasmid. However, after 18 h of incubation (Fig. 5C and D) the peak at 25 min decreases while a new peak containing Ru and P appears at 30 min presenting the plasmid in the open circular form (by comparing the migration times obtained in a previous work). According to these results, it seems that both Ru–pybox complexes are able to interact with plasmid DNA changing the conformation of the plasmid from supercoiled to circular form. Comparison of the relative intensities of the peaks at 25 and 30 min in Fig. 5C and D for the two Ru–pybox complexes shows that the complex bearing the pybox ligand with isopropyl substituents (Ru–iPr–pybox) distorts DNA more severely than the complex with phenyl substituents in the pybox ligand (Ru–Ph–pybox). This could be simply ascribed to the different solubility of both complexes in buffered solution which is higher in the case of Ru–iPr–pybox, as previously documented.17
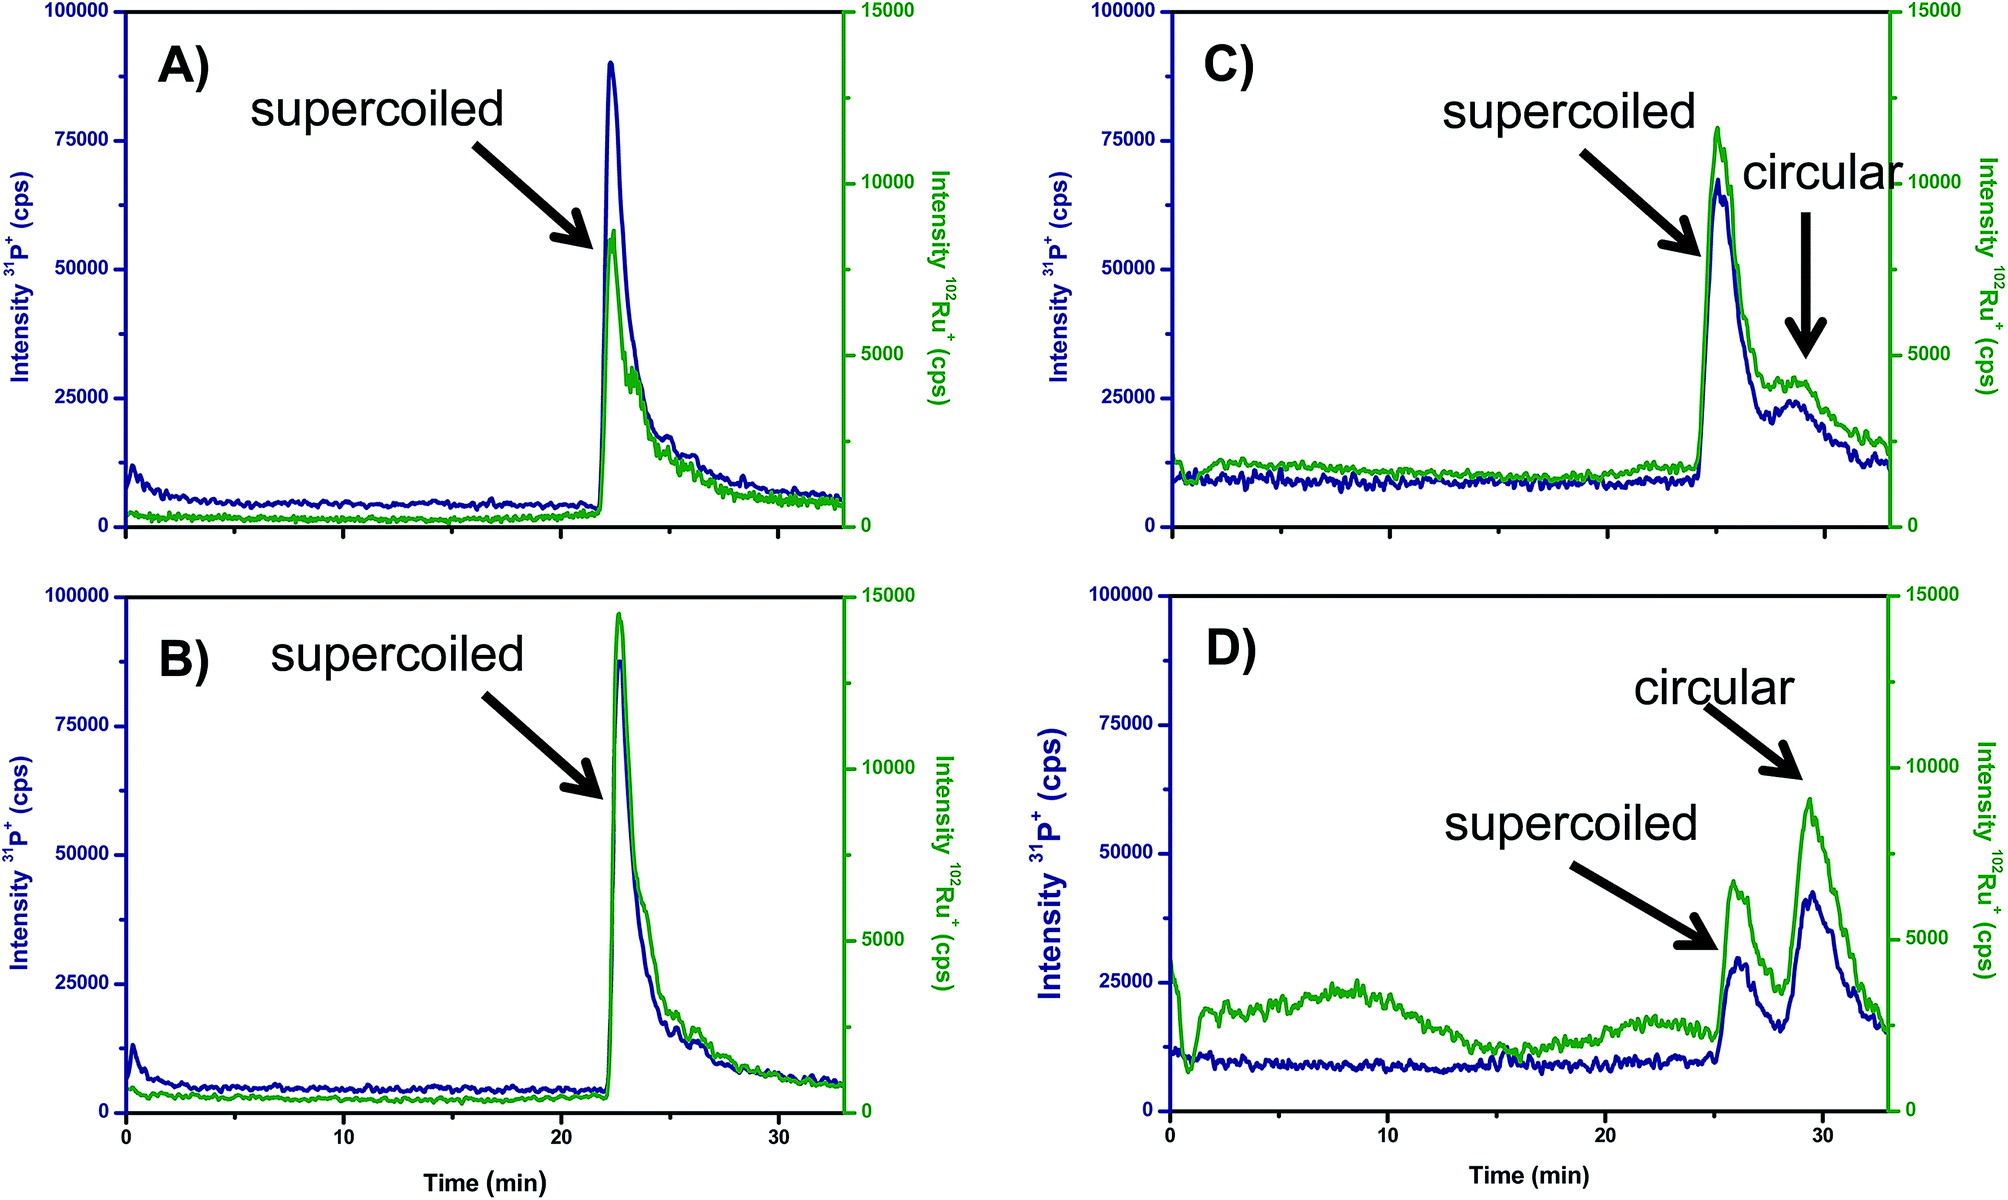 | ||
| Fig. 5 Separation by agarose gel electrophoresis using ICP-MS detection of the reaction products obtained by the interaction of plasmid DNA with the Ru–Pybox complexes. (A) Electropherogram of Ru–Ph–pybox + plasmid DNA after 2 h of incubation, (B) electropherogram of Ru–iPr–pybox + plasmid DNA after 2 h of incubation, (C) electropherogram of Ru–Ph–pybox + plasmid DNA after 18 h of incubation and (D) electropherogram of Ru–iPr–pybox + plasmid DNA after 18 h of incubation. Experimental conditions are summarized in the text. | ||
Therefore, the applied GE-ICP-MS hybrid technique seems to be an ideal tool not only to address the intercalation of metal into intact DNA but also to obtain the degree of modification of the DNA structure (changes in configuration from supercoiled to circular or even linear). In addition, by measuring the peak areas, the degree of modification in the initial DNA can be directly extracted from the ICP-MS signals.
Conclusions
The coupling of different separation strategies to ICP-MS as a specific and sensitive multielemental detector was evaluated here for developing analytical strategies that are able to study the reactivity of new potential anticancer Ru(II) complexes towards DNA. The reversed-phase capillary HPLC-ICP-MS coupling can serve as a feasible tool for monitoring the interactions of different Ru(II)–Tp complexes containing phosphane ligands with DNA nucleotides. Among the four complexes studied, the [RuCl{κ3(N,N,N)-Tp}(PPh3)(1-CH3-PTA)]+ named Asr3 showed higher reaction yields with dGMP and the resulting Asr3–dGMP monoadduct could be chromatographically separated from the free complex and the excess of the nucleotide. Such interaction was further proved by using an oligonucleotide containing a single guanine residue (5′-TCCTGTCC-3′) and analyzing the resulting product by ESI-q-TOF as a complementary technique. Furthermore, the positive interaction of the same Ru complex (Asr3) with calf thymus DNA was successfully studied by a hyphenated SEC-ICP-MS methodology which showed that the interaction was significantly increased when the DNA was denatured by heating before conducting the incubation with the Asr3 complex. Finally, the GE-ICP-MS set-up demonstrated, for the first time, to be a powerful tool to monitor conformational changes in plasmid DNA induced by interactions with the two new Ru(II)–pybox complexes.It is clear that a greater understanding of the factors that control the reactivity of metal complexes towards DNA as a potential target is an essential step towards the rational development of improved metal chemotherapeutic agents and the results present here confirm the important and growing role that ICP-MS is gaining in the field of metal complex–DNA interaction studies.
Acknowledgements
The authors want to thank the financial support for the experimental work from the Ministry of Science and Technology of Spain through the projects CTQ2010-16638, CTQ2011-23038 and CTQ2011-26481. L. López acknowledges her fellowship from PCTI (IB08-032) and M. Corte for his “Severo Ochoa” contract (PCTI-Principado de Asturias).References
- Y. Jung and S. J. Lippard, Chem. Rev., 2007, 107, 1387–1407 CrossRef CAS PubMed.
- Y. Xin, K. Panichpisal, N. Kurtzman and K. Nugent, Am. J. Med. Sci., 2007, 334, 115–124 CrossRef PubMed.
- L. Kelland, Nat. Rev. Cancer, 2007, 7, 573–584 CrossRef CAS PubMed.
- G. Sava, A. Bergamo and P. J. Dyson, Dalton Trans., 2011, 9069–9075 RSC.
- P. C. A. Bruijnincx and P. J. Sadler, Adv. Inorg. Chem., 2009, 61, 1–62 CrossRef CAS.
- A. Bergamo, C. Gaiddon, J. H. M. Schellens, J. H. Beijnen and G. Sava, J. Inorg. Biochem., 2012, 106, 90–96 CrossRef CAS PubMed.
- E. Gallori, C. Vettori, E. Alessio, F. G. Vilchez, R. Vilaplana, P. Orioli, A. Casini and L. Messori, Arch. Biochem. Biophys., 2000, 376, 156–162 CrossRef CAS PubMed.
- V. Brabec and O. Novakov, Drug Resist. Updates, 2006, 9, 111–122 CrossRef CAS PubMed.
- M. Groessl, Y. O. Tsybin, C. G. Hartinger, B. K. Keppler and P. J. Dyson, J. Biol. Inorg. Chem., 2010, 15, 677–688 CrossRef CAS PubMed.
- C. X. Zhang and S. J. Lippard, Curr. Opin. Chem. Biol., 2003, 7, 481–489 CrossRef CAS.
- C. G. Hartinger, S. Zorbas-Seifried, M. A. Jakupec, B. Kynast, H. Zorbas and B. K. Keppler, J. Inorg. Biochem., 2006, 100, 891–904 CrossRef CAS PubMed.
- J. M. Rademaker-Lakhai, D. Van den Bongard, D. Pluim, J. H. Beijnen and J. H. M. Schellens, Clin. Cancer Res., 2004, 10, 3717–3727 CrossRef CAS PubMed.
- W. Han Ang, A. Casini, G. Sava and P. J. Dyson, J. Organomet. Chem., 2011, 696, 989–998 CrossRef PubMed.
- C. Scolaro, A. Bergamo, L. Brescacin, R. Delfino, M. Cocchietto, G. Laurenczy, T. J. Geldbach, G. Sava and P. J. Dyson, J. Med. Chem., 2005, 48, 4161–4171 CrossRef CAS PubMed.
- P. J. Dyson, C. Scolaro, A. B. Chaplin, C. G. Hartinger, A. Bergamo, M. Cocchietto, B. K. Keppler and G. Sava, Dalton Trans., 2007, 5065–5072 Search PubMed.
- A. García-Fernández, J. Díez, A. Manteca, J. Sánchez, R. García-Navas, B. G. Sierra, F. Mollinedo, M. P. Gamasa and E. Lastra, Dalton Trans., 2010, 10186–10196 RSC.
- E. Menéndez-Pedregal, J. Díez, A. Manteca, J. Sánchez, A. C. Bento, R. García-Navas, F. Mollinedo, M. P. Gamasa and E. Lastra, Dalton Trans., 2013, 13955–13967 RSC.
- C. G. Hartinger, M. Groessl, S. M. Meier, A. Casini and P. J. Dyson, Chem. Soc. Rev., 2013, 42, 6186–6199 RSC.
- D. García Sar, M. Montes-Bayón, L. A. Ortiz, E. Blanco González, L. M. Sierra and A. Sanz-Medel, Anal. Bioanal. Chem., 2008, 390, 37–44 CrossRef PubMed.
- A. R. Timerbaev, K. Pawlak, C. Gabbiani and L. Messori, TrAC, Trends Anal. Chem., 2011, 30, 1120–1138 CrossRef CAS PubMed.
- A. R. Timerbaev and S. Sturup, Curr. Drug Metab., 2012, 13, 272–283 CrossRef CAS.
- A. K. Bytzek, K. Boeck, G. Hermann, S. Hann, B. K. Keppler, C. G. Hartinger and G. Koellensperger, Metallomics, 2011, 3, 1049–1055 RSC.
- M. Matczuk, M. Prządka, S. S. Aleksenko, Z. Czarnocki, K. Pawlak, A. R. Timerbaev and M. Jarosz, Metallomics, 2014, 6, 147–153 RSC.
- W. Brüchert and J. Bettmer, Anal. Chem., 2005, 77, 5072–5075 CrossRef PubMed.
- W. Brüchert, A. Helfrich, N. Zinn, T. Klimach, M. Breckheimer, H. Chen, S. Lai, T. Hoffmann and J. Bettmer, Anal. Chem., 2007, 79, 1714–1719 CrossRef PubMed.
- H. M. Chen, J. A. Parkinson, R. E. Morris and P. J. Sadler, J. Am. Chem. Soc., 2003, 125, 173–186 CrossRef CAS PubMed.
- M. V. Keck and S. J. Lippard, J. Am. Chem. Soc., 1992, 114, 3386–3390 CrossRef CAS.
- O. Novakova, H. Chen, O. Vrana, A. Rodger, P. J. Sadler and V. Brabec, Biochemistry, 2003, 42, 11544–11554 CrossRef CAS PubMed.
- L. López-Fernández, M. Montes-Bayón, E. Blanco-González, L. M. Sierra, A. Sanz-Medel and J. Bettmer, J. Anal. At. Spectrom., 2011, 26, 195–200 RSC.
Footnotes |
| † Electronic supplementary information (ESI) available. See DOI: 10.1039/c4ja00308j |
| ‡ These two authors contributed equally to the present work. |
| This journal is © The Royal Society of Chemistry 2015 |