
Liquid sampling-atmospheric pressure glow discharge excitation of atomic and ionic species†
Stefanie
Konegger-Kappel
a,
Benjamin T.
Manard
b,
Lynn X.
Zhang
a,
Thomas
Konegger
c and
R. Kenneth
Marcus
*a
aDepartment of Chemistry, Clemson University, Clemson, South Carolina 29634, USA. E-mail: marcusr@clemson.edu
bChemistry Division – Actinide Analytical Chemistry, Los Alamos National Laboratory, Los Alamos, New Mexico 87544, USA
cDepartment of Materials Science and Engineering, Clemson University, Clemson, South Carolina 29634, USA
First published on 10th November 2014
Abstract
The liquid sampling-atmospheric pressure glow discharge (LS-APGD) was characterized with respect to the effects of interrelated operational source parameters on the excitation of atomic (I) and ionic (II) states for expanding the fundamental understanding of this microplasma's characteristics as an excitation source for optical emission spectroscopy (OES) analyses. Parameters that were investigated for identifying the key driving forces for atomic and ionic excitation conditions were discharge current, interelectrode gap, and He sheath and counter gas flows. The addition of the He counter gas flow allowed assessment of the additional parameter relevant when aerosol samples are introduced following laser ablation sampling of solid matrices. The introduction of the analytes (500 μg g−1 copper and zinc in 2% HNO3) in liquid form through the solution capillary permitted the investigation of source parameter effects, without introducing additional influences from solid sampling such as heterogeneous particle populations. Individual driving forces for excitation/ionization conditions and inter-parametric dependencies were assessed by changing the operating conditions according to a design of experiment (DOE) plan and monitoring Zn and Cu atomic and ionic emission lines (Zn I 213.9 nm, Cu I 324.7 nm, Zn I 481.1 nm, and Zn II 202.5 nm). Pareto plots of standardized effects were used for evaluating levels of significance as well as magnitudes of both individual and inter-active parametric effects on emission responses, background emissions and signal-to-background ratios as well as the LS-APGD's tolerance against changes in excitation conditions (i.e. robustness). The results indicate that parameter settings leading to high plasma power density are the key driving forces for enhanced analyte emission, with the inter-electrode distances showing the most pronounced influences for the investigated parameter space.
Introduction
Prompt availability of chemical (i.e. elemental and/or molecular) information is of particular importance in scenarios demanding rapid responses; e.g., environmental contaminations with heavy metals or nuclear materials. These issues need to be addressed rapidly in the field conversely to time-consuming sample transport back to the laboratory. However, a pre-requisite example for in-field analyses is the portability, and thus the size and power requirements, of analytical instrumentation. Hence, miniaturization of instrumentation for chemical analysis has been pursued since the 1970s,1 not only because of its potential regarding field deployment, but also because of reduced consumption of chemical reagents, reduced waste generation, low operating costs, timeliness of results, and ease of use. Considering atomic and molecular spectrometry, so-called microplasmas (microdischarges) have seen great interest over the last decade,2–4 with their operation under atmospheric pressure also opening new doors for, for example, plasma based lab-on-the-chip designs.5,6Atmospheric pressure glow discharge (APGD) plasmas that employ a liquid (electrolytic solution) solution as one discharge electrode show promising performance as excitation and ionization source for elemental analysis, with the basic design concept — the electrolyte cathode atmospheric glow discharge (ELCAD) — first proposed by Cserfalvi et al.7 in 1993. Since then, multiple sources that are based on employing a liquid electrode have been investigated,8 and are thoroughly discussed in two recent reviews by He et al.9 and Jamroz et al.10 A unique alternative design of the APGD is the liquid sampling-atmospheric pressure glow discharge (LS-APGD) microplasma developed by Marcus and co-workers.11 The main differences to the ELCAD are its operation in a “total consumption“ mode (no liquid waste generation), which is permitted by low liquid solution flow rates (<300 μL min−1) and the high plasma power density (>10 W mm−3) of the relatively small plasma volume (∼1 mm3). Up to now, the LS-APGD has proven useful as excitation/ionization source not only for liquid sample analyses with optical emission spectroscopy (OES)11–15 and mass spectrometry (MS),16–18 but also for the analysis of laser ablation (LA)-generated aerosol particles.12,19–21 The microplasma has also been employed for the analysis of molecular species when used as ambient desorption/ionization (ADI) source.22 Overall, the LS-APGD offers a small footprint (components mounted on a 25 cm × 30 cm optical breadboard) and is operated with low power (<100 W), low gas (<1 L min−1) and solution flow rates (<300 μL min−1). Thus, one could even envision the ability to fit the entire instrumental apparatus in the volume of a suitcase, making it a candidate for in-field analysis.
However, a pre-requisite for the LS-APGD's in-field application is the fundamental understanding of the source's characteristics for elemental analysis and a full assessment of the LS-APGD's merits, limitations, and usefulness as an excitation/ionization source. Therefore, recent studies have focused on the investigation of inter-parametric dependencies (discharge current, interelectrode gap and He sheath gas flow rate) on plasma temperature characteristics12 (gas-rotational, excitation and ionization temperatures) and on plasma robustness upon the introduction of matrix elements in case of both liquid13,23 and solid (i.e., laser ablation)21 sampling. While these studies, employing an optical emission spectrometer (OES) for the analysis, provided great insight into the plasma physics of the LS-APGD, more in-depth knowledge regarding the excitation/ionization conditions is required in order to gain a more complete understanding of the source's mechanisms at an atomic level. In the case of the LS-APGD's application as ionization source for mass spectrometric analyses, a recently performed full inter-parametric investigation,16 in which the effects of operating parameters on atomic ion responses, background levels, signal-to-background ratios, and atomic-to-oxide/hydroxide adduct ratios were monitored, showed that discharge current and liquid sampling flow rate were key aspects influencing the spectral composition. Considering OES analyses, the influence of plasma operating conditions (three parameters) on Cu atomic emission response following laser ablation sampling was so far independently investigated by looking at only one parameter at a time.20,21 However, an inter-parametric approach is considered as crucial for gaining a deeper understanding of the actual driving forces for both atomic and ionic emission. For example, optimizing the LS-APGD for a less pronounced spectral background emission could simplify the spectra, reducing spectral interferences.
Generally, Zn is considered as a strong test element for investigating plasma characteristics as it yields a relatively simple spectrum, atomic and ionic emission lines that are close together in wavelength (e.g., Zn II 202.5 nm, Zn II 206.2 nm and Zn I 213.9 nm; Zn I 472.2 nm and Zn I 481.1 nm) and of comparable emission intensities, which is of advantage in terms of cancelling out detector effects.24 Zn II (206.2 nm)![[thin space (1/6-em)]](https://www.rsc.org/images/entities/char_2009.gif) :Zn I (213.9 nm) (ionic-to-atomic) ratios have been employed by Chan and Hieftje,24 and Dennaud et al.25 for assessing ICP plasma robustness. Moreover, another element that has proven valuable for studying excitation mechanisms is Cu; for example applied for determining emission characteristics of a low-pressure laser-induced plasma.26,27 Generally, Cu and Zn find widespread use in fundamental laser ablation (LA and laser induced breakdown spectroscopy (LIBS)) research, where brass samples are typically either analyzed for plasma characterization studies28–31 or for gaining insights into fractionation effects.32–34 The usefulness of monitoring both elements in LA studies is mainly based on their thermal properties (e.g., boiling points and metal–oxide bond dissociation energies).
:Zn I (213.9 nm) (ionic-to-atomic) ratios have been employed by Chan and Hieftje,24 and Dennaud et al.25 for assessing ICP plasma robustness. Moreover, another element that has proven valuable for studying excitation mechanisms is Cu; for example applied for determining emission characteristics of a low-pressure laser-induced plasma.26,27 Generally, Cu and Zn find widespread use in fundamental laser ablation (LA and laser induced breakdown spectroscopy (LIBS)) research, where brass samples are typically either analyzed for plasma characterization studies28–31 or for gaining insights into fractionation effects.32–34 The usefulness of monitoring both elements in LA studies is mainly based on their thermal properties (e.g., boiling points and metal–oxide bond dissociation energies).
The aim of the present study is expanding the fundamental understanding of the LS-APGD microplasma's characteristics as an excitation source with respect to the effects of the interrelated source parameters (discharge current, electrode distance, He sheath and counter flow rate) on particular excitation conditions for the operational situation where the LS-APGD is coupled to a laser ablation solid sample introduction system,12,20 where a counter-flow of helium carrier gas (for LA particles) is directing into the plasma via a hollow counter electrode. This is in contrast to the operational situation where liquid samples are directly introduced into the plasma via a solution capillary and a solid counter electrode is employed for sustaining the plasma between the liquid flow and the solid electrode (no He counter flow).14,15 As the He counter flow presents an additional parameter influencing the analysis, inter-parametric dependencies of four parameters have to be taken into account and investigated for the LA-LS-APGD set-up. We have recently reported an analogous study of inter-parametric dependencies for the case of analyzing liquid samples via mass spectrometry,16 for which a very different electrode geometry, parameter space (i.e., much lower discharge currents and solution flow rates), and analytical sampling mechanism are employed. Different from the case of LA-LS-APGD-OES measurements, the analytes were introduced through the liquid electrolyte solution, alleviating the influence of the vaporization of heterogeneous particle populations from the equation. Excitation/ionization conditions were assessed by monitoring Zn and Cu atomic and ionic transitions while changing operating parameters according to a design of experiment (DOE) measurement plan. The extent of excitation is assessed by separately evaluating the atomic and ionic emission responses, while ionic:atomic (II:I) ratios give insight into the LS-APGD's tolerance against changing excitation conditions (i.e., robustness). Pareto plots are used to assess the level of influence of the various discharge parameters on these responses. It is believed that such knowledge is not only important for optimized plasma operation, but also for further source developments.
Experimental
LS-APGD source
Generally, the LS-APGD physical set-up can be easily modified to meet the needs for analyzing different aggregation states (liquid, solid), and for gaining elemental, isotopic, and/or molecular information by coupling the source either to an optical emission or mass spectrometer.11–21 Here, the LS-APGD microplasma source was sustained between the electrolytic test solution (500 μg g−1 Cu and Zn in 2% HNO3 (both single element standards CPI International, Santa Rosa, CA, USA)) and a hollow stainless steel counter electrode (316 SS, 1.2 mm i.d., 1.6 mm o.d., IDEX Health and Science, Oak Harbor, WA, USA). The use of such high test solution concentrations, versus previously determined single-μg mL−1 detection limits,14 allows reasonable emission response levels under non-ideal conditions across the parameter space. The reason for employing a hollow counter electrode was to maintain the same set-up as in previous studies aiming at the investigation of plasma characteristics (i.e. rotational and excitation temperatures, electron number densities, and plasma robustness),12 and parametric dependences on particle loading.21 Photographic images of the LS-APGD-OES set-up are depicted in Fig. 1. Diagrammatic representations can be found elsewhere.14,21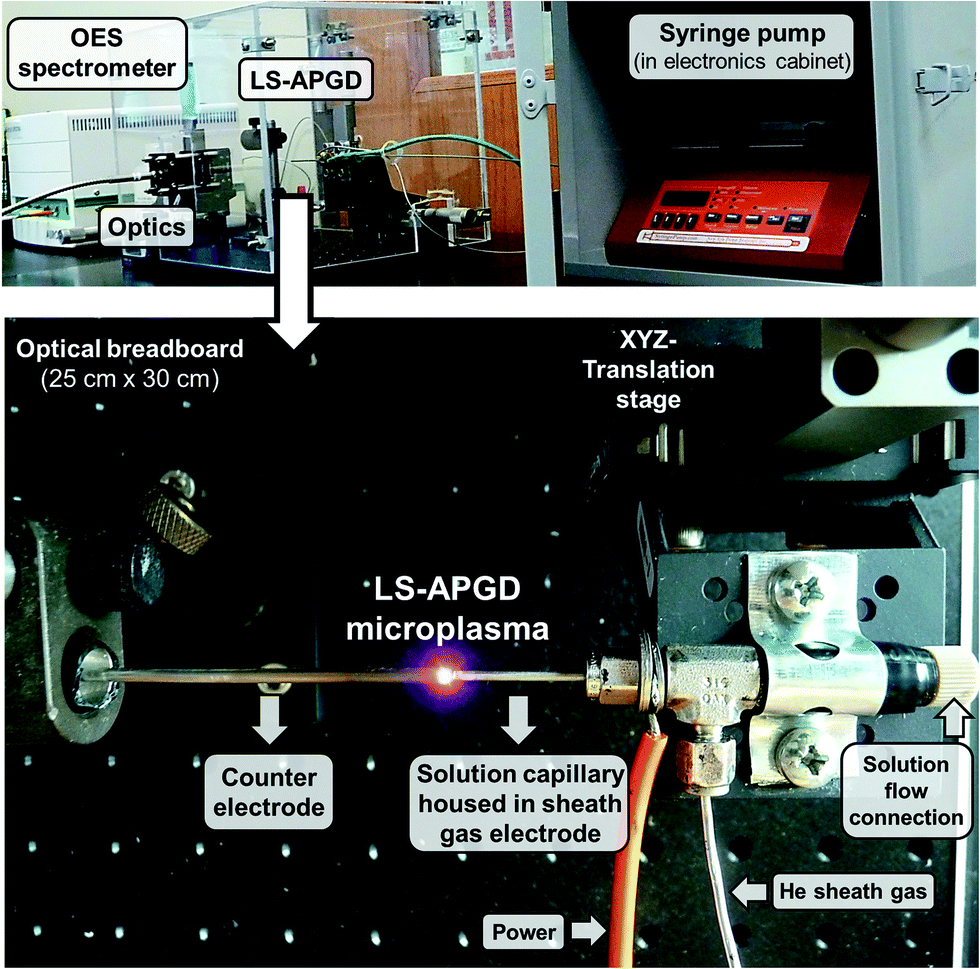 | ||
| Fig. 1 Representation of the LS-APGD-OES apparatus. The electrodes are mounted within a safety box to ensure electrical safety and eye protection against plasma radiation. | ||
The electrolytic, analyte-containing solution was introduced through a fused-silica coated metal capillary (280 μm i.d., 580 μm o.d., Restek Corporation, Bellefonte, PA, USA) housed within in a hollow, stainless steel capillary (316 SS, 0.8 mm i.d., 1.6 mm o.d., IDEX Health and Science, Oak Harbor, WA, USA). This assembly was mounted onto a translational stage (460P-XYZ, Newport Corporation, Irvine, CA, USA). A continuous electrolytic flow of 150 μL min−1 was maintained by means of a syringe pump (NE-1000, New Era Pump Systems, Inc., Farmingdale, NY, USA). The helium sheath/cooling gas was introduced between the capillary and the sheath gas electrode. The counter electrode was held at a fixed, perpendicular position (i.e. 180° geometry14) relative to the liquid electrode assembly, with the relative position of the two electrodes controlled by the translational stage. Both the He sheath and counter gas flows were regulated by individual mass flow controllers (0-1 SLPM, MC-1SLPM-D, Alicat Scientifc, Inc., Tucson, AZ, USA), that were connected to one gas line from the primary source by means of a tee-piece (Swagelok, Solon, OH, USA).
Power for the microplasma operation was provided by a high voltage power supply (3 kV, 0–200 mA, SL3PN600, Spellman High Voltage Electronics Corporation, Hauppauge, NY, USA) operating in constant current (d.c.) mode with a negative voltage output. A ballast resistor (10 kΩ, 225 W, Vishay Intertechnology, Inc., Malvern, PA, USA) was placed in-line between the power supply and the sheath gas electrode, while the counter electrode was held at ground potential. It should be mentioned that previous studies14,15 showed that powering the counter electrode is advantageous with regards to emission response of solution-introduced analytes. However, in this study the solution electrode was powered in order to maintain the same set-up as employed for the OES analysis of laser ablation aerosols.20 Holding the counter electrode at ground potential, and powering the solution electrode, is considered advantageous for LA introduction in terms of circumventing aerosol charging effects. Moreover, in comparison to a solid counter electrode, a He counter gas flow permits use of high (>40 mA) discharge currents as it acts as a cooling gas, preventing electrode degradation from high temperature oxidation, which potentially results in non-stable plasma operation.
Optical emission spectrometer
Optical emission measurements were performed employing a five-channel, broad wavelength optical spectrometer (Aurora, Applied Spectra, Inc., Fremont, CA, USA) equipped with a CCD linear array detector module, which allows the simultaneous acquisition of all spectra regions (190 nm to 884 nm). LS-APGD microplasma emission was collected by focusing the entire plasma image onto a multi-channel optical fiber bundle which delivered the emission to the separate spectrometer channels. Plasma image focus (∼1:1) was accomplished by means of a UV fused silica biconvex lens (25.4 mm diameter, 35 mm focal length, Thorlabs, Inc., Newton, NJ, USA) that was mounted at an object distance that allowed the collection of the whole plasma emission at its maximum lateral elongation (∼4 mm). The lateral plasma elongation is defined by the maximum distance between the two electrodes, and thus the plasma size varies with the size of the electrode gap. In order to make sure that data acquisition was accomplished under optimal plasma collection conditions, the lateral lens position was spatially optimized according to changing electrode distances by moving the x-axis of the translational stage (460P-XYZ, Newport Corporation, Irvine, CA, USA) onto which the lens was mounted by means of optomechanical cage system components (Thorlabs, Inc., Newton, NJ, USA). Data acquisition was accomplished using the ‘Aurora’ Data Analysis Software (Applied Spectra, Inc., Fremont, CA, USA). Individual spectra (190 nm to 884 nm) were derived from accumulating 100 individual spectra, employing a repetition rate of 10 Hz, a delay time of 1 μs, and an integration time of 1.05 ms (spectral resolution < 0.1 nm in the UV-VIS range).
Spectral data processing
Spectra acquired in the ‘Aurora’ Data Analysis Software were exported as Microsoft Office Excel files for further data processing. Zn and Cu emission lines for investigating the LS-APGD's excitation conditions were selected (see below) upon their emission responses for the individual conditions. While three atomic (Zn I 213.9 nm, Zn I 472.2, Zn I 481.1 nm) and two ionic line (Zn II 202.5 nm and Zn II 206.2 nm) emission responses were evaluated for Zn, only one Cu atomic transition (Cu I 324.7 nm) was evaluated. The background values employed for both background subtraction and signal-to-background ratios (SBR) for Zn emission lines were calculated by averaging ten pixels at each side of the transition, beginning five pixels away from the center of the peak. Because of the presence of emission lines in the ten pixel vicinity of the Cu I 324.7 nm emission line, the background was calculated by only averaging 3 and 2 pixels on the left and the right side, respectively, of the peak. Background correction was accomplished by subtracting the averaged background from the centerpoint pixel (peak height) of the emission peak. SBRs were calculated by normalizing the background corrected signal intensity at the centerpoint with the average background.Design of experiment (DOE)
The investigation of the parametric driving forces (current, distance between the electrodes, He sheath gas, and He counter flow) for atomic and ionic state excitation in the LS-APGD microplasma was accomplished following an experimental plan (i.e. response surface methodology) that was designed using the Statgraphics® Plus software (Statpoint Technologies, Inc., Warrenton, VA, USA). The full factorial central composite design (2^4 + star, orthogonal design characteristic), with which the effects of the four experimental factors were investigated, resulted in 120 runs. Replicates (4 replicates per condition) and centerpoints (6 per replicate) were randomly placed, which resulted in 25 conditions, including the centerpoint condition. Table 1 lists the parameters, the investigated parameter space, as well as the different DOE conditions. The investigated parameter space was chosen in a way so that stable plasma operation was guaranteed applying even boundary operating conditions (i.e. star points of the full factorial central composite design). The parameter space was assessed in a preliminary study by monitoring which operating conditions, and combinations, still yielded a response for the most dominant Zn (Zn I 481.1 nm) and Cu (Cu I 324.7 nm) neutral atomic emission lines.| Parameter | Current/mA | Electrode gap/mm | He sheath gas flow rate/L min−1 | He counter gas flow rate/L min−1 | |
|---|---|---|---|---|---|
| Parameter space | 50.0–60.0 | 1.5–3.0 | 0.6–0.8 | 0.12–0.20 | |
| Boundary conditions | 46.4, 63.6 | 1.0, 3.5 | 0.5, 0.9 | 0.09, 0.23 | |
| a Centerpoint condition. | |||||

|
1 | 46.4 | 2.3 | 0.7 | 0.16 |
| 2 | 50.0 | 1.5 | 0.6 | 0.12 | |
| 3 | 50.0 | 1.5 | 0.6 | 0.20 | |
| 4 | 50.0 | 1.5 | 0.8 | 0.12 | |
| 5 | 50.0 | 1.5 | 0.8 | 0.20 | |
| 6 | 50.0 | 3.0 | 0.6 | 0.12 | |
| 7 | 50.0 | 3.0 | 0.6 | 0.20 | |
| 8 | 50.0 | 3.0 | 0.8 | 0.12 | |
| 9 | 50.0 | 3.0 | 0.8 | 0.20 | |
| 10 | 55.0 | 1.0 | 0.7 | 0.16 | |
| 11 | 55.0 | 2.3 | 0.5 | 0.16 | |
| 12 | 55.0 | 2.3 | 0.7 | 0.09 | |
| 13a | 55.0 | 2.3 | 0.7 | 0.16 | |
| 14 | 55.0 | 2.3 | 0.7 | 0.23 | |
| 15 | 55.0 | 2.3 | 0.9 | 0.16 | |
| 16 | 55.0 | 3.5 | 0.7 | 0.16 | |
| 17 | 60.0 | 1.5 | 0.6 | 0.12 | |
| 18 | 60.0 | 1.5 | 0.6 | 0.20 | |
| 19 | 60.0 | 1.5 | 0.8 | 0.12 | |
| 20 | 60.0 | 1.5 | 0.8 | 0.20 | |
| 21 | 60.0 | 3.0 | 0.6 | 0.12 | |
| 22 | 60.0 | 3.0 | 0.6 | 0.20 | |
| 23 | 60.0 | 3.0 | 0.8 | 0.12 | |
| 24 | 60.0 | 3.0 | 0.8 | 0.20 | |
| 25 | 63.6 | 2.3 | 0.7 | 0.16 | |
The DOE methodology was regarded as essential for this study as it allowed an efficient evaluation of the relevance of each parameter, without neglecting inter-parametric dependencies. Moreover, it allows for not only locating optimal operation settings but also to gain further insights into the key aspects affecting the operation. Zn and Cu atomic and ionic emission lines were optically monitored after changing the parameters according to the conditions determined in the DOE plan. The effect of each parameter as well as of their interactions (interactive effects; i.e. current*electrode distance, current*He sheath gas flow, current*He counter flow, electrode distance*He sheath gas flow, etc.) were displayed in Pareto plots of standardized effects, which allowed for visualizing the significance of parametric changes. In such Pareto plots,35 standardized effects are displayed in form of bars, the lengths of which are proportional to the magnitude of the standardized effects, and which are sorted according to decreasing degrees of influence. A vertical reference line indicates the significance level (i.e. α = 0.05). Bars that extend to the right of this line are indicating effects, the changes of which are statistically significant at a 95% confidence level.35
Results and discussion
Selection of emission lines
While a typical plasma emission (background) spectrum is shown elsewhere,12 a representative spectrum of the monitored atomic, ionic and molecular species are presented in Fig. 2. As Zn and Cu are common test elements in the evaluation of spectrochemical sources, there is a fairly common suite of emission lines which are used for basic characterizations of emission sources. Emission responses were initially evaluated for three Zn atomic transitions (213.9 nm, 472.2 nm, 481.1 nm), two Zn ionic lines (202.5 nm and 206.2 nm), two Cu atomic lines (324.7 nm, 327.4 nm) and one Cu II ionic line (331.6 nm). As both Cu I 327.4 nm and Cu II 331.6 nm were substantially interfered with by the continuum emission of the N2 second positive molecular system (C3Πu–B3Π), the Cu I 324.7 nm line was considered as the most appropriate for this study. The N2 band structure (Fig. 2b) might arise from excitation of nitrogen present in the liquid HNO3 matrix solution, but more likely from the ambient N2 surrounding the plasma. In the case of non-varying operating conditions, the most relevant approach for correcting for the continuum emission would be a simple subtraction in the course of introducing the matrix blank (2% HNO3). However, very stable, continuous introduction of the test solution by means of a syringe pump was deemed more appropriate here versus discrete injections in order to get a “steady state” picture. As described above, based on the N2 band interference, only the Cu I 324.7 (Fig. 2b) nm was employed here, while a suite of two atomic (Fig. 2a and c) and one ionic Zn (Fig. 2a) transitions were employed for evaluation. The spectroscopic properties of the Zn and Cu emission lines are given in Table 2. The breadth of properties set up a good matrix for evaluating excitation conditions as the Zn I 213.9 nm and Cu I 324.7 nm transitions are both resonant in nature, the Zn I 481.1 nm transition has a high excited state energy, but is not resonant, and the Zn II 202.5 nm transition represents the production of excited state ions.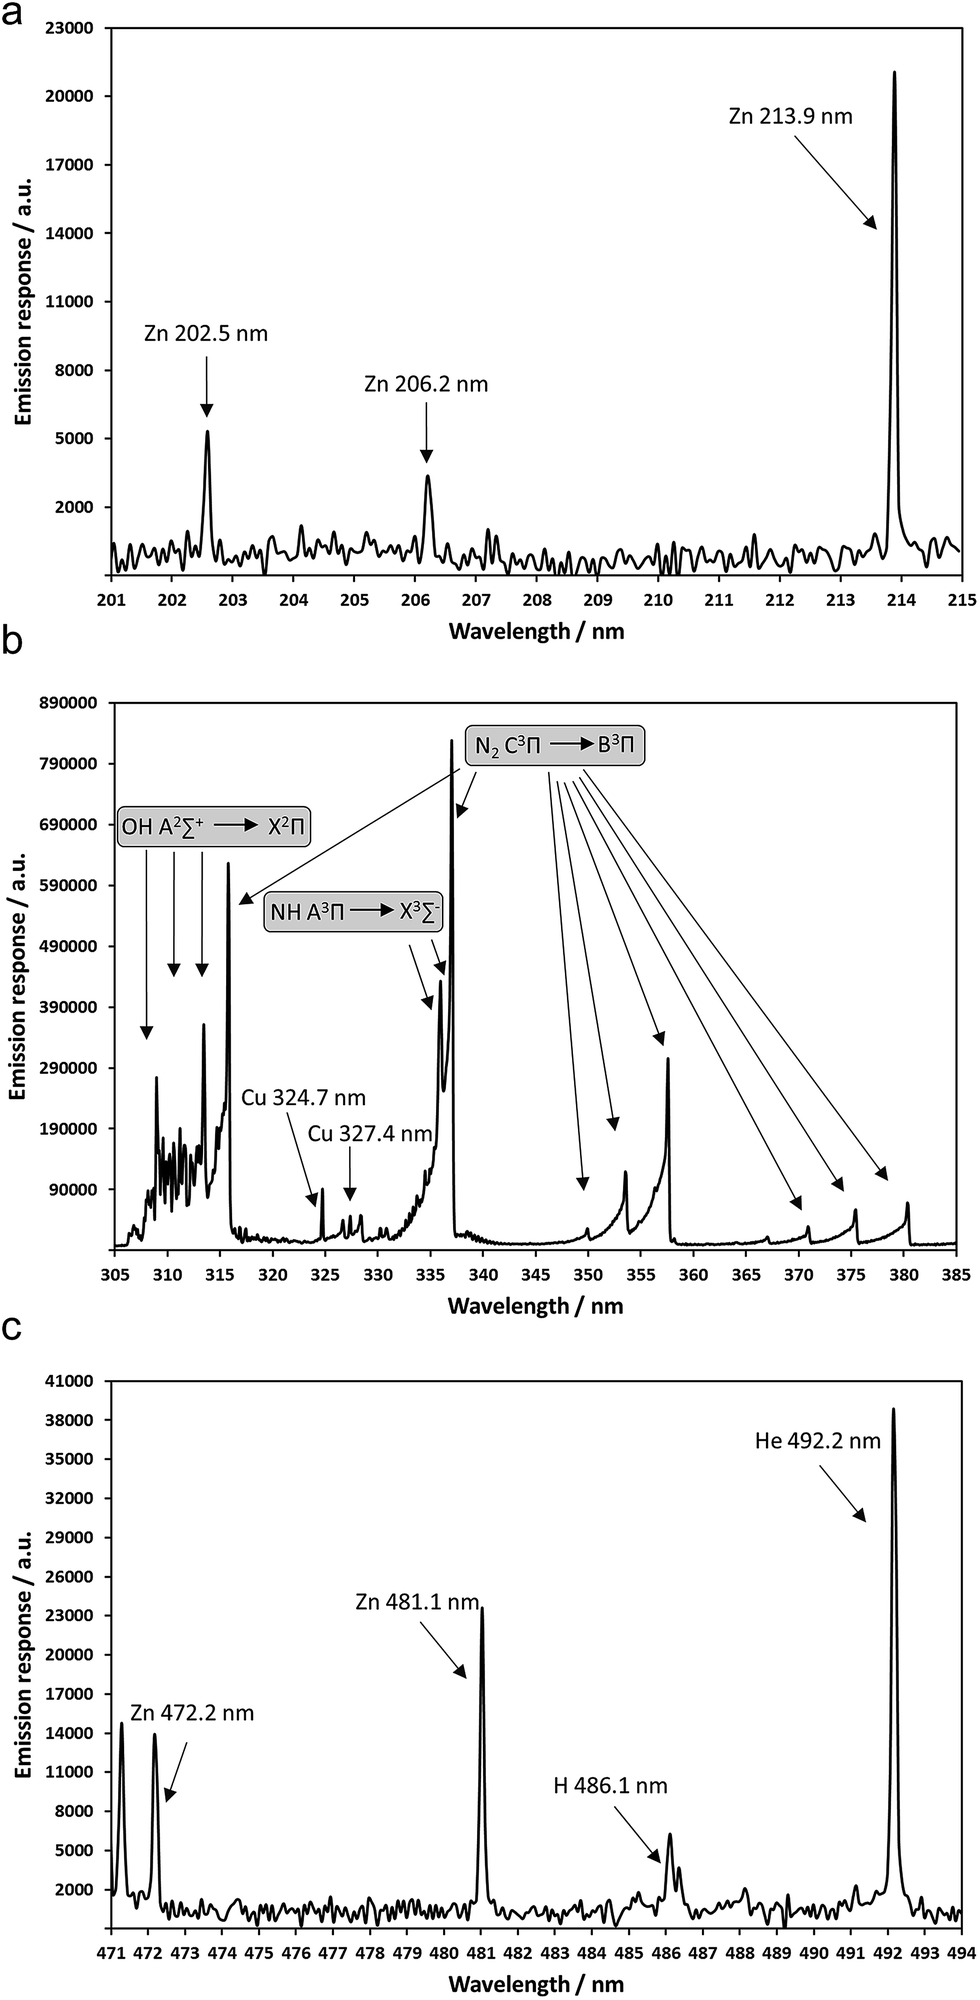 | ||
| Fig. 2 Spectra depicting the investigated atomic, ionic and molecular band species: (a) Zn II 202.5 nm, Zn II 206.2 nm, Zn I 213.9 nm, (b) OH 308.9 nm, N2, 357.7 nm, Cu I 324.7 nm, (c) Zn I 472.2 nm and Zn I 481.1 nm. | ||
| Zn | Cu | |||
|---|---|---|---|---|
| a Energy levels in eV were derived from energy levels in cm−1 using the following conversion factor: 1 eV = 8065.54 cm−1. | ||||
| Wavelength λ/nm | 213.9 (I) | 481.1 (I) | 202.5 (II) | 324.7 (I) |
| Transition probability A/s−1 | 7.14 × 10⁸ | 7.00 × 10⁷ | 4.07 × 10⁸ | 1.37 × 10⁸ |
| Energy of the lower levelaEi/eV | 0 | 4.1 | 0 | 0 |
| Energy of the upper levelaEk/eV | 5.8 | 6.7 | 6.1 | 3.8 |
| 1st Ionization energy/eV | 9.4 | 7.7 | ||
| 2nd Ionization energy/eV | 18.0 | 20.3 | ||
Inter-parametric dependencies on excited state populations
Previous LS-APGD-OES studies clearly pointed to the positive effects of high discharge current and sample solution delivery rates in terms of obtaining high analyte remission responses.11,15 In both cases, though, operation above some critical values resulted in deleterious effects. In none of those works was the complete inter-parametric space evaluated. In the case of the LS-APGD as secondary excitation source for LA-generated aerosols, it was observed that high glow discharge currents, small inter-electrode separation distances (gap), and low He LA carrier gas flow rates favor analyte response, albeit disregarding inter-parametric dependencies.21 In order to determine the relevance of individual parameters and their interrelated effects on the different excited state (atomic and ionic) populations present in the microplasma, a comprehensive study making use of a full factorial experimental plan was employed here. As the roles of discharge current and solution flow were well known, the studies described here had initiation points at the upper portions of those parameter's stability, focusing on the interplay amongst the parameters near the point of optimum operation.The four plasma parameters that were investigated here were discharge current, interelectrode gap, and the He sheath and counter gas flows. The latter would represent the LA carrier gas flow when introducing LA-generated aerosol. The solution flow rate was not subject to variation in this study, as such changes would change the analyte responses independently from the other operation conditions. It must be noted that the chosen rate of 150 μL min−1 represented a value, which allowed operating the plasma under stable conditions within the parameter space. Typically, insufficient solution flow rates result in the melting of the solution capillary (when high currents are employed), while excessive rates lead to analyte suppression due to an overloading of the plasma with solvent.14,15 Hence, an optimized value will strongly depend on the other parameter settings, with e.g. high currents permitting higher solution flow rates and vice versa.
Inter-parametric dependencies on excitation of atomic and ionic states
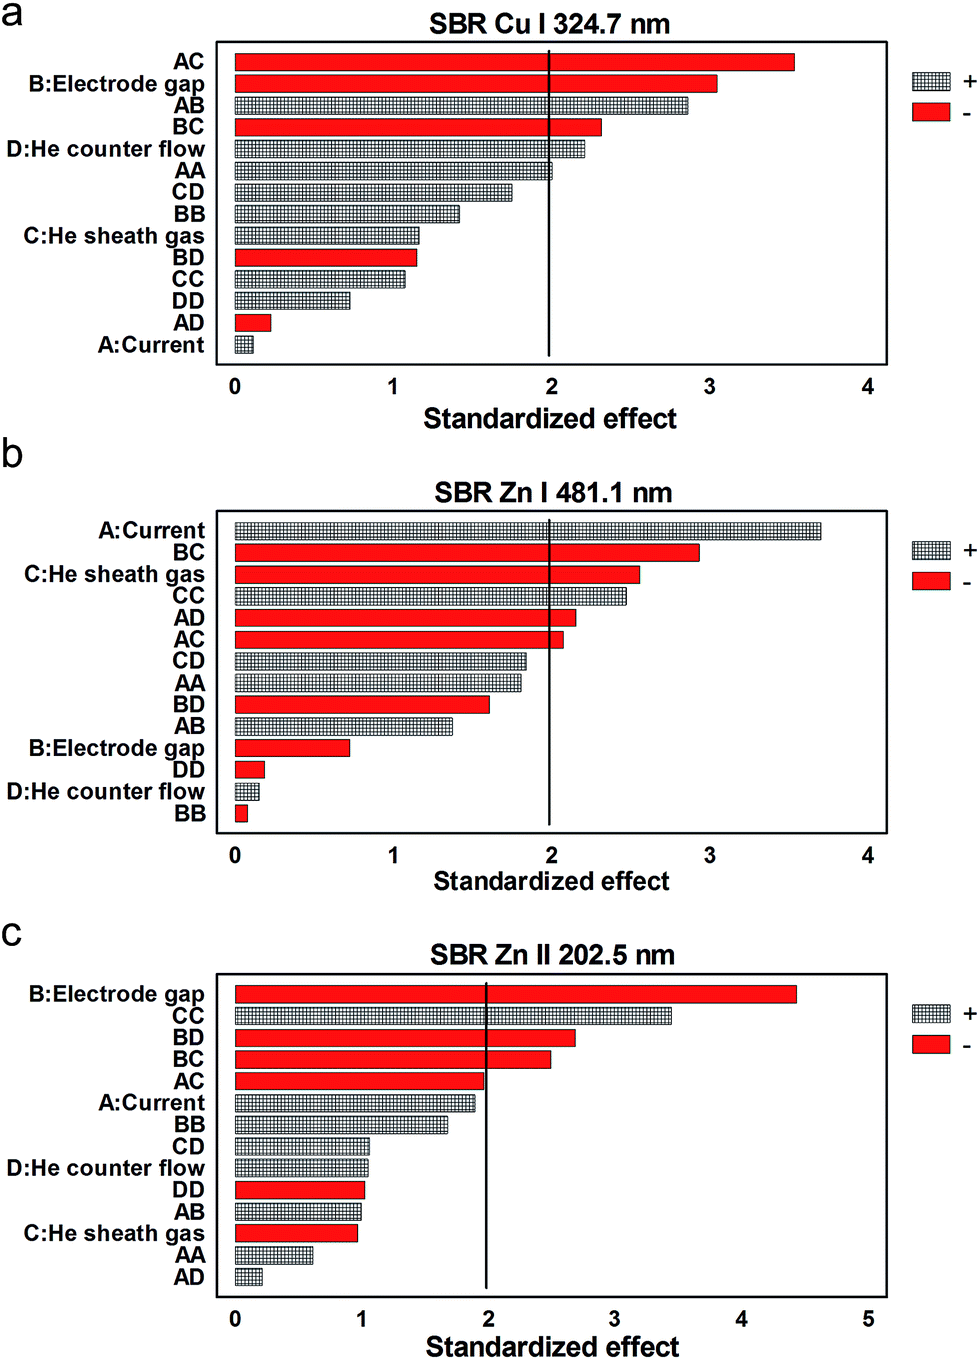
A global picture of the significant LS-APGD operation parameters in the respective transition responses can be revealed in Pareto plots of standardized effects as presented for the four monitored transitions in Fig. 3. (Specific response surfaces toward parametric changes for each transition are included as ESI.†) Before discussing any particular transition or parametric effect, it is clear across the transitions that there are no instances where one particular parameter (or set of parameters) clearly dominates the responses. The statistical basis for this conclusion lies in the fact that the level of “significance” here is a value of ∼2 (based on the number of parameters tested), and no single parameter has a standardized effect value of greater than ∼4.5. In addition, there is fairly equal weighting among those parameters that have positive and negative correlations with the line intensities. It must be emphasized that the analyte feed rate was held constant across the evaluated parameter space, and so the parameters here affect the processes of solvent vaporization, dissociation to free atoms, and their subsequent excitation/ionization.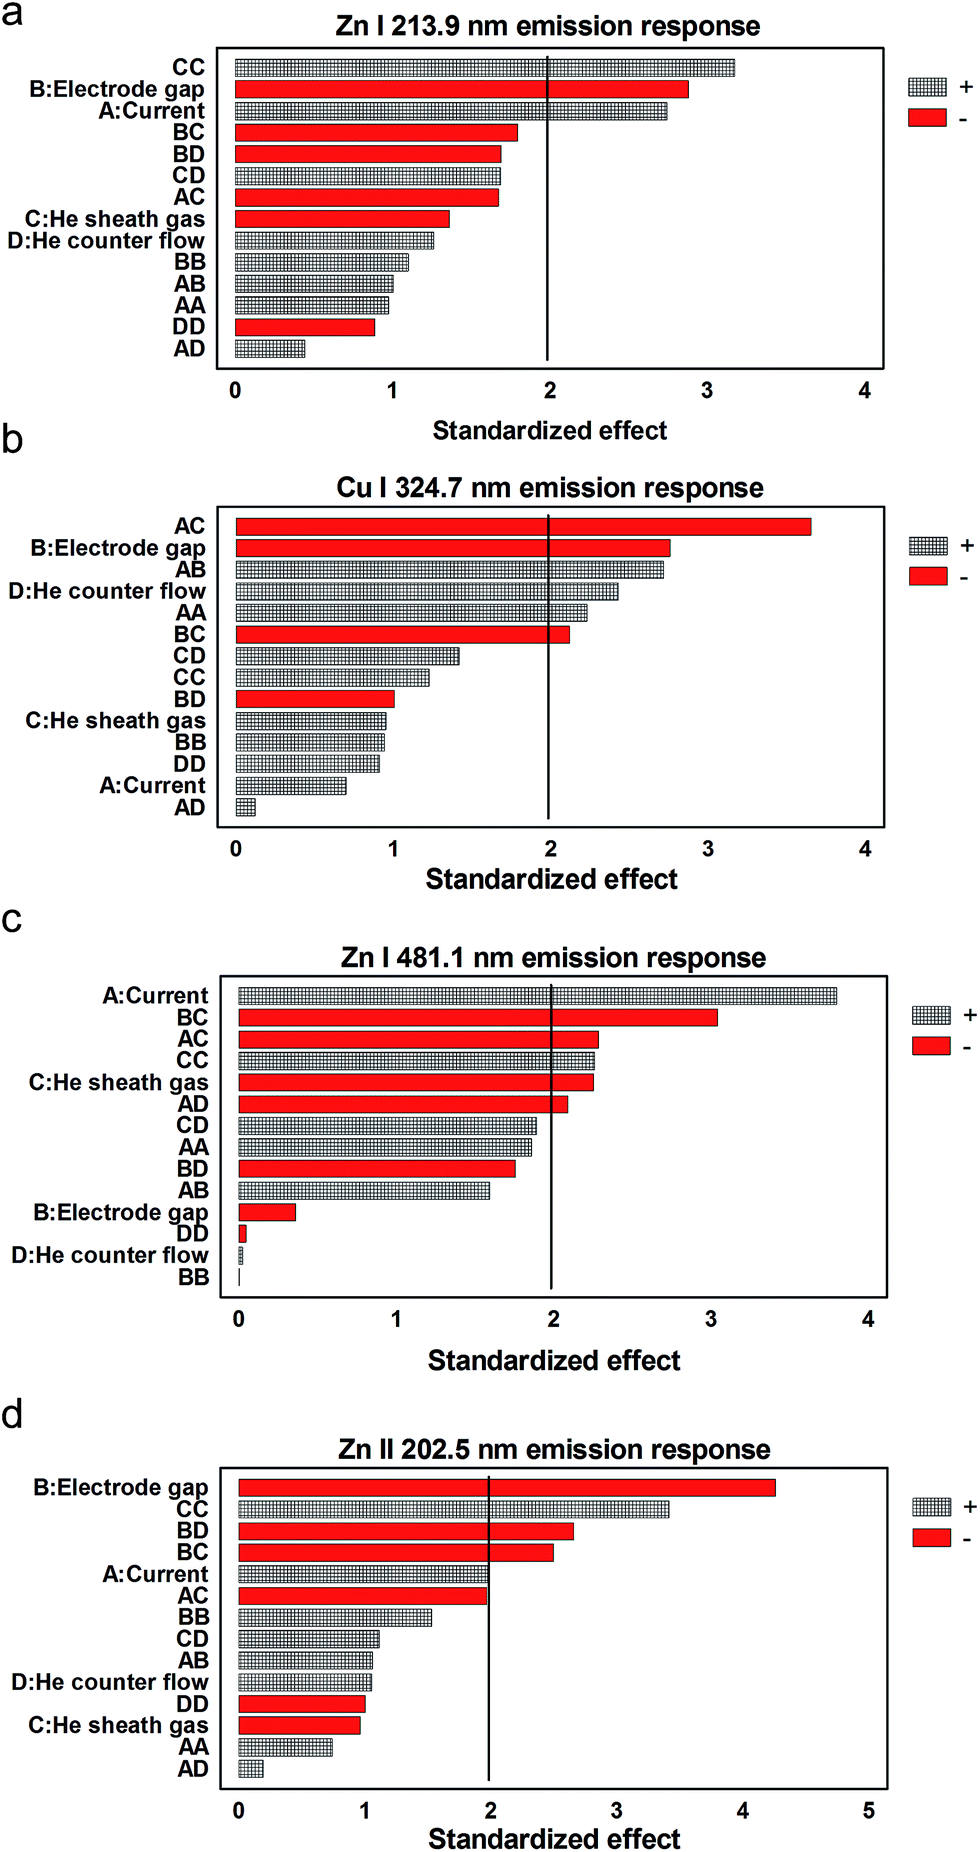 | ||
| Fig. 3 Inter-parametric effects on emission responses of (a) Zn I 213.9 nm, (b) Cu I 324.7 nm, (c) Zn I 481.1 nm, and (d) Zn II 202.5 nm. | ||
Closer examination of how the various parameters affect the emission responses of the different transitions allows for an assessment of overall trends and the generation of a better picture as to how energy is partitioned in the LS-APGD microplasma. For example, in all cases, the inter-electrode gap (designated as parameter B) has a negative effect on the emission responses. In the absence of any other changes, decreases in the gap distance cause an increase in the overall power density within the plasma. This makes sense as the “work” to be done in the plasma (vaporization/dissociation/excitation/ionization) would be most efficient at higher power densities. It must be pointed out that studies wherein the microplasma is used as a secondary excitation source for LA-generated particles, the correlation of the response with inter-electrode gap is very strongly positive. That relationship was suggested to imply that longer plasma residence times (via larger gap sizes) were more effective in particle vaporization prior to excitation/emission. Indeed, slight increases (<10% relative) of the LS-APGD gas-rotational (Trot) and excitation temperatures (Texc) with increasing currents were observed by Manard et al.12 As a general rule, discharge current (parameter A) is positively correlated with emission intensity, but to various degrees based on the specific transitions. This also makes sense, as an increasing current should also increase the power density (under the assumption that the volume of the microplasma does not increase). The fact that the magnitude of the standardized effect increases with the excitation energy of the respective transitions seems to suggest that the density is indeed increasing. Indeed, higher excitation energies seem to be more effectively populated, suggesting a shift in the electron energy distribution function (EEDF) to higher values. On the other hand, if the size of the excitation region were to increase with discharge current, one might expect that the resonant transitions (Zn I 213.9 nm and Cu I 324.7 nm) might actually show a greater response as the propensity for self-absorption would be reduced for the larger excitation volume.
While the roles of inter-electrode gap and discharge current may seem reasonably straightforward, those of the sheath and the counter gas flows (parameters C and D, respectively) are far less well defined. In the case of direct solution analysis, the sheath gas plays a role in constricting the plasma as well as cooling the solution-introducing capillary. The omission of using a sheath gas at high discharge currents causes excess heating of the solution within the capillary, driving out the solvent and resulting in clogging. There could also be an influence on the analyte residence time in the microplasma as a function of the sheath gas flow rate, but this has not been demonstrated as of yet. In the case of the introduction of LA-generated aerosols, the counter gas flow is the means of introducing the micro-particulates into the active plasma environment. As stated above, the emission from those species is enhanced as a function of residence time in the plasma, and so was inversely related to the counter gas flow rate. It is interesting to note that only in the case of the Cu I 324.7 nm emission there is a positive correlation between the sheath gas flow rate and the line response, albeit a very slight one. On the other hand, there are positive correlations between the CC (cross) term and the response for each of the transitions, particularly so for the Zn transitions (all other cross terms involving C are negative for each transition). This peculiar response seems to suggest that there is indeed an aspect of plasma volume constriction induced by the sheath gas flow. On the other hand, the role of the counter flow in the respective line responses is consistently a positive, yet not significant, effect as an independent variable. In this case, it is believed that the counter flow acts to increase the residence time of atoms within the plasma volume, improving the odds of being excited. It is interesting that for the Cu I 324.7 nm transition, the one most prone to self-absorption, the effect of the counter flow is the greatest. Here, it is believed that the flow serves to sweep the ground state atoms from the cooler outer portions of the microplasma where self-absorption would be favorable.
Inter-parametric dependencies on background emission and signal-to-background ratios
The parametric dependencies of background emission responses and signal-to-background ratios (SBRs) as a function of the LS-APGD operating parameters provide further insights into the operation of the device as well as fine-tuning of analytical performance of the excitation source. While a good deal of effort has been put into assessing parametric influences on the generation of background species (i.e. mainly water clusters) when the LS-APGD is used as ionization source,16 such knowledge is missing in case of its use as an excitation source. Low background emission is not only advantageous in terms of detection limits, but also with regards to discerning emission lines of interest from the surrounding background. As with almost all ambient optical emission devices, background emission does not only result from species introduced with the solution feed (analytes, sample matrix including H2O and HNO3), but also from the excitation of atmosphere-related species such as N2, O2, etc. An overview of atomic and molecular species typically present in emission spectra of atmospheric pressure glow discharge plasmas operated with a liquid electrolyte is given in Jamroz et al.10 Key here is the fact that the parametric settings that are optimal for analyte emission responses might also yield elevated background emission. To be clear, performing OES measurements using an array-based detection system does allow greater flexibility in terms of background correction for specific transitions, but the impact of such corrections reaches diminishing returns in trace analyses. For the sake of these studies, the parametric trends provide insights into the generation of excited state background species versus the desired atomic emission responses.As in the case of the line transition responses, the corresponding spectral backgrounds (measured as described in the Experimental section) were processed across the experimental matrix. In this case, the Pareto plots depicting the parametric dependencies for the background associated with three of the monitored transitions and for the OH˙ A2Σ+–X2Π system (308.9 nm band head; (0–0)) and N2 C3Π–B3Π system band head (357.7 nm band head; (0–1)) are presented in Fig. 4. As demonstrated in LS-APGD-OES spectra published previously12 and in Fig. 2b, the Cu I 324.7 nm transition (Fig. 4a) should reflect minor contributions from the N2 C3Π–B3Π and the NH A3 Π–X3Σ− band systems. Moreover, a minor contribution from the continuum background can also be observed in case of the Zn I 481.1 nm transition (Fig. 4b), which is consistent for this LS-APGD-OES system. The Zn II 202.5 nm transition (Fig. 4c) is free from molecular species' interferences and so its background is continuous in nature (note that the Zn I 213.9 nm transition is in the same region, and so is not presented here). The final two entries are the Pareto plots of the OH˙ and N2 bands (Fig. 4d and e). It is important to make the distinction between the N2 band emission, which must originate from ambient N2 surrounding the microplasma, and the OH˙ primarily stemming from the degradation of the aqueous electrolyte solution. Thus, comparisons among the background level responses in the various spectral regions provide opportunities for deeper understanding of the LS-APGD operation.
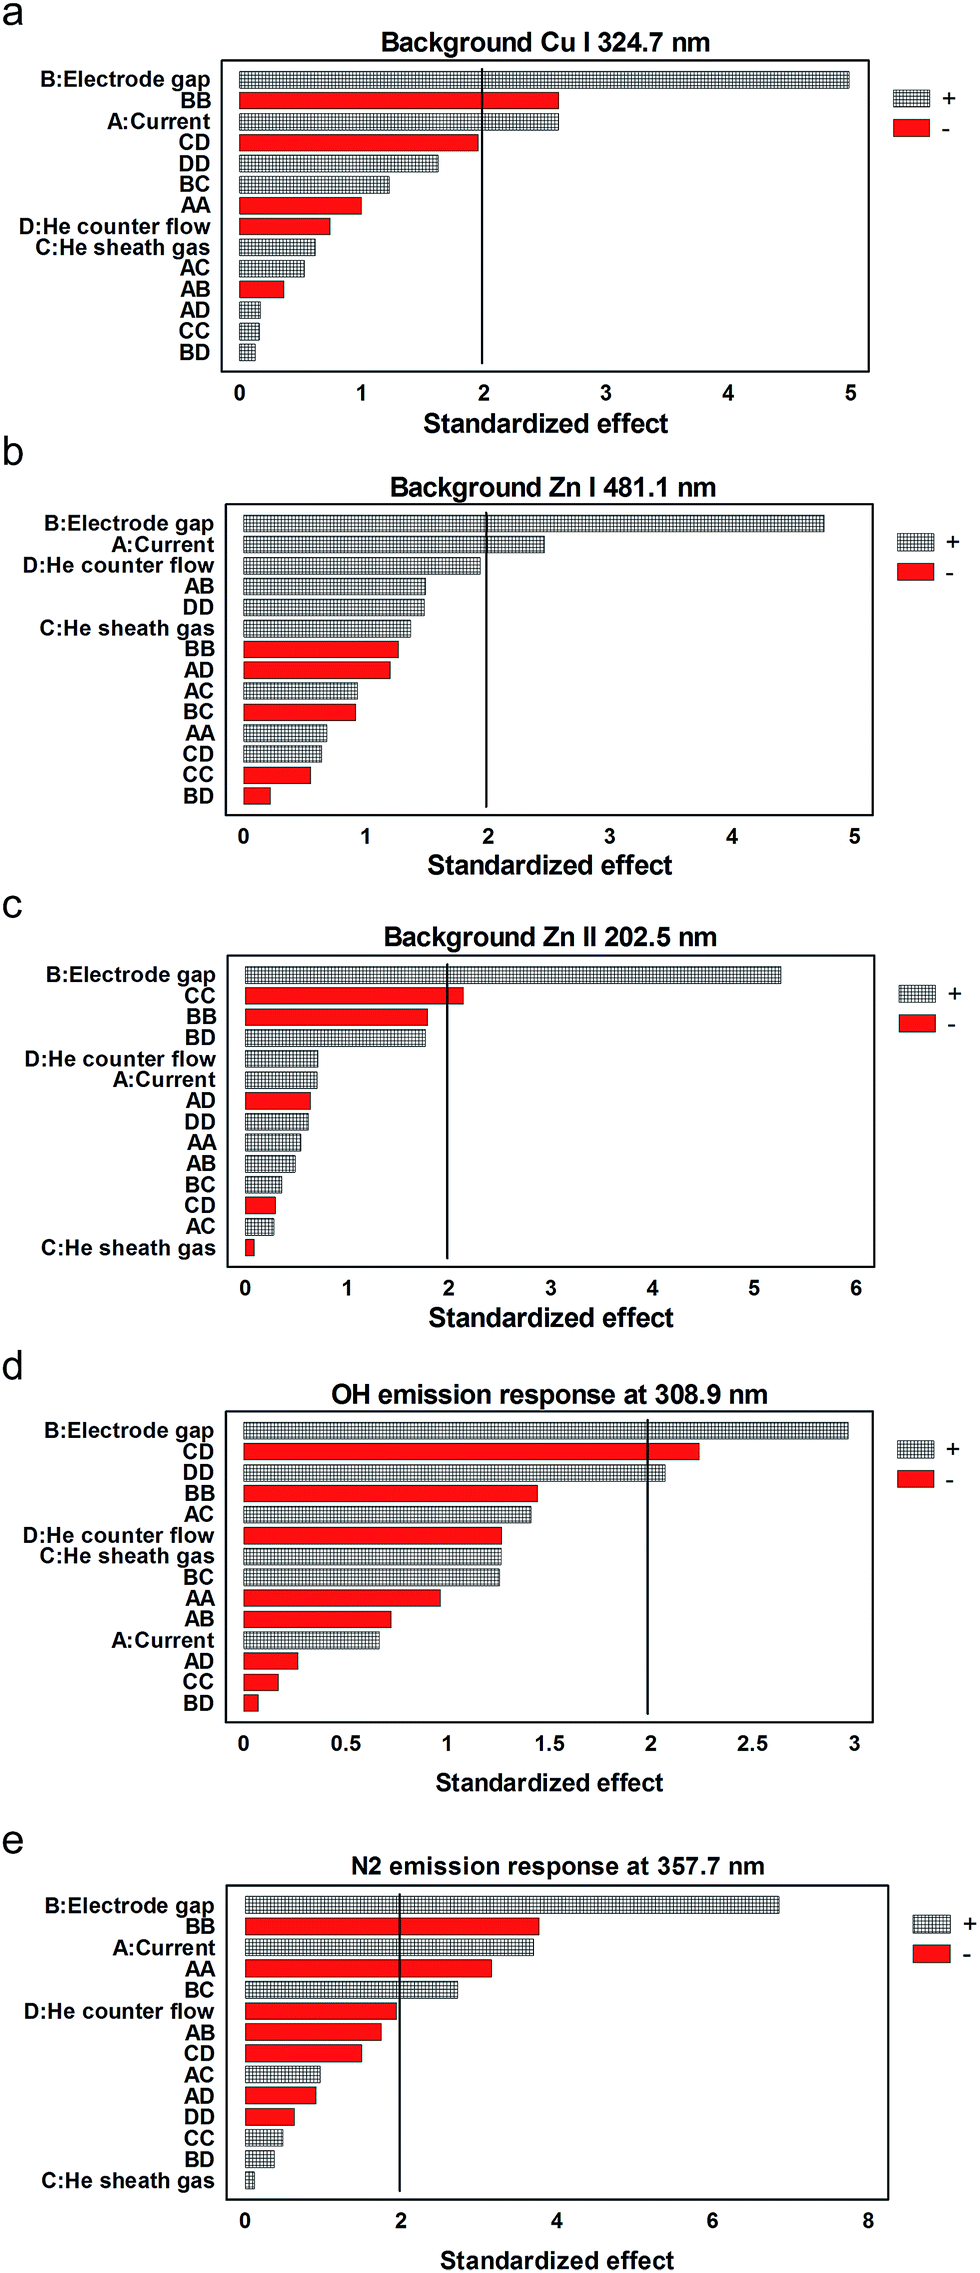 | ||
| Fig. 4 Inter-parametric effects on background emissions near the (a) Cu I 324.7 nm, (b) Zn I 481.1 nm, and (c) Zn II 202.5 nm emission lines, and at (d) OH˙ 308.9 nm and (e) N2 357.7 nm band head emissions. | ||
In evaluating the Pareto plots of the spectral background it is immediately clear that there is a unified, single overwhelming factor to the intensities: the size of the interelectrode gap. The same parametric trends were also observed for the N2 315.9 nm (1–0) and the N2 337.1 nm (0–0) band heads. These bands are partially overlapped with OH˙ and NH band heads, respectively,10 thus the choice of the distinct N2 C3Π–B3Π system 357.7 nm band head. Discharge current is a minor, positive contributor for the background in the regions of the Cu I and Zn I transitions. As described above, the primary effect in increasing the interelectrode gap is to decrease the power density within the plasma. To this end, it may seem reasonable that increased electrode separation may result in the excitation of the common molecular species in lieu of their further dissociation to atomic form in the higher power density situations. Different from the elemental line responses, though, there is a component of the diffusion of ambient gases into the excitation region, as opposed to atoms diffusing out of the microplasma. In this case, N2 levels increase as reflected in Fig. 4e and the Cu I and Zn I background levels (Fig. 4a and b). Under the assumption that the background in the 200 nm range is plasma continuum, one would not expect to see a positive correlation of the background response with an increased interelectrode gap (i.e., low power density); the opposite trend would be expected in terms of the production of blackbody radiation. Indeed, as tabulated by Jamróz et al.,36 there are NO species that possess emission bands in this region of the spectrum. The presence of such moieties could be the result of ambient gas incursion, or the incomplete dissociation of the HNO3 electrolyte. The latter would indeed be consistent with a less energetic plasma at larger separation distances as suggested in Fig. 3. The final reflection of the reduced plasma density as a function of increased interelectrode gap is seen in the Pareto plot for the OH˙ band. Under conditions of constant electrolyte loading (fixed liquid flow rate), the enhanced hydroxide radical emission seems to clearly point to conditions wherein that species is effectively excited (resulting in emission) rather than being fully dissociated in the cases of a more dense plasma (shorter gaps).
Fortuitously, but not totally unique among atomic emission devices, a comparison between the Pareto plots of Fig. 3 and 4 point to a somewhat asynchronous relationship between the key parameters affecting analyte and background species' responses in the LS-APGD. Most specifically, analyte species' emission is enhanced at small interelectrode gaps, while the opposite is true for the spectra background responses. In the ideal case, a singular set of conditions could be realized to yield the most beneficial signal-to-background ratios (SBRs) for each transition, and this would likely be a case-by-case situation. Even so, there is guidance in the Pareto plots of Fig. 5 in terms of a general approach to identifying optimum SBRs. In short, those parameters that affect the greatest analyte responses (Fig. 3) yield the same responses towards SBR. This suggests that the responses of molecular band species (the primary background contributors) are indeed enhanced under conditions where molecular species diffusion into the microplasma is facilitated while excitation is promoted rather than dissociation, i.e. large interelectrode gaps and low power densities.
 | ||
| Fig. 5 Inter-parametric effects on signal-to-background ratios of (a) Cu I 324.7 nm, (b) Zn I 481.1 nm, (c) Zn II 202.5 nm. | ||
Hence, taking into account the different analyte and molecular band species responses in the investigated parameter space, a current of 55 mA, an electrode gap 1.5 mm, a He sheath gas flow rate of 0.9 L min−1, a He counter gas flow rate of 0.2 L min−1, and solution flow rate of 150 μl min−1, are considered as appropriate starting values for the LS-APGD-OES's daily routine fine-tuning for multielement analysis. However, in future applications the chosen sheath gas flow rate may depend somewhat on the specific elements to be analyzed. Here, the highest Cu emission responses were observed employing a sheath gas flow rate of 0.9 L min−1, while in case of Zn both 0.5 L min−1 and 0.9 L min−1 yielded maxima in the response surfaces (see figures in the ESI†).
Influence of excitation conditions on plasma robustness
Ionic:atomic emission line intensity ratios are widely employed for monitoring plasma robustness;24,37–39i.e. the tolerance of the plasma against changes in excitation conditions. Such changes typically result from alterations in source operating conditions or from the introduction of matrix elements that affect source energetics. Clearly, immunity from such changes is desirable. The advantage of using ionic:atomic line ratios as indicators is that they are only sensitive to changes in excitation conditions, and not to fluctuations in analyte amounts introduced into the excitation source.24 As primarily championed by Mermet37,38 the magnitude of the ratio of a given pair of ionic and atomic transitions reflects the degree of ionization, and suggests the potential immunity to matrix effects. Most typically, the Mg II:Mg I (280.3 nm:285.2 nm) line pair is used in the characterization of ICP sources, where values of >8 are obtained in radial viewing mode.24,25,37,40,41 Previous works with the LS-APGD-OES source have yielded fairly low Mg II:Mg I ratios of ∼1, but perhaps surprisingly showing a good deal of immunity towards additions of easily ionized elements (EIEs) and laser ablation-generated aerosols.12,13,21
While the above-cited Mg line pair is very convenient to implement, ion:atom transitions of other elements have been employed. Of relevance here, Chan et al.42 and Chan and Hieftje24 have used the Zn II:Zn I (206.2 nm:213.9 nm) pair for investigating ICP matrix effects, with values for this ratio occurring in the general range of 0.9–1.0. The same line pair yields values on the order of ∼0.1 in this work. Based on the general use of the line ratio as a measure of plasma robustness, one would expect that the LS-APGD microplasma would indeed show appreciable changes in excitation/ionization conditions as a function of changes in discharge conditions or the introduction of different sample matrices. As the Zn II 202.5 nm line was ∼3× more intense than the 206.2 nm line, it was used throughout this work, yielding an average Zn II:Zn I ratio of ∼0.34. The relevance and contributions of both individual parameters and parameter combinations were again evaluated by means of a Pareto plot (Fig. 6). As depicted here, no singular or combination of parameters significantly affects the plasma environment, demonstrating that the plasma is robust to changes in excitation conditions within the investigated parameter space. The fact that the device has consistently shown this characteristic suggests a good deal of flexibility regarding quantification (lesser degrees of matrix matching) as well as a high degree of immunity to operation condition variations, both useful traits for in-field measurements and prompt risk assessment.
 | ||
| Fig. 6 Inter-parametric effects on plasma robustness using the Zn II:I line ratio as the robustness indicator. | ||
Conclusions
The liquid sampling-atmospheric pressure glow discharge (LS-APGD) microplasma has been evaluated with respect to its excitation/ionization characteristics when applied as excitation source for optical emission spectroscopy. Monitoring of Cu and Zn atomic (I) and ionic (II) emission lines while changing operation conditions according to a design of experiment plan allowed to assess the effects of individual parameter changes as well as of interrelated dependencies. An inter-parametric analysis approach considering the whole parameter space was considered as crucial for fully evaluating the LS-APGD's excitation characteristics, as important dependencies may be overlooked when investigating operational parameters separately. Zn and Cu were employed as test elements as the investigated emission lines exhibited a wide range of spectroscopic properties (i.e. resonant and non-resonant lines, high excited state energies without being resonant and ionic states), thus permitting a good matrix for evaluating excitation conditions. Evaluations of analyte responses, background emissions, and signal-to-background ratios indicated that a high plasma power density is the key requirement for enhanced analyte excitation, with the size of the inter-electrode distance showing the most pronounced effects at high discharge currents (>45 mA). Generally, a positive effect of the discharge current, primarily being responsible for high plasma power densities, was observed for all transition lines. The more pronounced relevance of small electrode distances can be reasoned by the fact that the electron number densities across a glow discharge current range of 45 mA to 65 mA are virtually invariant.12 Considering the role of the He sheath gas flow, the results of the parametric study presented here suggest that the sheath gas helps confining the plasma volume, which again is beneficial for increasing the plasma power density. On the other hand, increased counter flows seem to be advantageous in terms of increased plasma residence times, leading to improved odds for excitations to take place. However, based on the positive effect of the counter gas flow for the resonant Cu I 324.7 nm transition line, another proposed mechanism is a “sweeping” effect of ground state atoms from the outer portion of the plasma volume. Such an effect could be advantageous for emission lines especially prone to self-absorption.Summarizing it can be said that this study majorly contributed to the fundamental understanding of the LS-APGD's characteristics as excitation source for optical emission spectroscopy. However, even though driving forces for certain excitation conditions (e.g., atomic and ionic, analyte versus background emission, resonant vs. non-resonant lines) were identified within the course of this investigation, it is clear that the LS-APGD may still be fine-tuned for specific analyses. Confidence is taken that the global conditions of a current of 55 mA, an electrode gap 1.5 mm, a He sheath gas flow rate of 0.9 L min−1, a He counter gas flow rate of 0.2 L min−1, and solution flow rate of 150 μl min−1, are very reasonable starting points as more rigorous analytical characterization is performed. Ultimately, the fact that the LS-APGD shows immunity to a wide range of changing operating conditions is seen as especially useful for anticipated in-field measurements for rapid risk assessments.
Acknowledgements
This work was supported by the Defense Threat Reduction Agency, Basic Research Award # HDTRA1-14-1-0010, to Clemson University.References
- A. Rios, A. Escarpa and B. Simonet, in Miniaturization of Analytical Systems, John Wiley & Sons, Ltd., 2009, pp. 1–38 Search PubMed.
- A. Papadakis, S. Rossides and A. Metaxas, Open Appl. Phys. J., 2011, 4, 45–63 CrossRef CAS.
- V. Karanassios, Spectrochim. Acta, Part B, 2004, 59, 909–928 CrossRef PubMed.
- R. Foest, M. Schmidt and K. Becker, Int. J. Mass Spectrom., 2006, 248, 87–102 CrossRef CAS PubMed.
- M. Miclea, M. Okruss, K. Kunze, N. Ahlman and J. Franzke, Anal. Bioanal. Chem., 2007, 388, 1565–1572 CrossRef CAS PubMed.
- J. Franzke, K. Kunze, M. Miclea and K. Niemax, J. Anal. At. Spectrom., 2003, 18, 802–807 RSC.
- T. Cserfalvi, P. Mezei and P. Apai, J. Phys. D: Appl. Phys., 1993, 26, 2184 CrossRef CAS.
- M. R. Webb and G. M. Hieftje, Anal. Chem., 2009, 81, 862–867 CrossRef CAS PubMed.
- Q. He, Z. Zhu and S. Hu, Appl. Spectrosc. Rev., 2013, 49, 249–269 CrossRef.
- P. Jamroz, K. Greda and P. Pohl, TrAC, Trends Anal. Chem., 2012, 41, 105–121 CrossRef CAS PubMed.
- R. K. Marcus and W. C. Davis, Anal. Chem., 2001, 73, 2903–2910 CrossRef CAS.
- B. T. Manard, J. J. Gonzalez, A. Sarkar, M. Dong, J. Chirinos, X. Mao, R. E. Russo and R. K. Marcus, Spectrochim. Acta, Part B, 2014, 94–95, 39–47 CrossRef CAS PubMed.
- B. T. Manard, J. J. Gonzalez, A. Sarkar, X. Mao, L. X. Zhang, S. Konegger-Kappel, R. K. Marcus and R. E. Russo, Spectrochim. Acta, Part B, 2014, 100, 44–51 CrossRef CAS PubMed.
- C. D. Quarles Jr, B. T. Manard, C. Q. Burdette and R. K. Marcus, Microchem. J., 2012, 105, 48–55 CrossRef PubMed.
- W. C. Davis and R. K. Marcus, Spectrochim. Acta, Part B, 2002, 57, 1473–1486 CrossRef.
- L. X. Zhang, B. T. Manard, S. Konegger-Kappel and R. K. Marcus, Anal. Bioanal. Chem., 2014 DOI:10.1007/500216-014-8046-7.
- R. K. Marcus, C. D. Quarles Jr, C. J. Barinaga, A. J. Carado and D. W. Koppenaal, Anal. Chem., 2011, 83, 2425–2429 CrossRef CAS PubMed.
- C. D. Quarles Jr, A. J. Carado, C. J. Barinaga, D. W. Koppenaal and R. K. Marcus, Anal. Bioanal. Chem., 2012, 402, 261–268 CrossRef PubMed.
- A. J. Carado, C. D. Quarles, A. M. Duffin, C. J. Barinaga, R. E. Russo, R. K. Marcus, G. C. Eiden and D. W. Koppenaal, J. Anal. At. Spectrom., 2012, 27, 385–389 RSC.
- C. D. Quarles Jr, J. Gonzalez, I. Choi, J. Ruiz, X. Mao, R. K. Marcus and R. E. Russo, Spectrochim. Acta, Part B, 2012, 76, 190–196 CrossRef PubMed.
- B. T. Manard, S. Konegger-Kappel, J. J. Gonzalez, J. Chirinos, M. Dong, X. Mao, R. K. Marcus and R. E. Russo, Appl. Spectrosc. DOI:10.1366/14-07585.
- R. K. Marcus, C. Q. Burdette, B. T. Manard and L. X. Zhang, Anal. Bioanal. Chem., 2013, 405, 8171–8184 CrossRef CAS PubMed.
- J. L. Venzie and R. K. Marcus, Spectrochim. Acta, Part B, 2006, 61, 715–721 CrossRef PubMed.
- G. C.-Y. Chan and G. M. Hieftje, Spectrochim. Acta, Part B, 2006, 61, 642–659 CrossRef PubMed.
- J. Dennaud, A. Howes, E. Poussel and J.-M. Mermet, Spectrochim. Acta, Part B, 2001, 56, 101–112 CrossRef.
- Y. Ushirozawa and K. Wagatsuma, Spectrosc. Lett., 2005, 38, 539–555 CrossRef CAS PubMed.
- H. Matsuta and K. Wagatsuma, Appl. Spectrosc., 2002, 56, 1165–1169 CrossRef CAS.
- G. Cristoforetti, S. Legnaioli, V. Palleschi, A. Salvetti and E. Tognoni, Spectrochim. Acta, Part B, 2004, 59, 1907–1917 CrossRef PubMed.
- N. M. Shaikh, S. Hafeez, M. A. Kalyar, R. Ali and M. A. Baig, J. Appl. Phys., 2008, 104, 103108 CrossRef PubMed.
- X. L. Mao, A. C. Ciocan, O. V. Borisov and R. E. Russo, Appl. Surf. Sci., 1998, 127–129, 262–268 CrossRef CAS.
- V. Margetic, A. Pakulev, A. Stockhaus, M. Bolshov, K. Niemax and R. Hergenröder, Spectrochim. Acta, Part B, 2000, 55, 1771–1785 CrossRef.
- C. Liu, X. L. Mao, S. S. Mao, X. Zeng, R. Greif and R. E. Russo, Anal. Chem., 2004, 76, 379–383 CrossRef CAS PubMed.
- H.-R. Kuhn and D. Günther, Anal. Chem., 2003, 75, 747–753 CrossRef CAS.
- C. C. Garcia, H. Lindner, A. von Bohlen, C. Vadla and K. Niemax, J. Anal. At. Spectrom., 2008, 23, 470–478 RSC.
- A. Bevilacqua, M. Corbo and M. Sinigaglia, Current research, technology and education topics in applied microbiology and microbial biotechnology—2010 edition, Microbiology Book Series, Formatex Research Center (psb), 2010, pp. 1419–1429 Search PubMed.
- P. Jamróz, W. Żyrnicki and P. Pohl, Spectrochim. Acta, Part B, 2012, 73, 26–34 CrossRef PubMed.
- J. Mermet, Anal. Chim. Acta, 1991, 250, 85–94 CrossRef CAS.
- J.-M. Mermet, J. Anal. At. Spectrom., 1998, 13, 419–422 RSC.
- E. Tognoni, M. Hidalgo, A. Canals, G. Cristoforetti, S. Legnaioli, A. Salvetti and V. Palleschi, Spectrochim. Acta, Part B, 2007, 62, 435–443 CrossRef PubMed.
- C. Dubuisson, E. Poussel and J. Mermet, J. Anal. At. Spectrom., 1998, 13, 1265–1269 RSC.
- E. H. Van Veen and M. T. C. de Loos-Vollebregt, J. Anal. At. Spectrom., 1999, 14, 831–838 RSC.
- G. C.-Y. Chan, W.-T. Chan, X. Mao and R. E. Russo, Spectrochim. Acta, Part B, 2001, 56, 77–92 CrossRef.
Footnote |
| † Electronic supplementary information (ESI) available. See DOI: 10.1039/c4ja00302k |
| This journal is © The Royal Society of Chemistry 2015 |