Isotope ratio analysis of carbon and nitrogen by elemental analyser continuous flow isotope ratio mass spectrometry (EA-CF-IRMS) without the use of a reference gas
L. J.
Bay
a,
S. H.
Chan
b and
T.
Walczyk
*ac
aDepartment of Chemistry (Faculty of Science), National University of Singapore (NUS), Singapore 119077, Singapore. E-mail: walczyk@nus.edu.sg; Tel: +65 6516 7986
bFood Safety Division, Applied Sciences Group, Health Sciences Authority (HSA), Singapore 169078, Singapore
cDepartment of Biochemistry (Yong Loo Lin School of Medicine), National University of Singapore (NUS), Singapore 119077, Singapore
First published on 13th October 2014
Abstract
A new approach to normalize measured isotope ratios (carbon and nitrogen) by elemental analyser continuous flow isotope ratio mass spectrometry (EA-CF-IRMS) was evaluated. Isotope ratios of samples are altered during the IRMS measurement and must be corrected for both instrumental drifts as well as instrumental isotope fractionation for comparing data within and between laboratories. Traditionally, the isotope ratio of a reference gas is measured intermittently to correct for time dependent changes in isotope fractionation over the course of the measurement. However, this step appears to be redundant as bracketing standards are usually included in a measurement run for comparisons between measurements and laboratories and they can serve, in principle, the same purpose. Here we show that measurements without normalization to the reference gas are on a par in terms of accuracy and precision with those where the reference gas was used when employing an optimized strategy for bracketing samples with reference standards. Abolishment of intermittent reference gas measurements in EA-CF-IRMS analysis has the potential to cut short the analysis time significantly, can help to save costs in commercial IRMS laboratories and may open a new door for instrument developers to design high through-put IRMS instruments.
1. Introduction
Gas source isotope ratio mass spectrometry (IRMS) is a well-established technique for precise and accurate isotope ratio measurements of the light elements such as carbon (13C/12C), nitrogen (15N/14N), hydrogen (D/H), oxygen (17O/16O and 18O/16O) and sulphur (e.g.34S/32S). It has become an indispensable tool in a wide range of disciplines including archaeology,1 ecology,2 forensic science,3 hydrology,4 and food authentication.5The early history of IRMS was dominated by dual inlet systems.6,7 In these systems, a sample material is first converted into gaseous products offline and then transferred to the IRMS instrument where gas flows from the variable volume reservoirs are admitted alternately to the ion source of the mass spectrometer by a change-over valve. Bracketing of the sample gas with a reference gas and/or the reference material in the gaseous form is required to control time dependent changes in the measured isotopic composition of the sample induced by instrument drift and instrumental isotope fractionation. Since the 1990s, continuous flow IRMS (CF-IRMS) instruments have been developed which allow sample conversion to the gaseous state to be done online, effectively improving the ease of operation of the technique and saving analysis time.8
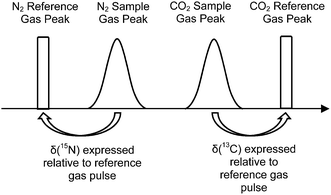
The elemental analyser (EA) is one of the most common interfaces used to introduce samples into a CF-IRMS. EA-CF-IRMS is a bulk measurement technique which provides representative data for the average isotopic signal of the entire sample. While continuous flow techniques such as EA-CF-IRMS has greatly altered basic procedures (sample preparation, etc.), what has not changed since the inception of IRMS analysis is the way in which measurements of isotope ratios are made. Isotope ratio measurements of a gaseous sample are being made relative to a reference gas (see Fig. 1). The isotopic composition of the unknown sample is then calculated as a δ-value relative to the reference gas, using eqn (1).
 | (1) |
 | ||
| Fig. 1 Measurement sequence for a typical EA-CF-IRMS run. δ(13C) and δ(15N) of the unknown sample are expressed relative to the reference gas within the same run. | ||
It is believed that the use of the reference gas for monitoring instrumental drift within a single measurement run helps to enhance measurement precision. However, we think that this step is redundant as instrument drift can also be monitored by bracketing sample(s) with solid reference materials which are also typically used in a measurement sequence. By removing double referencing, i.e. to the reference gas in the first step and to the bracketing material in the second step, there is potential to cut down the total analysis time, which may translate to significant cost savings in commercial IRMS laboratories. In this paper, we demonstrate that carbon and nitrogen measurements done without the use of the reference gas as a first point correction can produce results which are on a par in terms of measurement accuracy and precision with those where the reference gas is used.
2. Experimental
Carbon and nitrogen isotope ratios were measured at the Health Sciences Authority of Singapore (HSA) using a Flash 2000 elemental analyser linked online via a Conflo IV interface to a Delta V Advantage continuous flow isotope ratio mass spectrometer (Thermo Fisher Scientific, Bremen, Germany). The system was operated in the dual isotope mode, allowing nitrogen and carbon isotope ratios to be measured simultaneously on the same sample. For analysis, samples were weighed into tin capsules (Santis Analytical, Teufen, Switzerland) using a precision micro-balance (Mettler Toledo, Columbus, OH). Sample weights were decided so that peak areas were as closely matched as possible (±50%) to minimize errors associated with source-linearity effects. All samples were analysed in triplicate.A double point normalization approach was used to normalize the raw data from the instrument to the international reference scale. Certified reference materials USGS 40 and 41 (International Atomic Energy Agency (IAEA), Vienna, Austria) were chosen to be the normalization standards as their vastly different δ(13C) and δ(15N) values cover a range that should encompass a large proportion of naturally occurring materials (USGS 40: δ(13C) = −26.369‰ and δ(15N) = −4.5‰; USGS 41: δ(13C) = +37.626‰ and δ(15N) = +47.6‰). For final reporting, isotope ratios were expressed in δ-notation relative to international standards – V-PDB for δ(13C) and air N2 for δ(15N).
2.1 Optimization of the bracketing strategy
Different bracketing strategies were evaluated by running a consecutive sequence of 44 samples of an in-house quality control material (mono-sodium glutamate; MSG) on a single day using standard procedures without intermittent measurements of any other material. A given MSG measurement was treated either as an unknown sample or a bracketing standard for data analysis. Different bracketing strategies were tested either by (a) changing the number of standards (n = 1 to 3) forming the bracket or by (b) changing the number of samples (n = 1 to 7) within the bracket. Results were evaluated without the use of the reference gas for normalization.2.2 Evaluation of sample carryover
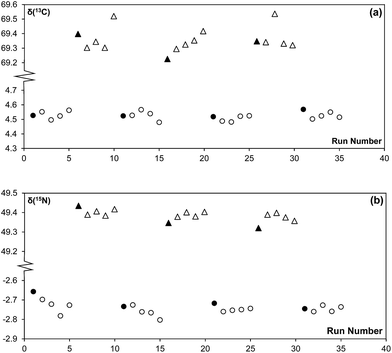
To detect the possibility of sample carryover, a series of 5 USGS 40 and USGS 41 sample blocks were run alternately 1 block after the other. If there was to be sample carryover, we should detect a consistent difference in the measured δ-value of the first sample when compared to the rest, i.e. the first USGS 41 measurement after the last USGS 40 measurement would exhibit a slightly lowered δ-value compared to the other 4 due to sample carryover from the previous sample. We had chosen to conduct the experiment using USGS 40 and 41 as they have a large difference in their δ(15N) and δ(13C) signatures and represent most likely the maximum possible difference for the samples that are encountered routinely in the laboratory.2.3 Evaluation of non-reference gas normalized measurements
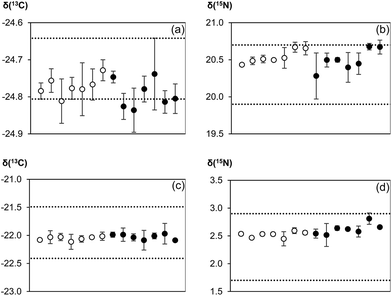
To demonstrate the accuracy and precision of our modified EA-CF-IRMS protocol, certified reference materials IAEA CH-3 cellulose (δ(13C) = −24.724 ± 0.041‰) and IAEA N-2 ammonium sulphate (δ(15N) = +20.3 ± 0.2‰) (both IAEA, Vienna, Austria), as well as inter-laboratory comparison material honey (ref. code: 11/1/C; δ(13C) = −21.95 ± 0.23‰; Eurofins, Nantes, France) and wheat flour (ref. code: 050818; δ(15N) = +2.3 ± 0.3‰; Trace, Sand Hutton, UK) were run in a sequence as the unknown sample material. The bracketing strategy used consisted of 1 bracketing standard with 6 samples within the bracket. Each “unknown” was analysed in triplicate. The sequence was repeated on 6 different days, allowing for the evaluation of the measurement stability and reproducibility of our technique.2.4 Data corrections
It should be noted that isotope ratios delivered by the instrument software (Isodat Version 3.0) have already been automatically corrected using the intermittent reference gas measurements. Hence, uncorrected ratios were obtained using the recorded raw data for the peak area as measured for each ion signal. However, while the raw 15N/14N isotope ratio without reference gas correction can be calculated easily from the corresponding peak areas, calculation of the 13C/12C is more complex as it requires a correction of data for oxygen isotopic composition, namely the isobaric interference of C12O16O17 ions with C13O16O16 ions at m/z = 47.10 We followed the 17O correction procedures recommended by Santrock which is the same algorithm used by the instrument software. Calculations were done using standard spreadsheet software (Excel Version 2013).3. Results and discussion
3.1 Optimization of the bracketing strategy
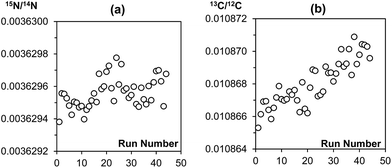
The main purpose of analysing a reference gas during EA-CF-IRMS measurements is for the monitoring of instrumental drifts to enhance measurement repeatability. If we were to replace this function of the reference gas with the bracketing standard, it is important that the bracketing strategy used can sufficiently correct for instrument drifts. With reference to the results given in Tables 1 and 2, we can see that the different bracketing strategies tested are equivalent and can be used without negatively affecting measurement repeatability. This is because drifts in the instrument over time are either negligible (in the case of nitrogen, Fig. 2(a)) or very small (in the case of carbon, Fig. 2(b)). This reinforces our idea that the reference gas is not needed for the purpose of correcting instrument drifts. However, in recognition that the instrument performance may vary between laboratories, we would advise users to perform serial measurements of a reference material as described in this note to identify a bracketing strategy that matches drift characteristics for their instrument best.| Number of samples within brackets | Number of standards forming bracket | ||
|---|---|---|---|
| 1 | 2 | 3 | |
| 1 | 0.05‰ | ||
| 2 | 0.06‰ | ||
| 3 | 0.07‰ | 0.07‰ | 0.07‰ |
| 4 | 0.06‰ | 0.07‰ | 0.05‰ |
| 5 | 0.07‰ | 0.07‰ | 0.05‰ |
| 6 | 0.08‰ | 0.07‰ | 0.05‰ |
| 7 | 0.08‰ | 0.05‰ | 0.08‰ |
| Number of samples within brackets | Number of standards forming bracket | ||
|---|---|---|---|
| 1 | 2 | 3 | |
| 1 | 0.05‰ | ||
| 2 | 0.02‰ | ||
| 3 | 0.02‰ | ||
| 4 | 0.03‰ | 0.02‰ | 0.02‰ |
| 5 | 0.02‰ | 0.01‰ | 0.02‰ |
| 6 | 0.02‰ | 0.02‰ | 0.01‰ |
| 7 | 0.03‰ | 0.02‰ | 0.02‰ |
 | ||
| Fig. 2 Raw (a) 15N/14N and (b) 13C/12C data of a sequence of 44 MSG samples measured consecutively on the EA-CF-IRMS. Each data point represents a single MSG sample. | ||
3.2 Evaluation of sample carryover
In conventional IRMS measurements, the sample sequence consists of unknowns/standards run consecutively in triplicate. A metrologically more sound strategy, however, is to analyze samples only once in a series and to repeat serial analysis three times, ideally on different days, to better describe time dependent changes in instrument performance in the measurement result and its uncertainty (see Table 3). The latter approach, however, is more sensitive to carry-over effects from one measurement to the next. Analytical bias caused by carry-over effects becomes smaller when the same sample is measured repeatedly. For evaluation of carry-over effects, USGS 40 and USGS 41 were measured alternately in blocks of five consecutive measurements. There is no indication that the first measurement of a new block was influenced by the previous sample (see Fig. 3).| Sample no. | Conventional IRMS measurement sequence | Proposed IRMS measurement sequence |
|---|---|---|
| 1 | Bracketing standard | Bracketing standard |
| 2 | Bracketing standard | Sample 1 |
| 3 | Bracketing standard | Sample 2 |
| 4 | Sample 1 | Sample 3 |
| 5 | Sample 1 | Bracketing standard |
| 6 | Sample 1 | Sample 1 |
| 7 | Sample 2 | Sample 2 |
| 8 | Sample 2 | Sample 3 |
| 9 | Sample 2 | Bracketing standard |
| 10 | Sample 3 | Sample 1 |
| 11 | Sample 3 | Sample 2 |
| 12 | Sample 3 | Sample 3 |
| 13 | Bracketing standard | Bracketing standard |
| 14 | Bracketing standard | |
| 15 | Bracketing standard |
3.3 Evaluation of non-reference gas normalized measurements
Results of the analysis of certified/inter-laboratory reference materials are illustrated in Fig. 4. Values calculated with and without normalization to the reference gas were compared to either the certified values (for IAEA CH-3 and IAEA N-2) or recommended values (honey and wheat flour). There was a minimal difference in the quality of the results no matter if the reference gas was used for normalization or not. Both techniques were comparable in terms of measurement accuracy and precision. While within-day repeatability was occasionally better when the reference gas was used, between-day repeatability as the more relevant figure for making data comparable was very similar.Comparison of our measurement results with certificate/recommended values showed that the usual EA-CF-IRMS measurement process of using the reference gas as a correction for instrumental drift effects was essentially redundant. This was because the instrument (in our laboratory) tends to be relatively stable over time. Hence, bracketing standards would be more than sufficient to account for any drifts. However, the question now arises why reference gas measurements should be omitted if there is no apparent improvement in data quality through its removal. The main argument of abolishing conventional double referencing of measurement data is to reduce analytical time and increase sample throughput. In our laboratory, a typical IRMS run used for the simultaneous measurement of carbon and nitrogen isotope ratios in a sample takes 520 seconds. Removing the CO2 reference gas pulses towards the end of the run potentially reduces the analysis time to 400 seconds which translates into time savings of about 20%. The calculated reduction in measurement time, however, is based on current instrumental restrictions. Since there is no longer need for reference gas peaks on the chromatogram, sample gas pulses can be transported from the elemental analyser to the mass spectrometer within a shorter time by using for example a shorter GC column. This has the added benefit of reducing peak broadening which can help to increase resolution and sensitivity. In addition, substantial improvements can be made by incorporating a second or third GC column into the instrumental set-up to make better use of time savings resulting from the omission of reference gas measurements. By directing combustion products alternately to two or three GC columns and the mass analyser using switchable gas valves, gases from solid materials can reach the mass spectrometer in a shorter time because GC separations, as the most time consuming step in the analysis, are conducted in parallel. For an instrumental design with two or two three GC columns, sample throughput could thus be increased by as much as a factor of two to three as compared to available instrumental set-ups. However, it should be noted that reference gas measurements might still be required in such second generation instruments to check instrument performance ahead of an analytical run, e.g. to assess detector linearity, which is easier to conduct using gases as compared to solid samples. In contrast, a solid material can serve as a better analogue for monitoring quality control characteristics than a reference gas as it would have undergone the same analytical processes as the samples.
4. Conclusions
We have shown that δ(13C) and δ(15N) measurements on a conventional EA-CF-IRMS can be made accurately and precisely without normalization to the reference gas, i.e. there is no apparent need to use the reference gas to correct for instrument drifts for carbon and nitrogen isotope ratio measurements. Our approach for omitting the reference gas should also apply to hydrogen and oxygen isotope ratio measurements on the IRMS after performing the necessary tests as described here. Oxygen and hydrogen analyses are done in principle using the same approach as carbon and nitrogen isotope ratio measurements.Different bracketing strategies have been shown to be more than sufficient to monitor and correct drift effects during an analytical run. By removing double referencing (first to the reference gas and then to the bracketing standard), the measurement time on the IRMS can be reduced, in principle, which can translate to significant time and hence cost savings when being implemented in the future design of EA-CF-IRMS instruments.
Acknowledgements
The authors would like to thank the Health Sciences Authority of Singapore, the National University of Singapore and the International Atomic Energy Agency (IAEA Research Contract no. 16530) for their financial and technical support. The Singaporean Ministry of Education is acknowledged for the research scholarship provided to Bay Lian Jie.References
- P. Atahan, J. Dodson, X. Li, X. Zhou, S. Hu, L. Chen, F. Bertuch and K. Grice, J. Archaeol. Sci., 2011, 38, 2811–2817 CrossRef PubMed.
- S. R. Wing, R. J. McLeod, K. L. Clark and R. D. Frew, Mar. Ecol.: Prog. Ser., 2008, 360, 115–123 CrossRef.
- W. Meier-Augenstein, M. M. G. Chartrand, H. F. Kemp and G. St-Jean, Rapid Commun. Mass Spectrom., 2011, 25, 3331–3338 CrossRef CAS PubMed.
- P. Schulte, R. van Geldern, H. Freitag, A. Karim, P. Négrel, E. Petelet-Giraud, A. Probst, J. L. Probst, K. Telmer, J. Veizer and J. A. C. Barth, Earth-Sci. Rev., 2011, 109, 20–31 CrossRef CAS PubMed.
- S. Kelly, K. Heaton and J. Hoogewerff, Trends Food Sci. Technol., 2005, 16, 555–567 CrossRef CAS PubMed.
- C. R. McKinney, J. M. McCrea, S. Epstein, H. A. Allen and H. C. Urey, Rev. Sci. Instrum., 1950, 21, 724–730 CrossRef CAS PubMed.
- W. A. Brand, J. Mass Spectrom., 1996, 31, 225–235 CrossRef CAS.
- J. T. Brenna, T. N. Corso, H. J. Tobias and R. J. Caimi, Mass Spectrom. Rev., 1997, 16, 227–258 CrossRef CAS.
- T. B. Coplen, W. A. Brand, M. Gehre, M. Gröning, H. A. J. Meijer, B. Toman and R. M. Verkouteren, Anal. Chem., 2006, 78, 2439–2441 CrossRef CAS PubMed.
- J. Santrock, S. A. Studley and J. M. Hayes, Anal. Chem., 1985, 57, 1444–1448 CrossRef CAS.
| This journal is © The Royal Society of Chemistry 2015 |


