 Open Access Article
Endothelial cell sensing, restructuring, and invasion in collagen hydrogel structures
Y.
Hosseini
*a,
M
. Agah†
ab and
S. S
. Verbridge†
b
aThe Bradley Department of Electrical and Computer Engineering, Virginia Tech, Blacksburg, Virginia, 24061, USA. E-mail: hosseini@vt.edu
bDepartment of Biomedical Engineering and Mechanics, Virginia Tech, Blacksburg, Virginia, 24061, USA
First published on 3rd September 2015
Abstract
Experimental tools to model cell–tissue interactions will likely lead to new ways to both understand and treat cancer. While the mechanical properties and regulation of invasion have been recently studied for tumor cells, they have received less attention in the context of tumor vascular dynamics. In this article, we have investigated the interaction between the surfaces of structures encountered by endothelial cells invading their surrounding extracellular matrix (ECM) during angiogenesis. For this purpose, we have fabricated round and sharp geometries with various curvature and sharpness indices in collagen hydrogel over a wide range of stiffness to mimic different microenvironments varying from normal to tumor tissues. We have then cultured endothelial cells on these structures to investigate the bi-directional interaction between the cells and ECM. We have observed that cell invasion frequency is higher from the structures with the highest sharpness and curvature index, while interestingly the dependence of invasion on the local micro-geometry is strongest for the highest density matrices. Notably, structures with the highest invasion length are linked with higher deformation of side structures, which may be related to traction force-activated signaling suggesting further investigation. We have noted that round structures are more favorable for cell adhesion and in some cases round structures drive cell invasion faster than sharp ones. These results highlight the ability of endothelial cells to sense small variations in ECM geometry, and respond with a balance of matrix invasion as well as deformation, with potential implications for feedback mechanisms that may enhance vascular abnormality in response to tumor-induced ECM alterations.
Insight, innovation, integrationExperimental tools to model cell–tissue interactions will likely lead to new ways to both understand and treat cancer. While the mechanical properties and regulation of invasion have been recently studied for tumor cells, they have received less attention in the context of tumor vascular dynamics. This paper explores the interaction of endothelial cells with extracellular matrix structures found in blood vessels. We have utilized microfabrication to create such structures in collagen hydrogels and demonstrated novel cellular sensing, remodeling, and invasion of the surrounding tissues ranging from normal to tumor. Furthermore, this report discusses the role of sharp vs. curved structures, mechanical forces, and local variations in geometry in soft and stiff structures in driving cell invasion. |
Introduction
In tissue engineering, collagen hydrogels are used extensively as scaffolds to model the extracellular matrix (ECM) due to the abundance of collagen as the most prevalent ECM protein in the human body. Moreover, it is convenient to adjust the chemical and mechanical characteristics of collagen hydrogels1,2 and to investigate cell invasion in physiologically relevant 3D microenvironments.3,4 Many studies have investigated the role of molecular signaling driven by soluble proteins such as vascular endothelial growth factor (VEGF), fibroblast growth factor (FGF), and platelet-derived growth factor (PDGF), which have underpinned the standard paradigm of tumor angiogenesis and the angiogenic switch.5–8 However, recent evidence suggests that mechanical cues likely play an equally important role in several aspects of tumor progression.Mechanical cues such as matrix density, pore size, and fiber thickness regulate many cell behaviors. A dense matrix of fibrous collagen indicates a high risk for breast cancer metastasis.9,10 Small pores permit cell attachment and faster but limited cell motility, whereas large pores are better suited for long-range cell motility.11,12 Furthermore, the roles of matrix stiffness and pore size have previously been studied independently. It has been shown that decreasing the confinement size by decreasing the channel width for a given ECM stiffness enhances the cell migration, while increasing the ECM stiffness increases the cell migration through the same confinement effect.13 However, the independent effects are a challenge to decouple and the exact role of more complex aspects of the ECM structural microenvironment remains unclear.
In terms of substrate topography, studies have shown that the cell migration speed and direction depend on the curvature of the surface.14 Geometrical cues play a role in determining the position of new branching sites from pre-existing mammary epithelial cells15 and tumor cell invasion has been investigated from different positions within mammary ducts;4 however, the relevance to tumor vascular networks, which are characterized by complex branching structures, has not been demonstrated clearly. Moreover, blood vessel diameters in tumor environments are uneven and vary in size abruptly and abnormally compared to those in healthy blood vessels.16 In our previous work, we have observed that local ECM cues in certain contexts may override more traditional chemical drivers of endothelial cell (EC) invasion, however, analyzing the mechanisms has remained a challenge due to limited ability to control the ECM topography presented to cells.17 In addition, the mechanism by which the curvature index, which represents the topography of the basement membrane of blood vessels, impacts EC invasion has rarely been studied.
The traditional methods to study EC–tissue interactions have involved seeding cells within or on top of scaffolds made from natural ECM hydrogels (e.g., matrigel, collagen, fibronectin), or synthetic polymeric scaffolds (e.g. poly(lactic-co-glycolic acid) (PLGA) or poly(ethylene glycol) (PEG)).18,19 These platforms typically do not contain complex gradients or heterogeneity that is essential to regulate relevant cellular phenotypes such as migration or invasion. While in vivo studies provide a higher degree of physiological relevance, dynamic experiments are challenging. Also, generally in vivo models provide correlations rather than causal information regarding the role of the microenvironment in regulating invasion dynamics, due to an inability to define or tune key microenvironment parameters in living systems. Microfluidic blood vessel models can provide a high degree of physiological relevance as well as the potential for dynamic, causal studies. They have been developed using either lithographic top-down or sacrificial methods to define template channels coated with ECs as biomimetic vessels; however, these studies have been mainly focused on simple structures including rectangular geometries and straight vessels.20–23
In this paper, we have investigated the effect of different microscale topographies formed in collagen hydrogels on EC migration and capillary formation. We have fabricated a set of sharp and round structures that mimic the geometries in blood vessels such as the tube and branching sites over a wide variety of stiffness to model tissues with different mechanical properties. Our approach takes full advantage of the ability to control, with high precision, the topological microenvironment of tissues. We have furthermore characterized the cell invasion process by measuring the average sprout length and invasion frequency. Finally, we have investigated the cell–ECM interaction of ECs with sharp and round structures revealing new bi-directional regulation between the ECM microstructure and EC invasion. Such a technology will enable the in vitro definition, at an unprecedented spatial resolution, of 3D tissue geometries that mimic the complex structures found in vivo. These platforms will enable detailed studies of the interactions between mechanical and chemical cues in tumor processes such as angiogenesis and metastasis, as well as the effect of cancer drugs in targeting these processes in a physiologically relevant context.
Materials and methods
Collagen hydrogel
![[thin space (1/6-em)]](https://www.rsc.org/images/entities/char_2009.gif) 000g for 90 minutes. The solution was then kept at −20 °C overnight and subsequently lyophilized for 48 h until complete dryness and kept at −20 °C until reconstitution for 3D cell culture experiments.
000g for 90 minutes. The solution was then kept at −20 °C overnight and subsequently lyophilized for 48 h until complete dryness and kept at −20 °C until reconstitution for 3D cell culture experiments.
Cell culture
Human umbilical vein endothelial cells (HUVECs) (Lonza, MD, USA) were cultured in EGM2 basal media supplemented with a growth factor bullet kit (Lonza). HUVECs were seeded at 200 cells per mm2 on the collagen hydrogel devices between passages 3 and 4 to yield a rapid monolayer.25 After formation of a confluent monolayer on the hydrogel surface (∼48 hours), hVEGF165 (10 ng ml−1) (Cell Signaling Technology, MA, USA) and 12-O-tetradecanoylphorbol-13-acetate (TPA) (40 ng ml−1) (Cell Signaling Technology) were added as previously reported.17 Cell media and growth factors were changed every 48 h during the experiment. 5 mg ml−1 hydrogel devices were fixed 48 h after the addition of the growth factors (VEGF and TPA). This time for 7.5 mg ml−1 and 10 mg ml−1 hydrogel devices was increased to 72 h.Immunofluorescence staining
Cells and collagen fibers were fixed at room temperature for 20 min with 10% buffered formalin (Fisher Scientific). Between each step, the samples were washed 3 times with PBS for 5 min in each rinse. They were permeabilized by submerging in Superblock blocking buffer in phosphate buffered saline (PBS) (Thermo Scientific) at room temperature for 2 h while gently shaking on an orbital shaker. In the first stage, they were incubated with primary mouse monoclonal anti-collagen I (Abcam, MA, USA) (1![[thin space (1/6-em)]](https://www.rsc.org/images/entities/char_2009.gif) :
:![[thin space (1/6-em)]](https://www.rsc.org/images/entities/char_2009.gif) 1000) and rabbit monoclonal VE-Cadherin antibody (Cell Signaling Technology) (1
1000) and rabbit monoclonal VE-Cadherin antibody (Cell Signaling Technology) (1![[thin space (1/6-em)]](https://www.rsc.org/images/entities/char_2009.gif) :
:![[thin space (1/6-em)]](https://www.rsc.org/images/entities/char_2009.gif) 250) at 4 °C overnight. In the second stage, they were incubated with anti-mouse Alexa Flour 546 (Life Technologies) (1
250) at 4 °C overnight. In the second stage, they were incubated with anti-mouse Alexa Flour 546 (Life Technologies) (1![[thin space (1/6-em)]](https://www.rsc.org/images/entities/char_2009.gif) :
:![[thin space (1/6-em)]](https://www.rsc.org/images/entities/char_2009.gif) 250) to stain the fibers, DAPI (Life Technologies) (1
250) to stain the fibers, DAPI (Life Technologies) (1![[thin space (1/6-em)]](https://www.rsc.org/images/entities/char_2009.gif) :
:![[thin space (1/6-em)]](https://www.rsc.org/images/entities/char_2009.gif) 5000) to stain the nuclei, and anti-rabbit Alexa Flour 488 (Life Technologies) (1
5000) to stain the nuclei, and anti-rabbit Alexa Flour 488 (Life Technologies) (1![[thin space (1/6-em)]](https://www.rsc.org/images/entities/char_2009.gif) :
:![[thin space (1/6-em)]](https://www.rsc.org/images/entities/char_2009.gif) 250) to stain cell–cell junctions at room temperature for 1 hour. To stain the actin filaments, in the second stage, cells were alternately incubated with Phalloidin Alexa Flour 488 (Life Technologies) (1
250) to stain cell–cell junctions at room temperature for 1 hour. To stain the actin filaments, in the second stage, cells were alternately incubated with Phalloidin Alexa Flour 488 (Life Technologies) (1![[thin space (1/6-em)]](https://www.rsc.org/images/entities/char_2009.gif) :
:![[thin space (1/6-em)]](https://www.rsc.org/images/entities/char_2009.gif) 250) excluding the anti VE-Cadherin stain.
250) excluding the anti VE-Cadherin stain.
Hydrogel structure fabrication
The structures were first fabricated in silicon utilizing deep reactive ion etching (DRIE) (AMS 100, France) as we have previously published.30 Utilizing soft lithography, the PDMS stamps with the negative replica of structures were fabricated. The stamps were treated with oxygen plasma (Harrick-Plasma, NY, USA) and coated with 1% bovine serum albumin (BSA) for 30 min at room temperature and kept on ice under sterile conditions in a biosafety cabinet. This makes the PDMS surface non-adhesive to collagen hydrogel. Neutralized collagen solutions with final concentrations of 5 mg ml−1, 7.5 mg ml−1, and 10 mg ml−1 were made from concentrated collagen stock solutions and kept in separate microtubes on ice. BSA from the PDMS stamps was aspirated and replaced with a ∼50 μl drop of neutralized collagen. As 7.5 mg ml−1 and 10 mg ml−1 collagen solutions are highly viscous, when the collagen drops are poured on the PDMS structures, bubbles may form between the PDMS structures and the collagen hydrogel. To remove these potential bubbles from the structures and hydrogel drops, 7.5 mg ml−1 and 10 mg ml−1 hydrogel devices were placed on a beaker filled with ice. The beakers were sealed with perforated parafilm and placed under house vacuum for about 2 min. Then, the neutralized collagen solution was pipetted on to a coverslip with two strips of the PDMS support on both sides to hold the collagen solution, and the PDMS stamps with structures were cast against the collagen solution.Cell invasion characterization and analysis
The cell invasion progress was monitored and captured by live imaging utilizing an inverted optical microscope (Axio Observer.Z1, Carl-Zeiss) equipped with an incubation chamber with a 10× objective lens. Each hydrogel device was imaged right before cell seeding and then every 24 h until fixation. In order to characterize the cell invasion progress from the structures of interest, we measured the cell invasion frequency and cell invasion length utilizing Zen Lite 2012 software (Carl-Zeiss). The number of sprouts was counted from each structure (from the tip to the edge of structures). Structures with no sprouts (zero count) were also included in the measurement. The cell invasion length was measured by the ruler feature of the Zen Lite software. Because the cells were lying on the sidewall of the microchannel, the aforementioned parameters could be simply measured as they were imaged from the top utilizing the inverted optical microscope.Statistical analysis
The cell invasion frequency and average length were expressed as mean with the standard error of mean (SEM). One-way ANOVA with Tukey’s honest significant difference (JMP Software) was performed to find significant differences between the cell invasion length results. The chi-square test with Poisson distribution (JMP Software) was performed to find significant differences between the cell invasion frequency results. Differences were considered statistically significant for (***p < 0.001, **p < 0.01, and *p < 0.05) with a level of significance α = 0.05.Results
Collagen hydrogel structure fabrication
Three sets of round and sharp structures with different curvature and sharpness indices were designed and fabricated in the collagen hydrogel. The curved structures are comprised of semi-elliptic structures with minor (b) and major radii (a), with the corresponding curvature indices of b/a2 and a/b2 on the tip and side of the structures, as shown in Fig. 1a. On the other hand, the sharp structures are comprised of flat surfaces on the sides while intersecting each other with an angle (θ) on the tip as shown in Fig. 1b. As shown in Fig. 1a and b, cells were seeded on the structures, along with the top and bottom of the channels. Cells on the curved structures sense the curvature index between b/a2 and a/b2, and on the sharp structures sense the flat surfaces with an angle (θ) on the tip. Table 1 provides the dimension, curvature index, and angle of the fabricated structures. Topography a contains round (Ra) and sharp (Sa) structures with x = 100 μm and y = 50 μm, Topography b contains round (Rb) and sharp (Sb) structures with x = 100 μm and y = 125 μm, and Topography c contains round (Rc) and sharp (Sc) structures with x = 100 μm and y = 250 μm. The spacing between adjacent structures in all topographies is 150 μm. Each device contains five topographies from each set of round and sharp structures docked along a 500 μm-wide and a 95 μm-deep microchannel (Fig. 2a–c).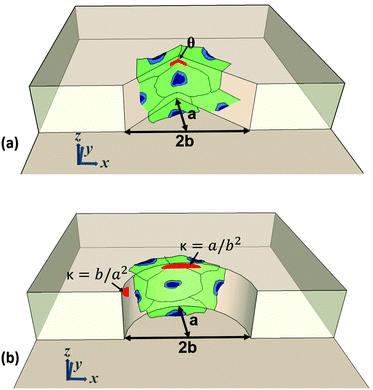 | ||
| Fig. 1 Orientation of seeded cells and dimensions of fabricated structures on (a) sharp and (b) curved structures. | ||
| a (μm) | 2b (μm) | Axial ratio (a/b) | Angle (θ)/curvature index (C.I.) | ||
|---|---|---|---|---|---|
| Topography a | Sharp a (Sa) | 100 | 50 | 4 | θ = 28° |
| Round a (Ra) | C.I. min = 0.0025, max = 0.16 | ||||
| Topography b | Sharp b (Sb) | 125 | 1.6 | θ = 65° | |
| Round b (Rb) | C.I. min = 0.0062, max = 0.025 | ||||
| Topography c | Sharp c (Sc) | 250 | 0.8 | θ = 100° | |
| Round c (Rc) | C.I. min = 0.0064, max = 0.0125 | ||||
Furthermore, Table 2 shows the polymerization conditions of hydrogel devices with different concentrations, as well as the depth of the hydrogel microchannel, and fabrication yield. The depth of the hydrogel channel was calculated by seeding fluorescent microbeads on the hydrogel devices, and measuring the difference between the point of focus of microbeads on the top and the bottom of microchannels by using an inverted microscope (Axio Observer.Z1, Carl-Zeiss, Germany). For cell seeding experiments, we used collagen hydrogel topographies whose curvature and sharpness indices were within 10% of those of the silicon template. As shown in Table 1, the yield for 5 mg ml−1 concentration was 70% while yields for 7.5 mg ml−1 and 10 mg ml−1 were more than 90%.
| 5 mg ml−1 | 7.5 mg ml−1 | 10 mg ml−1 | |
|---|---|---|---|
| Mold treatment | No treatment | Under vacuum | Under vacuum |
| Polymerization | |||
| Pre-incubation | 4 °C for 1 hour | 4 °C for 3 hours | 4 °C for 3 hours |
| Incubation | 37 °C for 1 hour | 37 °C for 1 hour | 37 °C for 1 hour |
| z (depth) = (measured D, SD) | 67.7 μm, 6.8 μm | 71.7 μm, 3.9 μm | 68.8 μm, 3.1 μm |
| Yield (within 10% limit) | ∼70% | ∼90% | ∼90% |
Cell sensing and remodeling of collagen hydrogel
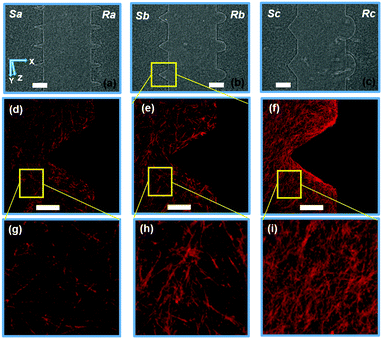
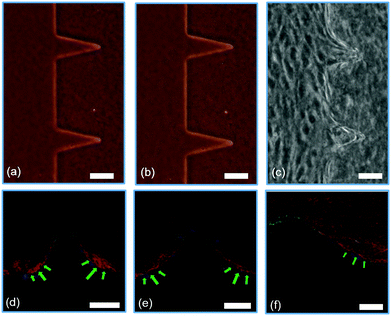
Fig. 3 shows the confocal images of structures Sa, Sc, Ra, and Rc with developed neo-vessels from the tip of the structures. We note that in all four images, the neo-vessels were formed from the regions having higher curvature or sharpness indices. These parameters were chosen so that cells sense structures with a wide range of sharpness (from flat surfaces to sharp angels) and curvature (semi-ellipse structures with various curvature indices). Fig. 4a and b show the micrograph of structure Sa right after fabrication and 3 days after fabrication without the presence of cells. The structures have not shown any sign of degradation. Fig. 4c shows the micrograph of the same structures with cell seeding after 3 days (1 day after the addition of growth factor). The cell–cell attachment has started to deform the junctions and sides of the structures. In more detail, Fig. 4d–f show this phenomenon imaged with the confocal microscopy. These images show structures Sa, Sb, and Sc (collagen fibers shown in red) 1 day after the addition of the growth factors to the cell media with overlay images of the hydrogel structures before cell culturing (collagen fibers shown in white). As the images suggest, the ECM has been deformed from the end sides resulting in an increase in the collagen fiber density at those locations (saturated red color). The structures with the highest sharpness and curvature indices have suffered larger alteration of collagen micropatterned structures (shown with green arrows).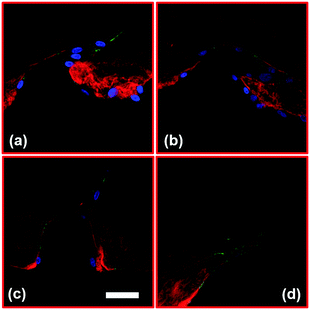 | ||
| Fig. 3 Confocal images of cell invasion through collagen hydrogel structures for (a) Sa, (b) Sc, (c) Ra, and (d) Rc. [Red: collagen fibers, blue: nuclei, and green: VE-Cadherin]. Scale bar: 50 μm. | ||
Collagen hydrogel structures mediate cell invasion
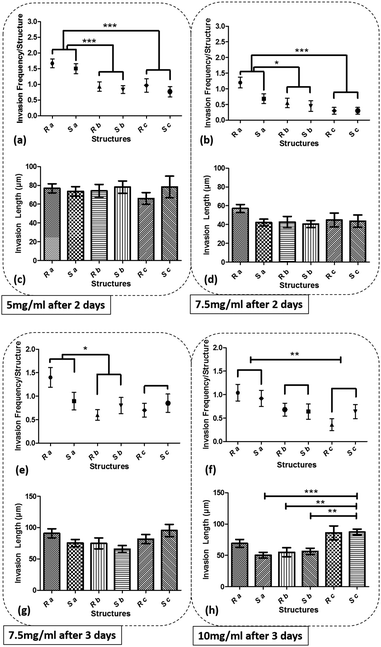
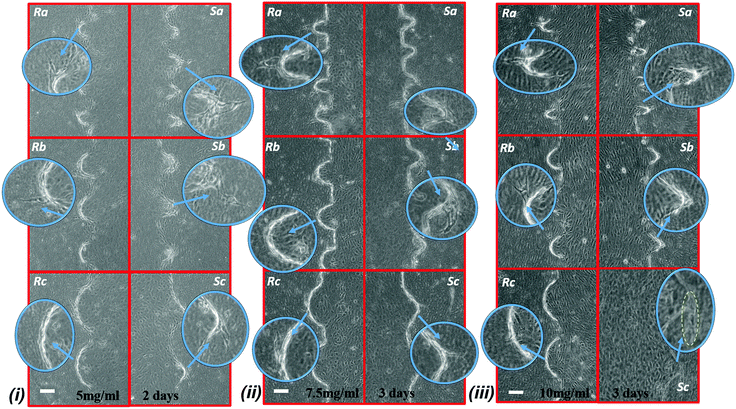
Fig. 5 shows the graph of the endothelial cell invasion frequency and length for the hydrogel devices. The invasion length and frequency were measured after 2 days for 5 mg ml−1 and 7.5 mg ml−1 devices and 3 days for 7.5 mg ml−1 and 10 mg ml−1 devices. For all cases, we did not find any significant difference between the invasion frequency within the same sharpness index category (e.g., within Topography a, b or c). However, the more common trend (which was not statistically significant) was towards a higher invasion frequency for the round as opposed to the sharp structures. To facilitate the comparison between index groups, the results from the same index category group were merged and compared with other groups (e.g., Topography avs.Topography b). For instance, in 5 mg ml−1 hydrogel devices, we did not find any significant difference between Sa and Ra, but the invasion frequency of (Sa and Ra) was significantly higher compared to (Sb and Rb). For 5 mg ml−1 devices (6 devices; 30 samples for each structure), we observed that cell invasion frequency was significantly higher for Topography a compared to Topography b and c (Fig. 5a). For 7.5 mg ml−1 devices (4 devices; 20 structures from each), after 2 days, cell invasion frequency was significantly higher for Topography a compared to Topography b and Topography c (Fig. 5b), and after 3 days, cell invasion frequency remained significantly higher for Topography a compared to Topography b but not Topography c (Fig. 5e). For 10 mg ml−1 devices (5 devices; 25 structures from each), cell invasion frequency was significantly higher for Topography a compared to Topography c (Fig. 5f) but not Topography b. The invasion lengths for 5 mg ml−1 and 7.5 mg ml−1 devices did not result in any significant differences between various structures (Fig. 5c, d and g), however, these differences were significant at 10 mg ml−1, with the wider structures driving longer invasions (Fig. 5h). Furthermore, it can be observed that the cell invasion length for the corresponding structures is higher from the softer hydrogel devices while they were measured at the same time point (e.g., 5 mg ml−1 and 7.5 mg ml−1 devices after 2 days, and 7.5 mg ml−1 and 10 mg ml−1 devices after 3 days) (Fig. 5c, d, g and h). As it has been shown already that softer hydrogel substrates lead to increased EC invasion,25,31,32 we will focus the following result and analysis sections on the EC invasion from 5 mg ml−1 devices fixed after 2 days, and 7.5 mg ml−1 and 10 mg ml−1 devices fixed after 3 days. Where we have cross-compared the invasion frequency or length, we have done so using the same time-points. Fig. 6 shows the micrograph of collagen hydrogel structures with HUVECs at final concentrations of 5 mg ml−1, 7.5 mg ml−1, and 10 mg ml−1. Each image includes a zoom-in inset that shows the structure of interest along with new sprouts.Structure sensing versus cell invasion
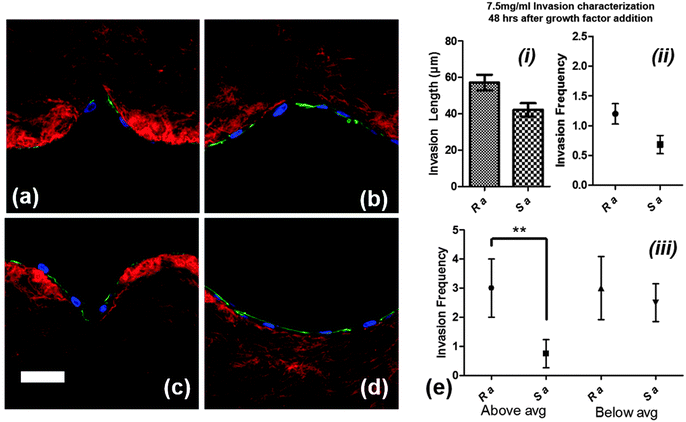
As the confocal images show in Fig. 7a–d, the round surfaces (Ra and Rc) are more favorable than sharp structures (Sa and Sc) for cell attachment. Cells on the wall of sharp structures form an arc to bypass the sharp tip whereas the cells fully sense the round structures during the initial phase of growth and proliferation. We compared the cell invasion length and invasion frequency from Sa and Ra for 7.5 mg ml−1 devices, 2 days after the addition of growth factors, before the cell sprouts become so long that there would be no significant difference between them for comparison (because of saturation of the average length) (Fig. 7e(i) and (ii)). While there was no significant difference in the invasion length or frequency between the two structures, the trend was towards Ra maintaining a higher average invasion length and frequency. In order to evaluate which structures promote cell invasion faster in terms of producing longer neo-vessels, we measured the number of sprouts which were above and below average (51.8 μm) for both groups (each 20 structures) since smaller neo-vessels are continuously being produced after the addition of growth factors. As shown in the graph in Fig. 7e(iii), when analyzed in this way the round structures (Ra) produced longer neo-vessels than the sharp structures (Sa), with a statistically significant difference (p < 0.01).Cells sensing local curvature and sharpness indices
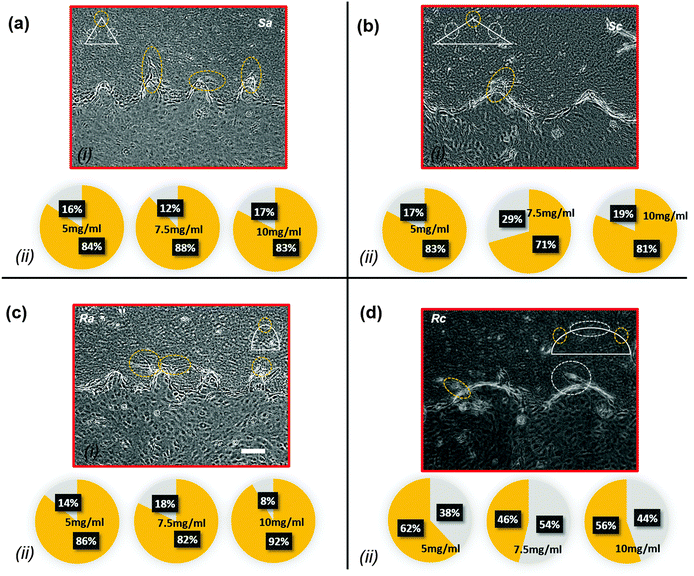
Each structure within a hydrogel device consists of multiple sub-regions with different local curvature or sharpness indices. Curved structures are in fact a semi-elliptical structure with variable curvature indices along their perimeter. In Topography a, the sub-region with the highest curvature region is located on the tip, whereas in structures c, the sub-regions with the highest curvature are located on the sides. On the other hand, the sharp structures consist of side flat sub-regions and a sharp turn on the tip. Fig. 8a–d(i) show the sites of low- and high-index curved and sharp regions for Topography a and Topography c, along with the neo-vessels, which are marked with white and orange dash circles, respectively. For structures Sa, Ra, Sc, and Rc, we assumed the radius of the yellow circles centered on the tip of the structures, which represent the sub-regions of high curvature/sharpness indices to be 40 μm, 40 μm, 50 μm, and 70 μm. Outside these sub-regions, we considered that the invasion was initiated from the sub-regions with the lower curvature/sharpness index. Fig. 8a–d(ii) show pie charts of neo-vessel distribution across different sub-regions of curved and sharp structures for 5 mg ml−1, 7.5 mg ml−1, and 10 mg ml−1 hydrogel devices for Sa, Ra, Sc, and Rc, respectively. In Fig. 5a, b, e and f, it is shown that Topography a (Sa and Ra), which includes the structures with the highest curvature/sharpness index, produces more neo-vessels compared to the other topographies. Here, within the same structure group, it is shown that cell invasion is observed more from the sharper sub-regions or sub-regions with the higher curvature index. As evident in Fig. 8a(ii) and b(ii), on the structures Sa and Sc, the majority of neo-vessels were formed from the sharp tip of the structures. Likewise, as shown in Fig. 8c(ii), on structures Ra, the majority of neo-vessels were formed from the tip of the structures where the curvature index is the highest. However, in structures Rc the cell invasion was distributed equally across the perimeter as shown in Fig. 8d(ii).Discussion
In this study, we have explored the interaction of ECs with sharp and curved geometries in terms of ECM sensing, remodeling and invasion. We observed the highest invasion frequency for the narrower ECM structures over all of our experiments, while this frequency was reduced at higher collagen concentrations. Both of these observations are as expected based on our prior observations of enhanced EC invasion in the sharp corners of microchannels,17 as well as observations by ourselves and others on the inhibition of EC invasion in denser hydrogels.25,31,32 However, we observed a trend towards higher invasion rates for the round versus sharp structures of the same width, although this was not statistically significant. We believe this may be related to our observation that during the initial phase of cell adhesion, round structures were more favorable for cell attachment than sharp structures. We furthermore, interestingly, observed the strongest dependence of the invasion length on micro-geometry for the highest density collagen. In addition, the cell–cell attachment force on the edges of the collagen hydrogel structures deformed these structures locally. All of these latter observations suggest a balance between collagen restructuring versus invasion resulting in a complex dependence of the invasion length on the ECM density and structure.Previous studies have shown that regions of tumor cell invasion were correlated with high mechanical stress from the tumor sites.4 Traction forces at the invasion site have also been demonstrated to be associated with local proteolytic activity, facilitating the cancer cell invasion via matrix degradation.33,34 In our current work, cell–cell and cell–ECM attachments might induce such traction forces that enhance the cell invasion process in nearby structures where higher local cell density mediated by sharpness and curvature indices results in an ECM that is more amenable to invasion. As noted previously, we observed the higher traction force adjacent to regions where we observed the higher cell invasion. In future work, the impact of such forces can be investigated by varying the geometry on the edges of the structures while keeping the curvature and sharpness indices constant where cells have previously been observed to initiate invasion.
One factor that might affect the cell invasion length among different structures is that the growth factors might not be equally distributed if the cell invasion density is not the same across all structures. For instance, it was observed that there are more cell sprouts from Topography a than Topography c, while Topography c maintain an even larger surface area. This means that in Topography c, a smaller number of cell sprouts have more room to grow while there is less competition for growth factors among the sprouts. Furthermore, the progress of cell invasion and growth of the sprouts is a continuous phenomenon that starts right after the addition of the growth factors until the cells are fixed. Therefore, the average invasion length is biased downwards by the newly formed vessels. However, the structures that promote cell invasion should contain longer neo-vessels. At early time-points, this difference might be very small, yet as time passes and the number of neo-vessels increases, there might not be any noticeable difference between the lengths of neo-vessels. Our preliminary attempts to remove this bias by binning of above versus below average length sprouts in one particular case (7.5 mg ml−1 hydrogel devices fixed 48 h after addition of growth factors) suggested that within one curvature and sharpness group, round structures promote cell invasion earlier in the process than the sharp structures, resulting in longer than average invasion lengths persisting at later times. The slower invasion process from these sharp structures might be attributed to the additional time and energy cells spend on remodeling and attaching to the sharp structures, and also may help explain the observed trend of higher invasion frequency for round versus sharp structures.
We have demonstrated experimentally that cell invasion frequency is dependent on geometrical cues, and geometries with the highest curvature/sharpness index produced more neo-vessels. For 7.5 mg ml−1 devices, cell invasion frequency was significantly higher for Topography a (narrowest) than Topography b (intermediate width) and Topography c (widest) (Fig. 5b) after 2 days, and for Topography a (narrowest) than just Topography b (intermediate width) after 3 days (Fig. 5e). For 10 mg ml−1 devices, cell invasion frequency was significantly higher for Topography a compared to Topography c (widest) after 3 days (Fig. 5f). These results suggest that with increasing time, the cell invasion dependency on the curvature/sharpness index decreases (Fig. 5b and e), therefore these differences may be most relevant to early stages of sprouting and neo-vessel formation. Furthermore, we can argue that the curvature/sharpness index plays a larger role than the surface area in driving cell invasion from the stiffer substrate (Fig. 5e and f) since Topography c has a higher surface area but a lower surface curvature than Topography b. Furthermore, as noted, we observe the largest variation in the invasion length with geometry for the stiffest ECM, e.g. for 10 mg ml−1 devices the average invasion length from Topography c was higher compared to other structures (Fig. 5h). These observations indicate that by increasing the mechanical stiffness of the ECM, the cell invasion dependency on curvature and sharpness configurations increases. This might be partially attributed to the low number of cell sprouts competing for cell media and growth factors within Topography c, however additional mechanisms related to effects such as traction forces and matrix restructuring should be examined in future work, while microfluidic channel feeding may be used to remove compounding variations in nutrition levels.
Overall, our present work provides evidence that ECs balance mechanical re-organization of the ECM structure with cellular invasion, depending on the curvature index and matrix compliance. Such a dynamic regulation of the ECM by vascular structures has not been demonstrated previously, and suggests that there may be complex feedback loops between the ECM structure and geometry and vascular dynamics that could provide therapeutic targets, or else lead to uncontrolled tumor growth if left unchecked. Our observation of enhanced dependence of the sprout length on the local ECM micro-geometry at higher versus lower tissue density may also have important implications for our understanding of the leaky, tortuous, branching, and generally highly disordered vasculature observed in dense tumor tissues. Our platforms will enable a unique exploration of the transition in EC dynamics from 2D to 3D geometries in terms of alteration in cell morphology and focal adhesion dynamics as well as studies of the molecular signaling regulating the observed cell dynamics.
Conclusions
In this work, we fabricated lithographically defined complex surfaces in collagen hydrogel to mimic the microstructures that vascular networks may encounter in the natural ECM. The mechanical properties of the hydrogel structures were tuned to mimic a wide range of tissues from normal to tumor. We studied the interaction of cells with such microenvironments, which greatly impact the processes of cell proliferation, migration and development of capillary networks, all of which are significant factors in tumor neo-vascularization and growth. We found that ECs are able to fully interact with round microstructures at earlier time-points as compared with sharp ones. Furthermore, cells remodeled the microstructures with the higher sharpness/curvature index to a greater degree, and cell invasion frequency was the highest in most cases from the microstructures with the highest sharpness/curvature index. Finally, we found that dependence of the EC invasion distance on the local ECM micro-geometry was the strongest at higher matrix density. In summary, as stiffness increases from a softer to stiffer substrate, the cell invasion frequency and length decrease within the same structures. While, keeping the stiffness fixed, as the sharpness and curvature indices increase, these parameters increase. Furthermore, we showed that curved structures enhance cell invasion at early time-points. Such exploration of cell–ECM interactions and elucidation of the basic mechanisms may provide novel designs for vascular-targeting cancer treatments, and potentially improve the performance of existing anti-vascular drugs which have been a major research and investment focus.Acknowledgements
We would like to thank the Institute for Critical Technology and Applied Science (ICTAS), the National Science Foundation (CBET-1403304 to M. Agah), and the National Institutes of Health (NIBIB-R21EB019123 to S. Verbridge) for financially supporting this project. Furthermore, we would like to thank Mr Donald Leber at the Micron Cleanroom Facility in Virginia Tech and Dr Bob Geil at the Institute for Advanced Materials, NanoScience and Technology in the University of North Carolina at Chapel Hill for their assistance with the fabrication process, and Dr Kristi DeCourcy at the Fralin Biotechnology Center in Virginia Tech for her assistance with the confocal imaging, respectively. We also would like to thank Dr Elizabeth Antoine, Dr Celeste Nelson, and Mr Aboozar Monavarfeshani for providing helpful discussions.Notes and references
- B. V. Slaughter, S. S. Khurshid, O. Z. Fisher, A. Khademhosseini and N. A. Peppas, Adv. Mater., 2009, 21, 3307–3329 CrossRef CAS PubMed.
- N. Annabi, A. Tamayol, J. A. Uquillas, M. Akbari, L. E. Bertassoni, C. Cha, G. Camci-Unal, M. R. Dokmeci, N. A. Peppas and A. Khademhosseini, Adv. Mater., 2014, 26, 85–123 CrossRef CAS PubMed.
- Y. Zheng, J. Chen, M. Craven, N. W. Choi, S. Totorica, A. Diaz-Santana, P. Kermani, B. Hempstead, C. Fischbach-Teschl, J. A. Lopez and A. D. Stroock, Proc. Natl. Acad. Sci. U. S. A., 2012, 109, 9342–9347 CrossRef CAS PubMed.
- E. Boghaert, J. P. Gleghorn, K. Lee, N. Gjorevski, D. C. Radisky and C. M. Nelson, Proc. Natl. Acad. Sci. U. S. A., 2012, 109, 19632–19637 CrossRef CAS PubMed.
- G. Bergers and L. E. Benjamin, Nat. Rev. Cancer, 2003, 3, 401–410 CrossRef CAS PubMed.
- P. Carmeliet and R. K. Jain, Nature, 2011, 473, 298–307 CrossRef CAS PubMed.
- S. Y. Zhang, X. Bu, H. Zhao, J. T. Yu, Y. M. Wang, D. Li, C. C. Zhu, T. Zhu, T. T. Ren, X. P. Liu, L. B. Yao and J. Su, J. Pathol., 2014, 232, 436–448 CrossRef CAS PubMed.
- A. Hoeben, B. Landuyt, M. S. Highley, H. Wildiers, A. T. Van Oosterom and E. A. De Bruijn, Pharmacol. Rev., 2004, 56, 549–580 CrossRef CAS PubMed.
- S. M. Kakkad, M. Solaiyappan, P. Argani, S. Sukumar, L. K. Jacobs, D. Leibfritz, Z. M. Bhujwalla and K. Glunde, J. Biomed. Opt., 2012, 17, 116017 CrossRef PubMed.
- C. E. Barcus, P. J. Keely, K. W. Eliceiri and L. A. Schuler, J. Biol. Chem., 2013, 288, 12722–12732 CrossRef CAS PubMed.
- C. M. Murphy and F. J. O'Brien, Cell adhesion & migration, 2010, 4, 377–381 Search PubMed.
- B. A. Harley, H. D. Kim, M. H. Zaman, I. V. Yannas, D. A. Lauffenburger and L. J. Gibson, Biophys. J., 2008, 95, 4013–4024 CrossRef CAS PubMed.
- A. Pathak and S. Kumar, Proc. Natl. Acad. Sci. U. S. A., 2012, 109, 10334–10339 CrossRef CAS PubMed.
- M.-C. Kim, C. Kim, L. Wood, D. Neal, R. D. Kamm and H. H. Asada, Integr. Biol., 2012, 4, 1386–1397 RSC.
- C. M. Nelson, M. M. VanDuijn, J. L. Inman, D. A. Fletcher and M. J. Bissell, Science, 2006, 314, 298–300 CrossRef CAS PubMed.
- D. Fukumura, D. G. Duda, L. L. Munn and R. K. Jain, Microcirculation, 2010, 17, 206–225 CrossRef CAS PubMed.
- S. S. Verbridge, A. Chakrabarti, P. DelNero, B. Kwee, J. D. Varner, A. D. Stroock and C. Fischbach, J. Biomed. Mater. Res., Part A, 2013, 101, 2948–2956 CrossRef PubMed.
- C. Fischbach, R. Chen, T. Matsumoto, T. Schmelzle, J. S. Brugge, P. J. Polverini and D. J. Mooney, Nat. Methods, 2007, 4, 855–860 CrossRef CAS PubMed.
- Y. Li, J. Rodrigues and H. Tomas, Chem. Soc. Rev., 2012, 41, 2193–2221 RSC.
- W. Bian, B. Liau, N. Badie and N. Bursac, Nat. Protoc., 2009, 4, 1522–1534 CrossRef CAS PubMed.
- A. Golden and J. Tien, Lab Chip, 2007, 7, 720–725 RSC.
- C. M. Kraning-Rush, S. P. Carey, M. C. Lampi and C. A. Reinhart-King, Integr. Biol., 2013, 5, 606–616 RSC.
- S. Raghavan, C. M. Nelson, J. D. Baranski, E. Lim and C. S. Chen, Tissue Eng., Part A, 2010, 16, 2255–2263 CrossRef CAS PubMed.
- N. Rajan, J. Habermehl, M. F. Cote, C. J. Doillon and D. Mantovani, Nat. Protoc., 2006, 1, 2753–2758 CrossRef CAS PubMed.
- V. L. Cross, Y. Zheng, N. Won Choi, S. S. Verbridge, B. A. Sutermaster, L. J. Bonassar, C. Fischbach and A. D. Stroock, Biomaterials, 2010, 31, 8596–8607 CrossRef CAS PubMed.
- M. J. Paszek, N. Zahir, K. R. Johnson, J. N. Lakins, G. I. Rozenberg, A. Gefen, C. A. Reinhart-King, S. S. Margulies, M. Dembo, D. Boettiger, D. A. Hammer and V. M. Weaver, Cancer Cell, 2005, 8, 241–254 CrossRef CAS PubMed.
- S. Ramanujan, A. Pluen, T. D. McKee, E. B. Brown, Y. Boucher and R. K. Jain, Biophys. J., 2002, 83, 1650–1660 CrossRef CAS PubMed.
- Y. L. Yang, S. Motte and L. J. Kaufman, Biomaterials, 2010, 31, 5678–5688 CrossRef CAS PubMed.
- G. C. Wood, Biochem. J., 1960, 75, 598–605 CrossRef CAS PubMed.
- Y. Hosseini, S. S. Verbridge and M. Agah, J. Biomed. Mater. Res., Part A, 2015, 103, 2193–2197 CrossRef CAS PubMed.
- C. M. Ghajar, X. Chen, J. W. Harris, V. Suresh, C. C. Hughes, N. L. Jeon, A. J. Putnam and S. C. George, Biophys. J., 2008, 94, 1930–1941 CrossRef CAS PubMed.
- M. E. Francis-Sedlak, M. L. Moya, J. J. Huang, S. A. Lucas, N. Chandrasekharan, J. C. Larson, M. H. Cheng and E. M. Brey, Microvasc. Res., 2010, 80, 3–9 CrossRef CAS PubMed.
- A. Aung, Y. N. Seo, S. Lu, Y. Wang, C. Jamora, J. C. del Alamo and S. Varghese, Biophys. J., 2014, 107, 2528–2537 CrossRef CAS PubMed.
- R. J. Jerrell and A. Parekh, Acta Biomater., 2014, 10, 1886–1896 CrossRef CAS PubMed.
Footnote |
| † M. Agah and S. S. Verbridge contributed equally in guiding this research. |
| This journal is © The Royal Society of Chemistry 2015 |

