 Open Access Article
Structural characterization and immunomodulatory effects of polysaccharides from Phellinus linteus and Phellinus igniarius on the IL-6/IL-10 cytokine balance of the mouse macrophage cell lines (RAW 264.7)
Papawee
Suabjakyong
a,
Kazuhiro
Nishimura
a,
Toshihiko
Toida
a and
Leo J. L. D.
Van Griensven
*b
aDepartment of Clinical and Analytical Biochemistry, Graduate School of Pharmaceutical Sciences, Chiba University, Chiba, Chiba-shi, Japan
bPlant Research International, Wageningen University and Research Centre, Wageningen, The Netherlands. E-mail: leo.vangriensven@wur.nl
First published on 25th June 2015
Abstract
Phellinus linteus and igniarius (L.) Quel. have been used in traditional Asian medicine for over two centuries against a variety of diseases. Polysaccharides from their fruiting bodies show strong immunomodulatory activity. In this study we characterized the structure and composition of polysaccharides from Phellinus linteus and Phellinus igniarius by HPLC, GC-MS and NMR (1-H, 13-C, COSY, NOESY and TOCSY). The polysaccharides from P. linteus and P. igniarius mainly contained glucose with minor proportions of mannose, galactose, xylose, arabinose and rhamnose. Methylation analyses showed that the glycosidic linkages were mostly 1 → 3, 1 → 6 or 1 → 3,6. The two-dimensional COSY, NOESY and TOCSY confirmed that these polysaccharides have a main chain of →3)-β-D-Glcp-(1→ with →6)-β-D-Glcp-(1→ side chain. In vitro assays by RT-PCR and ELISA showed that (1 → 3; 1 → 6)-β-D-polysaccharides from P. linteus and P. igniarius decreased TNF-α in RAW 264.7 cells, suggesting an immuno-suppressive activity. Furthermore, these polysaccharides stimulated a high IL-10 response and induced strong suppression of transcription of IL-6. The results suggest that polysaccharides from P. linteus and P. igniarius could possibly find applications in restoring the IL-6/IL-10 balance, the disturbance of which is thought to be related to chronic inflammatory disease, obesity, diabetes type 2, and to mania and depression.
Introduction
The medicinal use of mushrooms has been a very long tradition in the Asian countries.1Phellinus linteus (P. linteus) and Phellinus igniarius (P. igniarius) (L.) Quel. are basidiomycetous fungi belonging to the hymenochaetaceae. Extracts of both were found to have anti-inflammatory activity in vitro as well as in vivo.2–5 Although P. linteus and P. igniarius extracts have almost similar contents, they have different bioactivity effects as we recently reported; only P. igniarius could protect against acrolein toxicity in vitro and it also provided protection in a mouse stroke model.6 Polysaccharide extracts from fruiting bodies of several mushroom species have shown various biological activities such as free radical scavenging activity,7 antitumor activity,8 and anti-inflammatory activity9 and they have been successfully used in immunochemotherapy of cancer in Japan.10 A major polysaccharide component of mushrooms is cell wall derived (1 → 3; 1 → 6)-β-D-polysaccharide,11–13 the most common biological effect of which is immunomodulation.14,15Toll-like receptors (TLRs) and C-type lectin receptors (CLRs) are known to trigger pro-inflammatory immune responses.16 CLRs specifically bind to glycans, such as mannans, GlcNAc, GalNAc, lNAc, and glycans from different mushrooms that all have a different structure and conformation and could induce different immunomodulatory effects.17–21 Lipopolysaccharide (LPS) is an endotoxin consisting of a lipid–carbohydrate component from the outer membrane of Gram-negative bacteria, such as E. coli. LPS is recognized by TLR4 which activates the innate immune system and promotes the secretion of proinflammatory cytokines including tumor necrosis factor (TNF-α) by monocytes and macrophages.22 In addition, TNF-α is often induced together with interleukin-6 (IL-6) that plays a major regulatory role in acute local and systemic inflammatory responses such as those elicited by either local lung or systemic exposure to endotoxin.23 IL-6 is thought to have both pro- and anti-inflammatory effects. In the background of obesity and insulin resistance a low and persistent level of chronic inflammation can be found with IL-6 as one of the suggested mediators.24 IL-6 has been implicated in the release of triglycerides and free fatty acids, downregulation of lipoprotein lipase, insulin resistance, and increased production of reactive oxygen species and decreased nitric oxide generation.24 Interleukin-10 (IL-10) is a monokine that is produced not only in monocytes and macrophages but also in Th1 cells, B cells and Tr1 cells.25–29 IL-10 plays a suppressing role in inflammatory responses. It downregulates the expression of TNF-α in monocytes and macrophages. IL-6 and TNF-α cytokines induced by LPS were both found significantly inhibited by IL-10 in macrophage cell lines.30 In this manuscript, the structure and composition of (1 → 3; 1 → 6)-β-D-polysaccharides from P. linteus and P. igniarius were studied by HPLC, GC-MS and NMR (1-H, 13-C, COSY, NOESY and TOCSY). Furthermore, the effects of (1 → 3; 1 → 6)-β-D-polysaccharides were examined on the production of IL-6, IL-10 and TNF-α by the Abelson leukemia virus transformed monocyte/macrophage cell line (RAW 264.7) that was treated with LPS.
Results and discussion
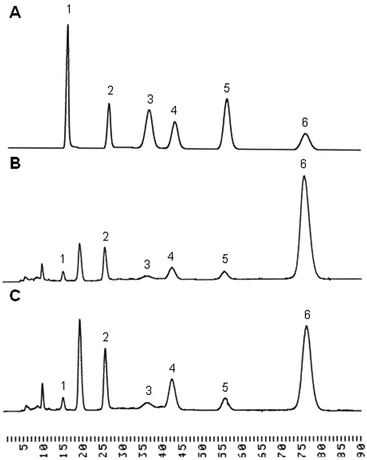
The purified polysaccharides from P. linteus and P. igniarius were semi-quantified for monosaccharide composition by GC-MS. This showed that glucose, galactose and mannose were the major components of both. Monosaccharide composition was more accurately determined by HPLC as is shown in Table 1. The polysaccharides from P. linteus and P. igniarius contain mainly glucose 78.88% and 57.58% respectively with minor proportions of mannose, galactose, xylose, arabinose and rhamnose (Fig. 1). Furthermore, these polysaccharides contain 3-O-Me-galactose as shown in between peak 1 and peak 2. Yang et al. reported that P. igniarius contains 3-O-Me-galactose.31 Also HPLC analysis showed the absence of amino sugar and sulfate groups (data not shown) indicating that polysaccharides are not contaminated by protein. For P. linteus the findings were in close agreement with those of Kozarski et al.32 who found a glucose content of 84.8%.| Standard | % sugar of P. linteus | % sugar of P. igniarius |
|---|---|---|
| Rhamnose | 0.82 | 1.31 |
| Mannose | 8.32 | 14.51 |
| Arabinose | 1.13 | 2.63 |
| Galactose | 8.06 | 20.65 |
| Xylose | 2.80 | 3.32 |
| Glucose | 78.88 | 57.58 |
The molecular weight of each of the polysaccharides was determined using HPLC with reference to the calibration curve using pullulan standards of known molecular weights. Based on this analysis, polysaccharides from P. linteus and P. igniarius were estimated to be 20![[thin space (1/6-em)]](https://www.rsc.org/images/entities/char_2009.gif) 708 Da and 18
708 Da and 18![[thin space (1/6-em)]](https://www.rsc.org/images/entities/char_2009.gif) 518 Da respectively.
518 Da respectively.
The analysis of partially O-methylated alditol acetates (PMAAs) was carried out as described in GC-MS analysis of partially methylated alditol acetates.33 PMAA-GCMS patterns obtained from the polysaccharides of P. linteus and P. igniarius were very complex as can be seen in Fig. 2. The majority of glycosidic linkages are 1 → 3, 1 → 6 or 1 → 3,6 from glucose in Tables 2 and 3. Polysaccharides have more terminal glucose residues probably related with a relatively small molecular size.
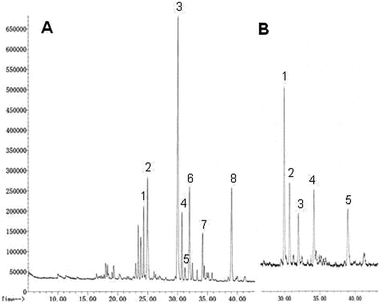 | ||
| Fig. 2 The PMAA chromatogram of the methylation analysis of polysaccharides from (A) P. linteus and (B) P. igniarius obtained by GC-MS. | ||
| Peak number | O-Methylated alditol acetates | t R (min) | Linkage type | Relative expression |
|---|---|---|---|---|
| 1 | 2,3,4,6-Me4-Manp | 24.320 | Terminal | ++ |
| 2 | 2,3,4,6-Me4-Glcp | 24.979 | Terminal | +++ |
| 3 | 2,4,6-Me3-Glcp | 30.090 | 1, 3 | +++++ |
| 4 | 2,4,6-Me3-Man-p | 30.737 | 1, 3 | ++ |
| 5 | 2,4,6-Me3-Galp | 31.225 | 1, 3 | + |
| 6 | 2,3,4-Me3-Manp | 32.006 | 1, 6 | +++ |
| 7 | 2,3,4-Me3-Glcp | 34.177 | 1, 6 | ++ |
| 8 | 2,4-Me-Glcp | 39.057 | 1, 3, 6 | +++ |
| Peak number | O-Methylated alditol acetates | t R (min) | Linkage type | Relative expression |
|---|---|---|---|---|
| 1 | 2,4,6-Me3-Glcp | 29.937 | 1, 3 | ++++ |
| 2 | 2,4,6-Me3-Manp | 30.694 | 1, 3 | +++ |
| 3 | 2,3,4-Me3-Manp | 31.926 | 1, 6 | ++ |
| 4 | 2,3,4-Me3-Glcp | 34.146 | 1, 6 | +++ |
| 5 | 2,4-Me-Glcp | 38.941 | 1, 3, 6 | ++ |
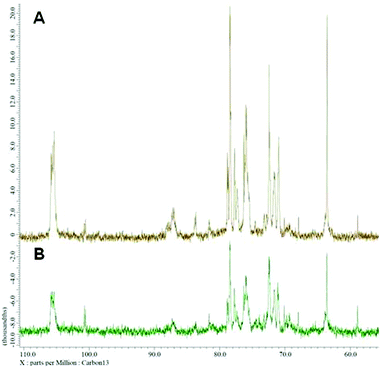
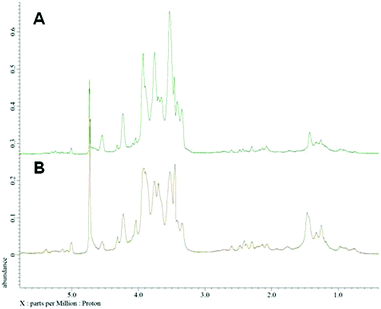
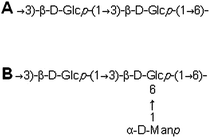
Nuclear magnetic resonance spectroscopy experiments were performed in order to elucidate the linkage type of polysaccharides. 1-H and 13-C NMR spectra obtained from each polysaccharide show a quite similar pattern even though the monosaccharide compositional analysis of each polysaccharide showed its heterogeneity. The 13-C NMR spectrum showed six carbon signals at δ 105.34 (C-1) ppm, which correspond to β anomeric carbons, as well as at δ 86.70 (C-3), 76.50 (C-5), 73.10 (C-2), 68.60 (C-4) and 63.58 (C-6) ppm (Fig. 3) corresponding to β-(1 → 3)-linked polysaccharides, which is similar to the spectrum of purified Saccharomyces cerevisiae (1 → 3)-β-glucan.34 In addition, there was a small amount of α-glucan present at δ 100.55 which was similarly found in the spectrum of Agaricus bisporus extract.35 Several other low intensity signals were observed for these polysaccharides that indicated mainly polysaccharide and minor mannose contents. The 1-H NMR spectra of polysaccharides from P. linteus and P. igniarius are shown in Fig. 4. The chemical shifts from 1-H NMR and 2D NMR (Fig. 5) are presented in Tables 4 and 5. The two-dimensional COSY, NOESY and TOCSY experiments confirmed that these polysaccharides have a main chain of →3)-β-D-Glcp-(1→ and →6)-β-D-Glcp-(1→ (Fig. 6). In addition, NOESY and TOCSY spectra obtained by using a short mixing time in NMR experiments clearly showed all of the six protons of glucose, which confirmed that these polysaccharides are relatively small molecules as compared with polysaccharides from Tremella fusiformis that were estimated to be 4600 kDa (data not shown). These observations indicated that the polysaccharides from P. linteus and P. igniarius are (1 → 3; 1 → 6)-β-D-polysaccharides containing some neutral sugars such as galactose, rhamnose, arabinose, and xylose. In addition, polysaccharides from P. igniarius have a side chain of α-D-Manp-(1→ (Fig. 6b).
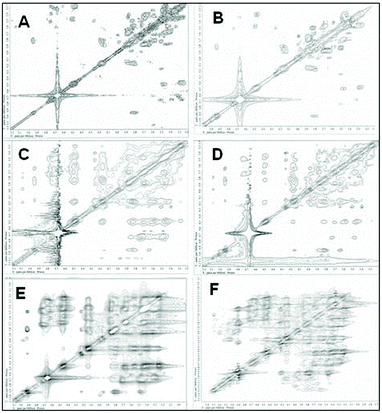 | ||
| Fig. 5 The two-dimensional COSY, NOESY and TOCSY spectra of polysaccharides from (A, C and E respectively) P. linteus and (B, D and F respectively) P. igniarius in D2O at 30 °C. | ||
| PIP | 1 | 2 | 3 | 4 | 5 | 6α | 6β | |
|---|---|---|---|---|---|---|---|---|
| H-1/C-1 | H-2/C-2 | H-3/C-3 | H-4/C-4 | H-5/C-5 | H-6α/C-6 | H-6β | ||
| a | 3)-β-D-Glcp-(1 | 4.56/105.34 | 3.33/73.10 | 3.52/86.70 | 3.28/68.60 | 3.31/76.50 | 3.72/63.57 | 3.48 |
| b | 3,6)-β-D-Glcp-(1 | 4.54/105.34 | 3.35/72.80 | 3.54/85.80 | 3.26/68.60 | 3.52/75.00 | 4.08/68.70 | 3.58 |
| c | β-D-Glcp-(1 | 4.25/105.34 | 3.04/73.70 | 3.23/76.30 | 3.11/70.30 | 3.17/76.70 | 3.71/61.20 | 3.71 |
| PIP | 1 | 2 | 3 | 4 | 5 | 6α | 6β | |
|---|---|---|---|---|---|---|---|---|
| H-1/C-1 | H-2/C-2 | H-3/C3 | H-4/C-4 | H-5/C5 | H-6α/C-6 | H-6β | ||
| n.d., not detected. | ||||||||
| a | 3)-β-D-Glcp-(1 | 4.56/105.34 | 3.33/72.90 | 3.52/86.70 | 3.28/68.50 | 3.31/76.40 | 3.72/63.57 | 3.48 |
| b | 3,6)-β-D-Glcp-(1 | 4.54/105.34 | 3.35/73.00 | 3.54/85.80 | 3.26/68.25 | 3.52/75.0 | 4.08/68.70 | 3.58 |
| c | β-D-Glcp-(1 | 4.25/105.34 | 3.04/73.40 | 3.23/76.30 | 3.11/70.30 | 3.17/76.6 | 3.71/61.2 | 3.50 |
| d | α-D-Manp-(1 | 4.98 | 3.24 | 3.54 | 3.26 | 3.52 | n.d. | n.d. |
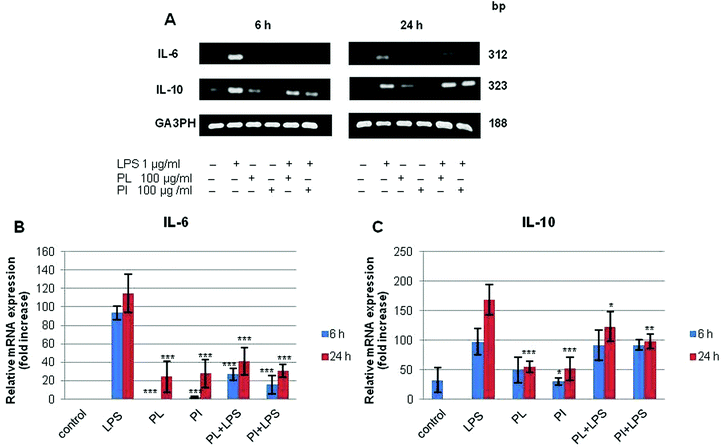
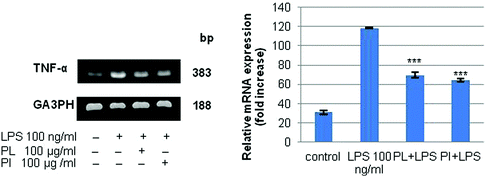
Immunomodulatory activity has been found in many mushroom polysaccharides that have been described as (1 → 3; 1 → 6)-β-D-polysaccharides.36 We extracted total RNA from the treated cell lines with the RNeasy mini kit. RT-PCR was performed for IL-6, IL-10, and TNF-α; G3PDH was used as the control as described in Experimental. The mRNA profiles of IL-6 and IL-10 on RAW 264.7 cell lines are shown in Fig. 7. The results showed that polysaccharides from P. linteus and P. igniarius had no effect on the RAW 264.7 cells, as shown by the G3PDH mRNA profile. However, these polysaccharides significantly suppressed IL-6 after proinflammation induction by 1 μg per ml LPS for 6 and 24 h (Fig. 7a). Furthermore, mRNA expression of IL-10 strongly increased after 6 h, and then mRNA expression of IL-10 was slightly decreased again after 24 h (Fig. 7b). In addition, both polysaccharides significantly suppressed TNF-α for 6 h (Fig. 8).
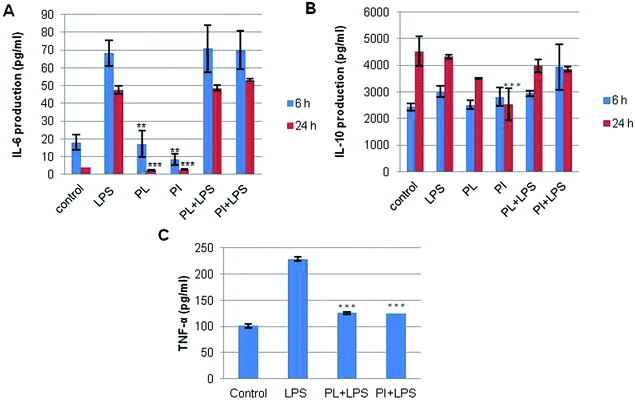
The culture medium of the treated cells was measured using sandwich ELISA kits for IL-6, IL-10 and TNF-α as described in Experimental. The results shown in Fig. 9 clearly indicate that at 6 h both polysaccharides significantly decreased TNF-α as compared to the inflammation stimulation control, i.e. LPS (Fig. 9c), and this seemed to be related with mRNA suppression of TNF-α.
TNF-α is involved in systemic inflammation where it stimulates the acute phase reaction by activated macrophages.37 The transcription of both TNF-α and of IL-6 slowed within 6 hours after exposing the cells to the suppressive activity of the Phellinus polysaccharides. Contrary to the reduced secretion of TNF-α in the culture medium (Fig. 9c), IL-6 secretion seemed not to be affected in the first 24 hours after the addition of the polysaccharides (Fig. 9a). Furthermore, at 6 h the polysaccharides induced a very high positive IL-10 response compared to the LPS control. The secretion of IL-10 slightly decreased after 24 h which seemed to be related with the mRNA expression of IL-10 (Fig. 9b). LPS treatment caused no strong change of IL-10 production by the macrophages; the concentration remained almost identical independent of the extract they were treated with. This was different for the transcription values. LPS induced transcription of IL-6 was strongly reduced by both Phellinus polysaccharides after 6 and 24 hours. For IL-10 also Phellinus polysaccharides caused a reduction of transcription but to a much lower degree than that for IL-6. The difference between the PCR and ELISA observations could be explained by the relatively long time needed for processing and release of (cytokines) proteins compared to the process of transcription.
IL-6 is a pleiotropic cytokine which plays an important pathological role in inflammatory and autoimmune diseases. Because of its pro-inflammatory character it also has a significant function in the defense against pathogens and cancers. The anti-inflammatory cytokine IL-10 inhibits the production of a number of proinflammatory cytokines such as TNF-α and IL-6 and its role has been demonstrated in models of multiple sclerosis (MS), rheumatoid arthritis (RA), systemic lupus erythematosus (SLE), diabetes, inflammatory bowel disease (IBD) and other autoimmune diseases.38 Clinically, a balanced IL-6/IL-10 ratio decreases the risk of chronic inflammation and resulting metabolic disorders and of the mentioned autoimmune diseases.24 Reduced IL-10, a higher IL-6/IL-10 ratio, the absence of a counter-balancing, and immunoregulatory increase in IL-10 in responses to elevated IL-6 concentrations contribute to the pro-inflammatory physiological milieu that is known to be associated with major depression,39 a mental health condition in which feelings of sadness, anger, loss and frustration determine daily life for a longer period of time. Interestingly, IL-6 has been found to attenuate serotonin 2A receptor signalling40 and is considered an interesting target for the treatment of depression.41
We calculated the IL-6/IL-10 ratio as well as the TNF-α/IL-10 ratio for the different treatments from our ELISA and PCR data. The TNF-α/IL-10 ratio is considered a parameter of chronic inflammation. Table 6 shows that the TNF-α/IL-10 ratios obtained from both the ELISA and PCR values are considerably decreased due to the influence of the Phellinus polysaccharides. For the IL-6/IL-10 ratio, the PCR data are analogous to the TNF-α/IL-10 ratio. The ELISA data we obtained for the IL-6/IL-10 ratio decreased after 24 h. These observations suggest that Phellinus polysaccharides could suppress chronic inflammation, and may reduce inflammation by balancing the IL-6/IL-10 ratio in the immune system. Although polysaccharides from P. linteus and P. igniarius have different compositions and structures, their immunomodulatory activities seem to be very similar. This may be because these polysaccharides do have the same main chain and a side chain that is recognized by the same receptor for immune recognition.
| mRNA expression ratio | Cytokine production ratio | |||||
|---|---|---|---|---|---|---|
| TNF-α/IL-10 | IL-6/IL10 | TNF-α/IL-10 | IL-6/IL10 | |||
| 6 h | 6 h | 24 h | 6 h | 6 h | 24 h | |
| Values are mean ± SE (n = 4/mRNA expression), (n = 3/cytokine production), *p < 0.05, **p < 0.01 and ***p < 0.001 versus LPS group. n.d., not determined. | ||||||
| Control | 0.713 ± 0.272 | n.d. | n.d. | 0.043 ± 0.003 | 0.003 ± 0.002 | 0.001 ± 0.000 |
| LPS | 1.022 ± 0.047 | 0.996 ± 0.178 | 0.708 ± 0.259 | 0.074 ± 0.007 | 0.023 ± 0.004 | 0.011 ± 0.001 |
| PL + LPS | 0.622 ± 0.002* | 0.333 ± 0.182*** | 0.331 ± 0.095* | 0.042 ± 0.003 | 0.024 ± 0.005 | 0.012 ± 0.001 |
| PI + LPS | 0.681 ± 0.017** | 0.172 ± 0.113*** | 0.313 ± 0.050** | 0.031 ± 0.008 | 0.018 ± 0.005 | 0.014 ± 0.000 |
Experimental
Mushroom extract preparation
Dried powders of wild-type P. linteus and P. igniarius fruiting bodies that had been identified by Dr Usa Klinhom (Mahasarakham University, Thailand) were kindly provided by Amazing Grace Health Products Limited Partnership (Bangkok, Thailand). Representative P. linteus and P. igniarius samples have been deposited in the collection of the Natural Medicinal Mushroom Museum of the Faculty of Biology of Mahasarakham University. Fruiting body powder was extracted by 70% ethanol (10% w/v) at 70 °C for 16 h. The supernatants were removed by centrifugation at 10![[thin space (1/6-em)]](https://www.rsc.org/images/entities/char_2009.gif) 000g for 10 minutes. Crude polysaccharide extracts were prepared from the ethanol extracted tissue by hot water extraction1 for 16 h. The semi-purified polysaccharides were precipitated by the addition of 2.5 volumes of cold 99% ethanol after which the suspensions were kept at −20 °C for 16–24 h. The semi-purified polysaccharides were then collected by centrifugation at 15
000g for 10 minutes. Crude polysaccharide extracts were prepared from the ethanol extracted tissue by hot water extraction1 for 16 h. The semi-purified polysaccharides were precipitated by the addition of 2.5 volumes of cold 99% ethanol after which the suspensions were kept at −20 °C for 16–24 h. The semi-purified polysaccharides were then collected by centrifugation at 15![[thin space (1/6-em)]](https://www.rsc.org/images/entities/char_2009.gif) 000g for 10 minutes. The precipitate was dissolved in a small volume of water and the semi-purified polysaccharides were reprecipitated 3–4 times by cold 99% alcohol as before. After that, ethanol-soluble phenolic compounds were removed from the semi-purified polysaccharides by chromatography on a Sep-Pak C18 Plus Light Cartridge. The polysaccharides from P. linteus (PL) and P. igniarius (PI) were then lyophilized and stored in a dry and cool place for further use.
000g for 10 minutes. The precipitate was dissolved in a small volume of water and the semi-purified polysaccharides were reprecipitated 3–4 times by cold 99% alcohol as before. After that, ethanol-soluble phenolic compounds were removed from the semi-purified polysaccharides by chromatography on a Sep-Pak C18 Plus Light Cartridge. The polysaccharides from P. linteus (PL) and P. igniarius (PI) were then lyophilized and stored in a dry and cool place for further use.
Analysis of monosaccharide and amino sugar composition by HPLC
Polysaccharides (100 μg) were hydrolyzed with 2.5 M trifluoroacetic acid (TFA) at 100 °C for 6 h. The aqueous solutions were evaporated to dryness under a N2-stream at 40 °C. The residues were dissolved in 100 μl water and analyzed for monosaccharide composition on a HPLC post-column system with TSK gel Sugar AXI (150 × 4.6 mm i.d.; Tosoh, Tokyo, Japan). The column temperature was kept at 70 °C, equilibrated with 0.5 M borate buffer (pH 8.5), and the flow rate was 0.4 ml min−1. The eluent from the column was combined with 0.5% (w/v) 2-cyanoacetoamide and 1.0 M NaOH, both of which were delivered at 0.25 ml min−1 and heated at 120 °C within the reaction loop. Rhamnose, mannose, galactose, glucose, xylose and arabinose at 100 ppm were used as standards.42The samples were analyzed for amino sugar composition on a HPLC post-column system with TSK gel SCX (150 × 4.6 mm i.d.; Tosoh, Tokyo, Japan). The column temperature was kept at 70 °C, equilibrated with 0.35 M borate buffer (pH 7.6), and the flow rate was 0.6 ml min−1. The eluent from the column was combined with 0.5% (w/v) 2-cyanoacetoamide and 1.0 M NaOH, both of which were delivered at 2.5 ml min−1 and heated at 120 °C within the reaction loop. The monosaccharide and amino sugars were detected using a fluorescence detector with emission at 383 nm and excitation at 331 nm. D-Glucosamine, D-galactosamine and D-mannosamine at 100 ppm were used as standards for amino sugar composition analysis.
Sulfate group determination
The samples were hydrolyzed as described in the analysis of monosaccharide and amino sugar composition by HPLC. The samples were analyzed for sulfate group determination by HPLC with TSK gel IC-Anion-PW (10 μm, 50 × 4.6 mm i.d.; Tosoh, Tokyo, Japan). The column temperature was kept at 45 °C, equilibrated with a mixture of 1.42 mM sodium hydrogen carbonate (NaHCO3) and 1.5 mM sodium carbonate (Na2CO3). The sulfate groups were detected using a refractive index detector. The flow rate was 0.8 ml min−1. Sodium sulfate at 1000, 500, 300, 100, 50 and 10 ppm were used as standards.Analysis of molecular weight by HPLC
The samples were analyzed for molecular weight on HPLC with OHpak SB-806M HQ (300 × 8 mm i.d.; Shodex, New York, America) and a refractive index detector. The eluent was 10 mM ammonium bicarbonate (NH4HCO3) with a flow rate of 0.5 ml min−1. The sulfate groups were detected using a refractive index detector. 5900 to 2![[thin space (1/6-em)]](https://www.rsc.org/images/entities/char_2009.gif) 350
350![[thin space (1/6-em)]](https://www.rsc.org/images/entities/char_2009.gif) 000 molecular weights of pullulans were used as standards.
000 molecular weights of pullulans were used as standards.
Analysis of monosaccharide composition by GC-MS
Polysaccharides were lyophilized and dried in a vacuum over P2O5 for 16 h. Polysaccharides were hydrolyzed with 1.0 M HCl in MeOH at 80 °C for 24 hours, and washed 3 times with n-hexane. Anhydrous pyridine and acetic anhydride were added at room temperature to the lower phases for 30 minutes and evaporated to dryness under a N2 stream at 40 °C. The methanolyzed polysaccharides were trimethylsilylated with 30 ml of a 2![[thin space (1/6-em)]](https://www.rsc.org/images/entities/char_2009.gif) :
:![[thin space (1/6-em)]](https://www.rsc.org/images/entities/char_2009.gif) 1 (v
1 (v![[thin space (1/6-em)]](https://www.rsc.org/images/entities/char_2009.gif) :
:![[thin space (1/6-em)]](https://www.rsc.org/images/entities/char_2009.gif) v) mixture of N,O-bis (trimethylsilyl) trifluoroacetamide (BSTFA)–pyridine at 80 °C for 30 minutes.43 The trimethylsilylated polysaccharides were then analyzed by GC-MS, and identified by their typical retention times and electron impact profiles. Gas liquid chromatography mass spectrometry (GC-MS) was performed using a Hewlett–Packard model 6890 series II gas chromatograph with helium as the carrier gas. A capillary column (25 m × 0.24 mm i.d.) of Silicone OV-101 was held at 280 °C during injection and then programmed at 160 °C for 5 min and 160 °C to 260 °C (2 °C min−1).
v) mixture of N,O-bis (trimethylsilyl) trifluoroacetamide (BSTFA)–pyridine at 80 °C for 30 minutes.43 The trimethylsilylated polysaccharides were then analyzed by GC-MS, and identified by their typical retention times and electron impact profiles. Gas liquid chromatography mass spectrometry (GC-MS) was performed using a Hewlett–Packard model 6890 series II gas chromatograph with helium as the carrier gas. A capillary column (25 m × 0.24 mm i.d.) of Silicone OV-101 was held at 280 °C during injection and then programmed at 160 °C for 5 min and 160 °C to 260 °C (2 °C min−1).
GC-MS analysis of partially methylated alditol acetates (PMAAs)
The PMAA strategy involves the methylation of all free (non-linkage involved) OH-groups in poly- or oligosaccharides using methyl iodide (CH3I) in DMSO at high pH, also known as “permethylation”. Polysaccharides (100 μg) were dissolved in 200 μl dehydrated DMSO, NaOH–DMSO (0.2 ml of 50% (w/v) NaOH with 5 ml dehydrated DMSO) and iodomethane (0.1 ml). After sonicating 3 times for 5 minutes, methylated polysaccharides were extracted using chloroform and washed with water. The residues were evaporated to dryness under a N2 stream at 40 °C. The dry methylated polysaccharides were hydrolyzed with 2.5 M trifluoroacetic acid (TFA) and heated at 100 °C for 4 h. The aqueous solutions were evaporated to dryness under a N2 stream at 40 °C. The partially methylated sugars were reduced by NaBH4 (5 mg ml−1 in 30% methanol containing 0.03 M NaOH). After removal of borate by evaporation as methyl borate, partially O-methylated alditols were acetylated using acetic anhydride.44 The partially methylated alditol acetates were analyzed using a Hewlett–Packard model 6890 series II gas chromatograph with a Silicone OV-101 capillary column (25 m × 0.24 mm i.d.). The analysis was performed in the electron impact ionization mode, and an ionizing voltage of 70 eV was used. Several temperature programs were investigated from which the best results were obtained at the following gradient: 3 min 100 °C, 4 °C min−1 to 160 °C, 0.5 °C min−1 to 180 °C and then 20 °C min−1 to 260 °C.Nuclear magnetic resonance spectroscopy (NMR)
The one-dimensional spectra, on 4–50 mg of dry, exchanged samples in deuterium oxide (0.6 ml, 99.9 atom%) with 3-(trimethylsilyl) propionic acid-d4 sodium salt (internal standard), were recorded using a Jeol 600 MHz instrument. The operation conditions for one-dimensional spectra were as follows: 1-H NMR; spin, 15 Hz; relaxation delay, 2 s; acquisition, 1000 scans; temperature, 30 °C: 13-C NMR; spin, 15 Hz; relaxation delay, 2 s; acquisition, 33![[thin space (1/6-em)]](https://www.rsc.org/images/entities/char_2009.gif) 000 scans; temperature, 30 °C. The water resonance was suppressed by selective irradiation during the relaxation delay.
000 scans; temperature, 30 °C. The water resonance was suppressed by selective irradiation during the relaxation delay.
The two-dimensional spectra were obtained by using COSY, NOESY and TOCSY functions. The operation conditions for two-dimensional spectra were as follows: COSY; spin, 15 Hz; acquisition, 16 proton scans; acquisition, 128 COSY scans; temperature, 30 °C: NOESY; mixing time, 150 ms; acquisition, 40 proton scans; acquisition, 40 NOESY scans; temperature, 30 °C: TOCSY; spin, 15 Hz; acquisition, 16 proton scans; acquisition, 64 TOCSY scans; spin locking, MLEV17; temperature, 30 °C.
Cell culture
The mouse Abelson leukemia virus transformed monocyte macrophage cell line (RAW 264.7 cell lines) was obtained from Dr Atsushi Ichikawa. RAW 264.7 cell lines were grown in DMEM culture medium (Nacalai Tesque, Inc., Kyoto, Japan) supplemented with 10% fetal bovine serum (Life Technology, Tokyo, Japan) and 1% penicillin–streptomycin mixed solution (Nacalai Tesque, Inc., Kyoto, Japan), at 37 °C in 5% CO2 in a humidified incubator. RAW 264.7 cells (5 × 10⁵ cells per ml) were treated in 6-well polystyrene tissue culture plates with 2 ml cell suspension in each well for 24 h. The medium was then removed and replaced by fresh medium containing polysaccharides at 100 μg ml−1 or LPS (100 ng ml−1 or 1 μg ml−1) as proinflammatory controls. After 6 and 24 h, the cells and medium were harvested for further experiments.Quantitative reverse transcriptase polymerase chain reaction (RT-PCR) analysis
Total RNA was extracted from the treated cell lines with a RNeasy mini kit (Qiagen, Valencia, CA, USA) according to the manufacturer's instructions. cDNA was synthesized in a 20 μl reaction mixture with 4 μg of total RNA by using the Blend Taq with 10× buffer (Toyobo Co. Ltd, Osaka, Japan). PCR was performed with a PCR thermal cycler (Takara Bio Inc., Otsu, Japan) and with 2 mM of each dNTP (Toyobo Co. Ltd, Osaka, Japan). Primer sequences are listed in Table 7. The PCR conditions were as follows: G3PDH: 5 min at 95 °C, (30 s at 95 °C, 30 s at 60 °C and 60 s at 72 °C) × 30 cycles, and 5 min at 72 °C; IL-6: 5 min at 94 °C, (60 s at 94 °C, 120 s at 61.6 °C and 120 s at 72 °C) × 30 cycles, and 5 min at 72 °C; TNF-α: 5 min at 94 °C, (60 s at 94 °C, 130 s at 60 °C and 140 s at 72 °C) × 30 cycles, and 5 min at 72 °C;45 IL-10: 5 min at 94 °C, (30 s at 94 °C, 30 s at 55 °C and 60 s at 72 °C) × 30 cycles, and 5 min at 72 °C.46 All data were normalized to the internal standard G3PDH.| Gene | NCBI reference | Primer sequences (5′–3′) | Product size (bp) |
|---|---|---|---|
| F, forward primer; R, reverse primer. | |||
| IL-6 | NM_031168 | F: GTGACAACCACGGCCTTCCCTACT | 312 |
| R: GGTAGCTATGGTACTCCA | |||
| TNF-α | NM_013693 | F: GCGACGTGGAACTGGCAGAAG | 383 |
| R: GGTACAACCCATCGGCTGGCA | |||
| IL-10 | NM_010548 | F: CCAGTTTTACCTGGTAGAAGTGATG | 323 |
| R: TGTCTAGGTCCTGGAGTCCAGCAGACTC | |||
| G3PDH | F: GGTATCGTGGAAGGACTCATGAC | 188 | |
| R: ATGCCAGTGAGCTTCCCGTTCAGC | |||
Quantitative determination of cytokines by ELISA
Reactions were carried out by the enzyme linked immunosorbent assay (ELISA) using an eBioscience ELISA Ready-SET-GO (Affymetrix, Tokyo, Japan) for IL-6, IL-10 and TNF-α. A Coat Corning Costar 9018 ELISA plate with 100 μl per well of a capture antibody in coating buffer was sealed and incubated overnight at 4 °C. After incubation, the ELISA plates were aspirated well and washed 3–5 times with 250 μl per well of wash buffer. Then the ELISA plates were blocked with 200 μl per well of 1 × assay diluent and incubated at room temperature for 1 h. After that, ELISA plates were aspirated and washed in the same way as before. After that, 100 μl per well of cell culture medium or standards were added and incubated at room temperature for 2 h. After incubation for 2 h, plates were aspirated and washed again. Then, 100 μl per well of Avidin-HPR were added and incubated at room temperature for 30 minutes. ELISA plates were aspirated and washed 5–14 times. Then, 100 μl per well of a substrate solution were added at room temperature for 15 minutes and then 50 μl of stop solution were added. Absorbance was read at 450 nm on a Tecan Sunrise plate reader A-5082 (Tecan, Tokyo, Japan). Values were converted to weight in pg ml−1.Statistics
Statistical analyses were carried out using GraphPad Prism version 4.0 for Windows 7 (GraphPad, USA). ANOVA with Tukey's multiple comparison test was applied for multiple comparisons. Values are indicated as means ± SE, and significant differences are shown as probability values.Conclusions
We determined the composition and structure of polysaccharides isolated from P. linteus and P. igniarius by HPLC, GCMS and NMR (1-H, 13-C, COSY, NOESY and TOCSY). The results showed that polysaccharides from P. linteus and P. igniarius contain mainly glucose, i.e. 78.88% and 57.58%, respectively, with minor proportions of mannose, galactose, xylose, arabinose and rhamnose. Methylation analyses showed that the majority of glycosidic linkages are 1 → 3, 1 → 6 or 1 → 3,6 from glucose. The two-dimensional COSY, NOESY and TOCSY confirmed these polysaccharides to have a main chain of →3,6)-β-D-Glcp-(1→. In addition, polysaccharides from P. igniarius showed a side chain of α-D-Manp-(1→. Our observations indicated that these complex polysaccharides from P. linteus and P. igniarius are (1 → 3; 1 → 6)-β-D-polysaccharides containing some neutral sugars such as galactose, rhamnose, arabinose and xylose that have molecular weights of 20![[thin space (1/6-em)]](https://www.rsc.org/images/entities/char_2009.gif) 708 Da and 18
708 Da and 18![[thin space (1/6-em)]](https://www.rsc.org/images/entities/char_2009.gif) 518 Da, respectively.
518 Da, respectively.
In vitro measurements of immunomodulatory effects by RT-PCR and ELISA showed that polysaccharides from P. linteus and P. igniarius significantly decreased TNF-α, suggesting immunosuppressive activity. Furthermore, these polysaccharides stimulated a highly positive IL-10 response and strongly suppressed IL-6 and TNF-α mRNA transcription early after LPS treatment. In addition, these polysaccharides reduced the TNFα/IL-10 and IL-6/IL-10 ratios of the messenger RNAs. These in vitro results suggest that polysaccharides from P. linteus and P. igniarius could possibly be used for the development of mushroom derivatives that have in vivo anti-inflammatory effects.
Acknowledgements
P. linteus and P. igniarius fruiting body powders were kindly provided by Amazing Grace Health Products Limited Partnership, Bangkok, Thailand.References
- S. Wei and L. J. L. D. Van Griensven, Pro- and antioxidative properties of medicinal mushroom extracts, Int. J. Med. Mushrooms, 2008, 10, 315–324 CrossRef CAS.
- J. S. Hwang, H. K. Kwon, J. E. Kim, J. Rho and S. H. Im, Immunomodulatory effect of water soluble extract separated from mycelium of Phellinus linteus on experimental atopic dermatitis, BMC Complementary Altern. Med., 2012, 12, 159 CrossRef PubMed.
- T. Nakamura, S. Matsugo, Y. Uzuka, S. Matsuo and H. Kawagishi, Fractionation and anti-tumor activity of the mycelia of liquid-cultured Phellinus linteus, Biosci. Biotechnol. Biochem., 2004, 68, 868–872 CrossRef CAS PubMed.
- S. B. Han, C. W. Lee, Y. J. Jeon, N. D. Hong, I. D. Yoo, K. H. Yang and H. M. Kim, The inhibitory effect of polysaccharides isolated from Phellinus linteus on tumor growth and metastasis, Int. J. Immunopharmacol., 1999, 41, 157–164 CrossRef CAS.
- S. H. Kim, Y. S. Song, S. K. Kim, B. C. Kim, C. J. Lim and E. H. Park, Anti-inflammatory and related pharmacological activities of the n-BuOH subfraction of mushroom Phellinus linteus, J. Ethnopharmacol., 2004, 93, 141–146 CrossRef PubMed.
- P. Suabjakyong, R. Saiki, L. J. L. D. Van Griensven, K. Higashi, K. Nishimura, K. Igarashi and T. Toida, Polyphenol Extract from Phellinus igniarius Protects against Acrolein Toxicity In Vitro and Provides Protection in a Mouse Stroke Model, PLoS One, 2015, 10(3), e0122733 Search PubMed.
- F. Liu, V. E. C. Ooi and S. T. Chang, Free radical scavenging activities of mushroom polysaccharide extracts, Life Sci., 1997, 60, 763–771 CrossRef CAS PubMed.
- G. Chihara, J. Hamuro, Y. Y. Maeda, Y. Arai and F. Fukuoka, Fractionation and purification of the polysaccharides with marked antitumor activity, especially lentinan, from Lentinus edodes (Berk.) Sing. (an edible mushroom), Cancer Res., 1970, 30, 2776–2781 CAS.
- R. O. Diniz, L. K. Garla, J. M. Schneedorf and J. C. T. Carvalho, Study of anti-inflammatory activity of Tibetan mushroom, a symbiotic culture of bacteria and fungi encapsulated into a polysaccharide matrix, Pharmacol. Res., 2003, 47, 49–52 CrossRef CAS PubMed.
- K. Oba, S. Teramukai, M. Kobayashi, Y. Matsui and J. Sakamoto, Efficacy of adjuvant immunochemotherapy with polysaccharide K for patrients with curative resections of gastric cancer, Cancer Immunol. Immunother., 2007, 56, 905–911 CrossRef CAS PubMed.
- D. Rout, S. Mondal, I. Chakraborty and S. S. Islam, The structure and conformation of a water-insoluble (1→ 3)-,(1→ 6)-β-d-glucan from the fruiting bodies of Pleurotus florida, Carbohydr. Res., 2008, 343, 982–987 CrossRef CAS PubMed.
- Y. Ukawa, H. Ito and M. Hisamatsu, Antitumor effects of (1→ 3)-β-d-glucan and (1→ 6)-β-d-glucan purified from newly cultivated mushroom, Hatakeshimeji Lyophyllum decastes, J. Biosci. Bioeng., 2000, 90, 98–104 CrossRef CAS PubMed.
- A. M. Barbosa, R. M. Steluti, R. F. Dekker, M. S. Cardoso and M. L. Corradi da Silva, Structural characterization of Botryosphaeran: a (1→ 3; 1→ 6)-β-d-glucan produced by the ascomyceteous fungus, Botryosphaeria sp, Carbohydr. Res., 2003, 338, 1691–1698 CrossRef CAS PubMed.
- S. Wasser, Medicinal mushrooms as a source of antitumor and immunomodulating polysaccharides, Appl. Microbiol. Biotechnol., 2002, 60, 258–274 CrossRef CAS PubMed.
- D. L. Williams, Overview of (1→ 3)-β-D-glucan immunobiology, Mediators Inflammation, 1997, 6, 247–250 CrossRef CAS PubMed.
- H. Yan, N. Ohno and N. M. Tsuji, The role of C-type lectin receptors in immune homeostasis, Int. J. Immunopharmacol., 2013, 16, 353–357 CrossRef CAS PubMed.
- T. B. Geijtenbeek, S. J. Van Vliet, E. A. Koppel, M. Sanchez-Hernandez, C. M. Vandenbroucke-Grauls, B. Appelmelk and Y. Van Kooyk, Mycobacteria target DC-SIGN to suppress dendritic cell function, J. Exp. Med., 2003, 197, 7–17 CrossRef CAS PubMed.
- S. Saijo, S. Ikeda, K. Yamabe, S. Kakuta, H. Ishigame, A. Akitsu, N. Fujikado, T. Kusaka, S. Kubo, S. Chung, R. Komatsu, N. Miura, Y. Adachi, N. Ohno, K. Shibuya, N. Yamamoto, K. Kawakami, S. Yamasaki, T. Saito, S. Akira and Y. Iwakura, Dectin-2 recognition of alpha-mannans and induction of Th17 cell differentiation is essential for host defense against Candida albicans, Immunity, 2010, 32, 681–691 CrossRef CAS PubMed.
- Z. Tu, H. K. Hamalainen-Laanaya, C. Nishitani, Y. Kuroki, I. N. Crispe and M. S. Orloff, HCV core and NS3 proteins manipulate human blood-derived dendritic cell development and promote Th 17 differentiation, Int. Immunol., 2012, 24, 97–106 CrossRef CAS PubMed.
- R. A. Paveley, S. A. Aynsley, J. D. Turner, C. D. Bourke, S. J. Jenkins, P. C. Cook, L. Martinez-Pomaresb and A. P. Mountford, The Mannose Receptor (CD206) is an important pattern recognition receptor (PRR) in the detection of the infective stage of the helminth Schistosoma mansoni and modulates IFNγ production, Int. J. Parasitol., 2011, 41, 1335–1345 CrossRef CAS PubMed.
- K. Denda-Nagai, S. Aida, K. Saba, K. Suzuki, S. Moriyama, S. Oo-Puthinan, M. Tsuiji, A. Morikawa, Y. Kumamoto, D. Sugiura, A. Kudo, Y. Akimoto, H. Kawakami, N. V. Bovin and T. Irimura, Distribution and function of macrophage galactose-type C-type lectin 2 (MGL2/CD301b): efficient uptake and presentation of glycosylated antigens by dendritic cells, J. Biol. Chem., 2010, 285, 19193–19204 CrossRef CAS PubMed.
- E. M. Palsson-McDermott and L. A. O'Neill, Signal transduction by the lipopolysaccharide receptor, Toll-like receptor-4, J. Immunol., 2004, 113, 153–162 CrossRef CAS PubMed.
- Z. Xing, J. Gauldie, G. Cox, H. Baumann, M. Jordana, X. F. Lei and M. K. Achong, IL-6 is an antiinflammatory cytokine required for controlling local or systemic acute inflammatory responses, J. Clin. Invest., 1998, 101, 311 CrossRef CAS PubMed.
- K. Eder, N. Baffy, A. Falus and A. K. Fulop, The major inflammatory mediator interleukin-6 and obesity, Inflammation Res., 2009, 58, 727–736 CrossRef CAS PubMed.
- K. W. Moore, A. O'garra, R. D. W. Malefyt, P. Vieira and T. R. Mosmann, Interleukin-10, Annu. Rev. Immunol., 1993, 11, 165 CrossRef CAS PubMed.
- G. Del Prete, M. De Carli, F. Almerigogna, M. G. Giudizi, R. Biagiotti and S. Romagnani, Human IL-10 is produced by both type 1 helper (Th1) and type 2 (Th2) T cell clones and inhibits their antigen-specific proliferation and cytokine production, J. Immunol., 1993, 150, 353 CAS.
- A. O'garra, R. Chang, N. Go, R. Hastings, G. Haughton and M. Howard, Ly-1 B (B-1) cells are the main source of B cell-derived interleukin 10, Eur. J. Immunol., 1992, 22, 711 CrossRef PubMed.
- R. de Waal Malefyt, J. Abrams, B. Bennett, C. G. Figdor and J. E. De Vries, Interleukin 10 (IL-10) inhibits cytokine synthesis by human monocytes: an autoregulatory role of IL-10 produced by monocytes, J. Exp. Med., 1991, 174, 1209 CrossRef CAS PubMed.
- H. Groux, A. O'Garra, M. Bigler, M. Rouleau, S. Antonenko, J. E. de Vries and M. G. Roncarolo, A CD41 T-cell subset inhibits antigen-specific T-cell responses and prevents colitis, Nature, 1997, 389, 737 CrossRef CAS PubMed.
- D. F. Fiorentino, A. Zlotnik, T. R. Mosmann, M. Howard and A. O'garra, IL-10 inhibits cytokine production by activated macrophages, J. Immunol., 1991, 147, 3815–3822 CAS.
- Y. Yang, L. Ye, J. Zhang, Y. Liu and Q. Tang, Structural analysis of a bioactive polysaccharide, PISP1, from the medicinal mushroom Phellinus igniarius, Biosci. Biotechnol. Biochem., 2009, 73, 134–139 CrossRef CAS PubMed.
- M. Kozarski, A. Klaus, M. Niksic, D. Jakovljevic, J. P. Helsper and L. J. Van Griensven, Antioxidative and immunomodulating activities of polysaccharide extracts of the medicinal mushrooms Agaricus bisporus, Agaricus brasiliensis, Ganoderma lucidum and Phellinus linteus, Food Chem., 2011, 12, 1667–1675 CrossRef.
- K. Kiwitt-Haschemie, A. Renger and H. A. Steinhart, comparison between reductive-cleavage and standard methylation analysis for determining structural features of galactomannans, Carbohydr. Polym., 1996, 30, 31–35 CrossRef CAS.
- S. D. V. Medeiros, S. L. Cordeiro, J. E. C. Cavalcanti, K. M. Melchuna, A. M. D. S. Lima, I. A. Filho, A. C. Medeiros, K. B. F. Rocha, E. M. Oliveira, E. D. B. Faria, G. L. Sassaki, H. A. O. Rocha and V. S. F. Sales, Effects of purified Saccharomyces cerevisiae (1→ 3)-β-glucan on venous ulcer healing, Int. J. Mol. Sci., 2012, 13, 8142–8158 CrossRef CAS PubMed.
- F. R. Smiderle, A. C. Ruthes, J. van Arkel, W. Chanput, M. Iacomini, H. J. Wichers and L. J. Van Griensven, Polysaccharides from Agaricus bisporus and Agaricus brasiliensis show similarities in their structures and their immunomodulatory effects on human monocytic THP-1 cells, BMC Complementary Altern. Med., 2011, 11, 58 CrossRef PubMed.
- M. Zhang, S. W. Cui, P. C. K. Cheung and Q. Wang, Antitumor polysaccharides from mushrooms: are view in their isolation process, structural characteristics and antitumor activity, Trends Food Sci. Technol., 2007, 18, 4–19 CrossRef CAS.
- S. Diehl and M. Rincón, The two faces of IL-6 on Th1/Th2 differentiation, Mol. Immunol., 2002, 39, 531–536 CrossRef CAS PubMed.
- W. M. Kevin, D. W. M. Rene, L. C. Robert and O. Anne, Interleukin-10 and the interleukin-10 receptor, Annu. Rev. Immunol., 2001, 19, 683–702 CrossRef PubMed.
- E. Brietzke, L. Stertz, B. S. Fernandes, M. Kauer-Sant'Anna, M. Mascarenhas, A. Escosteguy Vargas, J. A. Chies and F. Kapczinsky, Comparison of cytokine levels in depressed, manic and euthymic patients with bipolar disorder, J. Affective Disord., 2009, 116, 214–217 CrossRef CAS PubMed.
- J. J. Donegan, M. S. Patton, T. S. Chavera, K. A. Berg, D. A. Morilak and M. Girotti, Interleukin-6 attenuates serotonin 2A receptor signaling by activating the JAK-STAT pathway, Mol. Pharmacol., 2015, 87, 492–500 CrossRef PubMed.
- T. M. Fonseka, R. S. McIntyre, J. K. Soczynska and S. H. Kennedy, Novel investifgational drugs targeting IL-6 signaling for the treatment of depression, Expert Opin. Invest. Drugs, 2015, 24, 459–475 CrossRef CAS PubMed.
- A. Chaidedgumjorn, H. Toyoda, E. R. Woo, K. B. Lee, Y. S. Kim, T. Toida and T. Imanari, Effect of (1→ 3)-and (1→ 4)-linkages of fully sulfated polysaccharides on their anticoagulant activity, Carbohydr. Res., 2002, 337, 925–933 CrossRef CAS PubMed.
- M. Matsuo, R. Takano, K. Kamei-Hayashi and S. A. Hara, novel regioselective desulfation of polysaccharide sulfates: specific 6-O-desulfation with N,O-bis (trimethylsilyl) acetamide, Carbohydr. Res., 1993, 241, 209–215 CrossRef CAS PubMed.
- K. R. Anumula and P. B. Taylor, A comprehensive procedure for preparation of partially methylated alditol acetates from glycoprotein carbohydrates, Anal. Biochem., 1992, 203, 101–108 CrossRef CAS PubMed.
- A. C. H. Yu and L. T. Lau, Expression of interleukin-1 alpha, tumor necrosis factor alpha and interleukin-6 genes in astrocytes under ischemic injury, Neurochem. Int., 2000, 36, 369–377 CrossRef CAS PubMed.
- M. Tone, M. J. Powell, Y. Tone, S. A. Thompson and H. Waldmann, IL-10 gene expression is controlled by the transcription factors Sp1 and Sp3, J. Immunol., 2000, 165, 286–291 CrossRef CAS.
| This journal is © The Royal Society of Chemistry 2015 |

