 Open Access Article
Creative Commons Attribution 3.0 Unported Licence
Size dependent efficiency of photophoretic swimmers†
Andreas P.
Bregulla
and
Frank
Cichos
*
Molecular Nanophotonics Group, Institute of Experimental Physics I, University of Leipzig, 04103 Leipzig, Germany. E-mail: cichos@physik.uni-leipzig.de
First published on 3rd July 2015
Abstract
We investigate experimentally the efficiency of self-propelled photophoretic swimmers based on metal-coated polymer particles of different sizes. The metal hemisphere absorbs the incident laser power and converts its energy into heat, which dissipates into the environment. A phoretic surface flow arises from the temperature gradient along the particle surface and drives the particle parallel to its symmetry axis. Scaling the particle size from micro to nanometers, the efficiency of converting optical power into motion is expected to rise with the reciprocal size for ideal swimmers. However, due to the finite size of the metal cap, the efficiency of a real swimmer reveals a maximum depending sensitively on the details of the metal cap shape. We compare the experimental results to numerical simulations.
1 Introduction
The field of artificial micro-swimmers has recently attracted much interest. Over the last decade, numerous types of such artificial swimmers driven by self-thermophoretic,1–3 self-diffusiophoretic4–6 or self-electrophoretic7,8 surface flows have been proposed. The diversity of the driving mechanism with the simplicity of the design and controllability of their motion make them a valuable model system to study processes far from equilibrium. When such self-propelled objects are starting to interact at higher densities, coherent collective motion is observed in which the swimmers align, and form flocks, swarms or other complex patterns.6,9–12Most of these self-propelled particles are driven by an osmotic pressure difference across the particles surface caused by symmetry breaking of e.g. temperature or concentration profiles along the particle surface realized by an asymmetric material composition. As a result of the osmotic pressure difference, a phoretic surface flow occurs, which leads, in combination with hydrodynamic boundary conditions, to a directed motion of the Janus particle.
For this propulsion they rely on externally supplied energy drawn, for example, from electromagnetic waves or chemical fuel. The efficiency of this conversion process can be evaluated by the ratio of the output power and the input power, ε = Pout/Pin. The output power involves the sum of all viscous losses causing the directed motion and thus requires a detailed knowledge of the created phoretic flow field. While this flow field has been determined theoretically,13–15 no efficiency calculations have been based on it so far. It is known, however, that the efficiency of most artificial swimmers is very low with values of typically less than ε = 10−7.16
A hydrodynamic upper bound of the efficiency was derived by Sabass and Seifert.17 They predicted that the efficiency of a surface driven swimmer increases as its size decreases. For diffusiophoretic Janus type particles (driven by concentration gradients caused by catalytic reactions), theoretical studies on the size dependent efficiency18 support this dependence but reveal a deviation for small particle sizes. Measurements of their size dependent velocity19 exist but without considering the efficiency of the propulsion and their dependence on size.
Here we focus on self-propelled thermophoretic swimmers. We investigate their size dependent phoretic velocity to access the scaling of the relative efficiency experimentally and theoretically.
The efficiency of phoretic swimmers has been addressed by calculating the power required to pull a colloidal particle of the same radius R as the swimmer in a liquid of viscosity η (see eqn (1)) with a constant velocity equal to the phoretic velocity Vth of the swimmer.20 The power required to drag this particle is then related to the Stokes’ friction Fst of this probe colloid and the swimmer’s velocity:
 | (1) |
The right side of eqn (1) is useful to study the dependence of the efficiency on the size of the swimmer, as for the example carried out theoretically by Sabass,17 while a quantitative estimate of the efficiency (ε = 7.6 × 10⁻¹⁵) yields a similar order of magnitude as reported before.16 The input power Pin in eqn (1) relates, in general, to the energy picked up by the particle and involves different processes for different types of swimmers. In the case of catalytic swimmers, this input power is difficult to define. Sabass and Seifert therefore consider a sum of the power lost in viscous dissipation and the propulsion power as the input power. In the present case of photophoretic swimmers, a thin metal hemisphere on a transparent polystyrene sphere is absorbing a fraction Pabs of the incident laser light power P0. The absorbed electromagnetic energy is transformed rapidly into heat, which is released into the environment. After a short time period, a stationary temperature gradient arises at the surface of the particle, which induces a phoretic flow13 that drives the particle along its symmetry axis. The input power Pin is therefore well defined and corresponds to the absorbed electromagnetic power Pabs. This is different from the definition of Sabass as it includes the power required to maintain a temperature field around the hemisphere, even if this would not generate motion.
A study of the size dependence of the swimmer efficiency thus boils down to the size dependence of the absorbed power Pabs and phoretic velocity Vth.
The absorbed power is related to the incident power P0 of the laser by the absorption cross section σabs(R) and the area A illuminated by the laser: Pabs(R) = σabs(R)P0/A.
Thus the size dependence is hidden in the absorption cross section of the metal cap.
The phoretic velocity on the other side can be expressed as the product of the thermodiffusion coefficient DT and the surface temperature gradient ∇T‖ (eqn (2)):
 | (2) |
Both quantities may depend on size even though Piazza et al. find a size independent thermodiffusion coefficient DT for colloidal particles.21 Inserting these dependencies, the efficiency reads:
 | (3) |
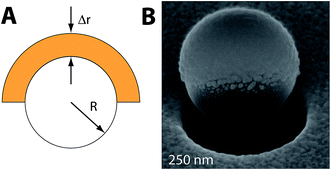
In the present work, we will therefore explore the size dependence of the photophoretic swimming efficiency by measuring the dependence of the phoretic velocity and the optical properties on the particle radius, ranging from R = 100 nm up to 625 nm. Throughout all of these studies, the gold cap thickness Δr = 50 nm of the Janus particle is kept constant (see Fig. 1 for details). As the surface temperature profile is difficult to access experimentally, we rely on finite element simulations (FEM) for this part.
2 Experimental
The motion of Janus swimmers of R = 100 nm to R = 625 nm has been studied by dark field microscopy. A heating laser with a wavelength of λ = 532 nm is focused onto the sample region. Images are recorded at an inverse frame rate of Δt = 15 ms and analyzed by a single particle tracking algorithm, as described in ref. 22. The single particle tracking yields the position and the orientation of the swimmer. To ensure a constant heating laser intensity at the particle position during a measurement, two different feedback based measurement schemes are employed. The first scheme is photon nudging,22,23 where the particle position and orientation are captured in real time and the propulsion is switched according to the particle orientation. This method allows us to trap and hold the particle close to a target position of constant laser intensity for a practically unlimited amount of time. The propulsion periods within this scheme can be analyzed by projecting the displacement of the particle in adjacent frames onto the orientation (angle ϕi in the lab frame) of the particle. The thermophoretic velocity Vth is then the mean displacement divided by the inverse frame rate Δt: | (4) |
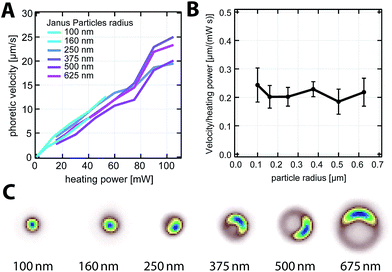
Below a particle radius of 250 nm, the orientation of the particle cannot be determined from the particle images (see Fig. 2c). To ensure constant illumination intensity for these measurements, the sample was moved by a x–y-piezo stage to keep the particle in the center of the illumination. The thermophoretic velocity can then be determined by either the velocity autocorrelation VAC(δ) of the particle (eqn (5)) or the long time limit of the mean squared displacement. The velocity autocorrelation may be used if the inverse frame rate is significantly smaller than the rotation time of the particle. Here the rotation time and the velocity can be obtained separately. Using an inverse frame rate of Δt = 5 ms is still sufficient to study the R = 160 nm swimmers (τR = 11.2 ms).
VAC(δ) = 〈![[V with combining right harpoon above (vector)]](https://www.rsc.org/images/entities/i_char_0056_20d1.gif) (t)· (t)·![[V with combining right harpoon above (vector)]](https://www.rsc.org/images/entities/i_char_0056_20d1.gif) (t + δ)〉i = Vth2 (t + δ)〉i = Vth2![[thin space (1/6-em)]](https://www.rsc.org/images/entities/char_2009.gif) exp(−δ/τR) exp(−δ/τR) | (5) |
In the case of the R = 100 nm swimmers, we have employed the long time limit of the mean squared displacement. At short times, the mean squared displacement shows a ballistic behavior (MSD(δ) ∝ δ2), which becomes linear in the time lag δ for long times, since the rotational Brownian motion randomizes the propulsion direction. The effective diffusion coefficient in the long time limit Deff is then related to the diffusion coefficient D of the Janus swimmer without propulsion plus the square of the propulsion velocity Vth times the rotational diffusion time τR (eqn (6)).
| Deff = D + Vth2τR/2 | (6) |
A full derivation of the mean squared displacement24–27 is summarized in the ESI† together with the obtained mean squared displacements and velocity autocorrelations. To obtain the phoretic velocity, we have used the Debye–Stokes–Einstein predictions for a R = 125 nm swimmer (particle radius plus half of the cap thickness).
3 Size dependence of the photophoretic velocity
With the help of the above described methods, we have determined the phoretic velocity of R = 100 nm to R = 625 nm Janus particles as a function of the incident laser power P0. As displayed in Fig. 2A, the thermophoretic velocity scales linearly for all particle sizes with the heating power. Plotting the average slope of the velocity increment with the heating power further reveals that the photophoretic velocity is independent of the particle size over the studied size range (Fig. 2B). Since the phoretic velocity is the product of the thermodiffusion coefficient DT and the temperature gradient along the particle surface ∇‖T, either both are independent of the particle size or their size dependencies exactly cancel each other out. A more detailed insight into this relationship may thus be obtained by considering the temperature gradient (Section 3.2), which depends on the absorbed electromagnetic power defining the temperature rise at the gold cap and the shape of the particle.3.1 Size dependence of the absorbed power
The size dependence of the absorbed power Pabs(R) is encoded in the absorption cross section σabs(R) of the metal cap by Pabs = σabsI, where I = P0/A, which is the incident intensity of the heating laser. We here assume that the metal cap is a homogeneous absorber with no particular resonances (i.e. plasmon resonances). The absorbed power then depends on the volume that the incident electromagnetic wave can penetrate. The total volume of the metal cap is: | (7) |
For metals, electromagnetic waves may only penetrate up to a certain depth, known as the skin-depth δ. If the cap thickness is larger than this skin-depth, Δr > δ (for gold and a wavelength of 532 nm, the skin-depth is δ ≈ 45 nm (ref. 28)), then the effective absorbing volume can be approximated by replacing Δr by the skin-depth δ in eqn (7). Thus, considering a constant cap thickness Δr or an effective absorption within a layer given by the skin-depth δ, the absorbing volume scales in the leading order of Δr with R2. If the particle radius R becomes comparable to the cap thickness and tends towards zero, then the two latter terms in eqn (7) become important, where the last term resembles the volume of the cap for a particle radius of R = 0. The experimental situation for different particle radii and a constant gold cap thickness leads to Pabs ∝ R2 also for the case when Δr ≈ δ.
A different scaling behavior appears if the cap thickness is constant relative to the particle radius, i.e. Δr/R = f, where f is a constant. In this case, the absorbing volume, the absorption cross section, and the absorbed power scale with R2 as long as R > δ/f. If the cap thickness decreases with the particle radius and reaches values below the skin-depth (i.e. R < δ/f), the absorbing volume scales with R3. This case, however, is not realized in the experiment.
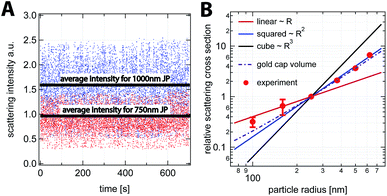
To access the scaling of the absorption cross section experimentally, we consider the size dependence of the scattering cross section and conclude on the scaling of the absorption cross section. For this purpose, we have extracted the integrated scattering intensity from the dark field images as a function of time. The use of two different particle sizes in one sample allows us to determine the relative scattering intensity.
Two example time traces of the scattering intensity for particles of R = 500 nm and R = 375 nm are shown in Fig. 3A. The strong fluctuations in the data are the result of the rotational motion of the particle. In Fig. 3B, the average relative scattering cross section normalized to the value for the R = 250 nm particle is shown in a double logarithmic plot. Particles above a radius of 250 nm reveal a slope of two. Such a scaling for the absorption and scattering cross-section is expected for larger spherical gold particles, as displayed in Fig. 5 in the ESI.† We therefore conclude from the scaling of the relative scattering cross section that the absorption cross section depends on the square of the radius and therefore on the surface, as expected. Smaller particles (R = 100 nm and R = 160 nm) deviate from this scaling, most likely due to a changing effective thickness of the gold layer. Based on these results for the relative scattering cross section, we assume that the absorbed power scales as Pabs ∝ R2 at a constant incident intensity I = P0/A.
3.2 Size dependence of the temperature profile
The second parameter, which determines the photophoretic velocity of the particle, is the surface temperature gradient. To obtain the temperature profile for a given geometry, the steady state heat eqn (8) with the thermal conductivity κ and the heat source density QV has been solved numerically with the help of FEM simulations (COMSOL 4.2 Multiphysics). For the Janus particles, analytical results in the limit of a thin cap are also presented. The heat source density QV is the ratio between the absorbed power Pabs (see Section 3.1) and the volume Vcap of the cap.| κ∇2T = −QV | (8) |
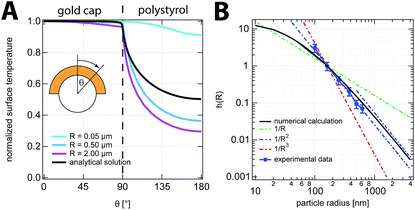
We have studied the temperature profile for a constant cap thickness Δr = 50 nm but with varying particle radii. The used parameters for the numerical calculations are reported in the ESI.† The results for the temperature profile along the particle surface for different particle radii but a constant gold cap thickness are displayed in Fig. 4A. The temperature gradient along the surface ∇T‖ is then proportional to the temperature difference and the detailed shape of the temperature profile. Since the temperature difference between the gold and the polymer side scales with the absorbed laser power, we may express the temperature gradient as the product of the absorbed laser power and a geometry factor h(R), which contains all the details of the shape of the temperature profile. Both parameters depend on the particle radius R:
 | (9) |
Assuming a constant cap thickness of Δr = 50 nm, the geometry factor scales as depicted in Fig. 4B. The results of the numerical solution of eqn (8) show that above a particle radius of R = 100 nm, h(R) drops with R−2. This corresponds to the thin cap limit (Δr ≪ R), which has been obtained before in ref. 22. For smaller particle radii (R < 100 nm), the geometry factor h(R) levels off, since the cap is no longer smaller than the particle.
The parameter h(R) can be extracted from the experimentally determined phoretic velocity by rewriting eqn (2) and (9) into:
 | (10) |
Since the measured phoretic velocity is size independent and DT is assumed to be size independent as well, the experimentally obtained geometry factor scales with the inverse of the absorption cross section for all studied radii and therefore with R−2. The difference between the numerical calculations and the experimental data is within the obtained error of the phoretic velocity but shows slightly different scaling, especially for the smallest particles. This deviation is attributed to the ideal geometry of the gold cap assumed within the numerical calculations, which is different from the shape depicted in the electron microscopy images (see Fig. 1 and ESI†).
4 Size dependent propulsion efficiency
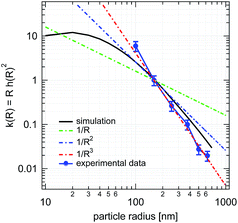
The above obtained results may now be combined to yield an expression for the efficiency of the self-thermophoretic swimmer. Similar to the temperature gradient, we may express the efficiency using eqn (1) and (9) as the product of the absorbed power Pabs and a size dependent geometry factor k(R) = Rh(R)2. | (11) |
Thus, two main parameters influence the efficiency and its size dependence. The first is a geometry factor k(R), which tells us how an optically induced and fixed temperature difference is converted into a temperature gradient. The second parameter Pabs describes the ability of the swimmer to harvest energy from the incident laser power.
The geometry factor k(R) scales with R−3 for large particles and shows a maximum at sizes around 20 nm, as visible in Fig. 5 (black curve). Even though the experimentally studied swimmers are not in the size range to reveal this maximum, numerical calculations show that the position of the maximum is sensitive to the thickness and shape of the gold cap. For very small particle sizes, the Janus swimmer turns into a passive gold half-sphere, which still absorbs light but does not generate a directed motion due to the missing temperature gradient along the particle surface. Thus, the efficiency has to reveal a maximum. The experimentally studied swimmer sizes nicely follow the expected R−3.
The power absorbed by the particle also directly affects the efficiency scaling, meaning that on one hand, at a fixed particle radius R, the swimming efficiency increases linearly with the heating power, which is equivalent to a linear increase in the temperature difference across the self-thermophoretic Janus swimmer. This result is in contrast to the result in ref. 17, where the efficiency is independent of the energy stored in the system. This difference arises from the fact that our definition of the input power includes the energy that is required to maintain the whole temperature field around the Janus swimmer even though the radial temperature gradients are not contributing to the propulsion of the swimmer. Sabass and Seifert, however, only consider the viscous losses by the particle motion and in the boundary layer.17 Further, the power dependence reported here suggests, at first glance, no upper bound for the efficiency, whereas other swimmer efficiencies are bounded e.g. by the reaction rates for catalytic swimmers.18,20,29 Similar effects may also be expected as, in general, a saturation of the absorption may occur at very high laser powers. However, this is typically close to the damage threshold of the materials. On the other hand, at a fixed incident heating laser intensity, it is concluded from the experiments that the absorbed power scales with the swimmer radius squared, R2. The product of the absorbed power and the geometry factor thus reveal, in the limit of large swimmers, a 1/R dependence, which agrees well with earlier theoretical predictions.17
The deviation of the experimental results from the numerical data can be related to three aspects. First, the simple geometry which was assumed for the numerical calculation might not represent the real Janus particles accurately enough. Second, as discussed above, the scaling of the absorption cross section of the real swimmer is probably more complex. And third, the assumption that the thermodiffusion coefficient is size independent has only been shown for passive plastic particles in an external temperature profile and has to be verified for self propelled photophoretic swimmers.
5 Conclusion
In conclusion, the size dependent efficiency of photophoretic Janus particles has been studied experimentally and with the help of numerical calculations. The efficiency of the studied system can be separated into a product of their capability to build up a surface temperature gradient summarized by a geometry factor and the ability to harvest the externally supplied energy as quantified by the absorbed power. Numerical calculations show a scaling of the efficiency with the reciprocal size for large particle sizes R ≫ Δr, which is also confirmed by experimental data, including the size dependence of the propulsion velocity and the scaling of the scattering cross-section for self-thermophoretic Janus swimmers with a radius between R = 100 nm and R = 625 nm. For small particle sizes, the calculations reveal that the detailed shape of the metal hemisphere becomes important, which leads to a maximum in the efficiency of a real system. In contrast to other considerations of the efficiency, our results show a linear dependence of the efficiency on the absorbed power of the particle, which is due to the fact that a large amount of energy is spent in maintaining a temperature field around the particle, which is not causing a directed motion of the particle.Acknowledgements
The authors acknowledge financial support for this research from SFB TRR 102 and Sächsische Forschergruppe FOR 877.References
- H.-R. Jiang, N. Yoshinaga and M. Sano, Phys. Rev. Lett., 2010, 105, 268302 CrossRef.
- I. Buttinoni, G. Volpe, F. Kümmel, G. Volpe and C. Bechinger, J. Phys.: Condens. Matter, 2012, 24, 284129 CrossRef PubMed.
- L. Baraban, R. Streubel, D. Makarov, L. Han, D. Karnaushenko, O. G. Schmidt and G. Cuniberti, ACS Nano, 2013, 7, 1360–1367 CrossRef CAS PubMed.
- J. R. Howse, R. A. L. Jones, A. J. Ryan, T. Gough, R. Vafabakhsh and R. Golestanian, Phys. Rev. Lett., 2007, 99, 048102 CrossRef.
- J. G. Gibbs and Y.-P. Zhao, Appl. Phys. Lett., 2009, 94, 163104 CrossRef PubMed.
- J. Palacci, S. Sacanna, A. P. Steinberg, D. J. Pine and P. M. Chaikin, Science, 2013, 339, 936–940 CrossRef CAS PubMed.
- W. F. Paxton, K. C. Kistler, C. C. Olmeda, A. Sen, S. K. S. Angelo, Y. Cao, T. E. Mallouk, P. E. Lammert and V. H. Crespi, J. Am. Chem. Soc., 2004, 126, 13424–13431 CrossRef CAS PubMed.
- M. Pumera, Nanoscale, 2010, 2, 1643–1649 RSC.
- I. Buttinoni, J. Bialké, F. Kümmel, H. Löwen, C. Bechinger and T. Speck, Phys. Rev. Lett., 2013, 110, 238301 CrossRef.
- I. Theurkauff, C. Cottin-Bizonne, J. Palacci, C. Ybert and L. Bocquet, Phys. Rev. Lett., 2012, 108, 268303 CrossRef CAS.
- J. A. Cohen and R. Golestanian, Phys. Rev. Lett., 2014, 112, 068302 CrossRef.
- J. Bialke, T. Speck and H. Löwen, J. Non-Cryst. Solids, 2015, 407, 367–375 CrossRef CAS PubMed.
- T. Bickel, A. Majee and A. Würger, Phys. Rev. E: Stat., Nonlinear, Soft Matter Phys., 2013, 88, 012301 CrossRef.
- M. Yang and M. Ripoll, Soft Matter, 2013, 9, 4661–4671 RSC.
- F. M. Weinert and D. Braun, Phys. Rev. Lett., 2008, 101, 168301 CrossRef.
- W. Wang, T.-Y. Chiang, D. Velegol and T. E. Mallouk, J. Am. Chem. Soc., 2013, 135, 10557–10565 CrossRef CAS PubMed.
- B. Sabass and U. Seifert, Phys. Rev. Lett., 2010, 105, 218103 CrossRef.
- B. Sabass and U. Seifert, J. Chem. Phys., 2012, 136, 064508 CrossRef PubMed.
- S. Ebbens, M.-H. Tu, J. R. Howse and R. Golestanian, Phys. Rev. E: Stat., Nonlinear, Soft Matter Phys., 2012, 85, 020401 CrossRef.
- M. J. Lighthill, Commun. Pure Appl. Math., 1952, 5, 109–118 CrossRef PubMed.
- M. Braibanti, D. Vigolo and R. Piazza, Phys. Rev. Lett., 2008, 100, 108303 CrossRef.
- A. P. Bregulla, H. Yang and F. Cichos, ACS Nano, 2014, 8, 6542–6550 CrossRef CAS PubMed.
- B. Qian, D. Montiel, A. Bregulla, F. Cichos and H. Yang, Chem. Sci., 2013, 4, 1420–1429 RSC.
- M. Schienbein and H. Gruler, Bull. Math. Biol., 1993, 55, 585–608 CrossRef CAS.
- W. Alt and G. Hoffmann, in Lecture Notes in Biomathematics. Biological Motion, Heidelberg Springer Verlag, 1990, pp. 254–268 Search PubMed.
- H. Risken, The Fokker–Planck Equation, Heidelberg Springer Verlag, 1984 Search PubMed.
- H. Qian, M. Sheetz and E. Elson, Biophys. J., 1991, 60, 910–921 CrossRef CAS.
- R. L. Olmon, B. Slovick, T. W. Johnson, D. Shelton, S.-H. Oh, G. D. Boreman and M. B. Raschke, Phys. Rev. B: Condens. Matter Mater. Phys., 2012, 86, 235147 CrossRef.
- S. Childress, J. Fluid Mech., 2012, 705, 77–97 CrossRef.
Footnote |
| † Electronic supplementary information (ESI) available: Additional experimental details on the sample preparation and the size dependent velocity; derivation of the mean squared displacement and velocity correlation. See DOI: 10.1039/c5fd00111k |
| This journal is © The Royal Society of Chemistry 2015 |

