 Open Access Article
 This Open Access Article is licensed under a
 Creative Commons Attribution 3.0 Unported Licence
Calcium manganite as oxygen electrode materials for reversible solid oxide fuel cell
Chengsheng
Ni
* and
John T. S.
Irvine
School of Chemistry, University of St Andrews, Fife KY16 9ST, Scotland, UK. E-mail: cn24@st-andrews.ac.uk
First published on 8th April 2015
Abstract
For an efficient high-temperature reversible solid oxide fuel cell (RSOFC), the oxygen electrode should be highly active for the conversion between oxygen anions and oxygen gas. CaMnO3−δ (CM) is a perovskite that can be readily reduced with the formation of Mn3+ giving rise to oxygen defective phases. CM is examined here as the oxygen electrode for a RSOFC. CaMn0.9Nb0.1O3−δ (CMN) with Nb doping shows superior electric conductivity (125 S cm−1 at 700 °C) compared with CM (1–5 S cm−1 at 700 °C) in air which is also examined for comparison. X-ray diffraction (XRD) data show that CM and CMN are compatible with the widely used yttria-stabilized zirconia (YSZ) electrolyte up to 950 °C. Both materials show a thermal expansion coefficient (TEC) close to 10.8–10.9 ppm K−1 in the temperature range between 100–750 °C, compatible with that of YSZ. Polarization curves and electrochemical impedance spectra for both fuel cell and steam electrolysis modes were investigated at 700 °C, showing that CM presented a polarization resistance of 0.059 Ω cm2 under a cathodic bias of −0.4 V while CMN gave a polarization resistance of 0.081 Ω cm2 under an anodic bias of 0.4 V. The phase stability up to 900 °C of these materials was investigated with thermogravimetric analysis (TGA) and variable temperature XRD.
Introduction
Renewable energy sources have attracted much attention in recent years to reduce the dependency on fossil fuels that cause pollutant gas emission and climate change.1 The lack of synchronization between electricity production and consumption makes energy storage crucial for the grid to function effectively. A reversible solid oxide fuel cell (RSOFC) that incorporates the production of H2 fuel from electricity via a solid oxide electrolysis cell (SOEC) and electricity generation via a solid oxide fuel cell (SOFC) could be an efficient and low-cost solution for energy conversion and storage. Operation at high temperatures (500–1000 °C) reduces the electrical energy requirement for the electrolysis and also increases the thermal efficiency of the power-generating cycle.2–4 It is expected that through the combination of a high-temperature reactor and a high temperature electrolyser, the process will achieve an overall thermal conversion efficiency of 48–59% while avoiding the challenging chemistry and corrosion issues associated with the thermochemical processes.4Yttria-stabilized zirconia (YSZ) is widely used as the solid oxide electrolyte due to its high stability at low oxygen partial pressure at elevated temperature. Sr-doped LaMnO3 (LSM) typically fulfils the requirement for use as a cathode in solid oxide fuel cells (SOFCs) operating at high temperature (T > 850 °C) due to its high thermal and chemical stability and catalytic activity for oxygen reduction in composites with YSZ, but it exhibits much higher polarization losses as a cathode than its Fe and Co analogues, Sr-doped LaFeO3 (LSF) and Sr-doped LaCoO3 (LSCo)5–7 at intermediate temperatures (500–800 °C). For an SOEC with a configuration of Ni(O)–YSZ|YSZ|LSM–YSZ at 700 °C, the loss from the oxygen electrode accounts for most of the total polarization loss,5,6,8 so it would be useful to minimize the energy loss from the oxygen electrode for a better performance. Although high performance has been demonstrated, neither LSF nor LSCo are compatible with the YSZ electrolyte due to the high thermal expansion coefficient and reactivity during the high-temperature firing of the electrode on electrolyte during processing.9
Novel materials compatible with YSZ need to be explored for better performance as the oxygen electrode of RSOFCs at temperatures below 800 °C for the purpose of using metallic interconnects and also reducing degradation and maintenance costs. AMnO3−δ (A = Ba, Sr or Ca) is a perovskite without expensive rare-earth element where most Mn shows a valence of IV and gives rise to the formation of an oxygen vacancy when MnIV is partially reduced to MnIII. Both BaMnO3−δ and SrMnO3−δ were reported to have a hexagonal structure10 and show very low electric conductivity,11 but CaMnO3−δ (CM) has an orthorhombic GdFeO3 structure and shows a conductivity of higher than 1 S cm−1 at 700 °C.12 The addition of oxyanion dopants (such as Si, B and P) in to a Ca1−ySryMnO3−δ system was reported to increase the conductivity by increasing the ratio of MnIII and inhibit the formation of hexagonal SrMnO3−δ.11,13,14 However, these nonmetallic-oxide-doped perovskites showed a reactivity even with CGO at 1000 °C,14 a common buffer layer to prevent the reaction between YSZ and the oxygen electrode materials. Oxygen-deficient CaMn1−xNbxO3−δ (x < 0.6) has been used as catalyst thermoelectric materials and sensors12,15 thanks to the change in valence of Mn, crystal structure and oxygen content. Since CaMn0.9Nb0.1O3−δ (CMN) showed the optimum Nb doping content in respect to the high electric conductivity (125 S cm−1 at 700 °C),12,16 it is also studied as a novel oxygen electrode for more practical benefits in the current collection. CM and CMN are for the first time electrochemically characterized as oxygen electrodes for an RSOFC: they both show high catalytic activity for the reduction and oxidation of oxygen at 700 °C. A clear relation between the physical/chemical property variation, e.g. TEC, microstructure and oxygen content thanks to the addition of Nb on the B site of a perovskite, and the difference in electrochemical performance of the oxygen electrode from both materials under an anodic and cathodic bias were established in this study.
Experimental
Stoichiometric amounts of CaCO3 (99%, Alfa Aesar), MnO2 (98%, Alfa Aesar, metal basis) and Nb2O5 (99.9985%, Alfa Aesar, metal basis) were mixed in an agate tray with a pestle and pre-calcined in a alumina crucible at 1000 °C for 12 hours. Then the 20 gram admixture was ground in a planetary ball-mill at 300 rpm for 30 min for better mixing and then pelletized and fired at 1300 °C for 20 hours for the correct perovskite phase. The heating and cooling ramp rates were 10 °C min−1 for both the calcination and final firing state. The pellets were then crushed and ground using an agate mortar for characterization with thermogravimetric analysis (TGA) and room temperature X-ray diffraction (XRD). Dense pellets of dilatometry measurement were obtained by calcining the ball-milled powder at 1300 °C for 20 hours and then cooling to room temperature at 1 °C min−1 to avoid any cracking during the cooling process. The dimensions for the pellet were approximately 10 mm in diameter and 2 mm in thickness. The thermal expansion of the dense pellets was analyzed with a high-temperature dilatometer (Netzsch, DIL 402C) in a flowing air atmosphere. The samples were heated and cooled to 900 °C at a rate of 3 °C min−1 and dwelled at 900 °C for 1 hour. For the compatibility test between the materials and YSZ, the 1.0 g powder of CM(N) and 1.0 g YSZ was agate-mixed, pressed under 150 MPa and then calcined at 950 °C for 5 hours at a ramp rate of 10 °C min−1. XRD was performed at room temperature on a PANalytical Empyrean diffractometer operated in reflection mode using Cu-Kα1 (wavelength: 1.5406 Å) radiation for the analysis of unit cell and structure. The XRD data were simulated with GSAS simulation software, in order to determine the unit cell and arrangement of atoms in the materials. TGA was performed on a NETZSCH 49C thermo-gravimeter up to 900 °C at a ramp rate of 10 °C min−1.Pellets of 8% Y2O3-stabilized zirconia (8YSZ) powder were pressed uni-axially at a pressure of 80 MPa and calcined at 1500 °C for 10 hours to give a >95% dense electrolyte. The electrolyte diameter was controlled to be 20 mm. In order to improve the adhesion between the electrode and electrolyte, the hand-ground powder was milled with zirconia balls (∼1 mm in diameter) again at 650 rpm in isopropanol for 30 minutes in a planetary ball-mill to get the fine source powders for the fabrication of the electrode. High temperature XRD measurements were performed on a Panalytical diffractometer operated in reflection mode using a Mo target (wavelength of Kα1 = 0.7093 Å and Kα2 = 0.71359 Å). The samples were stabilized at each temperature for 15 minutes before each scanning in the 2θ range from 10 to 50°. Three grams of the mixed powder was mixed with a vehicle containing polyvinyl butyral (PVB) and fish oil to make the slurry that would be applied onto a dense 8YSZ electrolyte through screen printing. Three screen-printed layers with intermediate dryings at 80 °C were utilized to give an electrode of around 20 μm thickness after firing. A good bonding between the electrode and electrolyte was obtained after calcination at 950 °C for 2 hours at a ramp rate of 3 °C min−1.
Two configurations of cells were used to test the performance of the air electrode in this paper. A symmetrical cell contains two identical oxygen electrodes on both sides of the 8YSZ electrolyte of 1.8 mm in thickness and 2 cm in diameter. The symmetrical cells were employed to measure the polarization resistance of the electrode in static air in the temperature range between 550 °C and 700 °C. The other configuration, called a three-electrode system, was composed of an oxygen electrode, a Ni(O)–YSZ fuel electrode and a reference electrode on the edge of the electrolyte (∼1.0 mm thick). The Ni(O)–YSZ fuel electrode (13 mm in diameter) was prepared by screen printing of the slurry containing 55 wt% NiO and 45 wt% YSZ onto the electrolyte plus a firing at 1350 °C for 3 hours. A (La0.8Sr0.2)0.95MnO3 slurry was painted onto the edge of the electrolyte and dried at 80 °C for 30 minutes and then fired at 950 °C for two hours along with the firing of the oxygen electrode. A silver wire (0.5 mm thick) was bundled the LSM coating and then fired at 700 °C again to provide the reference. The humidified gas (N2–50% H2O–3% H2) in the fuel electrode was produced by injecting deionised water into an evaporator to mix with the nitrogen carrier gas containing 5% H2, as described previously.2
Silver paste was used for the current collection for both the symmetrical-cell and three-electrode testing. The impedance was measured with a Solartron electrochemical workstation equipped with a lock-in frequency analyzer (Solartron 1260) with a sine wave of 10 mV. The three-electrode testing procedure commenced with sealing of the fuel electrode side of cells to the alumina tube of the testing jig, which was then placed in a vertical furnace. Scanning electron microscopy (SEM) and transmission electron microscopy (TEM) of the powders and tested samples are taken on a Jeol 6700F microscope and Jeol 2011, respectively.
Result and discussion
Crystal structure and compatibility with YSZ
The crystal structure of CM and CMN was regarded as an orthorhombic structure,12,15,17 with the cell parameters of √2acubic × 2acubic × √2acubic (acubic refers to the cubic structure), involving successive cooperative rotations of MnO6 octahedra around the 〈111〉 crystallographic axis. The cell parameters of calcium manganite depend on the oxygen content that can be affected by the synthesis route in terms of firing temperature and cooling rate.18,19 The cell parameters determined from powder XRD are shown in Table 1, showing that the addition of Nb on the Mn site enlarges the cell parameters.| a | b | c | V | δ |
|
τ | |
|---|---|---|---|---|---|---|---|
| a Cell parameters after calcined with YSZ at 950 °C for 5 hours. | |||||||
| CM | 5.2808(3) | 7.45525(1) | 5.2668(2) | 207.258(4) | 0.028 | 0.944 | 0.878 |
| CMN | 5.3316(2) | 7.5119(2) | 5.3074(2) | 212.504(4) | 0.017 | 0.851 | 0.871 |
| CMa | 5.2825(1) | 7.4563(2) | 5.2706(4) | 207.603(4) | — | — | — |
| CMNa | 5.3326(2) | 7.5112(2) | 5.3058(3) | 212.532(9) | — | — | — |

The reaction between zirconia and the cathode perovskite materials, especially those containing cobalt on the B-site, would cause the formation of insulating products, such as La2Zr2O7 or SrZrO3 that would block the transport of electrons/ions between the electrode and electrolyte. The XRD patterns (Fig. 1) show no observable reaction after 5 hour annealing in air in contact with YSZ at 950 °C. No obvious variation of lattice parameter (Table 1) was observed. Thermodynamic calculation has predicted the formation of CaMn2O4 for the CM–YSZ system at 1400 °C,20 which was not observed in our case due to the relatively low temperature. The compatibility of LSM is limited to 1200 °C and can be improved by A-site deficiency. Attempts have been made to prepare A-site deficient Ca0.95MnO3−δ and Ca0.95Mn0.9Nb0.1O3−δ using the same method as for their stoichiometric counterparts, but CaMn2O4 persisted as the impurity in both materials, even though the phase diagram21 of CaO–Mn2O3 indicated that 10% A-site deficient was achievable. The A-site deficiency of a perovskite was reported to be controlled by the bond energy of 〈B–O〉22 and 5% A-site deficiency for LSM was reported.
 | ||
| Fig. 1 XRD patterns of CM and CMN with YSZ after calcination at 950 °C for 5 hours. The peaks indexed with “Z” belong to YSZ and the rest to perovskites. | ||
Chemical and structural transformations with temperature variation
The oxygen non-stoichiometries, δ, were obtained by H2-reduction TGA. In order to analyze the TGA data, the initial assumption was made that the final products of the reduction contained Mn in the +2 state and Nb in the +5 state.15 The oxygen non-stoichiometry, δ, is listed in Table 1, and the ratio of MnIV to MnIV + MnIII is also calculated, assuming the charge neutrality of the perovskite. It can be seen that the oxygen content in CMN is higher than that of CM. A higher oxygen content in niobium doped CM was also reported by Kruth et al.15 for the samples synthesized in air, due to the higher thermal stability with Nb doping during the high temperature synthesis. TGA under air and oxygen (Fig. 2) can provide information on structural and chemical changes occurring in the volume of CM and CMN with temperature variation. It can be seen that in oxygen atmosphere, CM also picks more weight than CMN to make the δ value near zero after calcination at 900 °C for 1 hour. CMN is more stable against thermal treatment in air up to 900 °C. The δ values of CM and CMN change to 0.099 and 0.025 at 900 °C in air, respectively. The changes of oxygen content caused by the valence variation of the transition metal were anticipated to be beneficial to the electrochemical performance of the oxygen electrode.23 | ||
| Fig. 2 TGA curves CM (open circles) and CMN (open squares) in air and O2. The heating or cooling direction is indicated with the arrow. The ramp rate is 10 °C min−1. | ||
The Goldschmidt tolerant factor for perovskite structure, τ, of the materials was calculated according to the equation:24
 | (1) |
The RB for CM and CMN was calculated via the composition weighted average ionic radii of MnIV, MnIII and NbV. It can be seen that the addition of Nb into the lattice of CM increases the percentage of MnIII (Table 1) and decreases the tolerance factor thanks to the larger radii of MnIII (72 pm for low-spin) and NbV (78 pm) than MnIV (67 pm for low spin) under the similar oxygen content.15 The tolerance factors of both materials are ca. 0.87, less than 1 for a cubic perovskite. On the one hand, Dabrowski et al.25 found that the thermal stability of Sr1−x−yCaxBayMnO3 perovskites was governed by the magnitude of tolerance factor (τ < 1) which can be adjusted by the oxygen content. Similarly, the stabilizing energy of a perovskite structure was found to be in a linear relationship to the tolerance factor (when τ < 1).26 On the other hand, the substitution of a more electronegative Nb (electronegativity, χNb = 1.60) for Mn (χMn = 1.55) reduces the tendency to form oxygen vacancies.27 For example, Nb and Mo are reported to efficiently stabilize the cubic perovskite crystal structure of SrCoO3−δ oxide, which is noted for both high oxide ionic and electronic conductivity at elevated temperature.28,29 A balance of the above two factors should strike a balance to control the thermal stability of CM and CMN.
The values of TEC in flowing air are presented in Fig. 3. One can distinguish two segments with different TECs for both CM and CMN. The thermal expansion of CMN is more linear than CM in the whole temperature range. Both materials show quite similar TECs in the temperature range 25–750 °C, but CM shows a much higher TEC between 750–900 °C. A hysteresis of the shrinkage in the heating and cooling period was observed, and can be explained by the non-equilibrated release and recovery of oxygen of the bulk materials in air. Two TECs delimited at temperature ca. 750 °C were assumed for better fitting of the expansion data. At temperatures below 750 °C, both materials show similar TECs, ca. 13 ppm K−1 for heating and ca. 11 ppm K−1 for cooling. On the contrary, CM shows much larger thermal expansion than CMN at temperatures above 750 °C, reaching 21 ppm K−1 for heating and 25 ppm K−1 for cooling. The heavy doping of Nb on the B-site was reported to decrease the thermal expansion of LaCoO3,30 but this is not obvious in our study unless at temperatures higher than 750 °C. The additional expansion at higher temperatures can be a result of chemical expansion due to the change of MnIV to the larger MnIII, similar to the phenomenon observed in Sr-doped lanthanum cobalt oxide.31 It should be noted that the thermal history of the sample is also very important to the TECs of the samples, as can be seen from the discrepancy between the heating-up and cooling-down process. More importantly, the thermal expansion in the cooling stage is closer to that of YSZ and more meaningful since the stress could arise from the strain in the cooling process after the calcination of powder on the electrolyte.
 | ||
| Fig. 3 Dilatometry of the CM and CMN samples in the temperature range between 150 and 900 °C. The ramp rate for the heating and cooling was 3 °C min−1 and the samples dwelled in flowing air at 900 °C for 1 hour before cooling down. | ||
The in situ XRD patterns at temperatures up to 900 °C in air were measured to study the crystal structure of CMN presented in Fig. 4 to provide a better equilibrium than dilatometry since very fine powders (as shown afterwards in this paper) were used for the determination of lattice parameters in this study. The in situ XRD patterns of CM and CMN were performed in static air with an environmental X-ray diffractometer with Mo target. The cell parameters of CMN at room temperature calculated from XRD with Mo target are a = 5.3226(2) Å, b = 7.5103(2) Å and c = 5.3110(3) Å, and the volume of unit cell is 212.301(5) Å3, which are quite similar to those from the XRD using a Cu Kα1 X-ray diffractometer. The unit cell of the powder at room temperature before and after high-energy milling was checked with Cu Kα1 X-ray diffractometer, and no variation was observed. The fluorescence of Mn-ion under characteristic X-ray of Cu target and Kα2 of the Mo target would both affect the determination of cell parameters. It can be seen that CMN maintains the orthorhombic structure through the whole temperature range and the peaks shift toward the low angle direction along with increasing temperatures, indicating an expansion of the unit cells. The unit cell parameters (Fig. 5) of both materials during the heating stage were calculated by fitting the peaks into an orthorhombic structure. The linear fitting formula of unit cell parameters and parabolic fitting parameters of cell volumes are inserted in the diagram and the thermal expansion from a-, b- and c-directions are listed in Table 2. The TECs calculated from V1/3 (V = volume of unit cells) are in correspondence to those from dilatometry in the heating up stage. Previous studies17 on CM reported the existence of successive structural transitions from orthorhombic (Pnma) to tetragonal (I4/mcm) at 896 °C and further to cubic (Pm![[3 with combining macron]](https://www.rsc.org/images/entities/char_0033_0304.gif) m) at 913 °C, but we observed the change from orthorhombic to cubic structure at temperatures higher than 800 °C by analyzing the orthorhombicity of the structure, possibly due to the fast loss of oxygen due to the high surface area. It is obvious from the orthorhombicity that the addition of Nb clearly stabilizes the orthorhombic structure. A recent study has shown that chemical expansion is the result of two competing processes:32 the lattice contraction primarily due to electrostatic interaction and the lattice expansion due to the cation radius change. The exceptionally large unit cell parameter for CM at 800 and 900 °C could be the lattice expansion thanks to the higher concentration of Mn3+ cation in the lattice due to the loss of oxygen. The thermal expansion is anisotropic and the thermal expansion in a-direction is much smaller than those in the b- and c-direction. Basically, the addition of 10% Nb in CM increases slightly the thermal expansion in the a-, b- and c-direction from the high temperature XRD, but wider temperature range for CMN could bring in more contribution from chemical expansion. The variation in temperature on CM between 25 °C and 800 °C showed a volumetric increase of 2.45%,33 slightly smaller than the value of this study (3.26%). The high temperature XRD analysis of CaMn0.98Nb0.02O3 in the temperature between 25 °C and 900 °C showed a volumetric increase of 4.40% (ref. 27) and turned out to be a cubic structure at 900 °C. The discrepancy in thermal expansion between different studies could be explained by a difference in the oxygen content in CM due to thermal history that can contribute to the chemical expansion at elevated temperatures.31
m) at 913 °C, but we observed the change from orthorhombic to cubic structure at temperatures higher than 800 °C by analyzing the orthorhombicity of the structure, possibly due to the fast loss of oxygen due to the high surface area. It is obvious from the orthorhombicity that the addition of Nb clearly stabilizes the orthorhombic structure. A recent study has shown that chemical expansion is the result of two competing processes:32 the lattice contraction primarily due to electrostatic interaction and the lattice expansion due to the cation radius change. The exceptionally large unit cell parameter for CM at 800 and 900 °C could be the lattice expansion thanks to the higher concentration of Mn3+ cation in the lattice due to the loss of oxygen. The thermal expansion is anisotropic and the thermal expansion in a-direction is much smaller than those in the b- and c-direction. Basically, the addition of 10% Nb in CM increases slightly the thermal expansion in the a-, b- and c-direction from the high temperature XRD, but wider temperature range for CMN could bring in more contribution from chemical expansion. The variation in temperature on CM between 25 °C and 800 °C showed a volumetric increase of 2.45%,33 slightly smaller than the value of this study (3.26%). The high temperature XRD analysis of CaMn0.98Nb0.02O3 in the temperature between 25 °C and 900 °C showed a volumetric increase of 4.40% (ref. 27) and turned out to be a cubic structure at 900 °C. The discrepancy in thermal expansion between different studies could be explained by a difference in the oxygen content in CM due to thermal history that can contribute to the chemical expansion at elevated temperatures.31
 | ||
| Fig. 4 High temperature XRD spectra of CMN from 25 to 900 °C in static air. The insert is the magnified region in between 14–20°. The temperature (°C) is indicated beside the graph. A standard powder diffraction file (pdf) of CM is provided to show the rough position of peaks. | ||
 | ||
| Fig. 5 Temperature dependence of lattice parameters for CM (a) and CMN (b) and their cell volume dependence on temperature (c). Error bars are within the symbols. (d) Shows the orthorhombicity of CM and CMN in terms of a/c and √2a/c. The linear fitting of the unit cell in selected temperature ranges is indicated in the respective graphs of (a) and (b) and the parabolic simulation of cell volume with temperature is indicated in (c). The unit cell parameter (acubic) and volume (Vcubic) of the cubic phase (Pmm) for CM at 800 and 900 °C is scaled by √2 and 4, respectively, for better comparison. | ||
| A | b | c | V 1/3 | |
|---|---|---|---|---|
| CM 25–700 °C | 9.0 | 14.6 | 15.8 | 13.6 |
| CMN 25–900 °C | 9.5 | 15.7 | 16.1 | 13.8 |
Microstructure of the powders and oxygen electrode
In order to improve the sinterability of the powder at 950 °C for better bonding between the oxygen electrode and electrolyte, the hand-ground powder was milled in a high-energy planetary milling machine for finer particles. The powder and milling media was mixed in isopropanol milled at a high speed of 650 rpm for 30 min. Transmission electron microscopy (TEM) and scanning electron microscopy (SEM) were used to analyze the fine powder after high energy milling and the results are shown in Fig. 6 and 7, respectively. It can be seen that the particle size of both materials is in the range between 10 nm to 2 μm and the CMN particles are slightly finer than those of CM. Amorphous phases are found in both CM and CMN. In particular, the former consists of small polycrystalline particles and covered with an amorphous layer while the latter composes of mostly a single crystal. The calculated d-spacings of the selected areas of CM and CMN are 0.257 nm and 0.271 nm respectively, as indicated in the Fig. 7, which could correspond to the (121) crystal planes. | ||
| Fig. 6 SEM images of CM (a) and CMN (b) after milling with high-energy planetary milling. | ||
 | ||
| Fig. 7 Transmission electron microscopy images of CM (a) and CMN (b). | ||
The screen-printed layers (20–30 μm in thickness) composed of CM and CMN after calcination at 950 °C for two hours show good bonding to the YSZ electrolyte and similar grain size compared to the raw powder, as shown in Fig. 8. The grains lost their sharp edges in the sintering process and connected well to each other, which is beneficial to the transport of electrons.
 | ||
| Fig. 8 SEM images of post-test CM (a and c) and CMN (b and d) after calcination at 950 °C for 2 hours in air and testing at 700 °C for symmetrical cells. | ||
Electrochemical characterization
Electrochemical impedance spectroscopy was used to evaluate a symmetrical-electrode system (CM(N)|YSZ|CM(N)) to study the polarization resistance of the electrode at OCV in static air, as shown in Fig. 9. The Nyquist and Bode plots of the symmetrical electrode at 700 °C are shown in Fig. 9(a). One arc can be distinguished for the CMN electrode, while two arcs for CM after analyzing the Bode plots. The Arrhenius plots of the series resistance and polarization resistance are shown in Fig. 9(b) and (c). Rs is obtained from the high-frequency intersection between the Nyquist plots and x-axis, and Rp is calculated by the reduction of Rs from the low frequency intersection between the Nyquist plots and x-axis. The log(Rs) shows a linear plot against the reciprocal of temperature (1000/T) and activation energy of 0.8 eV, which is slightly lower than the activation energy (>1.0 eV below 650 °C)34 of YSZ in the temperature below 700 °C. The Rs may compose of two parts: the ohmic resistance of YSZ electrolyte and CM or CMN electrode. Even though the conductivity of CMN (125 S cm−1 at 700 °C) is higher than that of CM (1–5 S cm−1 at 700 °C),12,19 the Rs for both electrodes are similar, indicating that the ohmic loss from the electrode is negligible. The Rp values for the CM and CMN electrodes are 3.40 and 5.53 Ω cm2, respectively and are quite close to that of LSM/YSZ oxygen electrode on YSZ electrolyte (∼4 Ω cm2) at 700 °C.5,35 The polarization resistance of CM or CMN on YSZ at 700 °C is much smaller than that of SrMnO3 or CM/Gd0.1Ce0.9O2−δ (CGO) composite on CGO electrolyte at 700 °C (∼8 Ω cm2)11,14 and LSM electrode on YSZ (∼10 Ω cm2 at 800 °C).6 Porras-Vazquez et al.11 found that the composite electrode CaMn0.95Si0.05O3−δ/CGO showed a lower area-specific resistance (ASR) (0.35 Ωcm2 at 800 °C) than CM/GDC (1.5 Ωcm2 at 800 °C) and the increase of electric conductivity due to Si doping was thought to be the reason. With the benefit of higher ionic conductivity, the addition of CGO can decrease the electronic conductivity of the electrode. It was reported that the doping of 10% Ta, 10% Nb or 5% Mo on B site stabilized the low-temperature cubic structure of (La)SrCo(Fe)O3−δ to avoid the negative effect of intermediate hexagonal structure for better performance,28,29,36–38 while in our case the addition of Nb stabilized the low temperature-orthorhombic structure that showed inferior performance than the undoped CM. The addition of YSZ into LSM as oxygen electrode was reported to enhance the performance of electrode by a factor of two at 800 °C (ref. 39) due to the enlargement of triple phase boundary (TPB), since LSM showed an ionic conductivity as low as 10−7 S cm−1.9 Two linear regions are implied in the Arrhenius plots and the activation energies in the temperature range 650–700 °C are twice as large as those in 540–620 °C. The changes in activation energy are ascribed to the shifting of rate-limiting step from bulk diffusion limiting to surface diffusion limiting as the temperature increases since the activation energy of the bulk diffusivity is normally half of the surface diffusivity.40,41 | ||
| Fig. 9 (a) The impedance spectra (Nyquist plots and bode plots) of CM and CMN at 700 °C in static air. Arrhenius plots of the Rs (b) and Rp (c) at OCV before activation for the symmetrical cells in the temperature range between 550 to 700 °C. The activation energies of Rs and Rp are indicated in the respective diagrams. | ||
In order to study the properties of the electrodes under current load, a three-electrode system with a reference electrode was used for the electrolysis measurement. The fuel electrode was Ni(O)–YSZ under N2–50% H2O–3% H2 at a flow rate of 500 mL min−1. Fig. 10 shows the typical impedance spectrum of the electrolysis cell with CMN as the oxygen electrode at OCV. The impedance spectrum between the reference and either anode or cathode allows one to determine the electrode loss from the nonohmic part of the spectrum. In a three-electrode system, the improper placement of the reference and working electrodes will give erroneous results. It is noteworthy that the ohmic resistances in both spectra are quite close, and almost one-half of the total ohmic resistance of the cell as indicated from the two-electrode testing, showing that the reference electrode is sampling the potential near the centre of the electrolyte. Furthermore, the characteristic frequencies, ν*, for the fuel electrode spectra, 200 and 2 kHz, are different from that for the oxygen electrode, 80 Hz. For this cell, the fuel electrode and oxygen electrode impedances are 0.5 and 1.5 Ω cm2, respectively, showing the fuel electrode contributes a minor amount to the polarization resistance of the whole cell. The difference in Rp (1.5 vs. 5.53 Ω cm2) between the three electrode measurement and the previous symmetrical-cell measurement is caused by the additional activation of the oxygen electrode under 100 mA cm−2 cathodic current for 24 hours in the former case. It should be noted that the characteristic frequency of the CMN electrode is the same, 80 Hz, in both two electrode and three electrode systems. The electrodes can also be activated with anodic current since the same Rp of 1.5 Ω cm2 was observed if a 100 mA cm−2 current was passed through the symmetrical cell where a cathodic current for one electrode is anodic for the other. Similar polarization hysteresis has been observed in the LSM/YSZ electrode,5,42 in which polarization resistance decreased after both cathodic and anodic current passage.
 | ||
| Fig. 10 Impedance with three-electrode system for the CMN oxygen electrode, Ni/YSZ hydrogen electrode and the whole electrolyser. | ||
The IV curves of the electrolysis in the voltage range between −1.7 V to −0.82 V are shown in Fig. 11, where both IV curves show good linearity. The open circuit voltages (OCV) of both electrodes are 0.82 V, which is consistent with the theoretical Nernst voltage calculated between air and N2 flow containing 50% H2O–3% H2 at 700 °C. The maximum current at −1.7 V is 0.21 A cm2 and 0.17 A cm2 for the CMN and CM electrodes, respectively. The ASR calculated from the IV curve is 5.3 and 4.2 Ω cm2 for the electrolyser with a CM and CMN oxygen electrode, respectively. The ASR value for the electrolyser with a CMN oxygen electrode are 20% smaller than that calculated from the impedance spectrum at OCV, 5.5 Ω cm2. Since the anode is kept as the same for both electrolysers, the difference in performance is attributed to the catalytic activity of the oxygen electrode for the oxidation of O2− to O2. According to the impedance measurement, the ohmic loss from the 1 mm thick YSZ electrolyte contributes a large portion of the total loss at 700 °C. However, this configuration does not affect the comparison between the two materials as oxygen electrodes for oxygen oxidation.
 | ||
| Fig. 11 IV curves of the electrolyser with CM and CMN oxygen electrode after activation for 24 hours under cathodic current 100 mA cm−2. The steam electrode is Ni/YSZ in N2–50% H2O–3% H2 at a flow rate of 500 mL min−1. | ||
The Nyquist and Bode plots of the CM electrode are shown in Fig. 12(a). The characteristic frequencies for CM increase to a higher frequency after activation under 100 mA cm−2 cathodic current, which could be attributed to the change of surface and capacitance. The polarization resistance of the oxygen electrode under bias was measured using impedance and presented in Fig. 12(b). However, CM presents a polarization resistance of 0.059 Ω cm2 under −0.4 V bias as the cathode for fuel cell operation while CMN gives a polarization resistance of 0.081 Ω cm2 under 0.4 V bias as the anode for the electrolysis process. Considering the Rs is higher than Rp for both electrodes at all biases, the maximum actual voltage loss on the electrode under a bias of 0.4 V is lower than 0.2 V, which is quite a reasonable loss for the oxygen electrode in either fuel cell or electrolyser modes. The reversible decrease in impedance upon cathodic polarization of LSM-based electrodes has been observed by several groups, and the mechanism was not definitely clear,43,44 but the reduction of LSM surface could be involved in the activation process. Similarly, the loss of oxygen on the surface of CM during the reduction process could result in the formation of vacancies through eqn (2),45 which are beneficial to fast transport of the oxygen ion in the electrode.
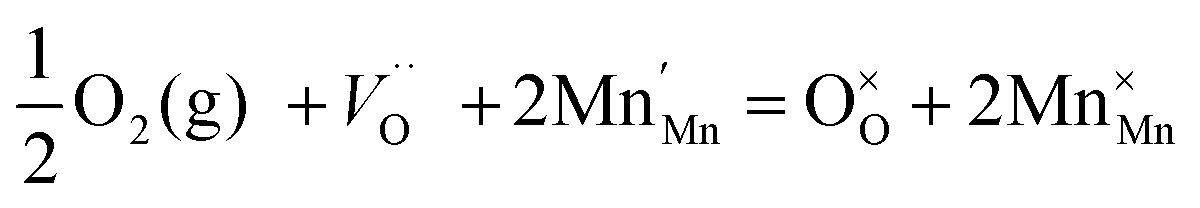 | (2) |
 | ||
| Fig. 12 Nyquist and Bode plots (a) of the CM and CMN cathodes at 700 °C in static air at OCV immediately after the activation at 100 mA cm−2 cathodic current for 24 hours. (b) is the Rp measured under bias for both electrodes with three-electrode system. The counter electrode is a Ni/YSZ electrode in N2–50% H2O–3% H2 at a flow rate of 500 mL min−1. | ||
Conclusion
CM and CMN were examined as oxygen electrodes for SOEs and SOFCs. The addition of 10 mol% Nb on the B site of perovskite improved the thermal stability of CM in air and oxygen up to 900 °C. Both materials showed a thermal expansion of 10.8–10.9 ppm K−1, close to that of YSZ (∼11 ppm K−1). At 700 °C, CM as a cathode for SOFCs could achieve a polarization resistance less than 0.1 Ω cm2, but CMN showed superior performance (Rp < 0.1 Ω cm2 at 0.4 V bias) as an anode for SOECs. The performance of the electrode can be further improved by mixing with ionic conductors to make a composite electrode. A possible exploration of the materials with a Nb content less than 10 mol% doping on Mn site would lead to a better oxygen electrode performance in both SOFC and SOE mode.Acknowledgements
We thank EPSRC for funding under the contract of H2FC hub EPSRC: EP/J016454/1 and Platform EPSRC: EP/K006800/1 and JTSI thanks Wolfson Merit of Royal Society of Chemistry: WRMA 2012/R2.References
- Q. Cai, C. S. Adjiman and N. P. Brandon, J. Power Sources, 2014, 268, 212–224 CrossRef CAS PubMed.
- G. Tsekouras and J. T. S. Irvine, J. Mater. Chem., 2011, 21, 9367–9376 RSC.
- S. H. Jensen, P. H. Larsen and M. Mogensen, Int. J. Hydrogen Energy, 2007, 32, 3253–3257 CrossRef CAS PubMed.
- Y. Shin, W. Park, J. Chang and J. Park, Int. J. Hydrogen Energy, 2007, 32, 1486–1491 CrossRef CAS PubMed.
- W. Wang, Y. Huang, S. Jung, J. M. Vohs and R. J. Gorte, J. Electrochem. Soc., 2006, 153, A2066–A2070 CrossRef CAS PubMed.
- Y. Bo, Z. Wenqiang, X. Jingming and C. Jing, Int. J. Hydrogen Energy, 2008, 33, 6873–6877 CrossRef PubMed.
- W. Wang, M. D. Gross, J. M. Vohs and R. J. Gorte, J. Electrochem. Soc., 2007, 154, B439–B445 CrossRef CAS PubMed.
- H. Uchida, N. Osada and M. Watanabe, Electrochem. Solid-State Lett., 2004, 7, A500–A502 CrossRef CAS PubMed.
- J. M. Vohs and R. J. Gorte, Adv. Mater., 2009, 21, 943–956 CrossRef CAS PubMed.
- K. Kuroda, N. Ishizawa, N. Mizutani and M. Kato, J. Solid State Chem., 1981, 38, 297–299 CrossRef CAS.
- J. M. Porras-Vazquez, E. R. Losilla, P. J. Keenan, C. A. Hancock, T. F. Kemp, J. V. Hanna and P. R. Slater, Dalton Trans., 2013, 42, 5421–5429 RSC.
- G. Xu, R. Funahashi, Q. Pu, B. Liu, R. Tao, G. Wang and Z. Ding, Solid State Ionics, 2004, 171, 147–151 CrossRef CAS.
- C. A. Hancock and P. R. Slater, Dalton Trans., 2011, 40, 5599–5603 RSC.
- J. M. Porras-Vazquez, T. F. Kemp, J. V. Hanna and P. R. Slater, J. Mater. Chem., 2012, 22, 8287–8293 RSC.
- A. Kruth, U. Guth and A. R. West, J. Mater. Chem., 1999, 9, 1579–1583 RSC.
- C. A. Hancock, A. L. Ong, P. R. Slater and J. R. Varcoe, J. Mater. Chem. A, 2014, 2, 3047–3056 CAS.
- H. Taguchi, M. Nagao, T. Sato and M. Shimada, J. Solid State Chem., 1989, 78, 312–315 CrossRef CAS.
- T. E. F. Lichtenthaler, Master, Universitetsbiblioteket i Oslo, 2006 Search PubMed.
- M. E. Melo Jorge, A. Correia dos Santos and M. R. Nunes, Int. J. Inorg. Mater., 2001, 3, 915–921 CrossRef.
- H. Yokokawa, N. Sakai, T. Kawada and M. Dokiya, Solid State Ionics, 1990, 40–41(Part 1), 398–401 CrossRef CAS.
- P. V. Riboud and A. Muan, J. Am. Ceram. Soc., 1963, 46, 33–36 CrossRef CAS PubMed.
- E. Y. Konysheva, X. Xu and J. T. S. Irvine, Adv. Mater., 2012, 24, 528–532 CrossRef CAS PubMed.
- E. Konysheva and J. T. S. Irvine, J. Mater. Chem., 2008, 18, 5147–5154 RSC.
- R. S. Roth, J. Res. Natl. Bur. Stand., 1957, 58, 75–88 CrossRef CAS.
- B. Dabrowski, O. Chmaissem, J. Mais, S. Kolesnik, J. D. Jorgensen and S. Short, J. Solid State Chem., 2003, 170, 154–164 CrossRef CAS.
- H. Yokokawa, N. Sakai, T. Kawada and M. Dokiya, Solid State Ionics, 1992, 52, 43–56 CrossRef CAS.
- L. Bocher, M. H. Aguirre, R. Robert, D. Logvinovich, S. Bakardjieva, J. Hejtmanek and A. Weidenkaff, Acta Mater., 2009, 57, 5667–5680 CrossRef CAS PubMed.
- W. Zhou, Z. Shao, R. Ran, W. Jin and N. Xu, Chem. Commun., 2008, 5791–5793 RSC.
- A. Aguadero, D. Pérez-Coll, J. A. Alonso, S. J. Skinner and J. Kilner, Chem. Mater., 2012, 24, 2655–2663 CrossRef CAS.
- V. Oygarden and T. Grande, Dalton Trans., 2013, 42, 2704–2715 RSC.
- X. Chen, J. Yu and S. B. Adler, Chem. Mater., 2005, 17, 4537–4546 CrossRef CAS.
- D. Marrocchelli, S. R. Bishop, H. L. Tuller and B. Yildiz, Adv. Funct. Mater., 2012, 22, 1958–1965 CrossRef CAS PubMed.
- Q. Zhou and B. J. Kennedy, J. Phys. Chem. Solids, 2006, 67, 1595–1598 CrossRef CAS PubMed.
- J. T. S. Irvine, I. R. Gibson and D. P. Fagg, Ionics, 1995, 1, 279–285 CrossRef CAS.
- J. Kim, H.-I. Ji, H. P. Dasari, D. Shin, H. Song, J.-H. Lee, B.-K. Kim, H.-J. Je, H.-W. Lee and K. J. Yoon, Int. J. Hydrogen Energy, 2013, 38, 1225–1235 CrossRef CAS PubMed.
- V. Cascos, R. Martínez-Coronado and J. A. Alonso, Int. J. Hydrogen Energy, 2014, 39, 14349–14354 CrossRef CAS PubMed.
- B. Qu, W. Long, F. Jin, S. Wang and T. He, Int. J. Hydrogen Energy, 2014, 39, 12074–12082 CrossRef CAS PubMed.
- S. Yoo, J. Kim, S. Y. Song, D. W. Lee, J. Shin, K. M. Ok and G. Kim, RSC Adv., 2014, 4, 18710–18717 RSC.
- S. Wang, Y. Jiang, Y. Zhang, J. Yan and W. Li, J. Electrochem. Soc., 1998, 145, 1932–1939 CrossRef CAS PubMed.
- H. K. B. W. David Kingery and D. R. Uhlmann, Introduction to Ceramics, John Wiley & Sons, Inc, 2nd edn, 1976 Search PubMed.
- Z. Shao and S. M. Haile, Nature, 2004, 431, 170–173 CrossRef CAS PubMed.
- M. Liang, B. Yu, M. Wen, J. Chen, J. Xu and Y. Zhai, J. Power Sources, 2009, 190, 341–345 CrossRef CAS PubMed.
- S. P. Jiang and J. G. Love, Solid State Ionics, 2001, 138, 183–190 CrossRef CAS.
- M. J. Jørgensen, S. Primdahl and M. Mogensen, Electrochim. Acta, 1999, 44, 4195–4201 CrossRef.
- E. Goldyreva, I. Leonidov, M. Patrakeev and V. Kozhevnikov, J. Solid State Electrochem., 2012, 16, 1187–1191 CrossRef CAS.
- F. A. Kröger and H. J. Vink, in Solid State Physics, ed. S. Frederick and T. David, Academic Press, 1956, vol. 3, pp. 307–435 Search PubMed.
- A. Reller, J. M. Thomas, D. A. Jefferson and M. K. Uppal, Proc. R. Soc. London, Ser. A, 1984, 394, 223–241 CrossRef CAS.
- M. Schrade, R. Kabir, S. Li, T. Norby and T. G. Finstad, J. Appl. Phys., 2014, 115, 103705 CrossRef PubMed.
- J. B. Goodenough, Annu. Rev. Mater. Res., 2003, 33, 91–128 CrossRef CAS.
| This journal is © The Royal Society of Chemistry 2015 |