 Open Access Article
 This Open Access Article is licensed under a Creative Commons Attribution-Non Commercial 3.0 Unported Licence
Structure–charge relationship – the case of hematite (001)†
Johannes
Lützenkirchen
*a,
Frank
Heberling
a,
Filip
Supljika
b,
Tajana
Preocanin
b,
Nikola
Kallay
b,
Florian
Johann
c,
Ludger
Weisser
c and
Peter J.
Eng
d
aInstitut für Nukleare Entsorgung, Karlsruhe Institut für Technologie, P.O. Box 3640, 76021 Karlsruhe, Germany. E-mail: Johannes.luetzenkirchen@kit.edu; frank.heberling@kit.edu; Fax: +49 721 608 2 3927; Tel: +49 721 608 2 4023
bLaboratory of Physical Chemistry, Department of Chemistry, Faculty of Science, University of Zagreb, Horvatovac 102a, 10001 Zagreb, Croatia. E-mail: nkallay@chem.pmf.hr; tajana@chem.pmf.hr; fsupljika@chem.pmf.hr
cOxford Instruments GmbH, c/o Asylum Research, Hauptstrasse 161, DE-68259 Mannheim, Germany. E-mail: Florian.Johann@oxinst.com; Ludger.Weisser@oxinst.com
dGeoSoilEnviroCars, University of Chicago, 5640 South Ellis, Chicago, IL 60637, USA. E-mail: eng@cars.uchicago.edu
First published on 16th January 2015
Abstract
We present a multidisciplinary study on the hematite (001)–aqueous solution interface, in particular the relationship between surface structure (studied via surface diffraction in a humid atmosphere) and the macroscopic charging (studied via surface- and zeta-potential measurements in electrolyte solutions as a function of pH). Upon aging in water changes in the surface structure are observed, that are accompanied by drastic changes in the zeta-potential. Surprisingly the surface potential is not accordingly affected. We interpret our results by increasing hydration of the surface with time and enhanced reactivity of singly-coordinated hydroxyl groups that cause the isoelectric point of the surface to shift to values that are reminiscent of those typically reported for hematite particles. In its initial stages after preparation the hematite surface is very flat and only weakly hydrated. Our model links the entailing weak water structure with the observed low isoelectric point reminiscent of hydrophobic surfaces. The absence of an aging effect on the surface potential vs. pH curves is interpreted as domination of the surface potential by the doubly coordinated hydroxyls, which are present on both surfaces.
Introduction
The solid–aqueous solution interface is of interest in a wide range of scientific disciplines, including corrosion and corrosion inhibition,1–3 catalyst preparation,4–6 colloid chemistry,7–9 nanotechnology,10–12 geochemistry,13–15 soil chemistry,16–18 clay and clay mineral chemistry,19–21 environmental chemistry22–24etc., and overlaps thereof.25–27 As a consequence many experimental and theoretical studies exist and highly detailed knowledge has been acquired from various points of view. Modern experimental techniques probe adsorbate structure,28 surface structure14 or interfacial water structure.29,30 Theoretical work attempts to yield more insight into the sometimes difficult interpretation of such data.31 Yet, several aspects still hamper the full understanding of the interfacial systems. One important aspect in that context is that different scientific disciplines sometimes develop independently from each other. Correspondingly, discoveries or observations made in one discipline are not necessarily taken up in another. A further drawback is related to the fact that many studies include no more than one technique to gather experimental or computational data. While the comparison between experiment and theory is often included, the precise relation of various experimental results originating from different techniques is rather sparse. It is therefore important to establish more accurate links between experiments and models emerging from different techniques (macroscopic and structural) and simulations.Some time ago we reconciled the interfacial behaviour of α-Al2O3 (sapphire) single crystals with (001) orientation32 in order to find out whether and which of the available data could be understood in one phenomenological picture. This attempt required a review of the available literature including a particular focus on the origin and treatment of the samples. It was finally postulated that the remaining data along with our own could be understood by a dual charging mechanism. The reconciliation included data from non-linear optic techniques (sum frequency and second harmonic generation), streaming potential and colloid adhesion studies, contact angle experiments and surface complexation models all as a function of pH, which is a master variable for the oxide–aqueous solution interface. The dual charging mechanism that allows an explanation of the experimental data involves classical protonation and deprotonation of doubly coordinated aluminol groups which are the only surface hydroxyl groups on the ideal surface, plus a rather unconventional contribution from ion adsorption in the electrochemical double layer. The latter (besides being unconventional for the oxide–electrolyte interface community) has been under hot debate for nearly a decade by now. It involves the physical adsorption of hydroxide ions and protons at interfacial water layers with a preference for the hydroxide ion. Strong adsorption of the hydroxide ion is assumed mostly by experimentalists.33–38 However, others find that the proton is preferentially adsorbed,39 that the charge is negligible,40 or that there is no spectroscopic evidence for hydroxide ions at the surface for very high NaOH concentrations or in the absence of an inert background electrolyte.41,42
An accepted generic feature is the occurrence of the isoelectric point (IEP) in aqueous solutions at pH 2 to 4 for surfaces as different as diamond, PTFE, oil, gases, gold, etc.43–45 Unlike oxide surfaces, all these systems have in common the absence of surface functional groups that could cause pH dependence. Without the occurrence of shifts in the IEP with changes in electrolyte concentrations and composition, experimentalists are left with only one solution to the problem that can explain the charge and the pH dependence at the same time. Even for ice surfaces the low IEP has been observed.46,47 Especially in the case of ice this is surprising, as one would expect the IEP to be where bulk water is neutral. The simplest interpretation of the low IEPs involves the hydroxide ion to be more strongly attracted to the interface than the proton or in other words that dissociation of water at interfaces is very different from dissociation of bulk water. On a similar note the negative charge of gas bubbles in pure water at pH 7 is argued to be due to the presence of hydroxide ions at the interface in absence of a better explanation.48
On oxide minerals the protonation and deprotonation of surface hydroxyls has been traditionally invoked to explain pH-dependent charging. The corresponding pK values are successfully predicted from the surface structure for well-defined particles.49–52 For various single crystal samples, the predicted pK values fail to reproduce the experimentally observed IEP, which finally led us to postulate dual charging, involving the traditional picture of charged surface hydroxyls plus the unconventional charging of the adjacent water layer. According to the traditional picture, points of zero charge for most oxide particles should coincide in the absence of specific adsorption of background electrolytes and the corresponding IEPs should be directly related to the pK values of the surfaces, i.e. at pH about 6 in the case of hematite (001) and sapphire (001).30,53,54 Instead, the measured IEPs are at pH about 4, in the range of those observed for the “inert” surfaces discussed above. On sapphire (001) the predicted point of zero charge is confirmed in sum frequency generation studies30 or contact angle investigations,32 while the IEP of 4 is found in other experiments.53,55 Importantly, some of the seemingly contradictory results have been obtained on identical samples.32 The difference can therefore safely be assumed to be real and can phenomenologically be explained by a dual charging mechanism.
On sapphire (001) both contributions to the dual charging mechanism (surface hydroxyls and water layer) arise from protons and hydroxide ions. The adsorption of protons to or the release of protons from the surface aluminols would classify them as surface charge/potential determining ions, whereby their contribution to charge accumulation is restricted to the plane of the surface hydroxyls. The second contribution which arises from uptake of protons on or release of protons from adjacent water layers in turn affects the zeta-potential. In particular on surfaces like sapphire (001) the surface functional groups (involving only doubly coordinated oxygens) are rather stable and do not protonate or deprotonate within the usual pH-range.
Surfaces like silver halides on the other hand do not have the disadvantage that the same ions affect both surface and zeta-potential, and in particular protons and hydroxide ions do not affect the surface potential, which is controlled by silver and halide ions. In such systems simultaneous measurements of surface and zeta-potential clearly illustrate the difference between the action of the surface potential/charge determining ions and the action of protons and hydroxide ions, which were found to influence the zeta-potential.56
Furthermore, studies of both flat single crystals and colloidal particles showed, that hydroxide ion adsorption at interfacial water layers was more pronounced on the flat surfaces57 in agreement with MD-simulations.58 Knowing both, surface and zeta-potentials, is therefore key to the understanding of flat interfaces with defined crystallographic orientation, which are often taken as model substrates to investigate contaminant uptake, dissolution, growth and other phenomena. In the case of sapphire,32,59 we relied on surface potentials estimated from surface complexation modelling. For the silver halides both quantities were measured57 thus avoiding model inherent assumptions. A dual charging model was shown to reproduce all experimental observations qualitatively.57
The present study tries to push the approach further by applying various experimental techniques to identical samples and investigating the effect of aging on the hematite (001) surface. There is some indication from previous second harmonic generation and atomic force microscopy (AFM) experiments which report relatively low points of zero charge. This suggests that this surface has unexpected properties similar to sapphire (001).60 In those studies it was reported that annealing of the surface led to changes in the experimental results, but no conclusions about the origin of the changes were possible.60 Direct zeta-potential measurements for hematite (001) are not available to our knowledge but the hematite (001) surface has seen recent interest from various groups.
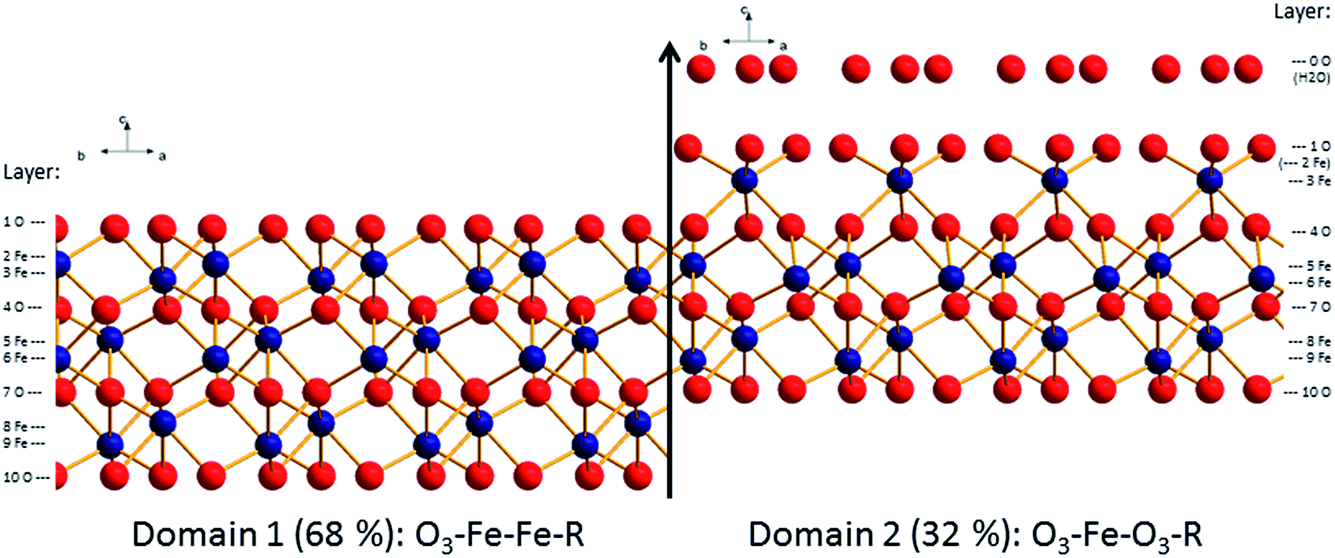
Surface diffraction is the major technique to study the structure of the surface and/or the adjacent water layer and to deduce which surface functional groups are present61,62 and what kind of water structure forms at the interface.29 An important conclusion has been that the water on annealed hematite (001) is weakly structured.29 Another conclusion was that a bi-domain structure persists at the surface where the contributions from both domains varied in the different studies.61,62 In the remainder of the text we will discuss this bi-domain structure which has been observed by other methods as well.63,64 The two distinct structures that emerged from these studies are O3–Fe–Fe–R and O3–Fe–O3–R. How these terminations relate to the bulk hematite structure is displayed in Fig. 1. For the oxygen terminated surface (O3–Fe–Fe–R, Fig. 1, left) the surface is composed of doubly coordinated oxygen atoms. By removing the top oxygen layer the double iron termination (Fe–Fe–O3–R, Fig. 1, 2nd structure) is obtained. Further removal of an iron layer yields the single iron termination (Fe–O3–Fe–R, Fig. 1, 3rd structure). The fourth option (noted O3–Fe–O3–R, Fig. 1, right) is terminated by singly coordinated oxygen atoms. It may be understood as the Fe-terminated surface with water/hydroxide adsorbed to the top Fe atoms. This termination may form upon addition of Fe-ad atoms onto the oxygen termination,65 with subsequent rapid hydroxylation.66 The O3–Fe–O3–R-termination may also be understood as an oxygen termination with iron vacancies in one of the top iron layers (indicated by transparent iron atoms in Fig. 1, upper panel, right). It is important to note, that due to the low scattering cross-section of protons, surface diffraction does not allow to distinguish whether the top oxygen atoms are oxygen (O2−), hydroxide (OH−), or adsorbed water molecules (H2O).
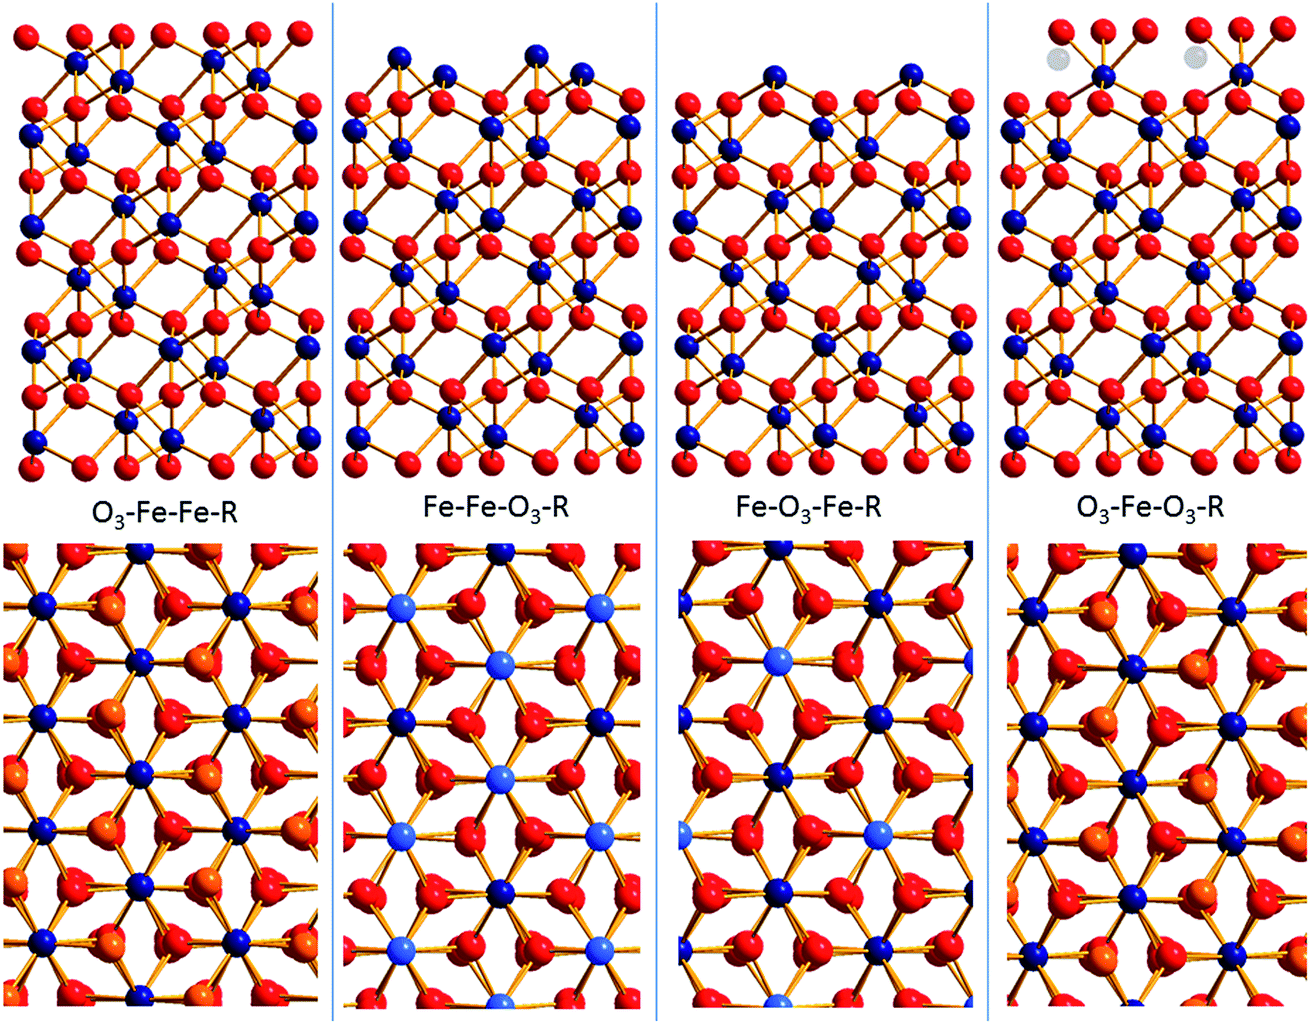 | ||
| Fig. 1 A selection of chemically distinct surface terminations of hematite (001) (O: red, Fe: blue). The top panel shows side views of four possible terminations, the lower panel shows the corresponding top views. In the top views the surface atoms are highlighted in orange (oxygen) or light blue (iron). | ||
Another series of studies involved surface potential measurements.67–71 The bulk part of the data suggests a broad plateau-like region in surface potential vs. pH curves with an increase at sufficiently low and a decrease at sufficiently high pH. Various interpretations of the data have been proposed. One interpretation was based on a shielding mechanism,71 by which reactive groups could not be protonated or deprotonated, but this mainly explains the kinetics of the reaction and does not apply to our investigation. Two major difficulties appear in interpreting the experimental data: the determination of the point of zero surface potential and the absolute value of the surface potentials. The points of zero potential on two different hematite (001) samples have been previously fixed at the mid-pH of the plateau (suggesting a value of about 6)70 or inferred from numerical procedures (resulting in a value of about pH 8.3).71
In our present work we combine CTR and surface potential data and include zeta-potential measurements. Thus we probe the surface structure and the concomitant surface potential as well as the water structure and the concomitant interfacial potential, which results from the net charge within the electrokinetic shear plane.
A second aspect addresses the aging of the hematite surface. To this end we have exposed the crystal to solutions for extended periods of times, and followed the changes with zeta-potential measurements. The initial (referred to as “fresh”) and final (referred to as “aged”) states were analysed by surface diffraction to generate a consistent picture between the structure of the interface and the concomitant charging properties. The measurements were all performed on samples from the same source, treated in the same way and subject to similar time dependence. High resolution atomic force microscopy (AFM) on a fresh sample confirms various features of the surface diffraction study.
Experimental
Sample origin and preparation
The samples were purchased from “Surfacenet” (Münster, Germany). They are polished on one side and have dimensions of 10 × 20 mm2. These samples fit exactly into the set-up used for zeta-potential measurements. Samples for surface potential measurements are smaller so that they allow the construction of a single crystal electrode. For the AFM study a 10 × 10 mm2 sample was used. According to the supplier the single crystals were produced from a natural crystal. The exposed crystal face in all experiments is the polished (001) face. Samples were pre-treated according to a procedure previously established for sapphire (001),32,59 which has been used or adopted by others.72,73 The samples were soaked in acetone overnight and subsequently washed by ethanol and finally by MilliQ water. On sapphire (001) this procedure ensures elimination of organic contamination and reproducible results from streaming potential measurements.Solution preparation and measurement conditions
All solutions were prepared from MilliQ water (18.2 MΩ cm) and all chemicals were from Merck. Solutions are kept under argon during all measurements (in the surface diffraction measurements under helium) to minimize intrusion of carbon dioxide. pH titrations were started at high pH. pH was subsequently decreased by adding acid.Zeta-potential measurements
Zeta-potential measurements were performed as previously described in detail.32,57,59,74 We used the SurPass Electrokinetic Analyzer (Anton Paar, Graz, Austria) to carry out the experiments. In short, two samples were glued with the unpolished side to two stamps. The exposed polished side (cleaned as described above) was rinsed by ethanol and MilliQ water and then the stamps were inserted into a cell to create a rectangular flow channel. The channel width was adjusted to about 100 μm. An experiment was initiated from a solution of a given electrolyte concentration (NaCl), in which the pH was increased by adding NaOH (50 mM) and then a titration was started by adding HCl (50 mM). Equilibration times were at least 10 minutes per point and at least 4 replicate measurements were performed at each pH. pH measurements in the SurPass set-up were performed using the built-in device, which was calibrated against three buffer solutions. All measurements were performed at room temperature.After the first series of measurements the samples were kept in an aqueous environment (MilliQ water). Subsequent measurements surprisingly led to strong shifts in the zeta-potential. This is unlike observations with sapphire (001) where the charging behaviour can be reproduced over extended time periods with a given set of unannealed samples.
Surface potential measurements
Surface potential measurements were performed as previously described.70 The potential of the Single Crystal (SCr)-hematite electrode was measured by a Metrohm 713 pH-meter. A silver/silver chloride electrode, filled with 3 mol dm−3 KCl solution, with a salt bridge (Metrohm, 6.0729.100) filled with sodium chloride (c = 10−3 mol dm−3), was used as a reference. pH was measured using a combined Metrosensor glass electrode (Metrohm, 6.0259.100). The pH-meter was operated by batteries (Metrohm, 826) and used for the measurements of pH. Systems were thermostatted at 25.0 °C. The experiments were performed under an argon atmosphere. The measuring system (thermostatted vessel, electrodes, magnetic stirrer) was placed in a Faraday cage. The surface of the SCr-hematite electrode was cleaned with ethanol and rinsed with water before all measurement runs (i.e. beyond the standard cleaning procedure). Sodium chloride (c = 10−3 or 10−2 mol dm−3) was used as background electrolyte. Potentiometric titrations were performed by adding hydrochloric acid (c = 10−1 mol dm−3) or sodium hydroxide (c = 10−1 mol dm−3). Time intervals between additions were between 10 and 15 minutes. Potentiometric titrations were entirely automated. Data were collected every 4 s.CTR-data collection
Crystal truncation rod (CTR)-data were recorded at the Advanced Photon Source (APS at Argonne National Laboratory) at Sector 13 (GSECARS) at the 13 BMC station.The samples used for collection of CTR-data include a fresh sample and an aged sample that had been retained from the last series of zeta-potential measurements. Beamline optics contain a focusing SI (111) double crystal monochromator. The photon energy was fixed to 15 keV. The sample was oriented relative to the beam on a Newport 2 + 2 + kappa diffractometer. Measurement of the specular CTR was performed with the surface normal of the sample in a horizontal position, while for the measurements of the off specular CTRs the incident angle of the beam relative to the surface was maintained at a constant value of 2°. The diffraction signal was recorded by a PILATUS 2D pixel array detector with 195 × 487 pixels (vertical × horizontal). The size of the beam was limited by horizontal and vertical slits to 500 μm × 500 μm (vertical × horizontal).
The sample was mounted onto the diffractometer in an environmental sample cell, which was constantly flushed with humid He-gas (close to 100% relative humidity) in order to maintain the sample surface fully hydrated during the measurements.
CTR-data integration
Integration of diffracted intensities from the PILATUS images was performed using the tdl software package (https://github.com/xraypy/tdl).A total of 692 and 654 structure factors were recorded for the fresh and the aged hematite samples, respectively. The measured structure factors were averaged in the p3m plane group, resulting in 524 and 439 unique structure factors, respectively. Note that a single hematite (001) termination exhibits p3 symmetry only. However, in the hematite unit cell 6 chemically equivalent terminations exist, which are crystallographically distinct, but equally likely to constitute the actual surface. These terminations are linked by the threefold symmetry axis along hematite [001] and the glide plane symmetry along the same axis (space group R![[3 with combining macron]](https://www.rsc.org/images/entities/char_0033_0304.gif) c). As the surface structure is modelled assuming an equal abundance of these symmetry related domains at the surface, as in previous studies,61,62 the total symmetry considered for hematite (001) CTR data reduction may be increased from p3 to p3m without any loss of information. This reduces the number of unique structure factors and, correspondingly, reduces the computational effort during modelling.
c). As the surface structure is modelled assuming an equal abundance of these symmetry related domains at the surface, as in previous studies,61,62 the total symmetry considered for hematite (001) CTR data reduction may be increased from p3 to p3m without any loss of information. This reduces the number of unique structure factors and, correspondingly, reduces the computational effort during modelling.
CTR-data modelling approach
Data modelling is performed using a modified version of the python interface structure refinement package (https://github.com/xraypy/tdl). The modified version was expanded to allow for the treatment of multiple surface terminations and symmetry related surface domains, following an approach described earlier.75 The abundance of chemically distinct surface terminations is thereby adjusted as a fitting parameter during data modelling, while an equally weighted average is taken over the symmetry related domains. Structure factors of the two chemically distinct terminations are summed in a coherent fashion. In agreement with previous studies,61,62 incoherent summation did not yield acceptable fits to the data.Preliminary modelling approaches, using a single surface termination, failed to describe the data for both samples by a simple stoichiometric surface termination. Occupancies of the surface iron sites rather indicated a surface termination consisting of a mixture of O3–Fe–Fe–R and O3–Fe–O3–R domains very similar to previous results.61,62 In our modelling approach we therefore started with a linked two domain model as reported by Trainor et al.,62 where the O3–Fe–Fe–R and O3–Fe–O3–R domains share common structural parameters in layers that are not directly exposed to the surface or mimicking adsorbed water molecules (modelled as oxygen atoms, because of the low X-ray scattering cross-section of hydrogen). In contrast to Trainor et al.62 and Tanwar et al.61 this “linked model” did not yield a satisfactory description of the CTR data (χ2 > 5) for both data sets. Therefore, after the initial adjustment of the linked model, the structural parameter space was limited to a narrow range around the common value (±0.005 in fractional coordinates) and the model was readjusted with individual parameters for both domains.
All atom displacements are modelled such that the threefold symmetry of the surface structure is maintained. The iron atoms have fixed lateral positions as they sit on the threefold symmetry axes. The vertical displacement of the oxygen atoms in one layer is described by one parameter fixing the oxygen atoms at equal vertical positions. Lateral positions of the three oxygen atoms in one layer are described by two parameters [e.g.: O1: (x, y), O2: (−x + y, −x), O3: (−y, x − y)] to keep the threefold symmetry.
During the model adjustment the bond valence sums of the iron atoms in the surface structure according to Brown and Altermatt76 are constrained to stay within 5% of the nominal iron valence of +III. The bond valence calculations on the surface oxygen atoms simultaneously yield information, which can be used to draw conclusions about their protonation states.
AFM measurements
High resolution AFM measurements were carried out using a Cypher ES apparatus (Asylum Research). Both imaging and force spectroscopy were performed in AC mode with an “Arrow UHFAuD” cantilever from NanoWorld. The cantilever was excited using blueDrive photothermal excitation with oscillation amplitudes <1 nm in liquid environments and <5 nm in air. The fresh sample was studied to gain insight into the roughness of the sample and to try to support results from the CTR study concerning surface structure of and interfacial water structure on the fresh sample.Surface complexation modelling
Surface complexation modelling was performed with a modified version of FITEQL2. The surface and zeta-potential data were fitted to a set of surface chemical equations involving a model for the electrical double layer (see ESI†).Results and discussion
Zeta-potential measurements
Fig. 2 shows the pH function of the zeta-potential as it changes from the fresh sample to a steady state (aged sample). The initial state of the surface produced repeatedly an IEP of about 4. Later, the IEP shifted gradually to higher pH until it reached a steady state value of about pH 9.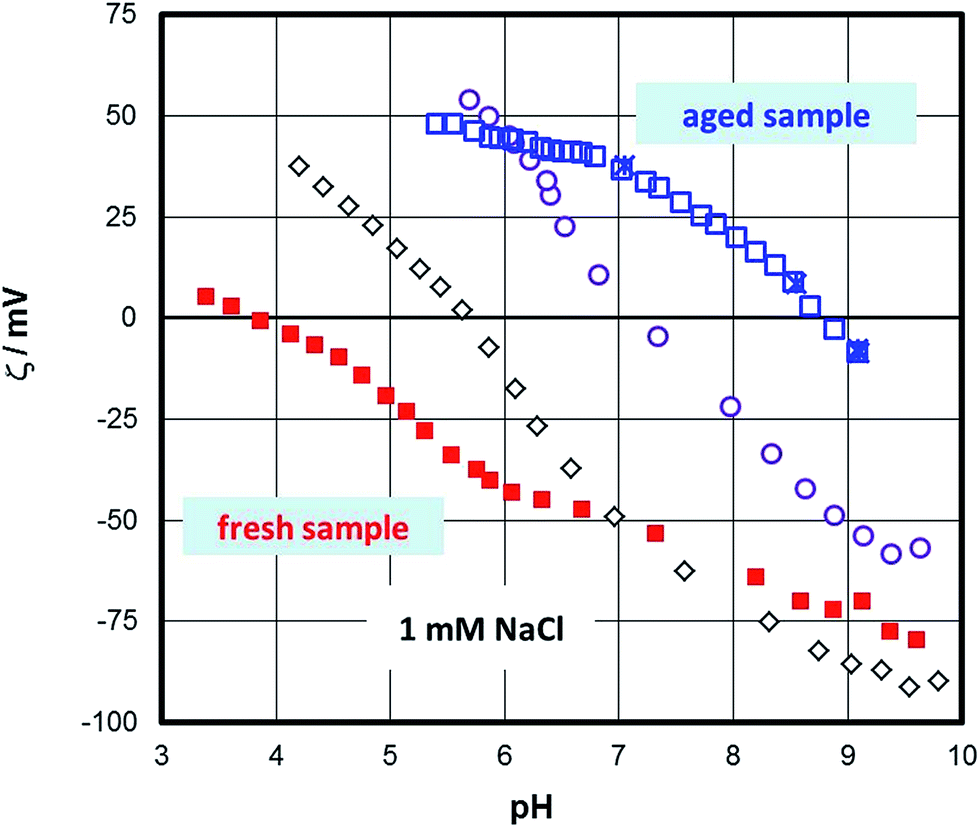 | ||
| Fig. 2 The effect of aging in aqueous solution on the zeta-potential of the hematite samples measured in 1 mM NaCl solution. | ||
The initial IEP obtained for the fresh sample was identical to the ones routinely obtained for “inert” surfaces,77 but also for isostructural sapphire (001) samples78 or even flat samples of TiO2 (ref. 79) or ZnO.80 The occurrence of this IEP for so many different samples could be challenged in the sense that it is triggered by the method or by systematic errors or artefacts. For sapphire (001) the IEP of about 4 (ref. 32) has been interpreted in terms of charging of the interfacial water layer adjacent to the surface. Weak ordering of water at both sapphire- and hematite (001) surfaces29 supports this interpretation. The observation of an IEP at about pH 9 for the aged hematite sample, i.e. identical to the bulk of IEPs for hematite particles, suggests that the method is not at the origin of those low IEPs. The transient change could be due to structural changes at the surface of the sample and/or changes related to the interfacial water structure.
Surface potential measurements
The surface potential vs. pH response was not prone to significant changes even for an extended period of time. We always observed the same overall features with a broad range of constant potential at pH values between 4 and 9. This plateau-behaviour could be explained by the MUSIC model as discussed previously.67,70 Briefly, the doubly coordinated surface hydroxyls were rather inactive towards protonation and deprotonation since their pK values are about 0 and 12.54 The insensitivity of the surface potential vs. pH curves to aging confirms our previous claim that a surface with plateau-like behaviour is thermodynamically stable.70Surface diffraction data
CTR-data and best fit model calculations are shown in Fig. 3. As an example the 00L rod (top panel in Fig. 3) indicates that the surface diffraction data change with time. Clearly between 6 < L < 9 a shoulder is present on the fresh sample that disappears on the aged sample.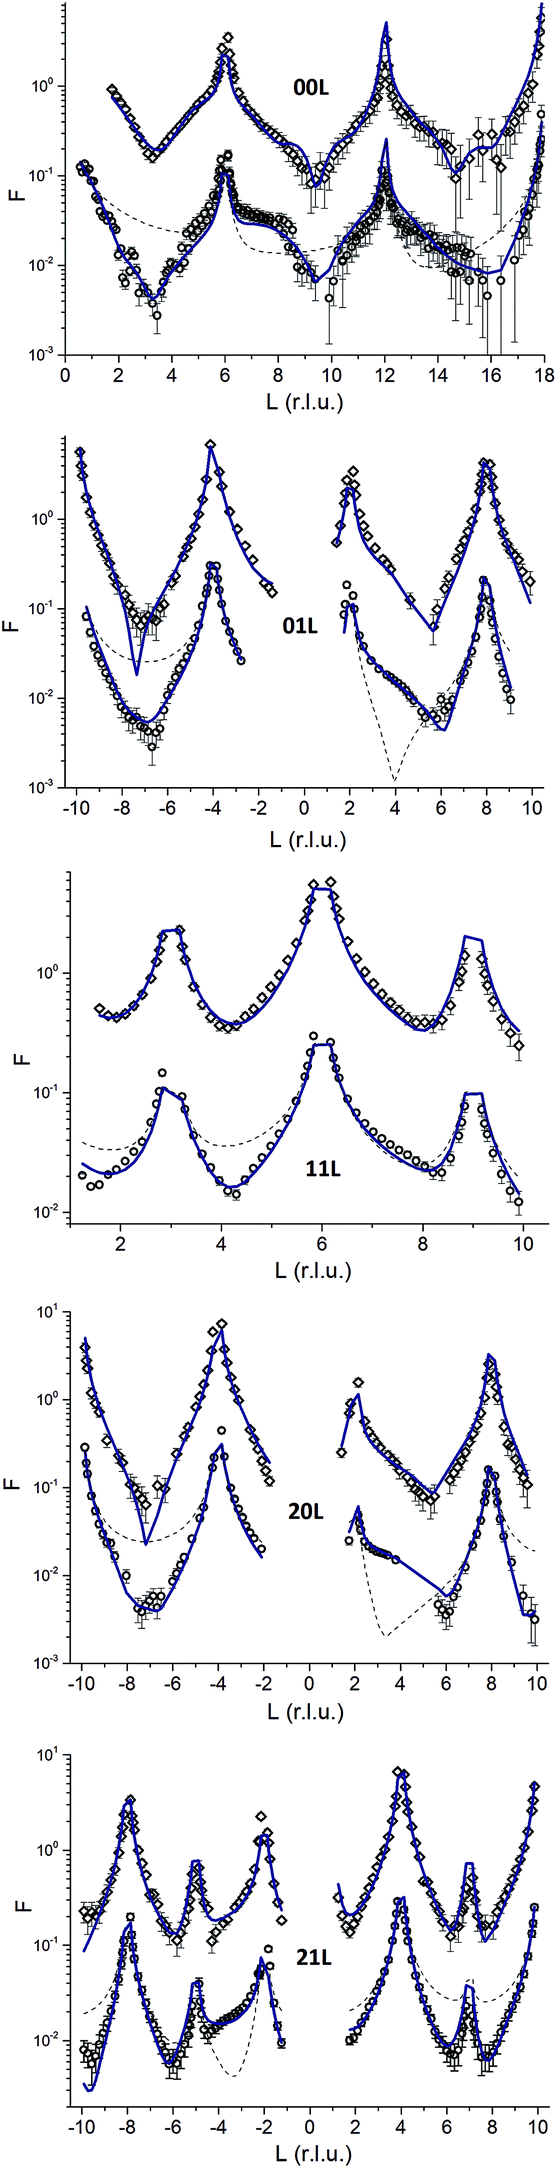 | ||
| Fig. 3 CTR data for the aged (upper graphs, diamonds) and fresh (lower graphs, circles) are shown along with calculated structure factors (solid lines). The thin dashed lines in the lower graphs indicate the structure factors expected for bulk terminated hematite. The data for fresh and aged hematite are offset for clarity. | ||
The comparison with the bulk terminated hematite (dashed lines) shows that the real surfaces are different from the ideal surface. The full lines correspond to the structural models for the two samples obtained in the present study. The agreement between experiment and model is rather good (χ2 = 3.97 and χ2 = 2.97 for the fresh and aged samples, respectively). Both surfaces are bi-domain, with different contributions from the two terminations.
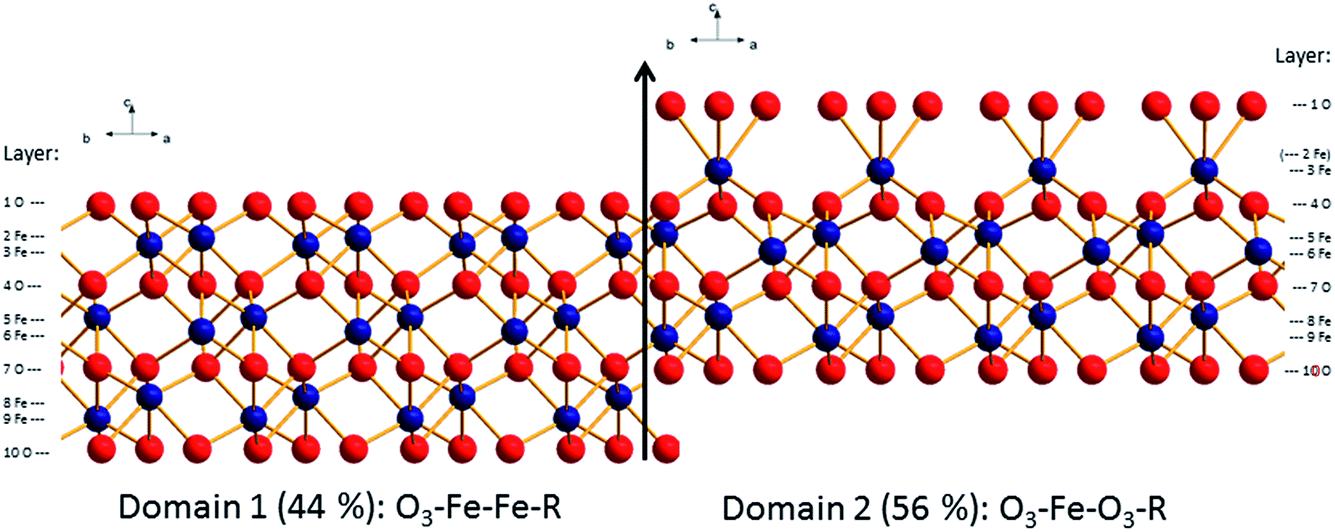
The structural parameters corresponding to the best fit models are reported in ESI (Table SI1† for the fresh hematite sample and in Table SI2† for the aged hematite sample). For comparison, the structural coordinates of the bulk terminated hematite structure are given in Table SI3.† Ball and stick representations of the best fit structures for both surfaces are shown in Fig. 4 and 5. The z-offsets between the two domains in the structural pictures are artificial (only for illustration). The patchwise distribution is probably real, but the dimensions of the patches cannot be quantified from the CTR-data. The fact that only coherent addition of the contributions from the two terminations yield reasonable fits to the data, points, however, towards a small scale mixing of the domains. Interestingly, AFM images of the fresh surface (to be discussed below) support the patchwise structure and even a recent theoretical study suggests that the patchwise organisation is energetically favourable.81
 | ||
| Fig. 4 Best fit structural model for the surface of the fresh hematite sample (oxygen: red, iron: blue). Indicated are the domain and layer nomenclature as used in Table SI1.† | ||
 | ||
| Fig. 5 Best fit structural model for the surface of the aged hematite sample (oxygen: red, iron: blue). Indicated are the domain and layer nomenclature as used in Table SI2.† | ||
From Fig. 4 and 5, it is clear that the contribution of domain 2 has decreased upon aging. Furthermore, the distances between the top oxygen atoms and the first iron layer on domain 2 is dramatically different. Finally on the aged sample a water layer is found, which in the sketch is shown over domain 2 for illustrative purposes only, since such information cannot be obtained from the CTR model. The occupancy in the water layer is relatively low (∼20% of a mono layer), suggesting stronger ordering than for the fresh sample, but clearly not the very strong ordering found on other cuts of hematite.29
Table 1 shows a compilation of the structure relaxations observed at the hematite (001)–water interface in this and in previous CTR61,62 and X-ray reflectivity29 studies. DFT results by Trainor et al.62 are listed for comparison.
| Layer | Bulk–interlayer distance | This study – CTR aged hematite | Trainor62-CTR | Trainor62-DFT | Catalano29-XR | Tanwar61-CTR unreacted sample | This study CTR fresh hematite |
|---|---|---|---|---|---|---|---|
| Panel 1: O 3 –Fe–Fe–R termination | |||||||
| Domain abundance | 68% | 62% | — | 100% | 54% | 44% | |
| 1O3–2Fe | 0.844 | 16 | 23 | 35 | 34 | 1 | 5 |
| 2Fe–3Fe | 0.604 | −28 | −48 | −41 | −17 | −18 | −67 |
| 3Fe–4O3 | 0.844 | −1 | 13 | 12 | 7 | 4 | 31 |
| 4O3–5Fe | 0.844 | −3 | 2 | 2 | 1 | 1 | 8 |
| 5Fe–6Fe | 0.604 | −12 | −6 | 6 | −22 | 0 | −35 |
| 6Fe–7O3 | 0.844 | 9 | 5 | −4 | 7 | 3 | 19 |
| 7O3–8Fe | 0.844 | 2 | 0 | 0 | 7 | −1 | −3 |
| 8Fe–9Fe | 0.604 | 0 | −6 | 0 | 0 | ||
| 9Fe–10O3 | 0.844 | 0 | 1 | −1 | 0 | ||
![[thin space (1/6-em)]](https://www.rsc.org/images/entities/char_2009.gif) |
|||||||
| Panel 2: O 3 –Fe–O 3 –R termination | |||||||
| Domain abundance | 32% | 38% | — | 0% | 46% | 56% | |
| 1O3–3Fe | 1.448 | −38 | −24 | −28 | — | 2 | 20 |
| 3Fe–4O3 | 0.844 | 58 | 19 | 20 | — | 1 | 14 |
| 4O3–5Fe | 0.844 | 26 | 24 | 26 | — | 1 | −11 |
| 5Fe–6Fe | 0.604 | −38 | −48 | −69 | — | −18 | −23 |
| 6Fe–7O3 | 0.844 | −7 | 12 | 15 | — | 4 | 10 |
| 7O3–8Fe | 0.844 | 7 | 0 | 0 | — | 1 | −3 |
| 8Fe–9Fe | 0.604 | 4 | — | 0 | −4 | ||
| 9Fe–10O3 | 0.844 | −6 | — | 3 | 2 | ||
From a qualitative comparison some remarkable similarities exist. For the O3–Fe–Fe–R termination (domain 1) the topmost oxygen layer relaxes away from the underlying iron layer (1O3–2Fe). The two iron layers 2Fe and 3Fe contract. This contraction extends in most experimental observations (except Tanwar et al.61) to the iron layers underneath (5Fe–6Fe). The iron layers are marked in boldface in Table 1. The Fe–Fe contraction also emerges for the 5Fe and 6Fe layers in the O3–Fe–O3–R termination. For the O3–Fe–O3–R termination two different trends concerning the relaxations of the topmost layers occur. For the aged hematite in this study, the annealed hematite by Trainor et al.,62 and in nice agreement with DFT results by Trainor et al.,62 the top oxygen layer (1 O) contracts towards the 3Fe layer, while the 3Fe–4O3 and 4O3–5Fe layers expand.
Deviating from this trend, the structure reported by Tanwar et al.61 seems to be an intermediate case, while for the fresh hematite sample in the present study we observe an opposite relaxation of 1O3 away from 3Fe.
Based on the CTR results in this study an explanation for the relaxation of 1O3 away from 3Fe on the fresh hematite sample, might be a significantly weaker hydration of the surface of the fresh hematite sample compared to the hydration of the aged hematite sample. The surface hydration of the two samples is best compared by regarding the electron density distribution of the surface structures projected onto the surface normal (Fig. 6).
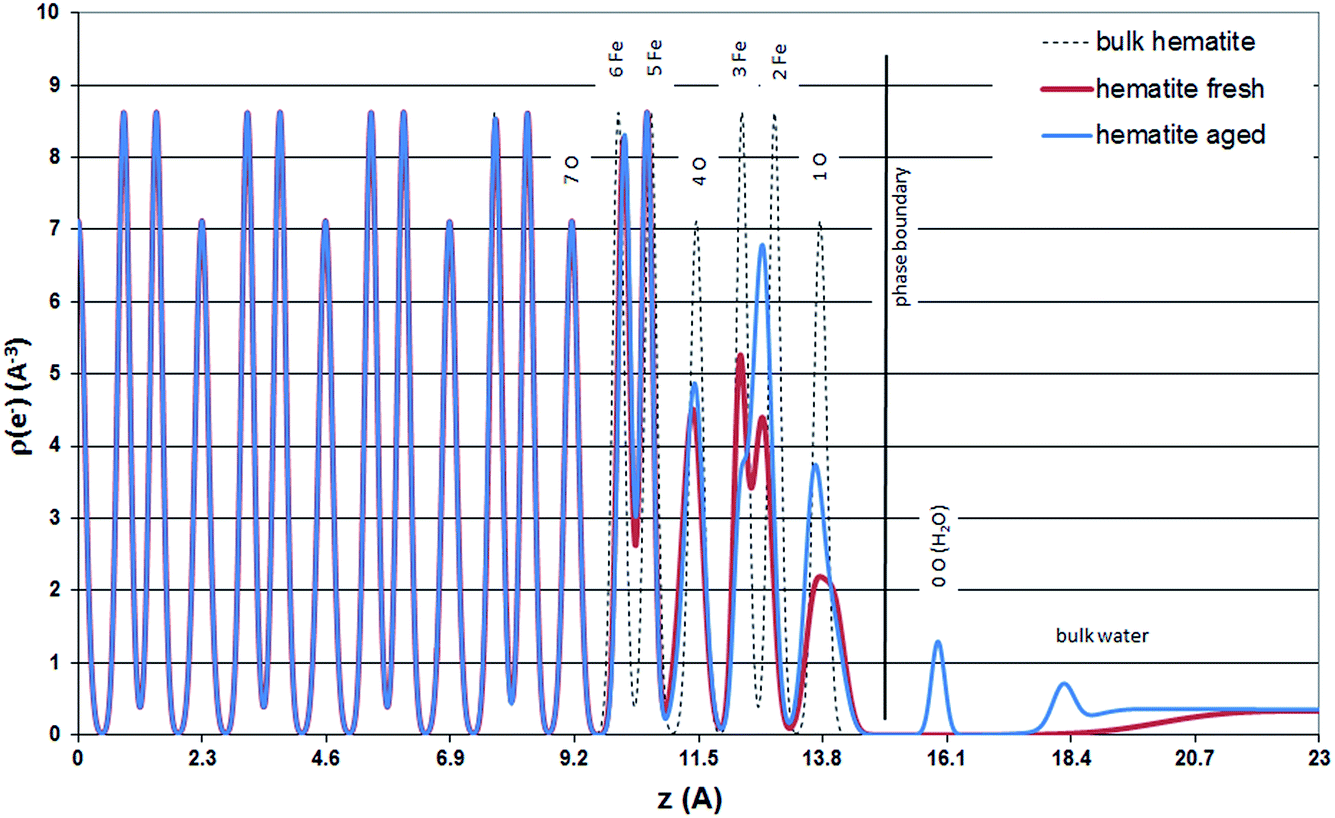 | ||
| Fig. 6 Electron density distribution according to the hematite (001) surface structures of bulk hematite (dashed line), the fresh hematite sample (thick red line), and the aged hematite sample (blue line), projected onto the surface normal. The origin marks the arbitrary transition between undisturbed bulk and surface structures. The thick black line labeled “phase boundary” is placed between the terminating oxygen atoms (O2−, OH−, or H2O) and the adsorbed water. It is no more than a guide to the eye, since the position is somewhat arbitrary. | ||
For the aged hematite sample Fig. 6 shows a peak for the partially occupied adsorbed water layer (∼20% of a monolayer) at z = 16 Å and a relatively well structured first bulk water layer (z (water) = 18.25 Å, U0 = 0.039 Å2). The interlayer distance between consecutive bulk water layers is, however, small (d (water) = 0.81 Å) and the increase in the vibrational distribution from layer to layer is relatively large, Ū = 0.45 Å2, indicating that bulk water layers beyond the first layer are not structurally resolved. The bulk water model used here is identical to the one presented by Fenter and Sturchio (2004).14
For the fresh hematite sample good fits to the data could only be obtained without considering distinct adsorbed water molecules. The bulk water profile included in the best fit model is unstructured. Furthermore, it is so far above the surface that it may not be physically reasonable. The improvement of the model fit by including bulk water into the model is hardly visible on the plots. However, it has a numerically significant effect and improves the goodness of fit from χ2 = 4.29 (p = 37) to χ2 = 3.97 (p = 41). Best fit bulk water parameters are: z (water) = 20.62 Å, U0 = 1.3 Å2, d (water) = 1 Å, and Ū = 0.4 Å2.
Comparison of the relative abundance of the two reported surface domains (reported in Table 1) reveals an interesting trend. Upon chemical mechanical polishing the abundance of the two domains is similar (44/56: fresh hematite in this study, 54/46: unreacted hematite in Tanwar et al.61). Prolonged aging in aqueous solution (aged hematite, this study) as well as mild annealing [8 times 30 min at 600 °C (ref. 62)] favors the formation of the O3–Fe–Fe–R termination. Only upon extensive annealing (12 h at 1100 °C) a fully O3–Fe–Fe–R terminated hematite was inferred.29 This agrees with the stability trends reported by Trainor et al.62 based on DFT calculations. These indicate that the O3–Fe–Fe–R termination is more stable than O3–Fe–O3–R at elevated temperatures in dry environments e.g. during annealing. Furthermore, the stability of the O3–Fe–Fe–R termination is slightly favorable compared to O3–Fe–O3–R at room temperature in aqueous environments. This agrees well with the observed evolution of the surface termination of hematite from 44% O3–Fe–Fe–R on fresh hematite to 68% O3–Fe–Fe–R on the aged hematite sample.
The evaluation of the surface diffraction data does not include hydrogen atoms. However, the surface is expected to be rapidly hydroxylated.66 Cutting the surface during its manufacturing will result in some termination exposing iron and/or oxygen. To include hydrogen atoms and the concomitant role of interfacial water, we used a bond valence analysis based on the CTR results. The bond valence analyses of the fresh and aged surfaces show some differences. The bond valence for the various doubly coordinated oxygen atoms differs by no more than about 0.2 valence units, i.e. there is no significant difference. The undersaturation of the doubly coordinated oxygens is about one valence unit and addition of one proton would satisfy the oxygen valence for both fresh and aged hematite. This supports the view that these oxygen atoms are neither protonated nor deprotonated at the conditions of the CTR measurements. However, concerning the singly coordinated oxygen atoms, the fresh hematite sample exhibits an undersaturation by 1.75 valence units. The simplest way to reduce this deficit is to assume that the group is doubly protonated and has originated from adsorption of a water molecule at the iron termination.66 This would result in a stable, aquo-group terminated configuration and might remain non-reactive (as is concluded later to explain the zeta-potential data). In turn, on the aged sample the undersaturation of the singly coordinated oxygen is about 1.45 valence units. In that case two adsorbed protons would not allow a stable configuration. A more likely explanation is therefore interaction with water to yield a hydroxyl group and involve hydrogen bonding between neighboring hydroxyl groups or with adjacent water molecules. This would explain the presence of structured water on the aged surface.
Surface complexation modelling
For the following it has to be mentioned that CTR data have not been collected at various pH conditions or even in the presence of salt. Also the amount of water in our study is much lower than in the work by Catalano.29 A future comprehensive study should cover such aspects in order to test some of the model assumptions that are used in the following.Fresh hematite (001)
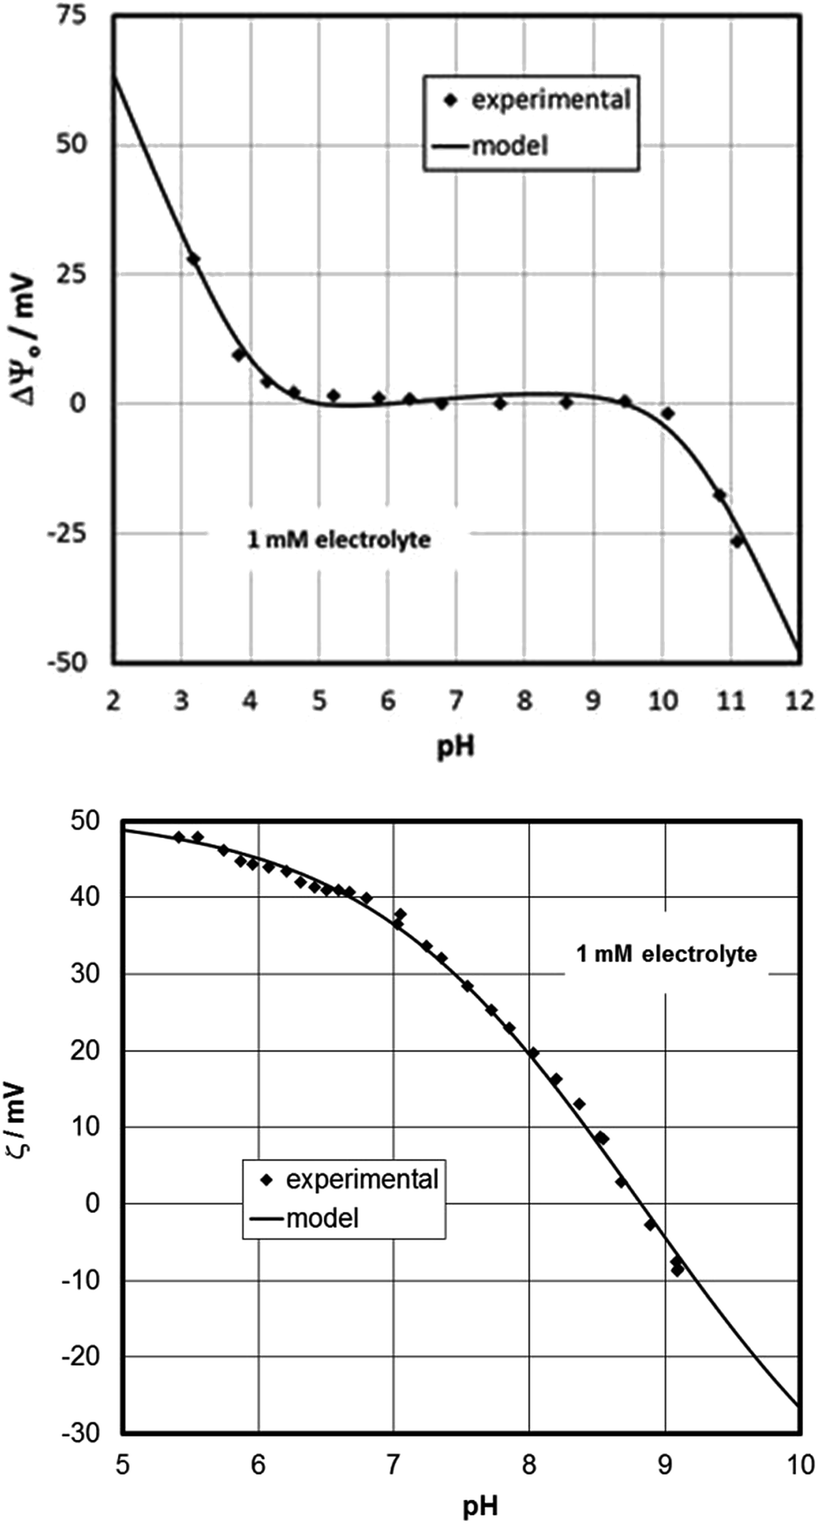
Fig. 7 shows the surface- and zeta-potentials of the fresh sample. The surface potential exhibits the broad flat response in the mid pH-range that is believed to be due to the pK values of the doubly coordinated hydroxyl groups as discussed above. The point of zero charge of the sample would therefore be at pH about 6.5, close to the value reported for sapphire (001) based on sum frequency generation data.30 The surface-potential curves appear to exhibit an ionic strength influence similar to observations by Boily et al.67 The zeta-potentials in turn exhibit an IEP at about pH 4, which appears to decrease with decreasing sodium content. The dual charging mechanism therefore needs to be involved to explain the data that have been obtained on identical samples.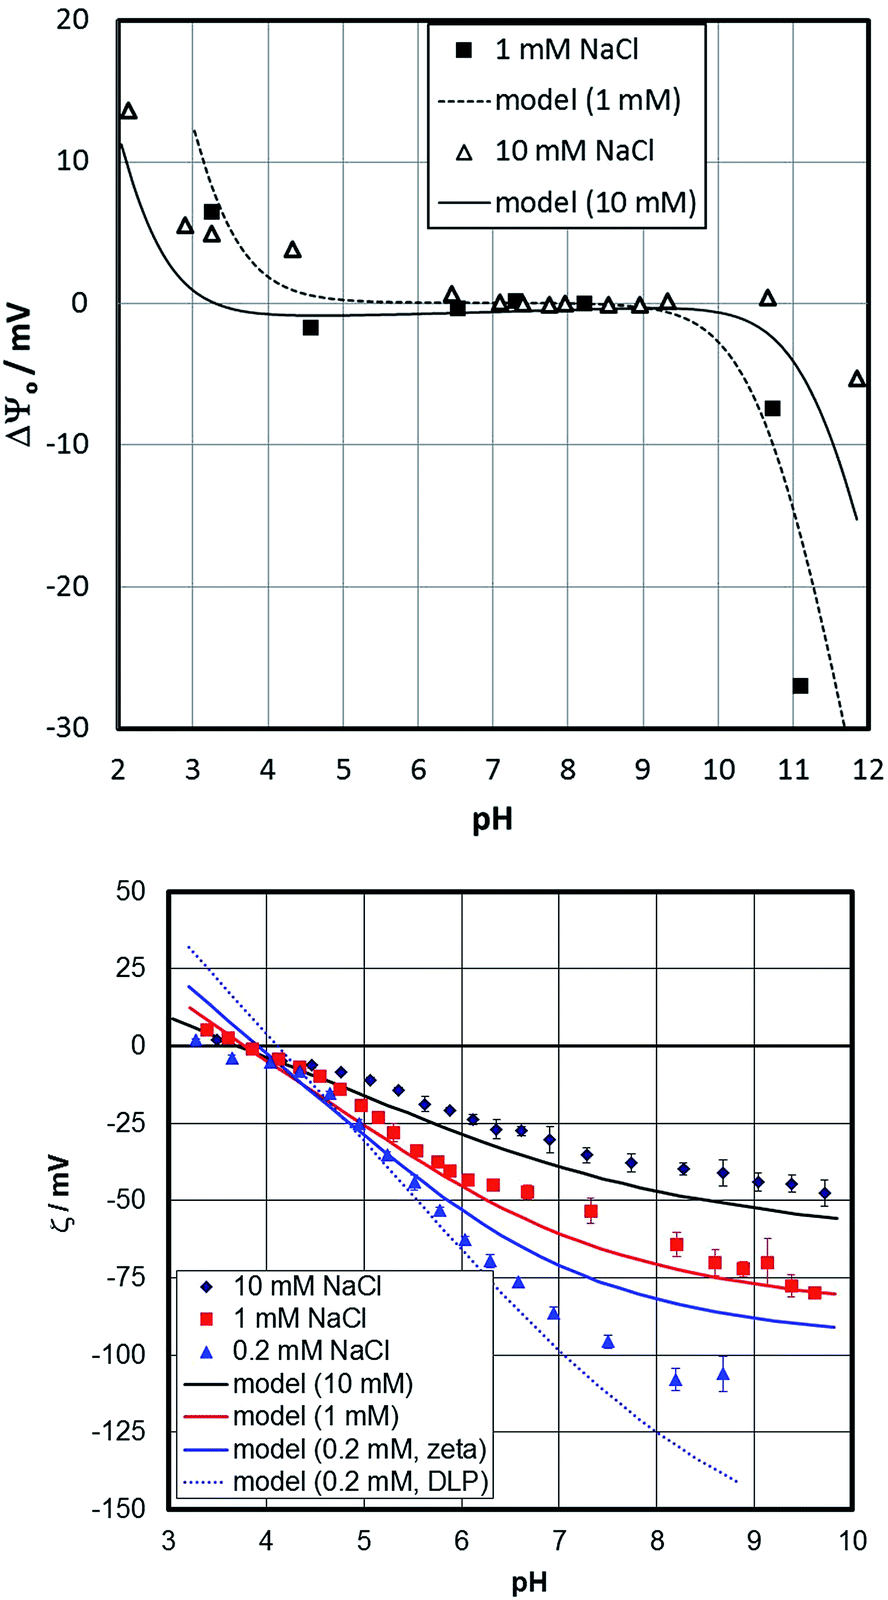 | ||
| Fig. 7 Surface (top)- and zeta (bottom)-potentials for the fresh hematite (001) sample. Symbols are experimental data and lines are calculated by the proposed surface complexation model. In the lower graph, two model lines are plotted for the 0.2 mM NaCl data. The one noted “zeta” points to the model-inherent slip plane distance, while the one noted “DLP” pertains to the potential at the onset of the diffuse layer. | ||
Based on the CTR data, the iron-terminated surface is dominant on the fresh sample. Fig. 3 shows schematically the presence of two domains. These are not separated by large distances. High resolution AFM (Fig. 8) indicates that the surface should rather be imagined as a mix of small 10 to 30 nm patches of the two domains. The CTR data do not show significant water structuring. This could explain behavior similar to hydrophobic/inert surfaces. This agrees with previous studies by Catalano who found weak water ordering on hematite (001).29 Catalano involved bulk water above the surface studied in his work so that his results cannot be directly compared to our study, but in a qualitative way between the fresh and the aged sample the fresh sample surface clearly exhibits weaker water structuring.
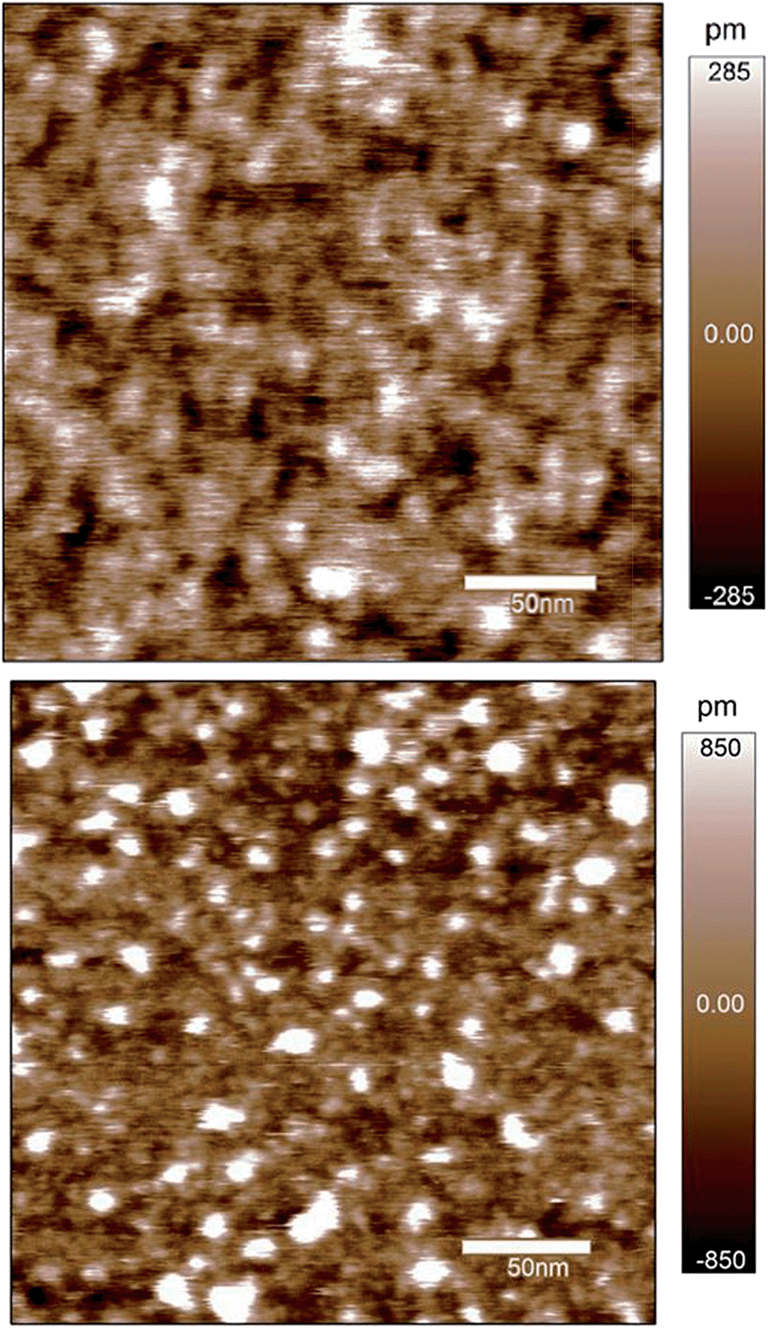 | ||
| Fig. 8 High resolution AFM image of the fresh sample in air (top) and in water (bottom). | ||
In contrast to the macroscopic data, there is no salt present in the CTR study. Since the measurement, new evidence has appeared that related faces (the gibbsite basal plane) cause adsorption and layering of background electrolyte ions in CaCl2-solutions at pH 6.82 This was clearly shown by both AFM force curves and their interpretation in terms or electrostatic potentials and direct imaging for a 2:1 electrolyte. Even with increasing KCl and NaCl an increasing positive potential was reported for the gibbsite basal plane. Our own, unpublished surface potential data for sapphire (001) support the adsorption of KCl. At a constant pH of about 6 the surface potential increases with increasing KCl concentration. Finally, the presence of salt hydrates has been previously postulated based on XPS studies on hematite particles, wherein particularly with increasing contributions from basal planes an enhanced presence of salt hydrates was reported.83 Based on the above, our present model approach for the fresh surface includes the following features:
– protonation/deprotonation of the surface hydroxyls (based on MUSIC type calculations52,54) to account for the conventional picture of oxide–aqueous solution interfaces (no attempt was made to relate pK values directly to the CTR results, the values are in the expected and previously reported range)
– adsorption of NaCl within the Stern plane to account for the experimental evidence on this phenomenon at gibbsite basal planes and hematite particles
– adsorption of protons and hydroxide ions beyond the NaCl plane to account for the pH dependence of the zeta-potential and the observed isoelectric point that is typically found for inert surfaces
– singly coordinated groups are assumed to be inert due to weak interaction with water as inferred from the CTR data.
A sketch of the interfacial model is given in the ESI (Fig. SI1†) and the model parameters are given in Table SI4.† Interestingly, simple versions of the model, including only one or two of the above mechanisms failed to reproduce the experimental data.
Lines in Fig. 7 show the fit to the surface- and zeta-potential based on the model described above. The surface potential is well described and the inclusion of the salt interactions allow shifts in the surface potential curves with salt content to be described. The traditional picture does not involve a significant effect of background electrolytes on the surface potential56,57 and conventional surface complexation models agree with this.57
The surface potential cannot be measured on an absolute scale and is therefore plotted as the difference (ΔΨ0) to an arbitrary reference potential. The model inherent surface potential is affected by the salt level assuming adsorption of NaCl within the Stern plane. Diffuse layer potential data on gibbsite (positive in the absence of salt) show that addition of NaCl or KCl increases the potential.82 Macroscopic data on gibbsite have been interpreted by adsorption of sodium and chloride on the basal plane, involving (unlike our model) protons.84 Spectroscopic data for gibbsite agrees with the adsorption of both sodium and chloride at low pH.85 Even for hematite particles, such evidence has been presented.83 The relative change of the surface potential as a function of pH is well described by the model. For the zeta-potential, the slip-plane separation is the most important parameter involved. The good description of the zeta-potentials is to a large extent due to its adjustment. At the lowest salt content, the experimental data at high pH are between the potential with the assumed slip-plane separation (full line) and the one at the onset of the diffuse layer (dashed line). We involve a slip plane distance parameter that is related to the ionic strength (see ESI† for more detailed information). An individual adjustment of the slip plane distance would yield an even better fit to the data.
Whatever option is chosen, the model is in the correct range of potentials. At low pH, at the smallest salt content, the misfit between experimental and simulated zeta-potentials is largest. Under these conditions the ionic strength is not constant, since the addition of acid starts affecting the overall value. Therefore, we have carried out calculations with the correct concentrations of all components. This shifts the model for nominal 0.2 mM concentrations towards the one for 1 mM thereby decreasing the misfit; while the shift of the IEP is not reproduced. Overall, the results warrant additional CTR-investigations in the presence of NaCl.
High resolution AFM does not show clear terraces on the fresh sample surface in air. However, the root mean square roughness is estimated to be 1.2 Å under these conditions (Fig. 8, top), comparable to the result from the CTR-study (1.1 Å), i.e. very low. The various small areas/patches might correspond to the two domains that are discussed in the context of the CTR-data. Addition of water increases the roughness to between 3.9 and 4.4 Å, addition of 1 mM KCl solution further increases it to 5 to 7 Å. The addition of aqueous solutions at pH about 6 thus has a significant effect on the roughness (Fig. 8, bottom) but this effect has not been observed in our CTR experiments. For resolution of hydration water layers86 or adsorbed ions or ion layers our sample is probably too rough. However, we believe that sufficient circumstantial evidence82–84 exists by now that salt layers are present in related, as well as in very different systems. Correspondingly, the assumption of salt in the Stern layer on hematite (001) is considered reasonable.
Force curves with a negative tip probe at pH 6 (not shown) were always repulsive in water and 1 mM KCl supporting the zeta-potential measurements for the fresh sample. Additional measurements in 1 mM HCl also produced repulsive interactions, in line with the shift of the IEP that occurs with decreasing sodium concentration (Fig. 7). In 1 mM HCl potassium/sodium ions are absent and cannot contribute to the charging of the surface so that a “salt” layer cannot form.
Our surface complexation model does not need to resort to iron-surface species similar to acidic groups invoked for sapphire (001) to explain the low isoelectric point.55 We rely on the CTR-data in this respect and our model is able to describe the system very well on that basis. We note that many parameters are involved, but most of them have been taken from associated systems (such as hydroxide adsorption on inert surfaces or expected protonation/deprotonation constants of the surface hydroxyls).
Aged hematite (001)
Based on the CTR data, the oxygen-terminated surface (O3–Fe–Fe–R) is dominant on the aged sample. This supports a previous study where an annealed sample had been left to age and developed a surface potential response that was interpreted in terms of oxygen-termination.70 The measured surface potentials of the present sample indeed show the same response (for both fresh and aged states), while the zeta-potentials evolve with time (Fig. 2). The IEP of the aged sample is at about pH 9 at the steady state condition, which is similar to that measured on particles.87 Compared to the data for the fresh sample, the CTR data for the aged sample show adsorbed water molecules and the presence of a water film. This might suggest that the surface rearrangement is related to an increasingly pronounced interaction with water. In this interpretation the singly-coordinated hydroxyl groups would interact more strongly with the interfacial water and would be able to affect the electrokinetic potentials substantially. Surprisingly, the experimental data suggest that these reactive groups do not contribute to the measured surface potential. In a model the singly-coordinated groups could be treated as adsorbates.65 This would be in line with a previous study on sapphire (001),88 where the intentional addition of dissolved aluminum caused a strong shift of the isoelectric point, similar to the present case. The action of the water can be held responsible for the difference between the fresh and aged samples. Another issue could be how the ad-atoms are distributed over the full surface. But this cannot be inferred from our data. No high resolution AFM images are available for the aged samples.The results in Fig. 9 show that the proposed model is capable of describing the surface (Fig. 9, top) and zeta (Fig. 9, bottom)-potentials in an excellent way.
 | ||
| Fig. 9 Surface (top) and zeta (bottom)-potential for the aged hematite-sample, and model based on the concept and parameters given in ESI.† | ||
The data for the aged hematite provide the first experimental observation via streaming potential measurements of an IEP around 9 for a flat oxide surface that would be expected based on the available data for particles that are established with far more popular methods, such as electrophoresis or accoustophoresis. The low IEPs previously reported for many oxide single crystals79,80 have raised suspicion,89 since they do not obey “surface chemistry” in terms of the MUSIC model and because they are rather generic similar to hydrophobic/inert surfaces. It is interesting to note that the model for the aged hematite (001) surface produces the slight increase of the surface potential with increasing pH within the plateau region, which has been observed previously,71 and which so far lacked an explanation.
Summary of the surface complexation models
Despite the surface characterization of the two samples, a substantial number of assumptions is involved in the model design. The following points address weak aspects of our modelling:– The assumption about the reactivity of the singly coordinated groups is ultimately linked to the outcome of the zeta-potential measurements. In particular on the fresh surface inclusion of the singly coordinated groups would not allow a low isoelectric point to be modelled. The main argument is the lack of water interaction in the sense that a strongly ordered water film is not observed.
– The salt layering is unconventional in the sense that it does not involve proton co-adsorption (for chloride adsorption) or proton release (for sodium adsorption) unlike the model proposed by Rosenqvist et al.84
– The major parameter for describing the zeta-potential is the slip-plane separation. We currently have to consider it as a pure fitting parameter, but we expect that in future with the advent of new techniques and enhanced computational power this parameter can be eliminated.
On the other hand, the model is quite successful in describing experimental results.
– Our model results offer for the first time an explanation for an observation previously reported by Chatman et al.68,71 which was not discussed in detail at the time. The relatively small increase of measured surface potential with increasing pH within the plateau region is at odds with all the expectations for common oxide–water interface models. Apparently the model designed here for the aged hematite (001) (Fig. 9, top panel) is able to cover this behavior. Actually, the increase of surface potential with increasing pH reported by Chatman et al.71 could be seen as independent support for our model concept.
– The model also has the potential to describe the experimentally observed off-set of the protonation/deprotonation with variable salt content.67 Usually a surface complexation would treat such experimental observations with one consistent set of parameters (extrapolated to infinite dilution). However, in the cited case it was necessary to apply different pK values for the data measured at the different salt contents.
Conclusions
The present study investigates transient changes at the hematite (001) surface upon aging in aqueous solutions. We observe changes with time in the zeta-potential and the surface diffraction data, while the surface potential response remains unaffected by the structural changes. AFM investigations show that the presence of water and electrolyte solutions affects the surface roughness of our sample. The initially very smooth surface becomes rougher in the presence of water. The surface diffraction data suggest that the fresh surface is not well hydrated. In particular the singly coordinated groups appear neither to affect the surface potential–pH response nor to influence the zeta-potentials of the fresh surface. A bond-valence analysis of the surface diffraction data supports the lack of hydration in that these aquo-groups are well satisfied in terms of bond valence. With time these reactive groups become more reactive, probably due to a change in bond distances that triggers or is triggered by interactions with water. In the case of the fresh hematite, the adjacent water layer, which is expected to be weakly structured similar to the one on hydrophobic surfaces, dominates the observed zeta-potentials via preferential hydroxide adsorption in that layer. The inner layer becomes affected by protonation (low pH) and deprotonation (high pH) of the doubly coordinated groups, and salt ion adsorption, which allows explanation of the measured surface potentials, while the singly coordinated groups remain inactive, similar to previous suggestions.82,83The surface diffraction data for the aged surface show distinct water adsorption. Consequently, the model for the aged surface involves both groups and the action of the singly-coordinated groups explains the high IEP observed. Salt ion adsorption and doubly coordinated surface groups account for the surface potential response, which remains unchanged upon aging. The parameters used in the models are in the range expected based on previous investigations on related systems.
Acknowledgements
CTR measurements were performed at GeoSoilEnviroCARS (Sector 13), Advanced Photon Source (APS), Argonne National Laboratory. GeoSoilEnviroCARS is supported by the National Science Foundation – Earth Sciences (EAR-1128799) and Department of Energy-GeoSciences (DE-FG02-94ER14466). This research used resources of the Advanced Photon Source, a U.S. Department of Energy (DOE) Office of Science User Facility operated for the DOE Office of Science by Argonne National Laboratory under Contract no. DE-AC02-06CH11357. During the proof-reading period of this article, one of the co-authors, Prof. Nikola Kallay, passed away unexpectedly to us all. We dedicate this paper to him.Notes and references
- C. Bataillon, F. Bouchon, C. Chainais-Hillairet, C. Desgranges, E. Hoarau, F. Martin, S. Perrin, M. Tupin and J. Talandier, Electrochim. Acta, 2010, 55, 4451–4467 CrossRef CAS PubMed.
- M. Finšgar and J. Jackson, Corros. Sci., 2014, 86, 17–41 CrossRef PubMed.
- F. F. Eliyan and A. Alfantazi, Corrosion, 2014, 70, 880–898 CrossRef PubMed.
- J. Brunelle, Pure Appl. Chem., 1978, 50, 1211–1229 CrossRef CAS.
- J. A. Schwarz, C. Contescu and A. Contescu, Chem. Rev., 1995, 95, 477–510 CrossRef CAS.
- T. Mang, B. Breitscheidel, P. Polanek and H. Knozinger, Appl. Catal., A, 1993, 106, 239–258 CrossRef CAS.
- W. Stumm, Colloids Surf., A, 1997, 120, 143–166 CrossRef CAS.
- T. Hiemstra, Langmuir, 2012, 28, 15614–15623 CrossRef CAS PubMed.
- Z. Zhang, P. Fenter, L. Cheng, N. C. Sturchio, M. J. Bedzyk, M. Predota, A. Bandura, J. D. Kubicki, S. N. Lvov, P. T. Cummings, A. A. Chialvo, M. K. Ridley, P. Benezeth, L. Anovitz, D. A. Palmer, M. L. Machesky and D. J. Wesolowski, Langmuir, 2004, 20, 4954–4969 CrossRef CAS.
- G. E. Schaumann, A. Philippe, M. Bundschuh, G. Metreveli, S. Klitzke, D. Rakcheev, A. Grün, S. K. Kumahor, M. Kühn, T. Baumann, F. Lang, W. Manz, R. Schulz and H.-J. Vogel, Sci. Total Environ., 2015 DOI:10.1016/j.scitotenv.2014.10.035.
- A. Massarsky, V. L. Trudeau and T. W. Moon, Environ. Toxicol. Pharmacol., 2014, 38, 861–873 CrossRef CAS PubMed.
- S. Wagner, A. Gondikas, E. Neubauer, T. Hofmann and F. von der Kammer, Angew. Chem., Int. Ed., 2014, 53, 12398–12419 CAS.
- J. A. Davis and K. F. Hayes, Geochemical processes at mineral surfaces, American Chemical Society, Washington, DC, 1986 Search PubMed.
- P. Fenter and N. C. Sturchio, Prog. Surf. Sci., 2004, 77, 171–258 CrossRef CAS PubMed.
- A. F. White and S. L. Brantley, Chemical Weathering Rates of Silicate Minerals, 1995, vol. 31, pp. 1–22 Search PubMed.
- J. Bachmann and R. R. van der Ploeg, J. Plant Nutr. Soil Sci., 2002, 165, 468 CrossRef CAS.
- H. B. Bradl, J. Colloid Interface Sci., 2004, 277, 1–18 CrossRef CAS PubMed.
- G. Sposito, The chemistry of soils, Oxford University Press, 2008 Search PubMed.
- C. E. Weaver and L. D. Pollard, The chemistry of clay minerals, Elsevier, 2011 Search PubMed.
- S. L. Swartzen-Allen and E. Matijevic, Chem. Rev., 1974, 74, 385–400 CrossRef CAS.
- G. Lagaly and S. Ziesmer, Adv. Colloid Interface Sci., 2003, 100–102, 105–128 CrossRef CAS.
- J. Tolls, Environ. Sci. Technol., 2001, 35, 3397–3406 CrossRef CAS.
- W. Stumm and J. J. Morgan, Aquatic chemistry: chemical equilibria and rates in natural waters, John Wiley & Sons, 2012 Search PubMed.
- R. P. Schwarzenbach, P. M. Gschwend and D. M. Imboden, Environmental organic chemistry, John Wiley & Sons, 2005 Search PubMed.
- Y. Wang, Chem. Geol., 2014, 378–379, 1–23 CrossRef CAS PubMed.
- D. Langmuir, P. Hall and J. Drever, Environmental Geochemistry, Prentice Hall, New Jersey, 1997 Search PubMed.
- Z. Navrátilová and P. Kula, Electroanalysis, 2003, 15, 837–846 CrossRef PubMed.
- L. Charlet and A. Manceau, Int. J. Environ. Anal. Chem., 1992, 46, 97–108 CrossRef CAS.
- J. G. Catalano, Geochim. Cosmochim. Acta, 2011, 75, 2062–2071 CrossRef CAS PubMed.
- L. Zhang, C. Tian, G. A. Waychunas and Y. R. Shen, J. Am. Chem. Soc., 2008, 130, 7686–7694 CrossRef CAS PubMed.
- M. Sulpizi, M. Salanne, M. Sprik and M. P. Gaigeot, J. Phys. Chem. Lett., 2013, 4, 83–87 CrossRef CAS.
- J. Luetzenkirchen, R. Zimmermann, T. Preocanin, A. Filby, T. Kupcik, D. Kuettner, A. Abdelmonem, D. Schild, T. Rabung, M. Plaschke, F. Brandenstein, C. Werner and H. Geckeis, Adv. Colloid Interface Sci., 2010, 157, 61–74 CrossRef CAS PubMed.
- J. K. Beattie, A. M. Djerdjev, A. Gray-Weale, N. Kallay, J. Luetzenkirchen, T. Preocanin and A. Selmani, J. Colloid Interface Sci., 2014, 422, 54–57 CrossRef CAS PubMed.
- P. Creux, J. Lachaise, A. Graciaa, J. K. Beattie and A. M. Djerdjev, J. Phys. Chem. B, 2009, 113, 14146–14150 CrossRef CAS PubMed.
- R. Zimmermann, N. Rein and C. Werner, Phys. Chem. Chem. Phys., 2009, 11, 4360–4364 RSC.
- M. Corti, M. Bonomo and A. Raudino, Langmuir, 2012, 28, 6060–6066 CrossRef CAS PubMed.
- V. Kuznetsov and G. Papastavrou, J. Phys. Chem. C, 2014, 118, 2673–2685 CAS.
- T. Cecchi, J. Phys. Chem. C, 2013, 117, 25579–25585 CAS.
- P. Jungwirth, Faraday Discuss., 2009, 141, 9–30 RSC.
- V. L. Shapovalov, H. Mohwald, O. V. Konovalov and V. Knecht, Phys. Chem. Chem. Phys., 2013, 15, 13991–13998 RSC.
- B. Winter, M. Faubel, R. Vácha and P. Jungwirth, Chem. Phys. Lett., 2009, 474, 241–247 CrossRef CAS PubMed.
- J.-S. Samson, R. Scheu, N. Smolentsev, S. W. Rick and S. Roke, Chem. Phys. Lett., 2014, 615, 124–131 CrossRef CAS PubMed.
- J. Luetzenkirchen, T. Preocanin and N. Kallay, Phys. Chem. Chem. Phys., 2008, 10, 4946–4955 RSC.
- R. Zimmermann, U. Freudenberg, R. Schweiss, D. Kuettner and C. Werner, Curr. Opin. Colloid Interface Sci., 2010, 15, 196–202 CrossRef CAS PubMed.
- T. W. Healy and D. W. Fuerstenau, J. Colloid Interface Sci., 2007, 309, 183–188 CrossRef CAS PubMed.
- N. Kallay and D. Cakara, J. Colloid Interface Sci., 2000, 232, 81–85 CrossRef CAS PubMed.
- N. Kallay, A. Cop, E. Chibowski and L. Holysz, J. Colloid Interface Sci., 2003, 259, 89–96 CrossRef CAS.
- M. Takahashi, J. Phys. Chem. B, 2005, 109, 21858–21864 CrossRef CAS PubMed.
- T. Hiemstra, J. C. M. Dewit and W. H. Vanriemsdijk, J. Colloid Interface Sci., 1989, 133, 105–117 CrossRef CAS.
- T. Hiemstra, W. H. Vanriemsdijk and G. H. Bolt, J. Colloid Interface Sci., 1989, 133, 91–104 CrossRef CAS.
- T. Hiemstra, P. Venema and W. H. VanRiemsdijk, J. Colloid Interface Sci., 1996, 184, 680–692 CrossRef CAS.
- P. Venema, T. Hiemstra, P. G. Weidler and W. H. van Riemsdijk, J. Colloid Interface Sci., 1998, 198, 282–295 CrossRef CAS.
- J. P. Fitts, X. M. Shang, G. W. Flynn, T. F. Heinz and K. B. Eisenthal, J. Phys. Chem. B, 2005, 109, 7981–7986 CrossRef CAS PubMed.
- T. Hiemstra and W. H. Van Riemsdijk, Langmuir, 1999, 15, 8045–8051 CrossRef CAS.
- D. Yang, M. Krasowska, R. Sedev and J. Ralston, Phys. Chem. Chem. Phys., 2010, 12, 13724–13729 RSC.
- N. Kallay, T. Preocanin, F. Supljika, J. Luetzenkirchen and M. Lovkovic, J. Colloid Interface Sci., 2012, 375, 167–171 CrossRef CAS PubMed.
- A. Selmani, J. Luetzenkirchen, N. Kallay and T. Preocanin, J. Phys.: Condens. Matter, 2014, 26(24), 244104 CrossRef PubMed.
- R. Vácha, R. Zangi, J. Engberts and P. Jungwirth, J. Phys. Chem. C, 2008, 112, 7689–7692 Search PubMed.
- J. Luetzenkirchen, Langmuir, 2013, 29, 7726–7734 CrossRef CAS PubMed.
- A. G. Stack, S. R. Higgins and C. M. Eggleston, Geochim. Cosmochim. Acta, 2001, 65, 3055–3063 CrossRef CAS.
- K. S. Tanwar, S. C. Petitto, S. K. Ghose, P. J. Eng and T. P. Trainor, Geochim. Cosmochim. Acta, 2009, 73, 4346–4365 CrossRef CAS PubMed.
- T. P. Trainor, A. M. Chaka, P. J. Eng, M. Newville, G. A. Waychunas, J. G. Catalano and G. E. Brown, Surf. Sci., 2004, 573, 204–224 CrossRef CAS PubMed.
- X. G. Wang, W. Weiss, S. K. Shaikhutdinov, M. Ritter, M. Petersen, F. Wagner, R. Schlogl and M. Scheffler, Phys. Rev. Lett., 1998, 81, 1038–1041 CrossRef CAS.
- C. M. Eggleston, A. G. Stack, K. M. Rosso, S. R. Higgins, A. M. Bice, S. W. Boese, R. D. Pribyl and J. J. Nichols, Geochim. Cosmochim. Acta, 2003, 67, 985–1000 CrossRef CAS.
- C. M. Eggleston, A. G. Stack, K. M. Rosso and A. M. Bice, Geochem. Trans., 2004, 5, 33–40 CrossRef CAS.
- P. Liu, T. Kendelewicz, G. E. Brown Jr, E. J. Nelson and S. A. Chambers, Surf. Sci., 1998, 417, 53–65 CrossRef CAS.
- J.-F. Boily, S. Chatman and K. M. Rosso, Geochim. Cosmochim. Acta, 2011, 75, 4113–4124 CrossRef CAS PubMed.
- S. Chatman, P. Zarzycki and K. M. Rosso, Phys. Chem. Chem. Phys., 2013, 15, 13911–13921 RSC.
- N. Kallay and T. Preocanin, J. Colloid Interface Sci., 2008, 318, 290–295 CrossRef CAS PubMed.
- J. Luetzenkirchen, T. Preocanin, F. Stipic, F. Heberling, J. Rosenqvist and N. Kallay, Geochim. Cosmochim. Acta, 2013, 120, 479–486 CrossRef CAS PubMed.
- S. Chatman, P. Zarzycki, T. Preoanin and K. M. Rosso, J. Colloid Interface Sci., 2013, 391, 125–134 CrossRef CAS PubMed.
- M. M. Gentleman and J. A. Ruud, Langmuir, 2010, 26, 1408–1411 CrossRef CAS PubMed.
- E. Anim-Danso, Y. Zhang and A. Dhinojwala, J. Am. Chem. Soc., 2013, 135, 8496–8499 CrossRef CAS PubMed.
- B. M. Cabanas, J. Luetzenkirchen, S. Leclercq, P. Barboux and G. Lefevre, J. Nucl. Mater., 2012, 430, 150–155 CrossRef PubMed.
- S. A. de Vries, P. Goedtkindt, W. J. Huisman, M. J. Zwanenburg, R. Feidenhans'l, S. L. Bennett, D. M. Smilgies, A. Stierle, J. J. De Yoreo, W. J. P. van Enckevort, P. Bennema and E. Vlieg, J. Cryst. Growth, 1999, 205, 202–214 CrossRef CAS.
- I. D. Brown and D. Altermatt, Acta Crystallogr., Sect. B: Struct. Sci., 1985, 41, 244–247 CrossRef.
- R. Zimmermann, S. Dukhin and C. Werner, J. Phys. Chem. B, 2001, 105, 8544–8549 CrossRef CAS.
- G. V. Franks and Y. Gan, J. Am. Ceram. Soc., 2007, 90, 3373–3388 CrossRef CAS PubMed.
- S. Roessler, R. Zimmermann, D. Scharnweber, C. Werner and H. Worch, Colloids Surf., B, 2002, 26, 387–395 CrossRef CAS.
- D. Rothenstein, B. Claasen, B. Omiecienski, P. Lammel and J. Bill, J. Am. Chem. Soc., 2012, 134, 12547–12556 CrossRef CAS PubMed.
- A. Kiejna and T. Pabisiak, J. Phys. Chem. C, 2013, 117, 24339–24344 CAS.
- I. Siretanu, D. Ebeling, M. P. Andersson, S. L. S. Stipp, A. Philipse, M. C. Stuart, D. van den Ende and F. Mugele, Sci. Rep., 2014, 4, 4956 CAS.
- A. Shchukarev, J.-F. Boily and A. R. Felmy, J. Phys. Chem. C, 2007, 111, 18307–18316 CAS.
- J. Rosenqvist, P. Persson and S. Sjöberg, Langmuir, 2002, 18, 4598–4604 CrossRef CAS.
- A. Shchukarev and S. Sjöberg, Surf. Sci., 2005, 584, 106–112 CrossRef CAS PubMed.
- F. Takeshi, Sci. Technol. Adv. Mater., 2010, 11, 033003 CrossRef.
- M. Kosmulski, Chemical Properties of Material Surfaces, CRC Press, 2001 Search PubMed.
- J. Lutzenkirchen, A. Abdelmonem, R. Weerasooriya, F. Heberling, V. Metz and R. Marsac, Geochem. Trans., 2014, 15, 9 CrossRef PubMed.
- E. Mączka, J. Luetzenkirchen and M. Kosmulski, J. Colloid Interface Sci., 2013, 393, 228–233 CrossRef PubMed.
Footnote |
| † Electronic supplementary information (ESI) available: ESI includes details on the surface diffraction model and surface complexation modelling for both fresh and aged hematite-001. See DOI: 10.1039/c4fd00260a |
| This journal is © The Royal Society of Chemistry 2015 |