DOI:
10.1039/C4FD00252K
(Paper)
Faraday Discuss., 2015,
180, 267-282
Initiation and propagation of a single pit on stainless steel using a local probe technique†
Received
8th December 2014
, Accepted 2nd February 2015
First published on 4th February 2015
Abstract
Experiments about single pit initiation and propagation were performed on 316L stainless steel with the aim to determine the pitting corrosion behaviour for nuclear waste containers. The experimental setup permits to control the pit development at will and to create reproducible single pits in three dimensions. Radial and deep evolutions of a disc shaped pit were studied for propagation times of up to 10 hours. These evolutions were used to determine what limiting mechanism takes place during long-term pit propagation. Special attention has been paid to the chloride ion action on pitting. A minimum chloride concentration was found to be necessary in the bulk electrolyte to support pit propagation. The existence of a critical pit depth of 230 μm was also underlined.
1 Introduction
Pitting corrosion is an important issue for the long-term behaviour of nuclear waste containers. Some containers may contain chloride-bearing polymers, which result in the production of chloride hydrogen gas by radiolysis. With the presence of humid zones formed on the inner 316L stainless steel container surface, the HCl gas completely dissolves and may form highly concentrated hydrochloric acid zones. Under these conditions, pits can initiate and propagate.
Pitting corrosion has been widely studied in the last decades on stainless steel,1,2 but since it is a stochastic process, it remains difficult to study experimentally. Indeed adding an aggressive anion, such as chloride ion, to the electrolyte leads to the formation of several pits with different stages of development on the material surface making any pitting analysis very difficult. Many statistical studies have been performed to determine the pitting susceptibility of a material.3–6 These studies focused on the frequencies of pit initiation and pit repassivation on a material surface on which several pits can evolve simultaneously. The main results of this approach concern the probability to get a stable pit that cannot repassivate, the decrease of the pit generation rate with decreasing chloride concentration and the influence of potential on the pitting rates. However, these statistical studies do not permit to highlight the driving forces of pitting corrosion and need to be complemented with mechanistic investigations. In addition, usual electrochemical measurements result in an average value on the electrode surface. Thus, to determine the mechanisms governing pitting corrosion from its initiation to the propagation or its repassivation, it is necessary to be able to work on a single pit.
Many researchers have attempted to create single pits. Different methods have been used: an initial shape was given to the pit on the electrode surface using twin probe techniques,7 one-dimensional shielded wires,8 focus laser illumination,9 or the electrode surface was partially covered to limit the number of pits.10 These methods permit to study the early stage of pitting corrosion. However, they have some disadvantages. First of all, the methods are not entirely reproducible from one experiment to the other. In some case these methods also damage the material surface. Also they cannot be used to study long-term pit growth. Depth evolution was studied in the literature with a lead-in-pencil electrode.11–14 It consisted of a wire, the diameter of which varies from 10 to 50 μm. This technique has the advantages to easily create single pits (such pits are called ‘artificial pits’) and to get simple pit geometry for further modelling. However, the lead-in-pencil electrode does not permit to have radius evolution. The radius evolution was independently investigated in the literature on aluminium,15,16 using a horizontal plate of a few micrometers thick. This technique permitted to highlight the lateral evolution of the pit (but no work was performed on the depth evolution). Mixing the two last mentioned techniques with the introduction of a vertical foil in the lead-in-pencil technique, it was possible to study both lateral and vertical pit evolutions.17,18 However, due to the low thickness of the foil (from 25 to 50 μm), which led to interactions between the pit and the resin, it was not possible to determine precise kinetic information about lateral evolution. In this article, an experimental setup allowing to locally inject chloride ions19–21 has been used to analyze the long-term development of a single pit in three dimensions.
It is generally admitted in the literature that long-term experiments are missing for pit propagation.1,10 That is the scope of this article with the creation and sustenance of a disc shaped single pit. Disc shaped pits are less studied than hemispherical pits despite the fact that they are more convenient for numerical modeling,22–24 since they are obtained in a concentrated solution of chloride in which the number of pits is more important.
This paper aims at bringing new insight on the pit propagation description on 316L stainless steel. After the description of the experimental setup, the control of the initiation of a single pit will be detailed. Then, the propagation phase will be characterized and a particular attention will be paid to the description of both radial and deep evolutions. The last part of this article will focus on the pitting chemistry necessary to maintain the pit propagation.
2 Experimental
2.1 Instrumentation
Local electrochemical techniques have been widely used in corrosion investigation.25,26 The instrumentation used in this work was based on a scanning electrochemical microscope (SECM), which has already been described elsewhere19–21 and in which the amperometric probe was replaced by a glass capillary (vide infra). The setup, sketched in Fig. 1, was composed of a lab-made potentiostat coupled with a low-noise-current-to-voltage converter (Femto DLPCA200, BFI Optilas) with an adjustable gain (103 to 1011 V A−1) and a three-axis positioning system (VP-25XA, Newport) driven by a 100 nm spatial-resolution motion encoder (ESP300, Newport). The entire setup was controlled by a software developed under Labview® environment. The glass microcapillary was used as a chloride ion dispenser to create a single pit on the stainless steel electrode. The top of the microcapillary was connected to a 300 μL Terumo® syringe filled with a NaCl in a 0.5 M H2SO4 solution. The effect of the NaCl concentration has been studied by varying its concentration in the syringe. A KD Scientific® syringe infusion pump was used to gradually release the solution at a fixed rate. The effect of the releasing rate was also studied as a relevant parameter for the pit initiation/propagation. The lifetime of a microcapillary was extended by washing it with a water–ethanol mixture after each experiment since the use of high concentration chloride solution may lead to crystal formation that obstruct its apex. All the experiments presented in this article were performed with the same glass microcapillary size with an inner diameter of 100 μm and an outer diameter of 1000 μm. The precise positioning of the microcapillary was performed by measuring the electrolyte resistance between the substrate and the reference electrode.20 This technique was shown to be very sensitive to monitor the position of an insulating material in the close vicinity of a substrate.27 In a preliminary work, different distances between the microcapillary and the sample have been tested. If the distance was too large, several pits developed on the stainless steel surface. Thus, distances between 10 to 20 μm have been chosen because corresponding to the larger distance at which a single pit was always observed.
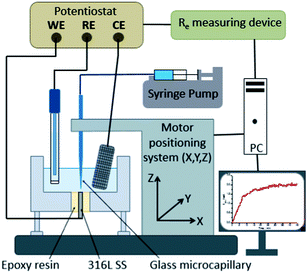 |
| | Fig. 1 Electrochemical device developed for generating a single pit and studying its propagation. | |
2.2 Electrode preparation
The electrochemical cell was a three-electrode cell with a platinum grid acting as counter electrode, a mercury saturated sulphate electrode (MSE) as reference electrode (E = 650 mV/NHE) and a 316L stainless steel disk as working electrode. The nominal composition of the 316L stainless steel (in wt%) was obtained from EDAX analysis: 65.9% Fe, 18.5% Cr, 10.6% Ni, 2.4% Mo, 1.7% Mn and 0.9% Si. The stainless steel surface and the thickness of the sample were large enough to study the 3D evolution of the pit, allowing the progress in depth and radius of the single pit for a time longer than 10 hours to be investigated.
Surface preparation was important because it determined the passive film nature, thickness, and its crystallization.28,29 In this article, the same preparation was always used to have a reproducible passive film. The chosen surface preparation was previously used in the literature by Hisamatsu et al.30 and consisted in several steps. First, the 316L stainless steel specimen was mechanically polished with 1200, 2400, and 4000 SiC paper, and then cleaned with a water and ethanol mixture in an ultrasonic bath for 10 min. After the polishing, the electrode was introduced in the electrolytic cell that will also be used for pitting corrosion experiments, and was then cathodically treated in 0.5 M H2SO4 at −0.9 V/MSE for 1 minute to reduce (at least partially) the native oxide film. In the next step, the formation of the passive film was achieved in the same electrolytic solution by performing a single potential sweep between −0.9 V/MSE and the working potential (i.e. the potential at which we wanted to initiate the pit) at a low scan rate (1 mV s−1). Then, before releasing the chloride through the glass microcapillary, the working potential was held for 30 min to ensure that the passive film is thick enough. In this work, all the experiments were performed at 0 V/MSE, but in a previous work21 the effect of the working potential on pitting was investigated. The thickness of the passive film at the end of the surface preparation was evaluated by electrochemical impedance spectroscopy to be about 1 nm. This result is in good agreement with the work of Strehblow and Haupt29 who measured the passive film thickness of Fe–15Cr in 0.5 M H2SO4 from 1.1 nm at −0.4 V/MSE to 1.9 nm at 0.4 V/MSE.
2.3 Physical characterization
Ex situ characterization of the pits was performed with a Leica Stereoscan 440 scanning electron microscope (SEM). This post-mortem observation allowed accurate measurements of the pit radius. The pit depth was measured using a differential focusing technique with an optical microscope equipped with a micrometric screw.
3 Results and discussion
3.1 Control of the pitting initiation
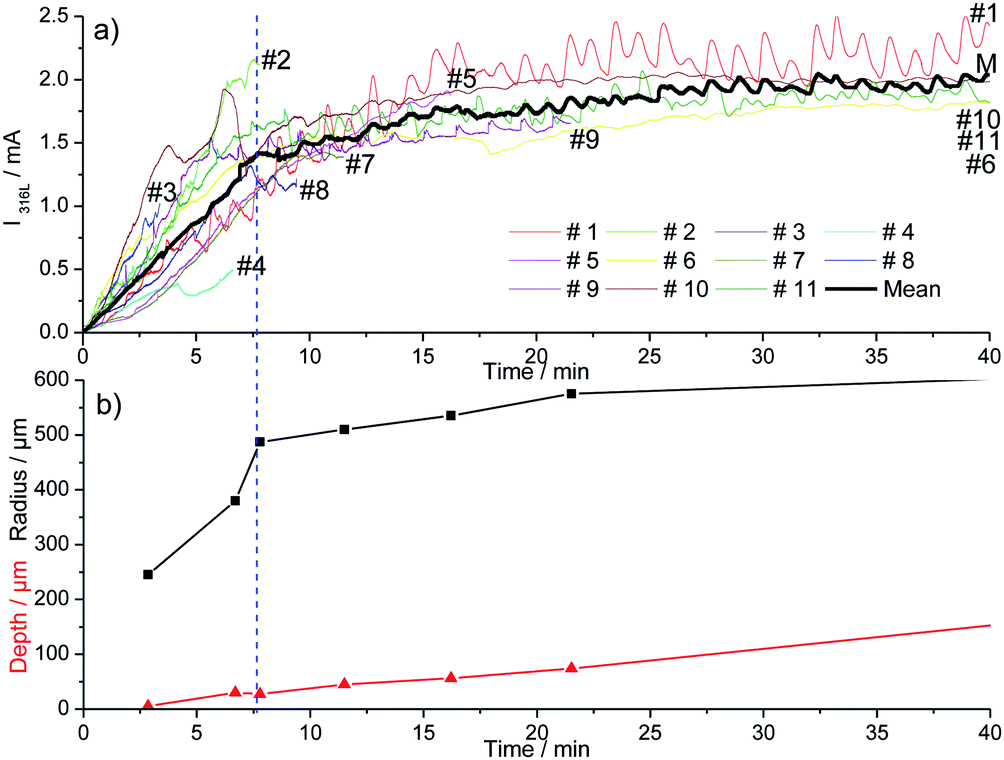
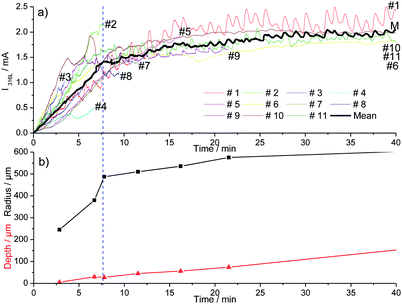
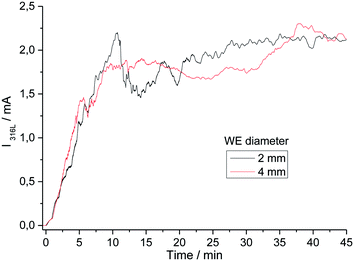
Fig. 2 shows 11 identical experiments performed independently. The solution injected with the microcapillary was 3 M NaCl with a flow rate equal to 5.4 μL h−1. The propagation time was varied between 3 and 40 minutes to allow ex situ pit radius and depth characterizations at different propagation times. The current–time records for the 11 identical experiments plotted in Fig. 2a were similar and included different stages. First the initial time for the pitting in all of our experiments (i.e. t = 0 in Fig. 2) was defined as the time for which an increase in current due to pitting corrosion was monitored. The pit started to propagate after the breakdown of the passive layer (just beneath the microcapillary and independent of the metal microstructure) due to the aggressiveness of chloride ions. The first 10 to 15 minutes of the pit propagation were characterized by a sharp increase of current. Then the increases of the current slowed down. A similar current evolution between the 11 identical tests shows that the experimental setup permits to obtain reproducible single pits. Varying the working electrode disk diameter did not change the pitting reproducibility. Indeed, Fig. 3 shows that a similar current evolution was recorded for a 2 mm electrode diameter and a 4 mm electrode diameter. After 45 minutes of propagation, the pit radius and depth (determined with an optical microscope) were found to be 610 μm and 147 μm for a 2 mm in diameter working electrode, and 600 μm and 139 μm for a 4 mm electrode, respectively. It can be concluded that the electrode size did not modify the pitting evolution. However, the use of a smaller working electrode allowed us to investigate the early stage of the pitting since the background current (passive dissolution) is then minimized (data not shown), allowing a sharp evaluation of the onset of the current increase. The current evolution could be mainly explained by the increase of the pit radius while the pit depth seems to have a lower contribution, as shown in Fig. 2b. The initial sharp increase of current was linked with a huge increase of the pit radius while the pit depth did not exceed 25 μm. This was ascribed to the large concentration of chloride used for the local pit initiation. This initial stage of the pit formation is linked with the inner and outer diameters of the microcapillary used to generate the single pit. Then the increases of the current and the pit radius slowed down together. In the literature such decreases of growth in current and pit radius were already found on iron under potentiostatic conditions and were explained by a salt film precipitation.31
 |
| | Fig. 2 Current recorded (a) and mean geometric parameters of the pits (b) during the initiation of the pitting corrosion for 11 different experiments at 0 V/MSE. | |
 |
| | Fig. 3 Current recorded during the single pit propagation experiments varying the diameter of the stainless steel electrode at 0 V/MSE. | |
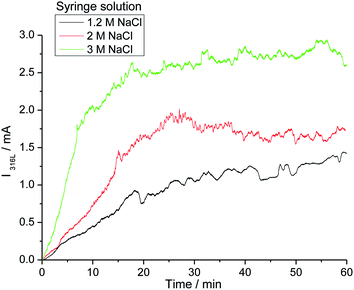
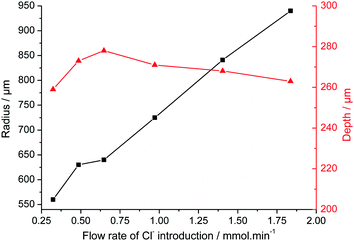
The influence of the chloride amount brought by the microcapillary on the stainless steel disk was studied in two different ways: (i) by varying the flow rate of the syringe driver, and (ii) by varying the NaCl concentration in the syringe. With both of these methods, similar results were obtained. Increasing the NaCl concentration in the syringe modified the pitting current as shown in Fig. 4. The initial current slope increased as did the step value of the current. The amount of chloride released by the microcapillary significantly impacted the pit radius whereas the pit depth remained constant as shown in Fig. 5. A reproducible pit depth was found for experiments performed for 2 and 3 hours of propagation with variation of chloride introduction and the standard deviation was very low between each test (Table 1). The microscopy measurements showed that it was the increasing radius that could explain the current increase when the pit solution is more concentrated in chloride. Besides, increasing the amount of chloride brought by the microcapillary reduced the probability to have a pit cover of residual metal above the pit (Fig. 6). This shows that the whole stainless steel surface below the glass microcapillary dissolves when the solution is concentrated enough in chloride. In addition, the small distance between the capillary and the steel electrode allowed for controlling the local environment in the close vicinity of the pit. Similar observations on the disappearance of the pit cover were reported in the literature but for increasing the potential32 and temperature33 instead of increasing the chloride concentration. In the following work, only pits without pit cover at the pit mouth were considered further. It should also be mentioned that the size of the microcapillary may play a non-negligible role on the pit initiation/propagation processes, especially the outer diameter of the glass part because the capillary and the steel substrate form a thin layer in which the electrolytic solution is confined.
 |
| | Fig. 4 Current–time curves for three single pits after 1 hour propagation at 0 V/MSE with the chloride concentration as a parameter. | |
 |
| | Fig. 5 Influence of the chloride amount injected with the microcapillary on the geometric parameters of the pit after 2 hours of propagation at 0 V/MSE. | |
Table 1 Pit depth for two different propagation times with the variation of the chloride amount brought to the system between each test
| Propagation duration |
Number of performed experiments |
Mean depth (μm) |
Standard deviation for depth (μm) |
| 2 hours |
7 |
268 |
4 |
| 3 hours |
10 |
360 |
8 |
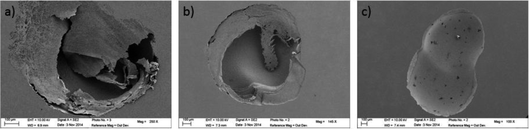 |
| | Fig. 6 SEM images after 1 hour of propagation for the pits generated with 1.2 M NaCl + 0.5 M H2SO4 (a), 2 M NaCl + 0.5 M H2SO4 (b) and 3 M NaCl + 0.5 M H2SO4 (c) in the syringe at 0 V/MSE. | |
3.2 Characterization of the pit propagation
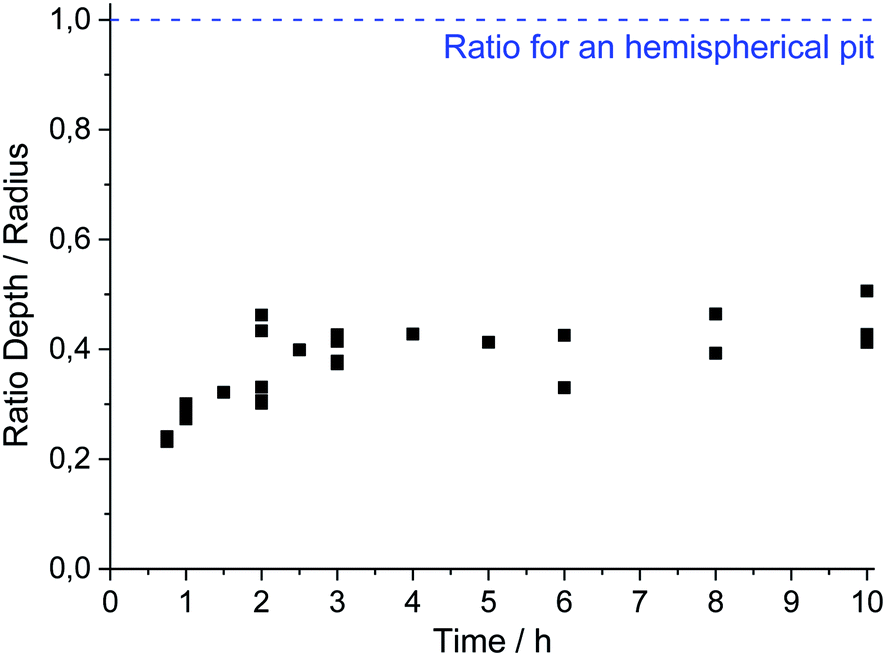
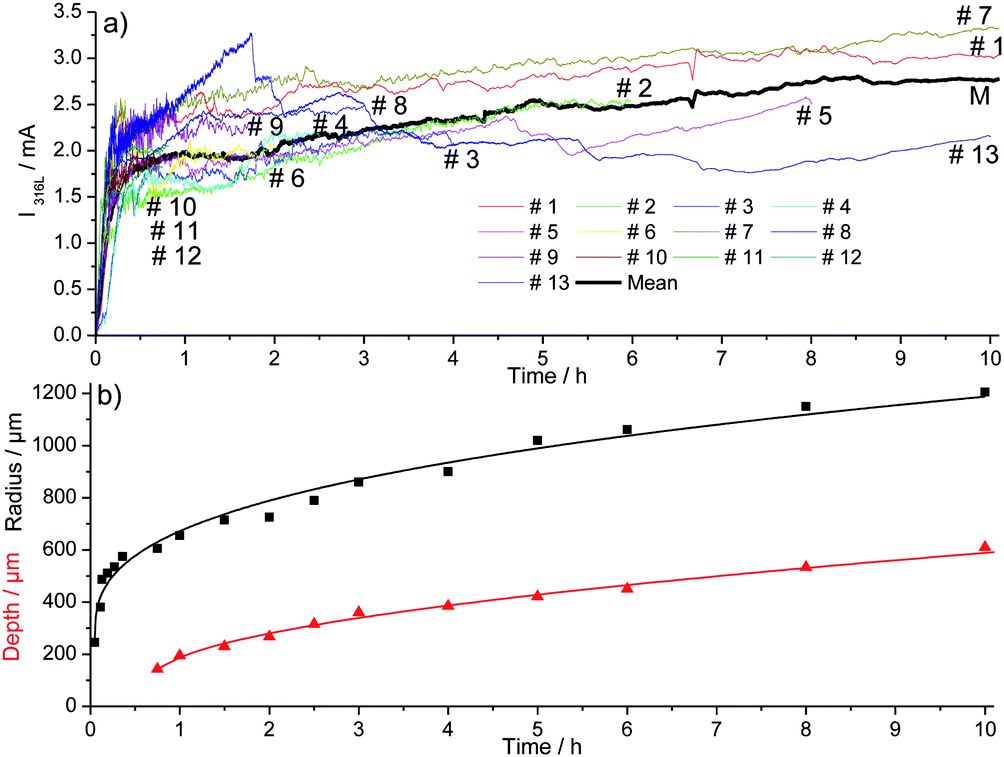
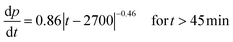
The evolution of the pit geometry was investigated by performing 30 experiments for 11 different pit propagation times between 45 minutes and 10 hours. Chloride ions were introduced in the electrochemical cell at a constant flow rate of 5.4 μL h−1 using a 3 M NaCl and 0.5 M H2SO4 solution. The ratio pit depth/pit radius at the end of each experiment was calculated and plotted, shown in Fig. 7. For the whole tests, this ratio had approximately the same value of 0.4. As a consequence, the generated single pits are always disc shaped. It should also be mentioned that in the literature, most of the investigations are related to hemispherical pits.1,7,30,32,34Fig. 7 shows also the repartition of the 30 performed experiments between the 11 propagation times. Reproducible pits were obtained for the propagation phase of up to 10 hours, as shown in Fig. 8a, for which the chronoamperometry results between different experiments overlap. During the propagation phase, the current increases slightly. In our experiments, after 45 minutes of propagation, the current is proportional to t0.09. The measurement of the pit depth and pit diameter with an optical microscope and SEM allowed the determination of experimental laws for the evolution of the pit and the radius (Fig. 8b). For the radius the 11 experiments presented in the previous section for the initiation phase were also used because it was shown that the pit radius significantly impacts the initiation phase whereas the pit depth evolution did not change between initiation and propagation. The following laws were found:| | | p = 126 + 1.57|t − 2700|0.54 for t > 45 min | (1) |
| | | r = 250 + 26.36|t − 180|0.34 for t > 3 min | (2) |
where p is the pit depth (expressed in μm), r the pit radius (in μm) and t the propagation time (in s).
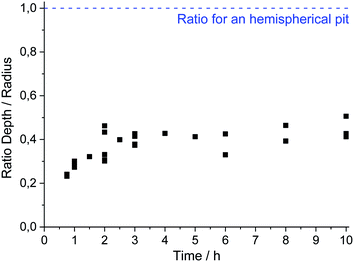 |
| | Fig. 7 Evolution of the pit depth/pit radius ratio measured with an optical microscope. | |
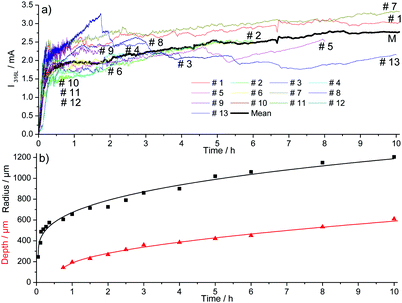 |
| | Fig. 8 Current recorded (a) and mean geometric parameters of the pits (b) during the propagation of pitting corrosion for 30 different experiments at 0 V/MSE. | |
In the experimental laws (1) and (2), the value of the different parameters have a physical meaning. At 3 minutes (i.e. 180 s), we found a pit radius of 250 μm. After 45 minutes (i.e. 2700 s), a pit depth of 126 μm was found using eqn (1). These laws also revealed that the pit depth increases as a function of the square root of the time, whereas the radius grows as a function of t0.34. An increase in square root of time is characteristic of a process limited by diffusion, suggesting that the pit bottom is rate determined by diffusion.
In the literature, for stainless steel Fe–18Cr–12Ni–2Mo–Ti in 0.5 M NaCl + 0.05 M H2SO4 solution, Szklarska-Smialowska et al.35 found under potentiostatic conditions (at 0.860 V/NHE) that p ∼ t0.75 and r ∼ t0.94. The differences with our results can be explained by the fact that they worked on a large electrode with many pits. As a consequence they obtained an average value on an unknown value of pits and at different stages of the propagation process, whereas in this work, all the measurements are always performed on a single pit. In addition, fluctuations of the current that preceded the formation of stable pits2 due to the true passivity breakdown36 may have also vitiated the measurement.
A pit radius of 500 μm, corresponding to the glass microcapillary radius, was obtained after 15 minutes of propagation according to relation (2). For a pit radius greater than 500 μm, the pit growth occurs under the stainless steel surface where the glass microcapillary is not present. In Fig. 9a, a pit growth under the stainless steel surface is noticeable at the periphery of the pit for a disc shaped pit after more than 10 hours of propagation. This presence of a lacy cover is consistent with the potentiostatic investigations performed on 304 stainless steel foils in 1 M NaCl solution.17,18Fig. 9b did not show any crystallographic formation at the pit bottom, as it has been observed in the literature when the pit bottom potential is in the active state and when a salt film is not present.37
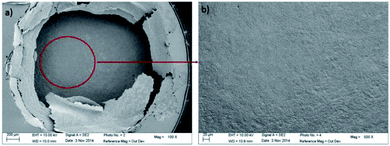 |
| | Fig. 9 SEM image of a disc shaped pit after 15 h of propagation at 0 V/MSE. | |
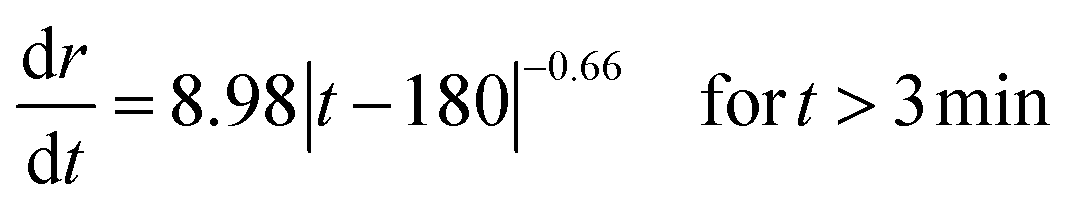
Taking the derivative of eqn (1) and (2) allows the vertical and lateral pit growth rates to be expressed as:
| |  | (3) |
| |  | (4) |
For long-term propagation, the growth rate of the depth determined in relation (3) expressed in μm s−1 is lower than the growth rate of the radius written in relation (4) in μm s−1. It is consistent with a disc shaped pit.
The Faraday law permits to link the electrochemical behavior with a mass loss proportional to the growth rates presented in relations (3) and (4). However, to use the Faraday law we need to know the oxidation number of species that dissolve. The hypothesis that there is no specific dissolution has been made and thus a mean oxidation number of 2.2 was used for 316L stainless steel. Fig. 10 validated the hypothesis of no specific dissolution. The pit volume corresponding to the metal dissolution was calculated by two different methods. The direct route uses the Faraday law, which allowed for obtaining the volume of dissolution from the measured current. In the second approach, the calculation of volume was made from optical microscopy measurements and the hypothesis of a cylindrical pit was made. During the whole propagation time, both methods gave the same dissolution volume, suggesting that the use of the Faraday law is a valid hypothesis. The observation that the fraction of the dissolved elements in the solution after pitting measured by ICP was equal to their fraction in the substrate confirms this result.20,21
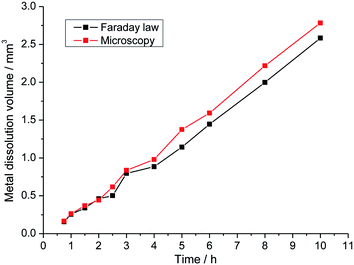 |
| | Fig. 10 Dissolution volume calculated by the Faraday law and by the optical measurements. | |
From relations (3) and (4), using the Faraday law considering no specific dissolution and calculating the flux, the local current densities on the pit walls and at pit bottom were determined to be:
| | 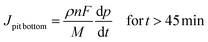 | (5) |
| |  | (6) |
With Jlocal being the local current density, ρ being the 316L stainless steel density (8 g cm−3), n being the mean oxidation number involved in the corrosion reaction (2.2), F being the Faraday constant (96![[thin space (1/6-em)]](https://www.rsc.org/images/entities/char_2009.gif) 485 C mol−1) and M being the 316L SS molar mass (56.1 g mol−1).
485 C mol−1) and M being the 316L SS molar mass (56.1 g mol−1).
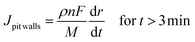
These two relations are plotted in Fig. 11. The current density at the pit bottom decreases as a square root of time, revealing that the rate-limiting step at the pit bottom may be a diffusive process (see the ESI†). This might be the diffusion of metallic cations from the pit bottom to the pit mouth as defended several times in the literature.10,11,38,39 Another explanation was to consider that the limiting diffusion is the transport of aggressive anions to the outside of the pit.31
 |
| | Fig. 11 Evolution of the current density on the pit walls and at the pit bottom for long-term pit propagation. | |
Current density in a single pit had already been evaluated using artificial pit electrodes. Isaacs11 determined the evolution of current density with time for propagation times of up to 45 minutes for a 308 stainless steel immerged in 1 M NaCl. The initial value of current density was about 1.2 A m−2, which is in good agreement with other works from the literature.37,40,41 Then the current density decreases in the square root of time to the value of 200 mA cm−2 after 45 minutes of propagation. This value could be consistent with a current density of 125 mA cm−2 that we observed after 1 hour of propagation. Newman13 determined the current density value for a longer propagation time, performing a single pit of 1 mm depth on a Fe–17Cr–11Ni–2.7Mo alloy using 4 M KCl solution. After reaching this depth, he changed the solution to 1 M KCl solution and then measured the current density at different potentials. In our paper, using relation (1), a pit depth of 1 mm is obtained after 34 hours of propagation. At 34 hours of propagation, a pit density of 10 mA cm−2 is calculated using relation (5). This value is also in good agreement with the one obtained by Newman for a lower overpotential.
3.3 Critical pitting chemistry
3.3.1 Corrosion product concentration at the pit bottom
The current density at the pit bottom was found to be lower than the current density on the pit walls (Fig. 11). This can be explained by the local chemistry at the pit bottom, which slows the corrosion rate but also permits to sustain the pit propagation. Using the Fick first law, the concentration of metallic cations Men+ at the pit bottom could be calculated from the following relationship:| | 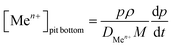 | (7) |
With DMen+ being the diffusion coefficient of the metallic cations which was taken equal to 0.5 10−5 cm2 s−1.11 The bulk concentration of the metallic cations (far from the pit) was also assumed to be zero.
During the single pit propagation, a constant concentration of 1.4 mol L−1 was found for the metallic cation concentration at the pit bottom (Fig. 12). Such a value corresponds to 30% of the saturation concentration of the solubility of FeCl2 (4.4 mol L−1).42 According to the literature,43,44 the concentration of the corrosion products within the pit must be maintained at about 60% for allowing the pit to propagate. However, a lower corrosion product concentration had already been reported in the literature for 304 stainless steel. Hisamatsu45 observed a pit propagation with a corrosion product concentration of 1.8 M at the pit bottom (i.e. 40% of the saturation). Moreover, more complex iron salt with a lower solubility could have formed. This could be the case in our experiment with the formation of sulphate iron salts.
 |
| | Fig. 12 Calculated concentration evolution at the pit bottom for long-term pit propagation. | |
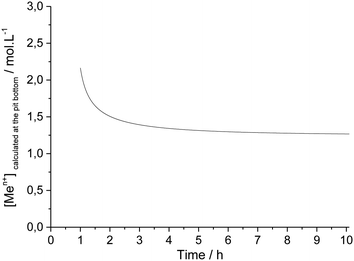
3.3.2 Critical bulk chloride concentration
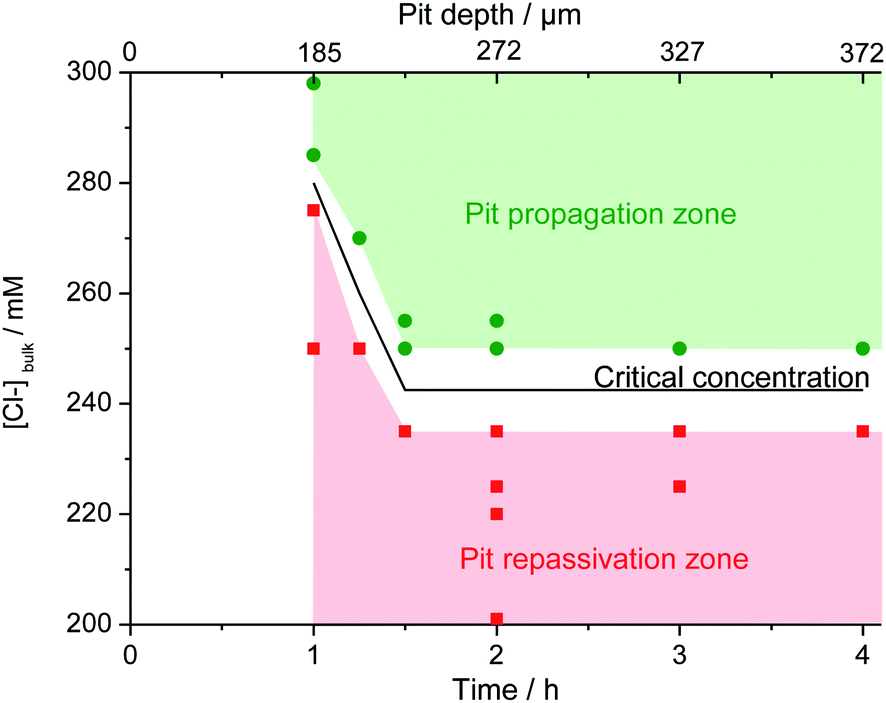
The concentration of chloride required in the bulk electrolyte to maintain the pit propagation was determined. 20 reproducible single pits were created at 0 V/MSE releasing a solution of 3 M NaCl + 0.5 M H2SO4 using the glass microcapillary with a constant flow rate of 5.4 μL h−1. During the propagation, the bulk electrolyte was changed from a solution of 0.5 M H2SO4 to a solution of 0.5 M H2SO4 and variable NaCl concentrations (C0) using peristaltic pumps working at constant flow rates. After 15 minutes, necessary to completely renew the bulk solution, the glass microcapillary was removed. Depending on the chloride concentration, C0, of the bulk electrolyte, the pit propagation continued or stopped. As shown in Fig. 13, after removing the microcapillary at 2 hours and 3 hours, it is noticeable that the pit still propagated for a bulk chloride concentration of 250 mM for both propagation times and that the pit repassivated for a lower bulk chloride concentration of 235 mM.
 |
| | Fig. 13 Chronoamperometries for 2 pitting experiments in which the microcapillary was removed after 2 hours (blue curves) and after 3 hours (red curves) to see if a critical chemistry exists in the bulk. | |
The effect of the bulk chloride concentration was studied as a function of pit propagation time and pit depth (Fig. 14). Each point in Fig. 14 represents one of the 20 performed experiments. Two zones can be clearly seen. A pit propagation zone may be defined for the bulk chloride concentration when it was high enough to sustain pit propagation. A pit repassivation zone exists when the bulk chloride concentration was no longer sufficient to maintain the propagation process. Between both zones, a critical chloride concentration may be defined. From 1 hour to 1 h 30 min of propagation, this critical concentration decreases. Then at 1 h 30 min of pit propagation, achieving a pit depth of 230 μm, it reaches a step value between 235 mM and 250 mM. Additional experiments were performed at 235 mM and 250 mM of bulk chloride concentration to confirm the reproducibility of the repassivation and propagation of the single pit after 1 h 30 min of propagation. Conversely to iron or nickel,42 stainless steel repassivates at a high chloride concentration. The need of chloride ions to continue pit propagation was explained for the early stage of pit development by an increase of the salt film volume during pit propagation as the pit surface grows. As the salt film is composed of chloride ions, a supply of chloride ions is necessary to respond to the increased volume of the salt film.42 In addition, it was shown that the sulfate concentration (data not shown) also plays a significant role, since an increase in sulfate concentration is accompanied by a current decrease. For instance, in a 6 M sulfate solution (adding sulfate salt but maintaining a constant pH) the pitting current was 8 times smaller than in a 0.5 M solution. These observations are in good agreement with those reported by Pistorius and Burstein47 on a 304 stainless steel with the addition of SO42− ion to a 1 M Cl− solution. Indeed, these results indicate the influence of the chloride/sulphate ratio on the pitting behaviour and can be explained by a stronger adsorption of sulphate than chloride at the electrode interface.
 |
| | Fig. 14 Evolution of the critical chloride concentration necessary to continue the propagation of an opened pit with a radius of 800 μm as a function of propagation time and pit depth. | |
4 Conclusions
The pitting corrosion of 316L stainless steel was investigated using an experimental setup that permits to create reproducible single pits. In the literature, pitting corrosion experiments usually focus on small hemispherical pits. Here, large disc shaped pits were analyzed with a propagation time of up to 10 hours. The experimental setup permitted to control at will the chloride ions brought into the pit solution. Experimental propagation laws for the geometrical parameters of the pit radius and depth were proposed. Calculations of local current densities were deducted to determine the limiting mechanism controlling the pit propagation. The pit growth at the pit bottom was limited by diffusion, probably due to the diffusion of the metallic cations from the bottom to the outside of the pit. A corrosion product concentration of 30% of the saturation was calculated at the pit bottom. This percentage, although lower than the one proposed in the literature, would be enough to prevent the pit repassivation. Experimentally, a minimum chloride concentration was determined in the bulk electrolyte to sustain the pit propagation. This concentration decreases with time until a critical pit depth of 230 μm is reached. Then, the bulk electrolyte concentration has to be at least 245 mM NaCl to sustain the pit propagation on 316L austenitic stainless steel. Further investigations are under progress to investigate the influence of the microcapillary geometry and to determine geometrical laws for the pit radius and depth as a function of the chloride concentration.
Acknowledgements
The authors gratefully acknowledge AREVA NC for the funding of this project, and Françoise Pillier (UMR 8235) for the SEM observations.
References
- Z. Szklarska-Smialowska, Electrochem. Soc., Proc., 2002, 13, 251 Search PubMed.
- J. Soltis, Corros. Sci., 2015, 90, 5 CrossRef CAS PubMed.
- T. Shibata and T. Takeyama, Corrosion, 1977, 33, 243 CrossRef CAS.
-
D. E. Williams, C. Wescott and M. Fleischmann, Passivity of Metals and Semiconductors, ed. M. Froment, 1983, p. 217 Search PubMed.
-
D. E. Williams, J. Stewart and P. H. Balkwill, Critical Factors in Localized Corrosion, ed. G. S. Frankel and R. C. Newman, 1992, p. 36 Search PubMed.
- D. E. Williams, J. Stewart and P. H. Balkwill, Corros. Sci., 1994, 36, 1213 CrossRef CAS.
- I. L. Rosenfeld and I. S. Danilov, Corros. Sci., 1967, 7, 129 CrossRef.
- T. Beck, J. Electrochem. Soc., 1973, 120, 1317 CrossRef CAS PubMed.
- R. K. Ulrich and R. C. Alkire, Corros. Sci., 1983, 23, 1153 CrossRef CAS.
- R. C. Alkire and K. P. Wong, Corros. Sci., 1988, 28, 411 CrossRef CAS.
- H. S. Isaacs, J. Electrochem. Soc., 1973, 120, 1456 CrossRef CAS PubMed.
-
R. C. Newman and H. S. Isaacs, Passivity of Metals and Semiconductors, ed. M. Froment, 1983, p. 269 Search PubMed.
- R. C. Newman, Corros. Sci., 1985, 25, 341 CrossRef CAS.
- N. J. Laycock and R. C. Newman, Mater. Sci. Forum, 1995, 192–194, 649 CrossRef CAS.
- G. S. Frankel, J. R. Scully and C. V. Jahnes, J. Electrochem. Soc., 1996, 143, 1834 CrossRef CAS PubMed.
- A. Sehgal, D. Lu and G. S. Frankel, J. Electrochem. Soc., 1998, 145, 2831 CrossRef PubMed.
- P. Ernst and R. C. Newman, Corros. Sci., 2002, 44, 927 CrossRef CAS.
- S. M. Ghahari, D. P. Krouse, N. J. Laycock, T. Rayment, C. Padovani, T. Suter, R. Mokso, F. Marone, M. Stampanoni, M. Monir and A. J. Davenport, Corros. Eng., Sci. Technol., 2011, 46, 205 CrossRef CAS PubMed.
- N. Aouina, F. Balbaud-Célérier, F. Huet, S. Joiret, H. Perrot, F. Rouillard and V. Vivier, Electrochim. Acta, 2011, 56, 8589 CrossRef CAS PubMed.
- N. Aouina, F. Balbaud-Célérier, F. Huet, S. Joiret, H. Perrot, F. Rouillard and V. Vivier, Corros. Sci., 2012, 62, 1 CrossRef CAS PubMed.
- N. Aouina, F. Balbaud-Célérier, F. Huet, S. Joiret, H. Perrot, F. Rouillard and V. Vivier, Electrochim. Acta, 2013, 104, 274 CrossRef CAS PubMed.
- J. R. Galvele, J. Electrochem. Soc., 1976, 123, 464 CrossRef CAS PubMed.
- J. R. Galvele, Corros. Sci., 1981, 21, 551 CrossRef CAS.
- S. M. Gravano and J. R. Galvele, Corros. Sci., 1984, 24, 517 CrossRef CAS.
- L. Niu, Y. Yin, W. Guo, M. Lu, R. Qin and S. Chen, J. Mater. Sci., 2009, 44, 4511 CrossRef CAS.
-
M. B. Jensen and D. E. Tallman, Electroanalytical Chemistry A Series of Advances, ed. C. Bard and A. J. Zoski, 2011, vol. 24, p. 171 Search PubMed.
- H. Bouazaze, J. Fransaer, F. Huet, P. Rousseau and V. Vivier, Electrochim. Acta, 2010, 55, 1645 CrossRef CAS PubMed.
-
A. J. Davenport, R. C. Newman and P. Ernst, Passivity of Metals and Semiconductors, ed. M. B. Ives, J. L. Luo and J. R. Rodda, 2001, Proceedings vol. 99–42, p. 65 Search PubMed.
- S. Haupt and H. H. Strehblow, Corros. Sci., 1994, 37, 43 CrossRef.
-
Y. Hisamatsu, T. Yoshii and Y. Matsumura, Localized Corrosion, ed. R. Staehle, NACE Houston, 1974, p. 427 Search PubMed.
-
H. H. Strehblow and P. Marcus, Corrosion Mechanisms in Theory and Practise, ed. P. Marcus, 3rd edn, 2012, p. 349 Search PubMed.
-
N. Sato, T. Nakagawa, K. Kudo and M. Sakashita, Localized Corrosion, ed. R. Staehle, NACE Houston, 1974, p. 447 Search PubMed.
- N. J. Laycock, M. H. Moayed and R. C. Newman, J. Electrochem. Soc., 1998, 145, 2622 CrossRef CAS PubMed.
- H. J. Engell and N. D. Stolica, Z. Phys. Chem., 1959, 20, 113 CrossRef CAS.
- Z. Szklarska-Smialowska and J. Mankowski, Corros. Sci., 1972, 12, 925 CrossRef CAS.
-
G. T. Burstein and S. P. Mattin, Critical Factors in Localized Corrosion 2, ed. P. M. Natishan, R. G. Kelly, G. S. Frankel and R. C. Newman, 1995, p. 1 Search PubMed.
- N. Sato, Corros. Sci., 1995, 37, 1947 CrossRef CAS.
- P. C. Pistorius and G. T. Burstein, Philos. Trans. R. Soc., A, 1992, 341, 531 CrossRef CAS.
- H. S. Isaacs and G. Kissel, J. Electrochem. Soc., 1972, 119, 1628 CrossRef CAS PubMed.
- W. Schwenk, Corrosion, 1964, 20, 129t CrossRef CAS.
-
V. M. Novokovsky and A. N. Sorokina, Proceedings Third International Congress Metallic Corrosion, MIR Publishers, Moscou, 1969, vol. 1, p. 159 Search PubMed.
-
K. J. Vetter and H. H. Strehblow, Localized Corrosion, ed. R. Staehle, NACE Houston, 1974, p. 240 Search PubMed.
- G. T. Gaudet, W. T. Mo, T. A. Hatton, J. W. Tester, J. Tilly, H. S. Isaacs and R. C. Newman, AIChE J., 1986, 32, 949 CrossRef CAS PubMed.
- H. S. Isaacs, Corros. Sci., 1989, 29, 313 CrossRef CAS.
-
Y. Hisamatsu, Passivity and its Breakdown on Iron and Iron Base Alloys, ed. R. W. Staehle and H. Okada, NACE Houston, 1976, p. 99 Search PubMed.
-
K. J. Vetter, Electrochemical Kinetics, 1967, p. 214 Search PubMed.
- P. C. Pistorius and G. T. Burstein, Corros. Sci., 1992, 22, 1885 CrossRef.
Footnote |
| † Electronic supplementary information (ESI) available. See DOI: 10.1039/c4fd00252k |
|
| This journal is © The Royal Society of Chemistry 2015 |
Click here to see how this site uses Cookies. View our privacy policy here.  Open Access Article
 This Open Access Article is licensed under a