
Effects of molecular ozone and hydroxyl radical on formation of N-nitrosamines and perfluoroalkyl acids during ozonation of treated wastewaters†
Aleksey N.
Pisarenko
*ad,
Erica J.
Marti
ab,
Daniel
Gerrity
b,
Julie R.
Peller
c and
Eric R. V.
Dickenson
*a
aWater Quality Research and Development Division, Southern Nevada Water Authority, Henderson, Nevada 89015, USA. E-mail: eric.dickenson@snwa.com
bDepartment of Civil and Environmental Engineering and Construction, University of Nevada, Las Vegas, Las Vegas, Nevada 89154, USA
cDepartment of Chemical Sciences, Geosciences, and Biosciences, Valparaiso University, Valparaiso, Indiana 46383, USA
dTrussell Technologies, Inc., San Diego, California 92075, USA. E-mail: aleksp@trusselltech.com
First published on 13th May 2015
Abstract
N-Nitrosamines—toxic disinfection byproducts commonly associated with chloramination—have recently been shown to increase after ozonation of some surface waters and treated wastewaters. In addition to five nitrosamines, two perfluoroalkyl acids (PFAAs) are included in the most recent U.S. EPA Contaminant Candidate List due to potential public health risks. In this manuscript, the potential roles of molecular ozone (O3) and hydroxyl radical (˙OH) were investigated in the formation of N-nitrosamines and PFAAs in treated wastewaters. The results herein are based on controlled bench-scale experiments designed to isolate the effects of O3 with the use of t-butanol as a ˙OH scavenger. Nitrous oxide gas saturated samples were exposed to gamma radiation to isolate the effects of ˙OH, and para-chlorobenzoic acid was used to assess ˙OH exposure. This study found that the presence of molecular ozone versus the hydroxyl radical promoted N-nitrosodimethylamine (NDMA) formation. Six other N-nitrosamines showed very little or no formation upon the ozonation of six treated wastewaters up to an O3![[thin space (1/6-em)]](https://www.rsc.org/images/entities/char_2009.gif) :TOC ratio of 1.0. For PFAAs, perfluorohexanoic acid (PFHxA) formed the highest and most consistently upon ozonation (up to an O3:TOC ratio of 2.0) of the same six treated wastewaters. Presence of molecular ozone (more so than hydroxyl radical), appears to promote the formation of PFHxA and perfluorobutane sulfonic acid (PFBS). The effect of pH in the range of 6–8 upon the formation of NDMA and PFAAs was found to be minimal. These findings provide new understanding of the formation of oxidation byproducts during ozonation of reclaimed wastewaters. Depending on future regulatory determinations, NDMA and a few PFAAs could be of concern for potable reuse treatment systems that employ ozone.
:TOC ratio of 1.0. For PFAAs, perfluorohexanoic acid (PFHxA) formed the highest and most consistently upon ozonation (up to an O3:TOC ratio of 2.0) of the same six treated wastewaters. Presence of molecular ozone (more so than hydroxyl radical), appears to promote the formation of PFHxA and perfluorobutane sulfonic acid (PFBS). The effect of pH in the range of 6–8 upon the formation of NDMA and PFAAs was found to be minimal. These findings provide new understanding of the formation of oxidation byproducts during ozonation of reclaimed wastewaters. Depending on future regulatory determinations, NDMA and a few PFAAs could be of concern for potable reuse treatment systems that employ ozone.
Water impactN-Nitrosamines—toxic disinfection byproducts—have recently been shown to increase after ozonation of some surface waters and treated wastewaters. Five nitrosamines and two perfluoroalkyl acids (PFAAs) are included in the most recent U.S. EPA Contaminant Candidate List due to potential public health risks. Ozone is a powerful disinfectant and chemical oxidizer and is gaining use in potable and water reuse treatment facilities. Despite ozone's advantages for water treatment, the potential to form nitrosamines and perfluoroalkyl acids is still poorly understood. This study performed experiments to isolate the effects of molecular ozone and hydroxyl radical to gain better understanding of the formation of nitrosamines and PFAAs during ozonation. |
1. Introduction
Nitrosamines and perfluoroalkyl acids (PFAAs) are high priority contaminants. Several compounds are included on the most recent United States Environmental Protection Agency (U.S. EPA) Contaminant Candidate List.1 Six nitrosamines and six PFAAs are also listed in U.S. EPA's Unregulated Contaminant Monitoring Rules 2 and 3, respectively, which require nationwide monitoring by public water suppliers to provide occurrence data needed for regulatory decision making.2 The U.S. EPA's Integrated Risk Information System database indicates that low ng L−1 level concentrations for six nitrosamines are associated with a 10−6 lifetime excess cancer risk.3 California's Division of Drinking Water has set 10 ng L−1 drinking water notification levels for three nitrosamines, and its Office of Environmental Health Hazard Assessment has established a 3 ng L−1 nonregulatory public health goal for N-nitrosodimethylamine (NDMA).4 The Australian Guidelines for Water Recycling established 10 ng L−1 guideline values for NDMA and NDEA, while Canada set a 40 ng L−1 maximum acceptable concentration for NDMA.5,6Human epidemiological studies have suggested some adverse health impacts resulting from exposure of PFAAs, including reports from the C8 Science Panel that link perfluorooctanoic acid (PFOA) to testicular and kidney cancer, as well as demonstrating an association between exposure to particular PFAAs (PFOA, perfluorooctane sulfonic acid (PFOS), and perfluorononanoic acid (PFNA)) and thyroid disease in children.7,8 The health impacts and the persistence of these chemicals led the 2010/2015 PFOA Stewardship Program to call for phasing out PFOA by 2015.9
A majority of nitrosamine research has focused on its formation from chloramination. However, formation with ozone has also been shown in full-scale and pilot-scale wastewater treatment.10–15 Nitrosamine formation during ozonation is generally limited to NDMA at relatively low concentrations (<25 ng L−1), but there are water matrices in which NDMA formation can exceed 100 ng L−1.14,15 There is a lack of information of PFAA formation during the ozonation of wastewaters. Given its efficacy in oxidizing a wide variety of trace organic contaminants16–19 and inactivating disinfectant-resistant microorganisms,20–24 ozone is becoming increasingly popular in water reuse applications. Unfortunately, conventional treatment processes are generally ineffective in reducing the concentrations of nitrosamines and PFAAs once they are present. Therefore, a greater understanding of formation during water and wastewater treatment is critical for minimizing human exposure to these contaminants via drinking water and the spread of these contaminants into the environment.
Some insight on ozone-reactive precursors has been gained in recent years, but there is still a gap in understanding the formation pathways.25–27 During ozonation of wastewaters, both molecular ozone and hydroxyl radicals are present. Previous research suggests hydroxyl radicals can either promote28 or reduce NDMA formation through reactions that lead to secondary amines and aldehydes.29 Hydroxyl radical scavenging with t-butanol (tBA) resulted in no change in NDMA formation during ozonation of river water; however, formation solely due to hydroxyl radicals was not investigated.30 One study found that dimethylamine (DMA), a low yield precursor, can result in substantially higher levels of NDMA upon ozonation at increasing pH from 6.5 to 10.5 in deionized water and groundwater,28 but there is no similar work for the impact of pH on NDMA formation in a wastewater matrix. These findings raise the concern of using ozone in potable reuse applications of reclaimed wastewaters that contain precursors such as DMA.
PFAAs are environmentally-persistent anthropogenic chemicals which have been found throughout the world, including remote regions such as the Arctic.31 Major uses for PFAAs are as surfactants, processing additives during fluoropolymer production, surface coatings for carpet and paper products, fire-fighting foam and electronic-etching baths. Production of some longer chain PFAAs has ceased, but, in general, PFAAs are still detected in water sources and can even increase in concentration through degradation of longer chain compounds and biodegradation of other fluorinated precursors.32–37 Several studies have shown that ozonation does not decrease PFAAs concentration.38–42 Results from other studies show a slight increase for some PFAAs after ozonation and Advanced Oxidation Process (AOP) experiments.41–43 Precursors present prior to ozone oxidation may generate other PFAAs. For example, indirect photolysis of precursor N-ethyl perfluorooctane sulfonamidoethanol (NEtFOSE) with artificial sunlight and hydroxyl radical can result in the formation of PFOA.44 Ozonation may lead to a similar outcome.
The objectives of this study were to assess which nitrosamines and PFAAs form upon ozonation of various treated wastewaters, to evaluate the potential role of molecular ozone versus hydroxyl radicals in causing the formation, and to characterize the role of pH. This study involved experiments with ozonation and advanced oxidation processes (AOPs), specifically O3/H2O2 and gamma radiolysis, to isolate the effects of ozone and hydroxyl radical on nitrosamine and PFAA formation.
2. Materials and methods
2.1 Wastewater samples
Wastewater matrices selected for this study were based on the survey of pilot-scale and full-scale water reclamation plants with ozonation that showed measurable formation of nitrosamines, investigated in previous work.15Table 1 shows a summary of the six U.S. wastewaters and sampling dates.| Abbrev. | State | Secondary/tertiary treatment type | SRT | Sampling dates |
|---|---|---|---|---|
| Notes: BOD = biological oxygen demand; MBR = membrane bioreactor; SRT = solids retention time. | ||||
| WW1 | NV | Partial nitrification and microfiltration (MBR pilot) | 4–6 days | August 1 and November 5, 2012 |
| WW2 | NV | Nitrification, denitrification, and microfiltration (MBR pilot) | 10–12 days | January 23, 2013 |
| WW3 | NV | Nitrification, partial denitrification, biological phosphorus removal | 8–12 days | August 20 and December 4, 2012 |
| WW4 | CA | BOD removal | 1–2 days | August 6, 2012 |
| WW5 | GA | Conventional activated sludge | 1–2 days | September 17, 2012 |
| WW6 | GA | Nitrification, partial denitrification, ultrafiltration | 5–10 days | October 4, 2012 |
Bulk wastewater was collected from a pilot-scale system (WW1, WW2) operated at distinctly different solids retention times (SRT) and biological conditions (e.g., partial nitrification and nitrification), from a full-scale treatment plant at the same location (WW3), and three other sites (WW4–6). The pilot-scale system (0.032 MGD) consisted of a fine screen, anoxic, anaerobic and aerobic stages, programmable control, and a HYDRAsub® (Hydranautics, Oceanside, CA) membrane bioreactor (MBR) with hollow-fiber, vacuum-type polyvinylidene fluoride (PVDF) membranes with a reinforced core, an outer diameter of 2.8 mm, and a nominal pore size of 0.40 μm. To produce WW1, the MBR pilot was operated such that the SRT was maintained at less than 6 days and hydraulic retention time (HRT) was approximately 4.4 hours. At these conditions, the influent ammonia decreased by approximately 50% in the filtrate. For WW2, the MBR pilot was operated such that SRT was at least 15 days. Although WW2 was not completely nitrified, it had significantly lower ammonia, total nitrogen, and fluorescence. Filtrate for bench-scale experimentation was collected after at least one SRT had elapsed.
WW3 is from a full-scale treatment plant (75 MGD) with primary clarification, biological phosphorus removal, and chlorination. The facility achieves nitrification and partial denitrification. Grab samples were collected from the secondary effluent before chlorination. WW4 was from a treatment plant (350 MGD) targeting only the removal of biochemical oxygen demand (BOD) (i.e., no nitrification or denitrification). Grab samples of secondary effluent were collected over several hours starting in the morning until early afternoon to simulate a composite sample; 24-hour composite sampling was not available. For WW5, 95% of the influent flow (total organic carbon (TOC) of 120 mg C L−1) is composed of industrial discharge from a denim plant. The 5.5-MGD treatment train includes preliminary treatment (aeration and adjustment to pH 8 with sulfuric acid), conventional activated sludge (CAS), coagulation, and ozonation (1200–1300 lb d−1) for color removal. Grab samples were collected prior to ozonation. WW6 came from a 42.5-MGD treatment plant achieving nitrification and partial denitrification. The treatment train includes primary clarification, CAS, high pH lime clarification, a split flow filtration step (ultrafiltration or recarbonation and dual-media filtration), pre-ozonation, biological activated carbon, and ozonation for final disinfection. Grab samples were collected before the pre-ozonation step. All collected wastewaters were stored at 4 °C prior to conducting the bench-scale experiments.
Corresponding water quality parameters for the six U.S. wastewaters included in this study are shown in ESI† Table S7. The six wastewaters varied by total organic carbon concentration, total phosphorus, ammonia, and total nitrogen representing a diverse mix of water qualities. The properties of dissolved organic matter also varied among the tested matrices, as indicated by the UV254 absorbance, specific UV254 absorbance (SUVA), total integrated fluorescence, and excitation–emission matrices (EEMs) shown in ESI† Fig. S1.
2.2 Analytical methods and chemicals
Full method details and chemicals are provided in the ESI.† A total of seven N-nitrosamines were included in this study: N-nitrosodimethylamine (NDMA), N-nitrosomethylethylamine (NMEA), N-nitrosodiethylamine (NDEA), N-nitrosodipropylamine (NDPA), N-nitrosomorpholine (NMOR), N-nitrosodibutylamine (NDBA), and N-nitrosodiphenylamine (NDPhA). The analysis was performed with isotope dilution using a modified version of U.S. EPA method 521.45 A Varian (Walnut Creek, CA) CP-3800 gas chromatograph with a CP-8400 auto sampler was used for all analyses. Analysis was performed using a Varian 4000 ion trap mass spectrometer (Walnut Creek, CA). N-Nitrosopiperidine and N-nitrosopyrrolidine were initially included in the analysis but were removed because matrix interference resulted in unreliable quantification. Because of thermal degradation upon injection, N-nitrosodiphenylamine was analyzed as diphenylamine. Quantitation was performed using isotope dilution. Method reporting limits (MRLs; Table 2) were established at three to five times the calculated method detection limit (MDL; n = 12).| Compound | MW (amu) | Precursor ion (m/z) | Product ion (m/z) | MRL (ng L−1) |
|---|---|---|---|---|
| a Analyzed as diphenylamine. b ()-confirmation product ions; MRL = method reporting limit; MRM = multiple reaction monitoring. | ||||
| NDMA | 74 | 75 | 47 (44, 43, 58)b | 2.5 |
| NMEA | 88 | 89 | 61 (47) | 2.5 |
| NDEA | 102 | 103 | 75 | 5.0 |
| NDPA | 130 | 131 | 89 | 10 |
| NMOR | 116 | 117 | 86 (87) | 5.0 |
| NDBA | 158 | 159 | 103 | 10 |
| NDPhA | 198 (169)a | 170 | 92 (143) | 10 |
A total of eight perfluoroalkyl acids were included in this study: perfluorobutyric acid (PFBA), perfluoropentanoic acid (PFPnA), perfluorohexanoic acid (PFHxA), perfluoroheptanoic (PFHpA), perfluorooctanoic acid (PFOA), perfluorobutane sulfonic acid (PFBS), perfluorohexane sulfonic acid (PFHxS), and perfluorooctane sulfonic acid (PFOS). PFAAs were analyzed using isotopic dilution, surrogate standard, or external calibration using a previously reported method that was adapted and expanded to include all analytes of interest.46 Tandem mass spectrometry was performed using an API 4000 triple quadrupole mass spectrometer (AB SCIEX, Foster City, CA) operated in electrospray ionization (ESI†) negative ionization mode. MRLs for each analyte (Table 3) were set conservatively at least five times the MDL and higher as needed in consideration of known and unanticipated background sources.
| Compound | MRM transition | Quantitation | MRL (ng L−1) |
|---|---|---|---|
| MRM = multiple reaction monitoring; MRL = method reporting limit. | |||
| PFBA | 213 > 169 | Isotope dilution ([13C4] PFBA) | 100 |
| PFPnA | 263 > 219 | Isotope dilution ([13C5] PFPnA) | 2 |
| PFHxA | 313 > 269 | Isotope dilution ([13C2] PFHxA) | 0.5 |
| PFHpA | 363 > 319 | Isotope dilution ([13C4] PFHpA) | 0.5 |
| PFOA | 413 > 369 | Isotope dilution ([13C4] PFOA) | 5 |
| PFBS | 299 > 99 | Surrogate standard ([18O2] PFHxS) | 0.25 |
| PFHxS | 399 > 80 | Isotope dilution ([18O2] PFHxS) | 0.25 |
| PFOS | 499 > 80 | Isotope dilution ([13C4] PFOS) | 0.25 |
The probe compound para-chlorobenzoic acid (pCBA) was used to indirectly measure hydroxyl radical concentration. Analysis followed a previously published method using the same column, mobile phases, and mass spectrometer as described previously.47
2.3 Bench-scale ozonation tests
Prior to bench-scale work, the wastewater samples were not filtered in the laboratory and no preservatives were added. As an initial step, wastewater pH was adjusted with 5 N sodium hydroxide or 3 N hydrochloric acid to pH 6, 7, or 8 depending on the test. Values were ±0.05 pH units as determined by a handheld pH meter.Ozonated water was generated using an oxygen-fed generator (Model CFS-1A, Ozonia North America, Inc., Elmwood Park, NJ) to diffuse ozone into reagent-grade water as described previously.48 Reagent water was stirred and cooled in a water-jacketed container as ozone bubbled in through a diffuser. Ozone venting out of the container was quenched as it bubbled through aqueous potassium iodide solutions. The ozone stock was typically between 65 and 85 mg O3 L−1, based on measurements by an indigo method using a Hach DR 5000, UV/Vis spectrometer (Hach, Loveland, CO).49 For consistency among wastewaters, the amount of ozonated water added was based on the initial TOC and the desired ozone dosing, targeting specific mass-based ozone to TOC ratios (e.g., O3:TOC = 0.5). These ratios were calculated using the final TOC of the sample, which accounted for dilution from the ozone stock. After ozone addition, the container was closed and mixed. When the ozone residual was depleted, as determined through ozone decay tests, the finished water was transferred to sample containers with appropriate quenching agents for the different analyses. Some tests required additional spikes, which were added prior to the addition of ozonated water. These spikes included hydrogen peroxide at a 2:1 molar ratio of O3:H2O2 to promote the production of hydroxyl radicals; 1000 μg L−1 (6.4 μM) pCBA for assessing hydroxyl radical formation; and 100 mM tBA for selectively quenching hydroxyl radicals.50 Hydrogen peroxide concentration was measured using a Hach Model HYP-1 kit. Hydroxyl radical exposure, ∫[˙OH]dt (M s), was quantified using eqn 1:
 | (1) |
2.4 Radiolysis
Radiolysis was performed to investigate formation due to hydroxyl radicals only. Aqueous electrons and hydroxyl radicals are formed by direct gamma radiolysis of the water.51 Aqueous electrons are scavenged by nitrous oxide (N2O) to form N2O−, which decomposes to N2 and O˙−. The O˙− is subsequently protonated by water to form ˙OH. Wastewater or reagent water was saturated with N2O gas for 1 hour. Any pH adjustment was performed prior to N2O saturation. Some samples were spiked with pCBA and tBA after N2O saturation. Samples were shipped overnight on ice in amber glass containers to the Radiation Laboratory at the University of Notre Dame. The samples were subjected to gamma irradiation at a rate of 2.05 (or 44 in some cases) Gray units per minute (Gy min−1) with a Shepard 109-68 60Co source at specific time lengths (2–20 min) corresponding to different hydroxyl radical concentrations.2.5 Experimental matrix
The bench-scale experiments examined the influence of ozone dose at pH 7 with O3:TOC ratios 0.2, 0.5, and 1.0. Additional tests were done for WW1 and WW4 at O3:TOC ratios of 0.1, 0.3 and 0.4 and for WW2 and WW6 at an O3:TOC ratio of 0.75. Tests investigating pH variation (pH = 6, 7, or 8) for WW1, WW3, WW4 and WW5 were performed at an O3:TOC ratio of 0.2. The impact of hydrogen peroxide addition (O3:H2O2 = 0.5) on nitrosamine formation was investigated for all six wastewaters at pH = 7, O3:TOC ratios of 0.5 and 1.0 for the nitrosamines and 1.5 and 2.0 for PFAAs. Radiolysis was investigated for WW1, WW2 and WW3 at pH = 7 using 88 and 176 Gy gamma radiation doses, defined as “Dose 1” and “Dose 2,” respectively.
3. Results and discussion
3.1 N-Nitrosamines
:TOC ratios)
| O3:TOC ratio |
WW1 | WW2 | WW3 | WW4 | WW5 | WW6 |
|---|---|---|---|---|---|---|
| N/A = not available. | ||||||
| 0 | 5.9 | 5.0 | 5 | 24.4 | 22.5 | 10.7 |
| 0.1 | 7.1 | N/A | N/A | N/A | N/A | N/A |
| 0.2 | 9.2 | 10.5 | 11.0 | 29.3 | 26.8 | 10.5 |
| 0.3 | 15.4 | N/A | N/A | 31.7 | N/A | N/A |
| 0.4 | N/A | N/A | N/A | 29.3 | N/A | N/A |
| 0.5 | N/A | N/A | N/A | 37.8 | N/A | 16.1 |
| 0.6 | N/A | N/A | N/A | N/A | N/A | N/A |
| 0.7 | N/A | N/A | N/A | N/A | N/A | 21.8 |
| 0.8 | N/A | 16.5 | N/A | N/A | N/A | N/A |
| 0.9 | N/A | N/A | N/A | N/A | N/A | 21.5 |
| 1.0 | 19.8 | N/A | 24.2 | 76.8 | 36.6 | N/A |
There was minimal formation of the other six nitrosamines after ozonation. NMEA in WW1 was below the reporting limit (<5.5 ng L−1) in the ambient sample; a slight formation (up to 7.4 ng L−1) was observed when ozonated at O3:TOC > 1.0 (ESI† Table S8). This occurred on one sampling occasion; however, no NMEA was detected on a second sampling occasion. NDEA was detected in WW5 (18 ng L−1) when ozonated at O3:TOC = 1.0 (<14 ng L−1 in the ambient sample before ozonation). NMOR was present in three wastewaters (WW3, WW4, and WW6; 12–17 ng L−1), but did not increase with greater O3:TOC ratios. Compared to NDMA, these nitrosamines did not show a strong formation with ozonation, which is consistent with previous research.15 Thus, the following sections will focus on NDMA only.
:TOC ratio of 0.20 (Fig. S2†). The addition of ozone at pH 7 was performed in triplicate. The pH of ozonated water is potentially significant because ozone decomposition to hydroxyl radicals is more rapid at higher pH.52 Furthermore, higher NDMA formation at elevated pH in deionized water and groundwater28 suggests that the hydroxyl radical may be more critical than ozone for NDMA formation. However, there was only a slight increase in NDMA formation from pH 6 to 8 in the current study (Fig. S2†). While this supports the previous research, the attenuated trend may be related to rapid conversion of molecular ozone to hydroxyl radicals through NOM-mediated pathways53,54 and/or the relatively small O3:TOC ratio and pH range tested. These results indicate that changing the pH prior to ozonation (at least within a relatively neutral pH range) may not be a useful NDMA mitigation strategy in wastewater applications. A combination of higher O3:TOC ratios and higher pH will likely exacerbate the extent of NDMA formation and increase the need for post-ozone NDMA mitigation.
:TOC ratios of 0.5 and 1.0 resulted in NDMA formation (Fig. 1). Similar to previous findings,12 the differences in NDMA formation for ozone versus O3/H2O2 were minimal (except for WW4), and neither process was consistently worse in terms of NDMA formation. The only conclusive result from the experiments was that O3/H2O2 was ineffective in mitigating NDMA formation (at least when using a typical molar O3:H2O2 ratio of 1.0).
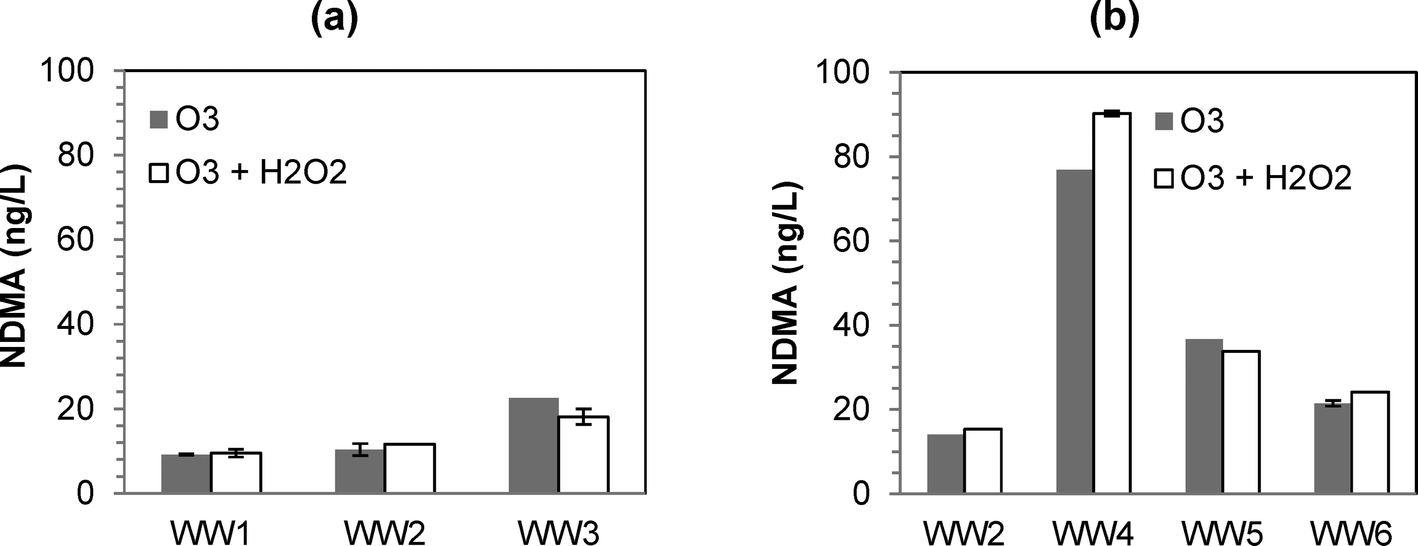 | ||
| Fig. 1 Formation of NDMA at various ozone and peroxone (O3/H2O2) dosing conditions: (a) for WW1, WW2, and WW3 at O3:TOC of 0.5; (b) for WW2, WW4, WW5, and WW6 at O3:TOC of 1.0. | ||
A separate set of experiments was performed after spiking pCBA into the wastewater matrices and then exposing them to the same ozone and peroxone dosing conditions. Changes in pCBA concentration were used to calculate the overall hydroxyl radical exposure, ∫[˙OH]dt (M s), as summarized in Table 5. The results indicate that ozone and O3/H2O2 achieve similar hydroxyl radical exposures, despite the common classification of O3/H2O2 as an AOP and ozone as a conventional oxidant. Other studies reported similar findings: ozonation does not require the addition of H2O2 to achieve significant hydroxyl radical exposure,56–59 particularly in wastewater matrices with relatively high concentration of dissolved organic matter.60
| WW1 | WW2 | WW3 | |
|---|---|---|---|
| N/A = not available. | |||
| Ozone dosing condition | |||
| O3:TOC = 0.50 |
2.92 × 10⁻¹¹ | 7.76 × 10⁻¹¹ | 8.40 × 10⁻¹¹ |
| O3:TOC = 0.50 (H2O2) |
2.06 × 10⁻¹¹ | 6.68 × 10⁻¹¹ | 1.31 × 10⁻¹⁰ |
| O3:TOC = 2.0 |
1.45 × 10⁻¹⁰ | 4.86 × 10⁻¹⁰ | 4.41 × 10⁻¹⁰ |
| O3:TOC = 2.0 (H2O2) |
1.76 × 10⁻¹⁰ | 5.72 × 10⁻¹⁰ | 5.32 × 10⁻¹⁰ |
| Radiation dose (Gy) | |||
| 88 (Dose 1) | 6.01 × 10⁻¹¹ | N/A | N/A |
| 176 (Dose 2) | 1.27 × 10⁻¹⁰ | 7.62 × 10⁻¹⁰ | 6.83 × 10⁻¹⁰ |
| 264 | 2.01 × 10⁻¹⁰ | 1.37 × 10⁻⁹ | 1.07 × 10⁻⁹ |
NDMA formation was monitored in samples with and without addition of 100 mM tBA at pH 7.0. One set of samples was ozonated at an O3:TOC ratio of 0.5 with no H2O2 addition, and another set of samples was ozonated at an O3:TOC ratio 0.5 and a molar O3/H2O2 ratio of 2.0. The tBA spike at 100 mM effectively scavenges all of the ˙OH at an O3:TOC of 2.0, as shown by ESI† Fig. S3. Fig. 2 shows NDMA formation in WW1, WW2, and WW3 for the aforementioned dosing conditions. Similar to the previous results, similar NDMA formation was observed with and without the addition of H2O2. However, significantly more NDMA was observed with the addition of tBA prior to ozonation for both ozone and O3/H2O2. These results indicate that NDMA formation is favored by the presence of molecular ozone.
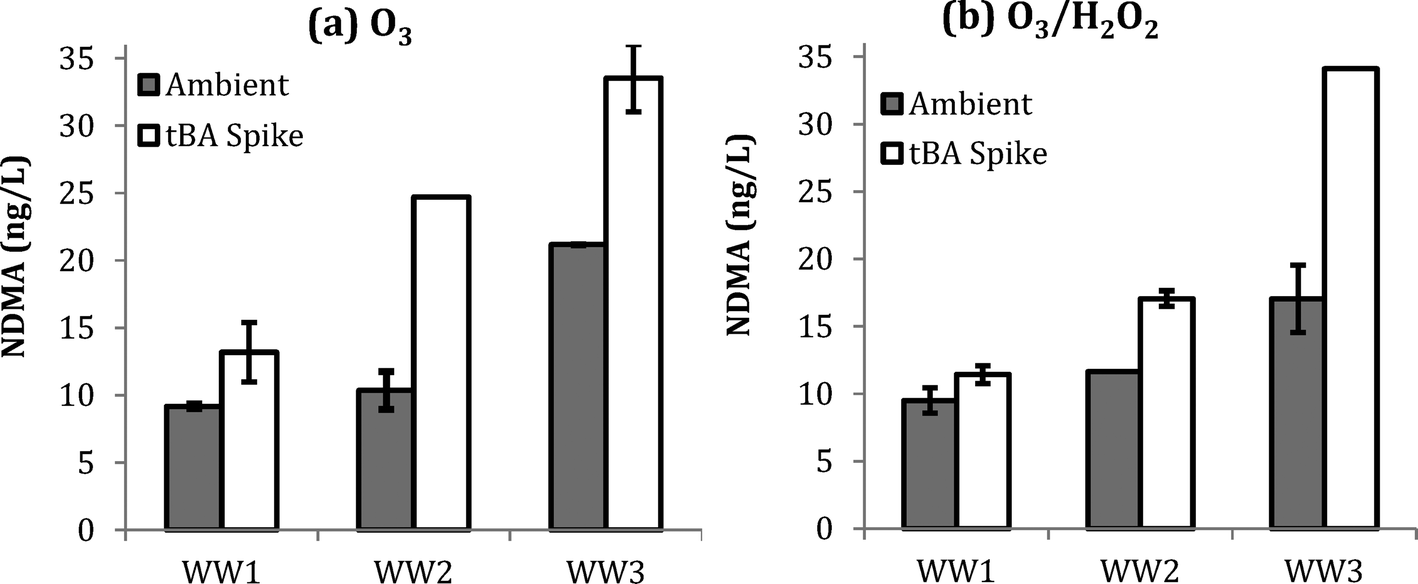 | ||
| Fig. 2 Formation of NDMA in WW1, WW2, and WW3 with and without the addition of tBA at an initial pH of 7. Experiments were performed with an O3:TOC ratio of 0.5: (a) O3 and (b) O3/H2O2 at a molar O3/H2O2 ratio of 2.0. Note: error bars represent ±1 standard deviation based on n = 2 replicates. | ||
One hypothesis is that effective scavenging of ˙OH radicals by tBA increased the available molecular ozone by preventing ozone consumption53 and secondly minimized the degradation of unknown precursors, thereby resulting in more NDMA formation. In practice, these results suggest that wastewater with higher ˙OH scavenging may also lead to higher NDMA formation during ozonation. Higher ˙OH scavenging is typically associated with higher levels of dissolved organic matter and bicarbonate/carbonate ions, which are characteristic of wastewater matrices.53,58,59
Radiolysis experiments were performed to isolate the contribution of hydroxyl radicals. Radiolysis allows for in-situ generation of hydroxyl radicals without the addition of ozone. Gamma radiation experiments targeted similar hydroxyl radical exposures that were generated during ozonation experiments. Changes in pCBA concentration were used to assess the ˙OH exposure, ∫[˙OH]dt (M s) (Table 5). During radiolysis experiments, there was no NDMA formation observed in any of the wastewater samples. In order to verify that the radiolysis did not destroy NDMA at a rate possibly greater than it was formed, a control experiment was performed with NDMA spiked at 500 μg L−1. Even at the higher tested dose of 176 Gy, there was less than 4% degradation. While considerable ˙OH exposure was achieved during the radiolysis experiments (up to 7.62 × 10⁻¹⁰ M s), it was not sufficiently high to achieve any significant degradation of NDMA. Other studies that evaluated NDMA destruction during ozonation and advanced oxidation processes found that degradation is limited by the extent of promotion of hydroxyl radicals and the overall hydroxyl radical scavenging rate.55,61 Even if degradation of NDMA is initiated, there is a possibility of a regeneration pathway due to the presence of other organic compounds and oxygen that may further decrease overall treatment efficiency.62 However, the lack of formation of NDMA during these experiments, confirms that NDMA formation is due to reactions associated with molecular ozone.
3.2 Perfluoroalkyl acids
:TOC ratio. The net increase was lower for WW2, WW3, and WW6, which were similar in water quality (i.e., UV254, TOC) and wastewater treatment (i.e., nitrification, partial denitrification, SRT ~10 days). WW5 showed the highest ambient level (7324 ng L−1) and formation of PFHxA (1831 ng L−1), and the formation was also directly correlated with O3:TOC ratio. A similar trend was observed for PFBA, which increased from ambient level of 789 ng L−1 to 930 ng L−1 after ozonation of WW5. WW5 was the only matrix with a large fraction of industrial wastewater, which originated from a denim clothing manufacturing plant. PFBA levels were below the reporting levels (<100 ng L−1) for the other wastewaters that came from facilities with primarily municipal run-off. PFBS increased in WW1–3 and WW6. PFPnA increased only in WW1 after ozonation. Formation of other PFAAs in all wastewaters at various ozone dosing conditions are provided in ESI† (Fig. S4 through S9).
:TOC ratios). Standard deviations are provided in parentheses, when available, based on n = 3 replicates
| O3:TOC ratio |
WW1 | WW2 | WW3 | WW4 | WW5 | WW6 |
|---|---|---|---|---|---|---|
| N/A = not available. | ||||||
| 0 | 10.9 | 14.1 | 14.3 (1.6) | 11.1 | 7324 | 19.5 |
| 0.1 | N/A | N/A | N/A | 14.6 | N/A | N/A |
| 0.2 | 15.4 | N/A | 14.3 | 14.6 (1.2) | 8310 | N/A |
| 0.3 | N/A | N/A | N/A | 15.9 | N/A | N/A |
| 0.4 | N/A | N/A | N/A | 15.9 | N/A | N/A |
| 0.5 | 13.2 | 18.8 | N/A | 17.1 | N/A | 25.3 |
| 1.0 | 14.8 (0.78) | 16.5 (0.0) | 15.4 | 22.0 | 9155 | 24.1 |
| 1.5 | N/A | 18.8 | N/A | N/A | N/A | 23.0 |
| 2.0 | N/A | 17.6 | N/A | N/A | N/A | 23.0 (0.0) |
 | ||
| Fig. 3 PFAA formation for WW1 after ozonation with and without H2O2 addition at O3:TOC = 1.0 and initial pH 7.0. | ||
 | ||
| Fig. 4 Changes in PFHxA (a) and PFBS (b) for WW1, WW2, and WW3 after ozonation with and without tBA addition at O3:TOC = 1.0 for WW1 and O3:TOC = 2.0 for WW2 and WW3. | ||
Similar results were observed for PFBS formation during ozonation (with and without tBA addition), further supporting the molecular ozone pathway. Results for five detected PFAAs for WW1, WW2, and WW3 are shown in ESI† (Fig. S12, S13, and S14).
Compared to ozonation experiments, radiolysis tests (Dose 1 = 88 Gy and Dose 2 = 176 Gy) did not result in significant formation of PFBS (Fig. 5). In fact, a negative change in PFBS concentration of 0.2–0.3 ng L−1 was observed in WW1–3, presumably due to the destruction of PFBS during radiolysis. Formation of PFHxA during radiolysis experiments was at 2.0 ± 0.3 ng L−1 in WW1, 2.5 ± 0.7 ng L−1 for WW2, and 1.0 ± 0.0 for WW3. Compared to ozonation results from Fig. 5, smaller increases in PHxA and negative changes in PFBS, would indicate that molecular ozone is more critical in the formation of these PFAAs during ozonation of wastewater. Results for the other PFAAs in WW1, WW2, and WW3 are shown in ESI† (Fig. S15, S16, and S17). Although there have been reports that some PFAAs may be amenable to degradation by AOP (e.g., persulfate63), the current study indicates that hydroxyl radicals are ineffective for PFAA mitigation with the given wastewaters and dosing conditions.
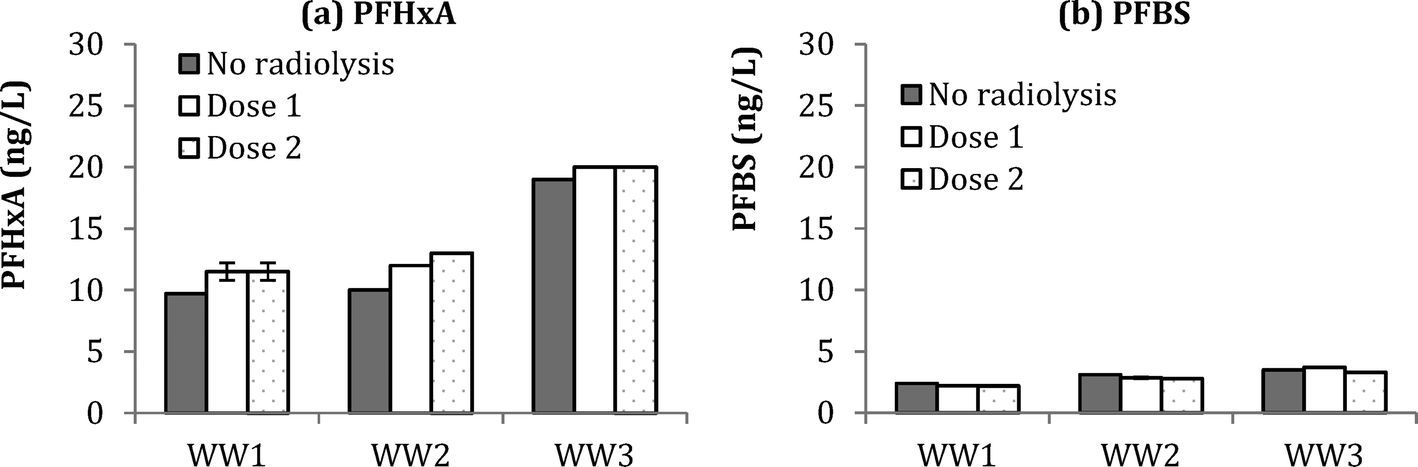 | ||
| Fig. 5 Change in PFHxA (a) and PFBS (b) for WW1, WW2, and WW3 before and after radiolysis (Dose 1 = 88 Gy and Dose 2 = 176 Gy). | ||
4. Conclusions
The formation of NDMA, PFHxA, and PFBS was observed during ozonation with and without the addition of H2O2 and tBA. Although the formation of NDMA was somewhat dose-dependent, NDMA concentrations started to plateau at O3:TOC > 0.5 in a majority of the wastewater matrices tested in this study. For half of the treated wastewaters, PFHxA and PFBS reached its maximum formation at O3:TOC > 1.0, whereas for the other wastewaters the maximum was achieved between 0 and 0.5 O3:TOC. As demonstrated in bench-scale testing, molecular ozone was identified as the primary oxidant responsible for the formation of NDMA, PFHxA, and PFBS. The addition of H2O2 and/or pH adjustment proved to be ineffective in mitigating the formation of these byproducts.
Based on the results of this study and previous studies in the literature, significant nitrosamine and PFAA occurrence and formation during ozonation appear to be limited to specific wastewater matrices, particularly those impacted by industrial discharges. Unfortunately, there is currently an insufficient understanding of the specific NDMA and PFAA precursors that are reactive toward ozone and present in U.S. wastewaters. Therefore, there is a need to identify these compounds so appropriate source control and/or pretreatment strategies can be employed in wastewater treatment plants with ozone, particularly in potable reuse applications. In addition, research is needed to better understand the effects of wastewater constituents (e.g., inorganic anions, metals, effluent organic matter) on NDMA and PFAA formation mechanisms.
Acknowledgements
The authors would like to thank current and past members of the Water Quality Research and Development Division at the Southern Nevada Water Authority, including Brett Vanderford and Dr. Eric Wert for project guidance; Rebecca Trenholm for nitrosamines analysis and Oscar Quiñones for PFAA analysis; Dr. Riley Flowers, Dr. Yue Wang, and Michael Strileski for WW1–3 sample support; Janie Zeigler-Holady, Josephine Chu and interns for sample preparation and coordination; David Rexing and Jennifer Fuel for administrative support. The authors would also like to thank the technology partners, particularly Hydranautics and APTwater (now ULTURA) for their generous contributions of MBR and ozone pilots for the project's use. The personnel at the various wastewater utilities were instrumental in the design, scheduling, and implementation of the sampling efforts. The radiolysis experiments were carried out at the Notre Dame Radiation Laboratory, which is supported by the Division of Chemical Sciences, Geosciences, and Biosciences, Office of Basic Energy Sciences of the U.S. Department of Energy. This study was made possible through funding from the WateReuse Research Foundation (WRF-11-08). The comments and views detailed herein may not necessarily reflect the views of the WateReuse Research Foundation, its officers, directors, employees, affiliates or agents.References
- U.S. EPA, Contaminant Candidate List 3 – CCL3. 2015. November 12, 2014 2014 [cited February 12 2015]. Available from http://www2.epa.gov/ccl/contaminant-candidate-list-3-ccl-3.
- U.S. EPA, Unregulated Contaminant Monitoring Program. 2015. September 10, 2012 2015 [cited February 12 2015]. Available from http://water.epa.gov/lawsregs/rulesregs/sdwa/ucmr/.
- U.S. EPA, Integrated Risk Information System (IRIS). 2015. February 6, 2015 2015 [cited February 12 2015]. Available from http://www.epa.gov/iris/.
- U.S. CA State Waterboard, NDMA and Other Nitrosamines – Drinking Water Issues. 2015. September 4, 2014 2014 [cited February 12 2015]. Available from http://www.waterboards.ca.gov/drinking_water/certlic/drinkingwater/NDMA.shtml.
- EPHC, NHMRC, and NRMMC, 2008. Australian guidelines for water recycling: managing health and environmental risks (Phase 2): augmentation of drinking water supplies. Prepared for Environment Protection and Heritage Council, National Health and Medical Research Council, and Natural Resource Management Ministerial Council. Canberra: Biotext Pty Ltd. Search PubMed.
- Health Canada, Guidelines for Canadian drinking water quality. Guideline technical document. N-Nitrosodimethylamine (NDMA). 2011, Ottawa, ON Search PubMed.
- V. Barry, A. Windquist and K. Steenland, Perfluorooctanoic acid (PFOA) exposure and incident cancers among adults living near a chemical plant, Environ. Health Perspect., 2013, 121(11–12), 1313–1318 Search PubMed.
- M.-J. M. Lopez-Espinosa, D. Mondal, B. Armstrong, M. S. Bloom and T. Fletcher, Thyroid function and perfluoroalkyl acids in children living near a chemical plant, Environ. Health Perspect., 2012, 120(7), 1036–1041 CrossRef PubMed.
- U.S. EPA, 2010/2015 PFOA Stewardship Program, http://www.epa.gov/opptintr/pfoa/pubs/stewardship/.
- Y.-Y. Zhao, J. M. Boyd, M. Woodbeck, R. C. Andrews, F. Qin, S. E. Hrudey and X.-F. Li, Formation of N-nitrosamines from eleven disinfection treatments of seven different surface waters, Environ. Sci. Technol., 2008, 42(13), 4857–4862 CrossRef CAS.
- M. Oya, K. Kosaka, M. Asami and S. Kunikane, Formation of N-nitrosodimethylamine (NDMA) by ozonation of dyes and related compounds, Chemosphere, 2008, 73(11), 1724–1730 CrossRef CAS PubMed.
- A. N. Pisarenko, B. D. Stanford, D. Yan, D. Gerrity and S. A. Snyder, Effects of ozone and ozone/peroxide on trace organic contaminants and NDMA in drinking water and water reuse applications, Water Res., 2012, 46(2), 316–326 CrossRef CAS PubMed.
- K. Kosaka, M. Asami, K. Ohkubo, T. Iwamoto, Y. Tanaka, H. Koshino, S. Echigo and M. Akiba, Identification of a new N-nitrosodimethylamine precursor in sewage containing industrial effluents, Environ. Sci. Technol., 2014, 48(19), 11243–11250 CrossRef CAS PubMed.
- M. Sgroi, P. Roccaro, G. L. Oelker and S. A. Snyder, N-Nitrosodimethylamine formation upon ozonation and identification of precursors source in a municipal wastewater treatment plant, Environ. Sci. Technol., 2014, 48(17), 10308–10315 CrossRef CAS PubMed.
- D. Gerrity, A. N. Pisarenko, E. Marti, R. A. Trenholm, F. Gerringer, J. Reungoat and E. Dickenson, Nitrosamines in pilot-scale and full-scale wastewater treatment plants with ozonation, Water Res., 2015, 72, 251–261 CrossRef CAS PubMed.
- M. M. Huber, S. Canonica, G.-Y. Park and U. von Gunten, Oxidation of pharmaceuticals during ozonation and advanced oxidation processes, Environ. Sci. Technol., 2003, 37(5), 1016–1024 CrossRef CAS.
- M. M. Huber, A. Goebel, A. Joss, N. Hermann, D. Loeffler, C. S. McArdell, A. Ried, H. Siegrist, T. A. Ternes and U. Von Gunten, Oxidation of pharmaceuticals during ozonation of municipal wastewater effluents: a pilot study, Environ. Sci. Technol., 2005, 39(11), 4290–4299 CrossRef CAS.
- E. C. Wert, F. L. Rosario-Ortiz and S. A. Snyder, Effect of ozone exposure on the oxidation of trace organic contaminants in wastewater, Water Res., 2009, 43(4), 1005–1014 CrossRef CAS PubMed.
- Y. Lee, D. Gerrity, M. Lee, A. E. Bogeat, E. Salhi, S. Gamage, R. A. Trenholm, E. C. Wert, S. A. Snyder and U. von Gunten, Prediction of micropollutant elimination during ozonation of municipal wastewater effluents: use of kinetic and water specific information, Environ. Sci. Technol., 2013, 47(11), 5872–5881 CrossRef CAS PubMed.
- J. E. Peeters, E. A. Mazas, W. J. Masschelein, I. Villacorta Martiez de Maturana and E. Debacker, Effect of disinfection of drinking water with ozone or chlorine dioxide on survival of Cryptosporidium parvum oocysts, Appl. Environ. Microbiol., 1989, 55(6), 1519–1522 CAS.
- J. L. Rennecker, B. J. Mariñas, J. H. Owens and E. W. Rice, Inactivation of Cryptosporidium parvum oocysts with ozone, Water Res., 1999, 33(11), 2481–2488 CrossRef CAS.
- N. Burns, G. Hunter, A. Jackman, B. Hulsey, J. Coughenour and T. Walz, The return of ozone and the hydroxyl radical to wastewater disinfection, Ozone: Sci. Eng., 2007, 29, 303–306 CrossRef CAS PubMed.
- P. Talbot, L. Martinelli, S. Talvy, E. Chauveheid and B. Haut, Ozone inactivation of resistant microorganisms: laboratory analysis and evaluation of the efficiency of plants, Water Res., 2012, 46(18), 5893–5903 CrossRef CAS PubMed.
- S. Gamage, D. Gerrity, A. N. Pisarenko, E. C. Wert and S. A. Snyder, Evaluation of process control alternatives for the inactivation of Escherichia coli, MS2 bacteriophage, and Bacillus subtilis spores during wastewater ozonation, Ozone: Sci. Eng., 2013, 35(6), 501–513 CrossRef CAS PubMed.
- E. J. Marti, A. N. Pisarenko, J. R. Peller and E. R. V. Dickenson, N-Nitrosodimethylamine (NDMA) formation from the ozonation of model compounds, Water Res., 2015, 72, 262–270 CrossRef CAS PubMed.
- U. von Gunten, E. Salhi, C. K. Schmidt and W. A. Arnold, Kinetics and mechanisms of N-nitrosodimethylamine formation upon ozonation of N,N-dimethylsulfamide-containing waters:bromide catalysis, Environ. Sci. Technol., 2010, 44(15), 5762–5768 CrossRef CAS PubMed.
- J. Nawrocki and P. Andrzejewski, Nitrosamines and water, J. Hazard. Mater., 2011, 189(1–2), 1–18 CrossRef CAS PubMed.
- P. Andrzejewski, B. Kasprzyk-Hordern and J. Nawrocki, N-Nitrosodimethylamine (NDMA) formation during ozonation of dimethylamine-containing waters, Water Res., 2008, 42(4–5), 863–870 CrossRef CAS PubMed.
- F. Munoz and C. von Sonntag, The reactions of ozone with tertiary amines including the complexing agents nitrilotriacetic acid (NTA) and ethylenediaminetetraacetic acid (EDTA) in aqueous solution, Perkin 2, 2000, 10, 2029–2033 RSC.
- K. Kosaka, M. Asami, Y. Konno, M. Oya and S. Kunikane, Identification of antiyellowing agents as precursors of N-nitrosodimethylamine production on ozonation from sewage treatment plant influent, Environ. Sci. Technol., 2009, 43(14), 5236–5241 CrossRef CAS.
- J. W. Martin, M. M. Smithwick, B. M. Braune, P. F. Hoekstra, D. C. G. Muir and S. A. Mabury, Identification of long-chain perfluorinated acids in biota from the Canadian Arctic, Environ. Sci. Technol., 2004, 38(2), 373–380 CrossRef CAS.
- M. J. A. Dinglasan, Y. Ye, E. A. Edwards and S. A. Mabury, Fluorotelomer alcohol biodegradation yields poly- and perfluorinated acids, Environ. Sci. Technol., 2004, 38(10), 2857–2864 CrossRef CAS.
- B. Boulanger, J. D. Vargo, J. L. Schnoor and K. C. Hornbuckle, Evaluation of perfluorooctane surfactants in a wastewater treatment system and in a commercial surface protection product, Environ. Sci. Technol., 2005, 39(15), 5524–5530 CrossRef CAS.
- H. Lee, J. Deon and S. A. Mabury, Biodegradation of polyfluoroalkyl phosphates as a source of perfluorinated acids to the environment, Environ. Sci. Technol., 2010, 44(9), 3305–3310 CrossRef CAS PubMed.
- N. Wang, B. Szostek, R. C. Buck, P. W. Folsom, L. M. Sulecki, V. Capka, W. R. Berti and J. T. Gannon, Fluorotelomer alcohol biodegradation direct evidence that perfluorinated carbon chains breakdown, Environ. Sci. Technol., 2005, 39(19), 7516–7528 CrossRef CAS.
- N. Wang, J. Liu, R. C. Buck, S. H. Korzeniowski, B. W. Wolstenholme, P. W. Folsom and L. M. Sulecki, 6:2 Fluorotelomer sulfonate aerobic biotransformation in activated sludge of waste water treatment plants, Chemosphere, 2011, 82(6), 853–858 CrossRef CAS PubMed.
- J. W. Martin, S. A. Mabury and P. J. O' Brien, Metabolic products and pathways of fluorotelomer alcohols in isolated rat hepatocytes, Chem.-Biol. Interact., 2005, 155(3), 165–180 CrossRef CAS PubMed.
- C. Kunacheva, S. Fujii, S. Tanaka, S. K. Boontanon, S. Poothong, T. Wongwatthana and B. R. Shivakoti, Perfluorinated compounds contamination in tap water and bottled water in Bangkok, Thailand, J. Water Supply: Res. Technol. - AQUA, 2010, 59(5), 345–354 CrossRef CAS.
- O. Quiñones and S. A. Snyder, Occurrence of perfluoroalkyl carboxylates and sulfonates in drinking water utilities and related waters from the United States, Environ. Sci. Technol., 2009, 43(24), 9089–9095 CrossRef PubMed.
- S. Takagi, F. Adachi, K. Miyano, Y. Koizumi, H. Tanaka, I. Watanabe, S. Tanabe and K. Kannan, Fate of perfluorooctanesulfonate and perfluorooctanoate in drinking water treatment processes, Water Res., 2011, 45(13), 3925–3932 CrossRef CAS PubMed.
- H. F. Schroder and R. J. W. Meesters, Stability of fluorinated surfactants in advanced oxidation processes – A follow up of degradation products using flow injection-mass spectrometry, liquid chromatography–mass spectrometry and liquid chromatography–multiple stage mass spectrometry, J. Chromatogr. A, 2005, 1082, 110–119 CrossRef PubMed.
- B. R. Shivakoti, S. Fujii, M. Nozoe, S. Tanaka and C. Kunacheva, Perfluorinated chemicals (PFCs) in water purification plants (WPPs) with advanced treatment processes, Water Sci. Technol.: Water Supply, 2010, 10(1), 87–95 CrossRef CAS.
- E. F. Houtz and D. L. Sedlak, Oxidative conversion as a means of detecting precursors to perfluoroalkyl acids in urban runoff, Environ. Sci. Technol., 2012, 46(17), 9342–9349 CrossRef CAS PubMed.
- M. H. Plumlee, K. McNeill and M. Reinhard, Indirect photolysis of perfluorochemicals: hydroxyl radical-initiated oxidation of N-ethyl perfluorooctane sulfonamido acetate (N-EtFOSAA) and other perfluoroalkanesulfonamides, Environ. Sci. Technol., 2009, 43(10), 3662–3668 CrossRef CAS.
- J. C. Holady, R. A. Trenholm and S. A. Snyder, Analysis of NDMA and other nitrosamines in water using automated solid phase extraction and gas chromatography–tandem mass spectrometry, Am. Lab., 2012, 44(3), 25–30 CAS.
- T. D. Appleman, C. P. Higgins, O Quiñones, B. J. Vanderford, C. Kolstad, J. C. Zeigler-Holady and E. R. V. Dickenson, Treatment of poly- and perfluoroalkyl substances in U.S. full-scale water treatment systems, Water Res., 2014, 41, 246–255 CrossRef PubMed.
- B. J. Vanderford, F. L. Rosario-Ortiz and S. A. Snyder, Analysis of p-chlorobenzoic acid in water by liquid chromatography–tandem mass spectrometry, J. Chromatogr. A, 2007, 1164(1–2), 219–223 CrossRef CAS PubMed.
- E. C. Wert, F. L. Rosario-Ortiz and S. A. Snyder, Effect of ozone exposure on the oxidation of trace organic contaminants in wastewater, Water Res., 2009, 43(4), 1005–1014 CrossRef CAS PubMed.
- K. L. Rakness, E. C. Wert, M. Elovitz and S. Mahoney, Operator-friendly technique and quality control considerations for indigo colorimetric measurement of ozone residual, Ozone: Sci. Eng., 2010, 32(1), 33–42 CrossRef CAS PubMed.
- E. L. Yong and Y.-P. Lin, Incorporation of initiation, promotion and inhibition in the Rct concept and its application in determining the initiation and inhibition capacities of natural water in ozonation, Water Res., 2012, 46(6), 1990–1998 CrossRef CAS PubMed.
- J. Peller, O. Wiest and P. V. Kamat, Mechanism of hydroxyl radical-induced breakdown of the herbicide 2,4-dichlorophenoxyacetic acid (2,4-D), Chem. – Eur. J., 2003, 9(21), 5379–5387 CrossRef CAS PubMed.
- M. S. Elovitz, U. von Gunten and H.-P. Kaiser, Hydroxyl radical/ozone ratios during ozonation processes. II. The effect of temperature, pH, alkalinity, and DOM properties, Ozone: Sci. Eng., 2000, 22(2), 123–150 CrossRef CAS PubMed.
- U. von Gunten, Ozonation of drinking water: Part I. Oxidation kinetics and product formation, Water Res., 2003, 37(7), 1443–1467 CrossRef CAS.
- M. O. Buffle, J. Schumacher, E. Salhi, M. Jekel and U. von Gunten, Measurement of the initial phase of ozone decomposition in water and wastewater by means of a continuous quench-flow system: application to disinfection and pharmaceutical oxidation, Water Res., 2006, 40(9), 1884–1894 CrossRef CAS PubMed.
- C. Lee, J. Yoon and U. Von Gunten, Oxidative degradation of N-nitrosodimethylamine by conventional ozonation and the advanced oxidation process ozone/hydrogen peroxide, Water Res., 2007, 41(3), 581–590 CrossRef CAS PubMed.
- T. Nöthe, H. Fahlenkamp and C. V. Sonntag, Ozonation of wastewater: rate of ozone consumption and hydroxyl radical yield, Environ. Sci. Technol., 2009, 43(15), 5990–5995 CrossRef.
- J. P. Pocostales, M. M. Sein, W. Knolle, C. von Sonntag and T. C. Schmidt, Degradation of ozone-refractory organic phosphates in wastewater by ozone and ozone/hydrogen peroxide (peroxone): the role of ozone consumption by dissolved organic matter, Environ. Sci. Technol., 2010, 44(21), 8248–8253 CrossRef CAS PubMed.
- M. M. Dong, S. P. Mezyk and F. L. Rosario-Ortiz, Reactivity of effluent organic matter (EfOM) with hydroxyl radical as a function of molecular weight, Environ. Sci. Technol., 2010, 44(15), 5714–5720 CrossRef CAS PubMed.
- W. T. M. Audenaert, D. Vandierendonck, S. W. H. Van Hulle and I. Nopens, Comparison of ozone and HO˙ induced conversion of effluent organic matter (EfOM) using ozonation and UV/H2O2 treatment, Water Res., 2013, 47(7), 2387–2398 CrossRef CAS PubMed.
- M. O. Buffle, J. Schumacher, S. Meylan, M. Jekel and U. Von Gunten, Ozonation and advanced oxidation of wastewater: effect of O3 dose, pH, DOM and HO˙-scavengers on ozone decomposition and HO˙ generation, Ozone: Sci. Eng., 2006, 28(4), 247–259 CrossRef CAS PubMed.
- J. Lv, Y. Li and Y. Song, Reinvestigation on the ozonation of N-nitrosodimethylamine: influencing factors and degradation mechanism, Water Res., 2013, 47(14), 4993–5002 CrossRef CAS PubMed.
- S. P. Mezyk, W. J. Cooper, K. P. Madden and D. M. Bartels, Free radical destruction of N-nitrosodimethylamine in water, Environ. Sci. Technol., 2004, 38(11), 3161–3167 CrossRef CAS.
- Y.-C. Lee, S.-L. Lo, P.-T. Chiueh, Y.-H. Liou and M.-L. Chen, Microwave-hydrothermal decomposition of perfluorooctanoic acid in water by iron-activated persulfate oxidation, Water Res., 2010, 44(3), 886–892 CrossRef CAS PubMed.
Footnote |
| † Electronic supplementary information (ESI) available. See DOI: 10.1039/c5ew00046g |
| This journal is © The Royal Society of Chemistry 2015 |