
 Open Access Article
 This Open Access Article is licensed under a
 Creative Commons Attribution 3.0 Unported Licence
Source apportionment of airborne nanoparticles in a Middle Eastern city using positive matrix factorization†
Abdullah N.
Al-Dabbous
a and
Prashant
Kumar
*ab
aDepartment of Civil and Environmental Engineering, Faculty of Engineering and Physical Sciences (FEPS), University of Surrey, Guildford GU2 7XH, UK. E-mail: P.Kumar@surrey.ac.uk; Prashant.Kumar@cantab.net; Fax: +44 (0)1483 682135; Tel: +44 (0)1483 682762
bEnvironmental Flow (EnFlo) Research Centre, FEPS, University of Surrey, Guildford GU2 7XH, UK
First published on 23rd February 2015
Abstract
Airborne nanoparticles have been studied worldwide, but little is known about their sources in the Middle East region, where hot, arid and dusty climatic conditions generally prevail. For the first time in Kuwait, we carried out size-resolved measurements of particle number distributions (PNDs) and concentrations (PNCs) in the 5–1000 nm size range. Measurements were made continuously for 31 days during the summer months of May and June 2013 using a fast-response differential mobility spectrometer (Cambustion DMS500) at a sampling rate of 10 Hz. Sources and their contributions were identified using the positive matrix factorization (PMF) approach that was applied to the PND data. Simultaneous measurements of gaseous pollutants (i.e., O3, NO, NOx, SO2 and CO), PM10, wind speed and direction were also carried out to aid the interpretation of the PMF results through the conditional probability function plots and Pearson product–moment correlations. Six major sources of PNCs were identified, contributing ∼46% (fresh traffic emissions), 27% (aged traffic emissions), 9% (industrial emissions), 9% (regional background), 6% (miscellaneous sources) and 3% (Arabian dust transport) of the total PNCs. The sources of nanoparticles and their PND profiles identified could serve as reference data to design more detailed field studies in the future and treat these sources in dispersion modelling and health impact assessment studies.
Environmental impactLittle is currently known about the sources of airborne nanoparticles during the summertime hot, arid and dusty climatic conditions in the Middle East region. This is the first source apportionment study for the airborne nanoparticles in this region that has quantified the contribution to particle number concentrations from numerous major sources, along with the determination of particle number distribution profiles of individual sources. Besides policy makers and environmental authorities, the findings of this work could be important for the modelling community to treat major nanoparticle sources in dispersion modelling and health impact assessments in the region. |
1. Introduction
Exposure to particulate matter (PM) is known to adversely affect human health.1 Ambient concentrations of PM are currently regulated through mass-based standards of PM10 and PM2.5, i.e., aerodynamic diameters less than 10 and 2.5 μm, respectively.2 Because of their negligible mass compared to the regulated PM,3,4 these standards do not control airborne nanoparticles below 300 nm in diameter and represent the majority (∼99%) of total particle number concentrations, PNCs.5 Nanoparticles are characterised by their vast numbers and high surface area.6,7 As a result, they can adsorb large concentrations of toxic hazardous chemicals on their surfaces, translocate and deposit in different parts of the human body, thereby causing adverse health effects.8,9 Evidence from a large number of studies links the exposure of nanoparticles to the occurrence of cardiovascular diseases.8 This effect is attributed to the translocation of the redox-active components of the nanoparticles in the human body, which promotes the progression of atherosclerosis.10 Furthermore, preliminary estimates of excess mortality related to nanoparticle exposure have been reported to be notable at 11![[thin space (1/6-em)]](https://www.rsc.org/images/entities/char_2009.gif) 252 deaths in 2010 in Delhi11 and ∼310000 deaths per year in Asian megacities.9 However, such estimates are currently unavailable for the Middle East region, clearly showing a need for field studies that can provide an in-depth insight into the sources of nanoparticles and associated health impacts.
252 deaths in 2010 in Delhi11 and ∼310000 deaths per year in Asian megacities.9 However, such estimates are currently unavailable for the Middle East region, clearly showing a need for field studies that can provide an in-depth insight into the sources of nanoparticles and associated health impacts.
Pollutants measured at a receptor site are from a combination of various local and regional sources situated at varying distances from the site. Nanoparticles are dynamic in nature with the potential to change in the atmosphere through transformation processes such as dilution, nucleation, coagulation, condensation/evaporation and deposition during their transport from the source to the receptor site.12,13 However, majority of the transformation occurs close to the source and the particle number distributions (PNDs) may not change considerably at large distances from their original emission source such as road traffic and petroleum refineries.14,15 Hence, the application of source apportionment models on the data collected at a receptor site could allow the extraction of the latent factors contributing to the total PND data and potentially reveal both the nearby or faraway sources, along with their individual PND profiles. Our previous study16 showed different PND profiles during variable wind directions at different times of the day, thereby representing the contribution of different sources to the measured size-resolved PND data. What remains unknown is the contribution of these different sources to the PNCs and the PND data collected during hot and arid weather conditions. These unstudied aspects are taken up for a detailed investigation in this study.
Source apportionment models are important to identify various unknown sources and quantify their contributions towards the total measured concentrations. Such information is important to design efficient abatement strategies to control emissions. One of the most common receptor-based source apportionment models is positive matrix factorization (PMF), which can overcome the drawbacks of principal component analysis, PCA.17,18 The output of PMF is more physically realistic than that of PCA because the former allows the implementation of non-negative constraints and production of explainable positive elements among all factors. Other models such as the chemical mass balance (CMB) and Unmix are comparable to PMF, to some extent. However, PMF does not require prior knowledge of the sources and their profiles, as required in the case of CMB, thereby making it an easier and more cost-effective solution. Furthermore, PMF allows for the weighting of each data point individually18 – a feature that is not available in the Unmix model.
Prior to the incorporation of PND data in the PMF, this source apportionment technique has been applied to the identification of particle sources in many previous studies.19–22 However, these studies have mainly focused on PM mass concentrations and compositional data. PMF analysis, based on the PM chemical composition data, is often time-consuming and expensive, and does not segregate PNDs according to their sources. The knowledge of source-specific PNDs is of great relevance to epidemiological studies because of the dependency of the respiratory tract deposition pattern in the human body on the particle diameter.23 Several studies worldwide have successfully deployed total PNC data in the application of PMF to identify sources and their contributions over the past decade (see summary of relevant studies in Table 1). Few of these studies have used only PND data for the PMF analysis,24 while others have included PM chemical composition data,25 gaseous pollutant data,26 and both chemical composition and gaseous pollutant data15 in their PMF analysis. In fact, none of the studies to date have applied PMF to the distinct PND characteristics found in the Middle East region, and therefore, the contributions of the different sources of PNC are currently unknown.
| Author (year) | Location (type) | Size range (nm) | Instruments | Additional data | Sources identified (contribution of each source to the total apportioned PNC, %) |
|---|---|---|---|---|---|
| a Note: *contributions to particle volume concentration. SMPS = scanning mobility spectrometer; UDMA = ultrafine differential mobility analyser; UCPC = ultrafine condensation particle counter; APS = aerodynamic particle sizer; OPC = optical particle counter; MAS = mobile aerosol spectrometer (comprising a combination of a differential mobility spectrometer, DMPS, and an optical laser aerosol spectrometer); EEPS = engine exhaust particle spectrometer. | |||||
| This study | Fahaheel, Kuwait (roadside) | 5–1000 | DMS500 | PM10 and gaseous (O3, NO, NOx, SO2 and CO) | Fresh traffic emissions (46% of the total apportioned PNC), aged traffic emissions (27%), industrial emissions (9%), regional background (9%), miscellaneous sources (6%) and Arabian dust transport (3%) |
| Liu et al.15 | Beijing, China (urban background) | 14.5–2514 | SMPS | Gaseous (O3, NO, NO2, CO and SO2), and chemical composition (organic matter, sulphate, nitrate, ammonium and chlorine) | Local sources: cooking (22.8%), solid-mode exhaust (18.8%), nucleation-mode exhaust (18.7%), secondary nitrate (8.9%), secondary sulphate (7.9%), coal-fired power plant (6.8%) and road dust (2.3%). Regional sources: accumulation mode (13.8%) |
| Friend et al.28 | Brisbane, Australia (roadside) | 14–715 | SMPS | PM10, gaseous (CO, NO and NO2) | Petrol vehicles (30.8%), diesel traffic (28.1%), local traffic (14.9%), biomass burning (20.1%) and two unidentified sources (6%) |
| Gu et al.25 | Augsburg, Germany (urban background) | 3–10000 |
UDMA, UCPC and APS | Metals, water-soluble ions, elemental carbon (EC) and organic carbon (OC) | Aged traffic (40.3%), re-suspended dust (32.6%), stationary combustion (26.1%), fresh traffic (24.9%), nucleation particles (3.7%), secondary aerosols (1.2%) and long-range transported dust (1.1%) |
| Harrison et al.26 | London, UK (curbside) | 15–10000 |
SMPS and APS | Gaseous (O3, NO, NO2 and CO) and traffic flow | Road emissions: solid-mode exhaust (18.8%), brake dust (13.7%), re-suspended dust (4.4%) and nucleation-mode exhaust (3.6%). Urban background: well-aged regional (26.8%), accumulation mode (12.8%), solid fuel/nitrate (8.4%), cooking (6.7%), regional (2.5%) and suburban traffic (2.3%) |
| Kasumba et al.29 | New York, USA (urban background) | 100–470 | SMPS | PM2.5 and gaseous (CO, SO2 and O3) | Local traffic or gasoline traffic (21.7%), mixture of nucleation and traffic (20.1%), industrial emissions (17.2%), distant traffic or diesel traffic (15.2%), nucleation (17.6%), secondary sulphate (6.4%), ozone-rich secondary aerosol (0.9%) and regionally transported aerosol (1.1%) |
| Thimmaiah et al.30 | Prague, Czech Republic (urban background) | 18.8–723.5 | SMPS | Gaseous (CO, SO2, NOx, O3, CH4), non-methane hydrocarbons and total hydrocarbons | NOx-rich (influenced by diesel emissions, 37.8%), gasoline traffic (34.2%), heating (24.6%) and ozone-rich (mainly influenced by meteorology, 3.5%) |
| Yue et al.24 | Erfurt, Germany (roadside) | 10–3000 | MAS | Gaseous (O3, NO, NO2, CO and SO2) and chemical composition (sulphate, EC and OC) | Ultrafine particles from local traffic (79%), secondary aerosols from multiple sources (6%), particles from remote traffic sources (5%) and airborne soil (1%) |
| Ogulei et al.31 | New York, USA (urban background) | 10–470 | SMPS | PM2.5, gaseous (CO, SO2 and O3) | Diesel/distant traffic (23.3%), mixture of gasoline/local traffic and nucleation (22%), industrial emissions (21.4%), nucleation (15.7%), secondary sulphate (10.9%), ozone-rich secondary aerosol (4.7%) and regionally transported aerosol (1.9%) |
| Ogulei et al.32 | New York, USA (on-road, mobile) | 6–500 | EEPS | — | Background urban emissions (39.5%), local/street diesel traffic (21.2%), aged/evolved diesel particles (15.5), fresh tail-pipe diesel exhaust (15.4%), spark-ignition gasoline emissions (4.3%) and secondary/transported material (4%) |
| Ogulei et al.33 | Baltimore, USA (roadside) | 9.6–2458 | SMPS and APS | PM2.5, gaseous (O3, NOx and CO), metals and chemical composition (sulphate, nitrate, EC and OC) | Oil-fired power plant emissions, two secondary nitrates, local gasoline traffic, coal-fired power plant, secondary sulphate, diesel emissions/bus maintenance, Quebec wildfire episode, nucleation, incinerator, airborne soil/road-way dust and steel plant emissions |
| Zhou et al.34 | Pittsburgh, USA (urban background) | 3–2500 | SMPS and APS | PM2.5, gaseous (O3, NOx, NO, SO2 and CO), metals and chemical composition (sulphate, nitrate) | Two secondary nitrates, remote traffic, secondary sulphate, lead, diesel traffic, coal-fired power plant, steel mill, nucleation, local traffic and coke plant |
| Kim et al.14 | Seattle, USA (urban background) | 20–400 | DMPS | Gaseous (NOx and CO) | Wood burning (48%*), secondary aerosol (21%*), diesel emissions (20%*) and motor vehicle emissions (11%*) |
| Zhou et al.35 | Pittsburgh, USA (urban background) | 3–2500 | SMPS and APS | PM2.5, gaseous (O3, NO, NOx, SO2 and CO) and chemical composition (sulphate, OC and EC) | Sparse nucleation (28.2%), local traffic (21.7%), stationary combustion (21.1%), grown particles and remote traffic (20%) and secondary aerosol (9%) |
In order to fill the above-noted research gaps, we have applied PMF to our PND dataset, ranging from 5–1000 nm, collected continuously over a 31 day period during summertime conditions at a roadside location in Fahaheel, Kuwait, by using a fast response differential mobility spectrometer (Cambustion DMS500). In addition, PM10, gaseous pollutants (NOx, O3, CO and SO2) and meteorological data were used to assist the interpretation of the PMF results by using conditional probability function (CPF).
The following are the unique features of our work. Firstly, the use of a DMS500 is advantageous because it can provide real-time measurements of nanoparticles at a sampling rate of 10 Hz, allowing for the rapid capture of the fast transformation processes. The DMS500 is currently one of the commercially available fastest response particle sizers, requiring only ∼100 ms to complete one full spectrum of PND. This enabled us to capture the peaks of PNCs that occur in urban environments, within a few seconds.27 Furthermore, the sampling height of the DMS500 inlet was ∼1.60 m above the ground, representing the typical breathing height of people, which can be easily used in epidemiological studies in calculating deposition doses. Secondly, PMF was applied at a high temporal resolution (5 min based measurements), which is higher than that in most of the previous studies (see Table 1), and on continuous measured data of all studied parameters as opposed to the intermittent data used by some of the previous studies (Table 1). Thirdly, most of the published studies have used only wind directions in their CPF applications (Table 1), but our study used both wind direction and speed, providing a better understanding of the directionality and position of the potential sources. Finally, to the best of our knowledge, this is the first instance when a source apportionment technique is used on high-resolution PND data in Kuwait, and the Middle East in general, which were collected during severe summertime conditions (maximum temperature ∼ 48 °C and minimum relative humidity ∼ 0.20%) with frequent dust events (Section 2.1).
In the light of the existing research gaps, the aims of this study are: (i) to identify the possible sources of nanoparticles in the studied area which represents a typical roadside environment of the Middle East region, (ii) to quantify the sources' contribution to total PNCs, and (iii) to determine the individual PND spectrum of various sources in a Middle Eastern city, Kuwait.
2. Experimental methods
2.1 Site description
This study was conducted at a near-road location in the urban area of Fahaheel, Kuwait (Fig. 1). The geographic coordinates of the sampling site are 29°4′52.70′′ N and 48°6′52.08′′ E. The sampling instruments were placed inside an air-conditioned cabin, located at a distance of ∼15 m east of the kerbside of Fahaheel highway. This highway runs in the north–south direction, linking the State of Kuwait with the Kingdom of Saudi Arabia. This six-lane highway is one of the busiest highways in Kuwait, consisting of three lanes (∼3.70 m wide) in each direction. These lanes are separated by a paved median strip, and there are two additional lanes in each direction reserved for emergency. The areas to the immediate east and west of the sampling site have intra-city activities and open flat desert, respectively. The intra-city activities in the Fahaheel area consist of vehicular movement, gas stations and small businesses. Additionally, the sampling site is influenced from the south-east direction by a vast range of petroleum, petrochemical, cement, caustic and small industries, located at a distance of 1200 m from the edge of these petroleum activities.36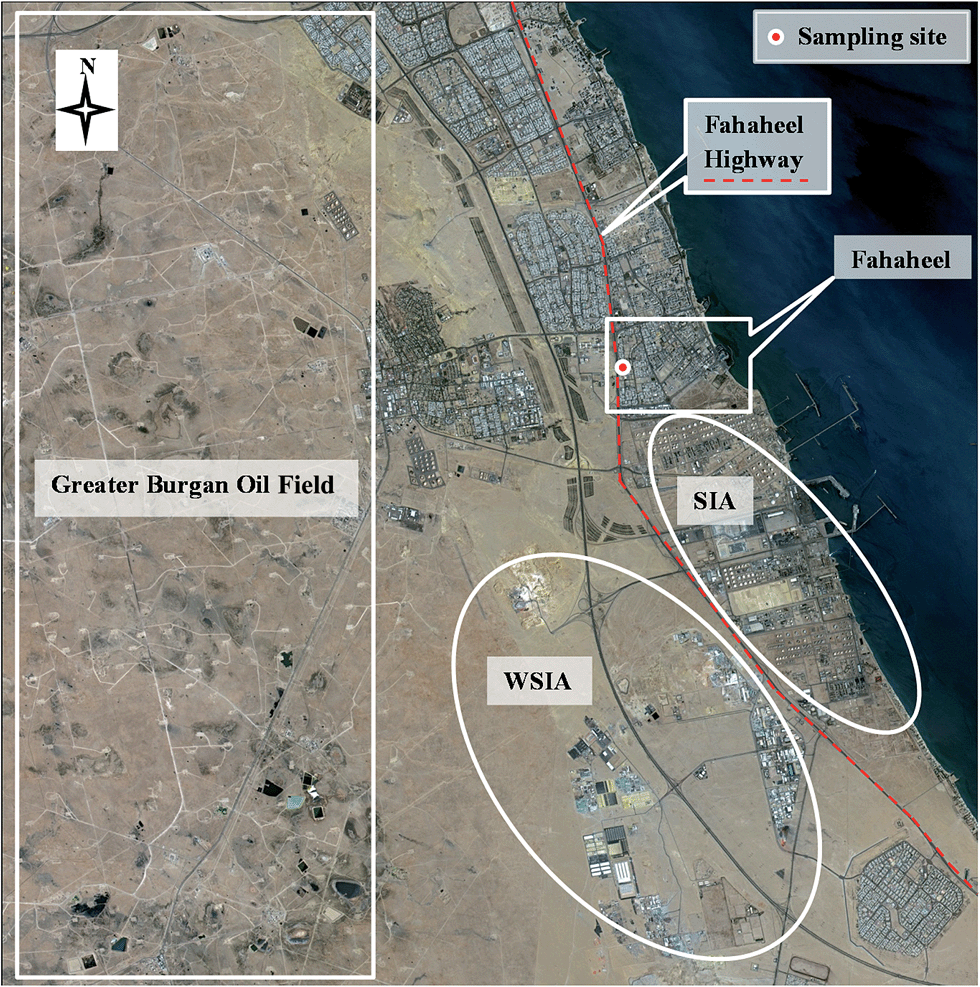 | ||
| Fig. 1 Location of the sampling site in the Fahaheel area, showing the major sources surrounding the site. Satellite image includes material ©NSPO 2014 distribution Spot Image S.A.; courtesy of Airbus Defence and Space, all rights reserved. Note: SIA = Shuaiba Industrial Area; WSIA = West Shuaiba Industrial Area. | ||
Measurements were made during summertime in the months of May and June 2013 when ambient temperature reached ∼48 °C, the relative humidity decreased to a minimum of 0.20% and the dust events (i.e., when PM10 > 200 μg m−3) were observed for ∼49% of the total measurement time. The average temperature, relative humidity and wind speed were found to be 37 ± 4.5 °C, 13.6 ± 10.0% and 6.3 ± 3.0 m s−1, respectively. The prevailing wind direction was north-west (∼311°N). Wind speed and ambient temperature affected the PNCs notably. For example, ambient temperature was found to linearly decrease the PNCs due to partial evaporation;16 see details in the ESI, Section S1.†
The sampling site and the Fahaheel area are ideal for this study because of the following reasons. Firstly, Fahaheel is a typical urban area in Kuwait surrounded by heavy petroleum industries, reflecting typical characteristics of the oil-rich State of Kuwait and the intra-city activities, as well as a good representative of the Middle East region (especially the Arabian Peninsula region), in terms of topography and climatic conditions. Secondly, no other major highways directly influence the sampling site, except the studied Fahaheel highway, allowing a clear identification of the highway impact on the measured PND data. Thirdly, the sampling site is characterised by the absence of obstacles for at least ∼300 m radius, eliminating the downwash effects. Finally, the surrounding potential sources of the sampling site are well-distributed at different directions and distances, allowing the development of CPF plots using local wind data to aid in the source identification by PMF. Further details on the sampling site characteristics, including traffic and meteorology, can be seen in the study of Al-Dabbous and Kumar.16
2.2 Data acquisition
A total of 8675 valid 5 minute PND observations, each in 36 size classes, covering a 5–1000 nm size range, were continuously measured from 27 May to 26 June 2013 by using a DMS500. These measurements were conducted at 0.10 second time resolutions and then averaged to 5 min interval means to synchronise them with the pollutants and meteorological data. The DMS500 is a parent version of DMS50 (i.e., portable instrument with similar features) that has been successfully used in a variety of our studies, related to roadside and kerbside measurements,16,37 vehicle-wake,38 vehicle in-cabin39–41 and indoor construction environments.42,43 The DMS500 detects particles based on their electrical mobility.3 Additionally, a suite of pollutants (PM10, O3, NOx, SO2 and CO) and meteorological parameters (temperature, relative humidity, wind speed and direction) were obtained from the adjacent (∼300 m away from the site) Environmental Protection Agency (EPA) monitoring station. These continuous data are well-maintained and quality-controlled by the Kuwait EPA. Further details on the experimental setup, instrumentation and working principles of various instruments can be seen elsewhere.162.3 Statistical analysis
PMF analysis was applied using the US EPA's PMF program (version 5.0) on the dataset composed of 36 variables. These variables included PNDs in 36 size classes covering a size range of 5–1000 nm, following the methodology described in the study of Paatero.18 PMF is a multivariate factor analysis model used to identify the contribution and profile by exposing the dataset to a multi-linear engine algorithm and a gradient algorithm approach in order to find the best-fit solution.44,45 This method is featured by the non-negative constraints and the use of uncertainties to scale individual data points. The uncertainty data file supplied by the instrument manufacturer (Cambustion Ltd., Cambridge), consisting of size-specific minimum detection limits and error fractions, was also included in the PMF. An extra modelling uncertainty of 5% was added to the model to account for any additional measurement errors that were not covered by the uncertainty data file.46 The missing sampling values due to instrument failure were modest (i.e., <3% of the entire sampling period) and simply excluded from the analysis. In addition, CPF plots were prepared using the threshold of the upper 25th percentile of the fractional contribution of each factor/source. These plots complemented the PMF analysis by depicting the trend in the factors' score with wind direction and speed so that the factors could be tentatively assigned to the potential sources in the area.47 Furthermore, CPF plots were also drawn for the routinely measured pollutants (PM10, O3, NOx, SO2 and CO) by using the same criterion. Open Air (R package), which is an open-source statistical tool,48 was used to derive the CPF plots that assisted in the interpretation of the measured air pollution data.3. Results and discussion
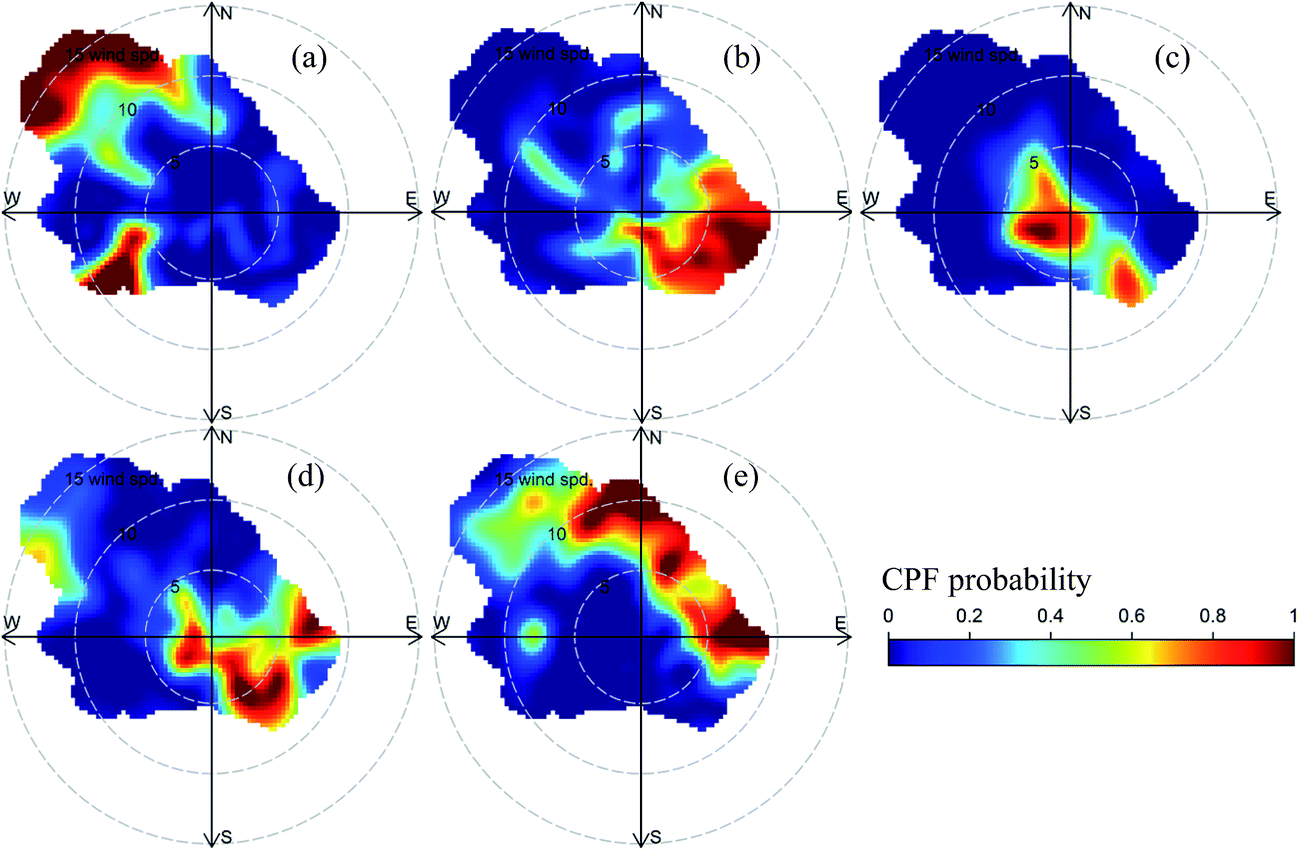
Using the PMF approach described in Section 2.3, six different factors were identified that were then tentatively assigned to the potential sources based on the following information: (i) factor-specific PNDs (Fig. 2 and 3g–l, middle vertical panel), (ii) diurnal variation of the factors (Fig. 3m–r, right vertical panel), (iii) contribution of each factor to the total PNC (Fig. 4), (iv) hourly Pearson product–moment correlations, along with the significance level (p-value), between each factor contribution and measured gaseous (O3, NOx, SO2 and CO) and PM10 pollutants (Table 2), and (v) the CPF plots for each factor contribution (Fig. 3a–f, left vertical panel) and measured gaseous (O3, NOx, SO2 and CO) and PM10 pollutants (Fig. 5).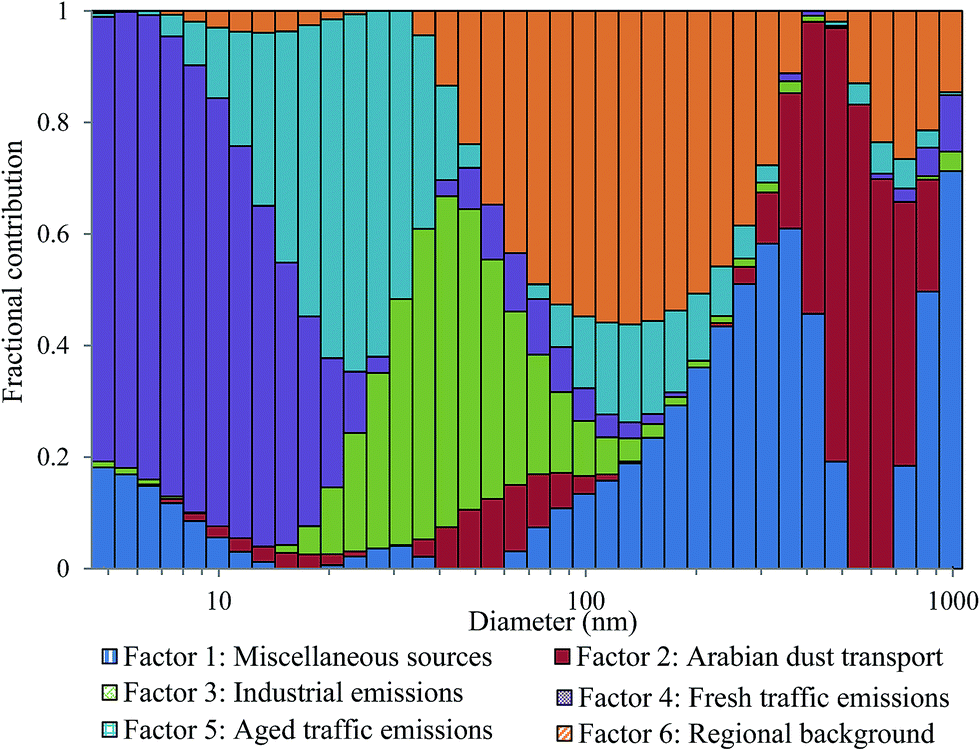 | ||
| Fig. 2 Percent contribution of each source identified to the PNCs in different size ranges. | ||
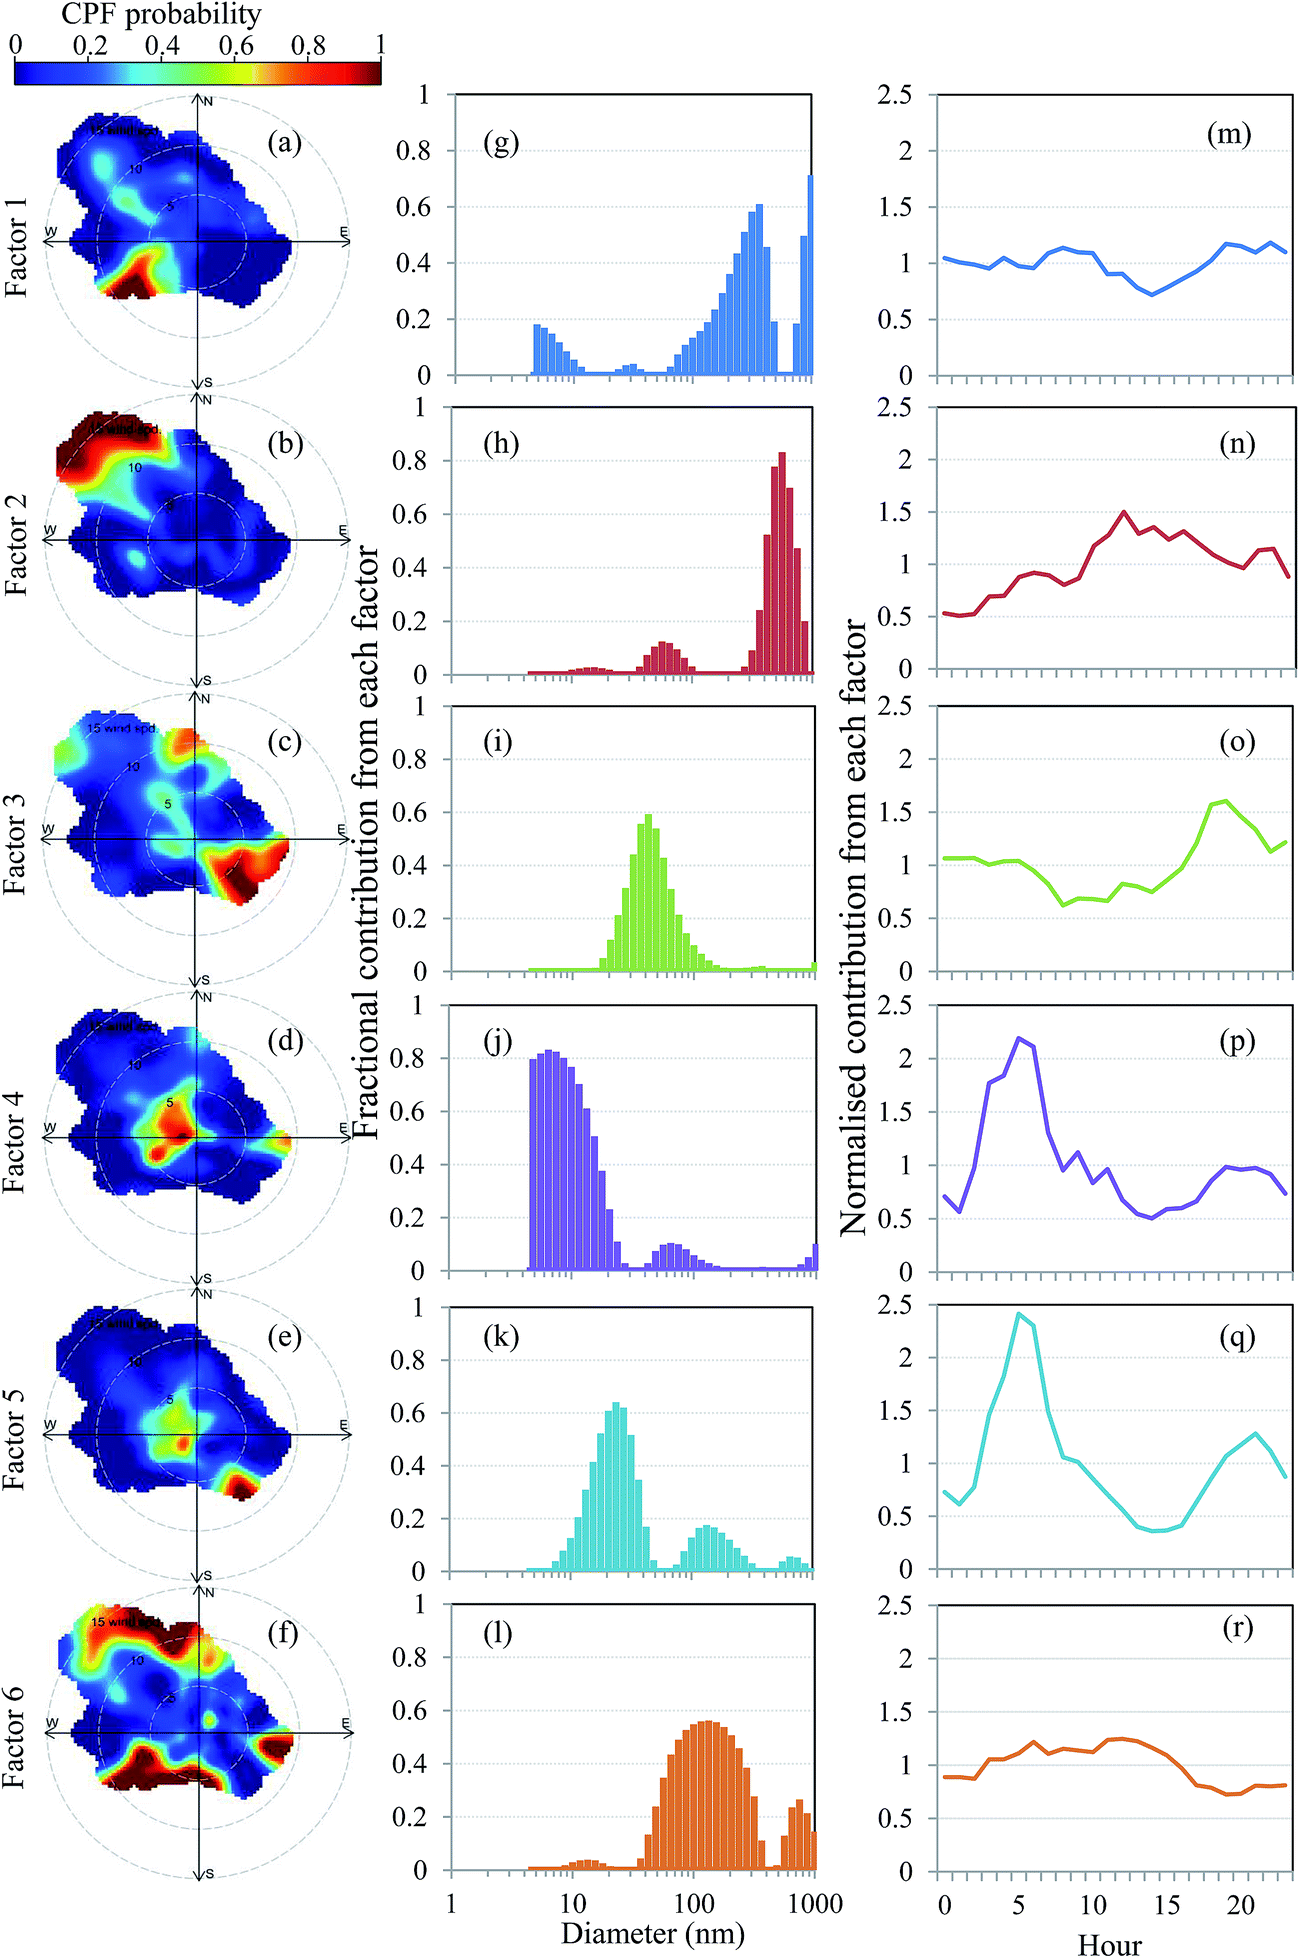 | ||
| Fig. 3 Directionality of the factor contribution using CPF plots at the 75th percentile level, considering both local wind direction and speed (a–f). The colours in (a–f) represent the probability of factor contributions with respect to the wind direction and speed. (g–l) represent the factor-specific PND profiles while (m–r) show the diurnal variation of the normalised factor contribution. | ||
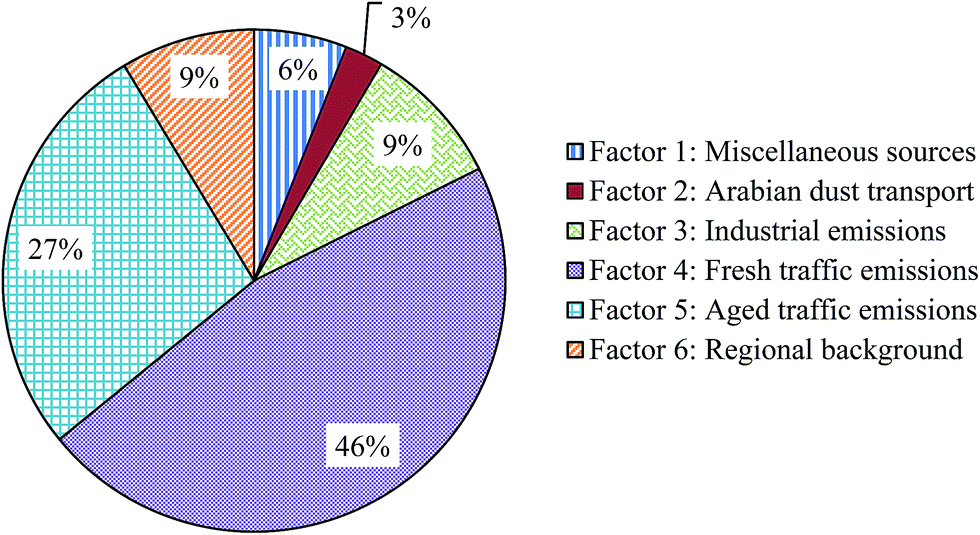 | ||
| Fig. 4 Sources' contribution (%) to the total PNC data in the urban area of Fahaheel, Kuwait. | ||
| Factor 1 | Factor 2 | Factor 3 | Factor 4 | Factor 5 | Factor 6 | |
|---|---|---|---|---|---|---|
| a Correlation is significant at the 0.01 level. b Correlation is significant at the 0.05 level. | ||||||
| PM10 | 0.39a | 0.71a | −0.10a | −0.15a | −0.16a | 0.31a |
| O3 | −0.14a | 0.03b | −0.15a | −0.39a | −0.49a | 0.14a |
| NOx | −0.04a | −0.11a | 0.37a | 0.30a | 0.54a | 0.01 |
| SO2 | −0.04a | −0.04a | 0.31a | −0.05a | 0.05a | 0.19a |
| CO | −0.13a | 0.01 | 0.23a | 0.07a | 0.23a | 0.02 |
 | ||
| Fig. 5 Directionality of (a) PM10, (b) SO2, (c) NOx, (d) CO and (e) O3 using CPF plots at the 75th percentile level, considering both local wind direction and speed. The colours in these figures represent the probability of the aforementioned pollutants with respect to wind direction and speed. | ||
3.1 Factor 1: miscellaneous sources
This factor showed multiple PND modes, with the major peaks at about 365 nm and 1000 nm, and a positive correlation with PM10 (r = 0.39; p-value < 0.01; Table 2). Factor 1 also showed a minor peak at ∼5 nm, which could represent fresh traffic emissions but to a lesser extent than that observed for factors 4 and 5. Furthermore, the wind directionality and the relatively high wind speed (up to 10 m s−1) of this factor (Fig. 3a) and PM10 (Fig. 5a) indicated that the particle emissions had travelled from a remote location and grown to larger sizes through coagulation. Al-Dabbous and Kumar16 previously reported a dominating role of PM10 in suppressing PNCs due to the coagulation process. For instance, PNCs were found to be reduced by ∼23% when the PM10 concentration increased by ∼500%, compared to the values prior to the arrival of the dust event (i.e., when PM10 < 200 μg m−3). A similar observation on coagulation scavenging has been reported by Jayaratne et al.49 with respect to the influence of the Australian dust storm on the PNCs. This factor made the second lowest contribution (6%) to the total PNCs. The directionality of the CPF plots and the association with PM10 clearly correspond to the West Shuaiba industrial area and the dust blown by high wind speed from the desert during the south-westerly winds.Furthermore, particles emitted from the industrial area appear to be aged particles that have spent time in the atmospheric environment and grown to larger sizes during their travel from their far sources (for example, West Shuaiba industrial area during the south westerly winds, in this case). These particles could be attributed to the vehicle movements within the industrial area such as those found in factor 5 (Section 3.5), but neither did the factor contribution show any nocturnal variation (Fig. 3m) nor the PND profile (Fig. 3g) and the poor correlations with NOx and CO (Table 2) support direct association with traffic emissions. For example, the diurnal behaviour of factor 1 (Fig. 3m) showed a slight drop in factor contribution during the afternoon hours; otherwise this remains fairly constant during the rest of the period. The reason for this slight drop could be attributed to the unstable atmospheric conditions, induced by the intensive solar radiation (800 ± 548 W m−2 during the afternoon hours compared with an average value of 323 ± 373 W m−2 during the entire period), leading to larger mixing of these particles.16 Although this factor was tentatively assigned to shared sources, information available from the correlations between factor contribution and gaseous pollutants (Table 2), and diurnal profile of factor contribution (Fig. 3m), was insufficient to assign a separate weighting to each of these two different sources.
3.2 Factor 2: Arabian dust transport
This factor showed a bimodal PND (Fig. 3i) with a major peak at 560 nm, and a minor peak at 60 nm, along with a distinctively high correlation with PM10 (r = 0.71; p-value < 0.01; Table 2). The wind directionality and the associated high speed levels (more than 15 m s−1) noted in CFP plots of this factor (Fig. 3b), as well as PM10 (Fig. 5a), indicate the influence of the dust from the long-range transport that is associated with the typical Arabian dust events. This factor showed behaviour similar to that of factor 1, but to a greater extent in terms of higher PM10, wind speed levels and the typical directionality (i.e., north-westerly direction) associated with the frequent dust events in the region. In an extended analysis of the same dataset,16 Arabian dust events were found to suppress PNCs due to the influence of the coagulation process, which explains the minimum contribution (3%) of this factor to the total PNC (Fig. 4). It is worth pointing out that both factors 1 (6%) and 2 (3%) made the lowest contributions (Fig. 4), among the six resolved factors, but showed the highest correlations with PM10; these characteristics support the possible effects of the coagulation process during high concentrations of PM10 approaching the site from the westerly wind direction (i.e., open desert; Fig. 1). Furthermore, the diurnal profile of this factor showed an increased contribution during the afternoon (12:00 to 14:00 h; Fig. 3n) due to higher wind speeds and associated saltation process.50 In an extended analysis on the same dataset (ESI Fig. S1†), but excluding the major dust event periods (i.e., when PM10 > 1000 μg m−3), we observed a similar contribution to the total PNCs (Fig. S2†) to those observed in Fig. 4 for all the six sources. Pearson product–moment correlations between each factor and measured gaseous (O3, NOx, SO2 and CO) and PM10 pollutants also exhibited similar correlations (Table S1†) to those observed in Table 2. This similarity confirms that the input datasets were not highly affected by the Arabian dust events, mainly because the major dust event periods were only 5.7% of the total measurements period.3.3 Factor 3: industrial emissions
This factor showed a unimodal distribution with a peak at ∼42 nm (Fig. 3i), and made a 9% contribution to the total PNCs (Fig. 4). The diameter of this peak was in accordance with those recorded for industrial emissions in previously published studies. For instance, Ogulei et al.31 reported a peak at 44 nm during their one-year long measurements (2004–2005) at an urban background location in New York (USA) that was significantly influenced by the industrial activities. We have several reasons to believe that factor 3 represents industrial emissions. For example, the CPF plots of this factor are strongly associated with south easterly winds (Fig. 3c), which is consistent with the wind directionality of SO2 (Fig. 5b). The directionality of these plots clearly corresponds to the Shuaiba industrial area, which hosts a range of oil refineries (i.e., Mina Al-Ahmadi, Shuaiba and Mina Abdullah refineries), petrochemical industries (e.g., ammonia, urea, polyethylene and polypropylene plants) and two power desalination plants.51,52 Furthermore, this factor had the highest correlation (r = 0.31; p-value < 0.01) with SO2 among all the factors (Table 2), which supports the fact that industrial emissions are clearly associated with this factor. Moreover, NOx (r = 0.37; p-value < 0.01) and CO (r = 0.23; p-value < 0.01) also showed a positive correlation with this factor, indicating an association with the combustion activities within the vicinity of the industrial area. Previous studies have also linked industrial emissions with the combustion related pollutants, mainly SO2.29,31,33,35 The association with SO2 may indicate the influence of secondary particle formation in the form of photo-chemically induced sulphuric-acid nucleation.53,54 The diurnal profile of this factor displayed a typical diurnal variation, linked with the meteorological conditions and the associated boundary layer.55 For example, a decreased factor contribution was observed during the afternoon, which was caused by the expanded depth of the boundary layer and the associated dilution with the background air. Based on the above evidences, we attributed this factor to the industrial emissions.3.4 Factor 4: fresh traffic emissions
This factor showed a major PND peak between 5 and 12 nm and a minor peak at ∼60 nm (Fig. 3j) and explained nearly half (46%; Fig. 4) of the total PNC contribution. Looking at the PND and the peaks, this contribution was believed to be from the local traffic. For example, these bimodal profiles of PNDs are consistent with those observed by Fujitani et al.56 at 10 nm and 40–60 nm during their near road measurements in Kanagawa Prefecture, Japan. Furthermore, similar PND peaks related to local traffic were observed by numerous studies performed in cities worldwide, such as at 20 nm (major peak) and 100 nm (minor peak) in Beijing, China,15 20 nm in Brisbane, Australia,28 9–40 nm in Augsburg, Germany,25 10–100 nm in Erfurt, Germany,24 20 nm in London, UK,26 13.3 nm in Cambridge, UK,5 10 nm in New York, USA,31 and 15 nm in Pittsburgh, USA.35 The wind directionality (Fig. 3d) corresponded to the highway located 15 m west of the measurement location, and the wind speed was observed to be relatively low (<5 m s−1) compared with much higher levels noted during the major dust events. This low level of wind speed indicates an association with a close-range source (i.e., local traffic). The directionality of the factor contribution is also consistent with those for NOx (Fig. 5c) and CO (Fig. 5d), especially from the westerly wind direction, indicating the same emission source. Furthermore, this factor contribution correlated positively with the NOx (r = 0.30; p-value < 0.01), which is a primary traffic-generated pollutant.57,58 The diurnal profile of this factor contribution (Fig. 3p) was in agreement with the diurnal pattern of the traffic volume, except during the noon hours when the high traffic volume corresponded to low factor contribution. The reason for this odd behaviour was previously studied in an extended analysis by Al-Dabbous and Kumar16 and explained by the extreme temperature (reaching up to ∼50 °C) that resulted in partial evaporation and increased rate of coagulation with larger particles.59 Most of the above-discussed studies also observed higher PND magnitudes in the morning rush hours compared with those during evening rush hours; this is consistent with the findings of our current study. Based on the above observations, we attributed this factor to local traffic emissions, seen through the newly formed particles (i.e., fresh traffic emissions) in nucleation mode.3.5 Factor 5: aged traffic emissions
This factor showed a major peak at 24 nm, followed by a minor peak at 130 nm (Fig. 3k). The former peak is presumably attributed to the nearby highway emissions, and the latter, to aged particles transported from the industrial area. These bimodal profiles of PNDs are similar to those observed by Gu et al.25 at 20 and 100 nm during their measurements in Augsburg, Germany, and attributed them to aged traffic emissions. This factor showed the second highest contribution to the total PNC (27%; Fig. 4). This factor was positively correlated with NOx (r = 0.54; p-value < 0.01) and CO (r = 0.23; p-value < 0.01) and showed no correlation with SO2. Moreover, the CPF shown in Fig. 3e clearly pointed to the wind direction from the Shuaiba industrial area (i.e., south-easterly direction) and the traffic emission from the Fahaheel highway (i.e., Westerly direction). This wind directionality is identical to those obtained for NOx (Fig. 5c) and CO (Fig. 5d). Therefore, the correlations with NOx and CO as well as the CPF suggest that there is a contribution from primary (solid carbonaceous) particles from diesel vehicles from the nearby industrial area and the Fahaheel highway. However, the absence of such correlations with SO2 suggests a negligible contribution of secondary particle formation through photo-chemically induced sulphuric acid nucleation like what is noticed in the case of factor 3. Furthermore, the diurnal profile of this factor contribution (Fig. 3q) was similar to the profile of factor 4, with a slight increase in the evening hours, indicating the influence of nocturnal commercial traffic (e.g., heavy duty trucks) operating on the Fahaheel highway and within the industrial area. In total, both the fresh (factor 4) and aged (factor 5) traffic emissions accounted for about 73% of the total PNCs, which is comparable to roadside studies in London, UK (∼72%)26 and Brisbane, Australia (∼74%).283.6 Factor 6: regional background
This factor showed multiple PND peaks with a major peak at 150 nm, followed by a minor peak at 750 nm (Fig. 3l), and contributed to 9% of the total PNCs (Fig. 4). Particles in the size range (diameter > 100 nm) could possibly originate: (i) either locally, through direct emissions from local sources such as exhaust emissions or brake dust, or coagulation of smaller particles with each other and with their larger counterparts,3 or (ii) regionally that are transported to the receptor site.29 However, the wind directionality shown in Fig. 3f indicates that the PNC emissions were approaching the site from all the wind directions and the association with the high wind speed indicated a contribution from far-range sources. Particles larger than 100 nm contain low volatility and solid cores.23 Therefore, these can travel longer distances compared with highly volatile nucleation mode particles.12,60 This factor also showed the highest correlation with PM10 (r = 0.31; p-value < 0.01) compared with other pollutants (Table 2), agreeing with those reported by Ogulei et al.31 where they found a high correlation with regionally transported PM2.5. Both factors 6 and 1 showed identical correlations with the PM10, but information available from the wind directionality and PND profile assist in attributing factor 6 to regional background. Furthermore, the lack of obvious diurnal variation in factor contribution (Fig. 3r) also suggests that this is a regional background source.4. Summary and conclusions
Particle numbers and size distributions in the size range of 5–1000 nm were continuously measured for a period of one month, starting from 27 May to 26 June 2013, at a roadside location in Kuwait. The aims of this study were to identify the sources of size-resolved particles under summertime climatic conditions, as well as to quantify their contributions, and understand the influencing parameters (PM10, gaseous pollutants and meteorological parameters).The application of PMF helped in identifying six probable sources: miscellaneous sources, Arabian dust transport, industrial emissions, fresh as well as aged traffic emissions, and regional background. Traffic emissions made the highest (73%) contributions to the total PNC, followed by industrial emissions (9%), regional background (9%), miscellaneous sources (6%) and Arabian dust transport (3%). The high correlation between PM10 and the factor contributions of the last three sources indicated the possible influence of coagulation of PNCs with their larger counterparts, thus resulting in the suppression of total PNCs. The diurnal profile of the factor contribution of the traffic sources (i.e., factors 4 and 5) were categorised by a bimodal distribution, coinciding with the morning and evening rush hours, whereas Arabian dust transport (i.e., factor 2) was characterised by an increased factor contribution in the noon hours, where high wind speed approached the sampling site loaded with high levels of PM10. Miscellaneous sources (factor 1) and regional background (factor 6) displayed no diurnal variation in their factor contribution, expect during noon hours where high dilution was expected due to the expanded boundary layer and the associated high wind speed. Traffic sources (i.e., factors 4 and 5) showed a typical bimodal PND, while all the long-range transport sources (i.e., factors 1, 2, and 6) consisted mostly of particles greater than 100 nm in diameter, resulting from their growth in size during transport from sources far away. Industrial emissions (i.e., factor 3) displayed a unique unimodal PND, peaking at about 42 nm. The similarities in the wind directionality of the factors' contributions and the pollutants, using CPF at 75th percentile threshold criterion, assisted in sources' allocation.
This study covers a hitherto overlooked topic in the Middle East region. The findings of this work make contributions to the understanding of potential sources of nanoparticles in the area and their probable contribution to the PNCs. Furthermore, PND profiles associated with individual sources present important reference data for future studies in the Middle East region. Long-term measurement studies, involving more pollutants (e.g., trace metals and organic compounds), are recommended to elucidate further the specific source characteristics and their emission strengths.
Acknowledgements
The authors are grateful to the Kuwait Institute for Scientific Research (KISR) for experimental and funding support for Abdullah's PhD research. We also thank Professors Alan Robins (University of Surrey) and Min Hu (Peking University), and Dr Jianfei Peng (Peking University) and Jonathan Symonds (Cambustion Ltd.) for their valuable contributions and discussions during the development of this article. We also thank the Kuwait National Meteorological Network and Kuwait Environmental Protection Agency for their cooperation in providing us the meteorological and gaseous pollutants' data.References
- WHO, WHO Air quality guidelines for particulate matter, ozone, nitrogen dioxide and sulfur dioxide-Global update 2005-Summary of risk assessment, World Health Organization, Regional Office for Europe, 2006 Search PubMed.
- M. R. Heal, P. Kumar and R. M. Harrison, Chem. Soc. Rev., 2012, 41, 6606–6630 RSC.
- P. Kumar, A. Robins, S. Vardoulakis and R. Britter, Atmos. Environ., 2010, 44, 5035–5052 CrossRef CAS PubMed.
- L. Morawska, Z. Ristovski, E. R. Jayaratne, D. U. Keogh and X. Ling, Atmos. Environ., 2008, 42, 8113–8138 CrossRef CAS PubMed.
- P. Kumar, P. Fennell, D. Langley and R. Britter, Atmos. Environ., 2008, 42, 4304–4319 CrossRef CAS PubMed.
- P. Kumar, L. Pirjola, M. Ketzel and R. M. Harrison, Atmos. Environ., 2013, 67, 252–277 CrossRef CAS PubMed.
- B. Nowack, Environ. Pollut., 2009, 157, 1063–1064 CrossRef CAS PubMed.
- HEI, HEI perspectives 3: Understanding the health effects of ambient ultrafine particles (HEI review panel on ultrafine particles), Health Effects Institute, Boston, Massachusetts, 2013 Search PubMed.
- P. Kumar, L. Morawska, W. Birmili, P. Paasonen, M. Hu, M. Kulmala, R. M. Harrison, L. Norford and R. Britter, Environ. Int., 2014, 66, 1–10 CrossRef CAS PubMed.
- R. J. Delfino, C. Sioutas and S. Malik, Environ. Health Perspect., 2005, 113, 934–946 CrossRef.
- P. Kumar, B. R. Gurjar, A. S. Nagpure and R. M. Harrison, Environ. Sci. Technol., 2011, 45, 5514–5521 CrossRef CAS PubMed.
- P. Kumar, M. Ketzel, S. Vardoulakis, L. Pirjola and R. Britter, J. Aerosol Sci., 2011, 42, 580–603 CrossRef CAS PubMed.
- M. Carpentieri, P. Kumar and A. Robins, Environ. Pollut., 2011, 159, 685–693 CrossRef CAS PubMed.
- E. Kim, P. K. Hopke, T. V. Larson and D. S. Covert, Environ. Sci. Technol., 2004, 38, 202–209 CrossRef CAS.
- Z. Liu, Y. Wang, Q. Liu, B. Hu and Y. Sun, Atmos. Chem. Phys. Discuss., 2013, 13, 1367–1397 Search PubMed.
- A. N. Al-Dabbous and P. Kumar, Environ. Sci. Technol., 2014, 48, 13634–13643 CrossRef CAS PubMed.
- P. Paatero and U. Tapper, Environmetrics, 1994, 5, 111–126 CrossRef.
- P. Paatero, Chemom. Intell. Lab. Syst., 1997, 37, 23–35 CrossRef CAS.
- E. Kim, P. K. Hopke and E. S. Edgerton, J. Air Waste Manage. Assoc., 2003, 53, 731–739 CAS.
- E. Lee, C. K. Chan and P. Paatero, Atmos. Environ., 1999, 33, 3201–3212 CrossRef CAS.
- Z. Ramadan, X.-H. Song and P. K. Hopke, J. Air Waste Manage. Assoc., 2000, 50, 1308–1320 CAS.
- A. V. Polissar, P. K. Hopke and R. L. Poirot, Environ. Sci. Technol., 2001, 35, 4604–4621 CrossRef CAS.
- W. C. Hinds, Aerosol technology: properties, behaviour and measurement of airborne particles, John Wiley & Sons, New York, 1999 Search PubMed.
- W. Yue, M. Stölzel, J. Cyrys, M. Pitz, J. Heinrich, W. G. Kreyling, H. E. Wichmann, A. Peters, S. Wang and P. K. Hopke, Sci. Total Environ., 2008, 398, 133–144 CrossRef CAS PubMed.
- J. Gu, M. Pitz, J. Schnelle-Kreis, J. Diemer, A. Reller, R. Zimmermann, J. Soentgen, M. Stoelzel, H. Wichmann and A. Peters, Atmos. Environ., 2011, 45, 1849–1857 CrossRef CAS PubMed.
- R. M. Harrison, D. C. S. Beddows and M. Dall'Osto, Environ. Sci. Technol., 2011, 45, 5522–5528 CrossRef CAS PubMed.
- A. Goel and P. Kumar, Atmos. Environ., 2014, 97, 316–331 CrossRef CAS PubMed.
- A. Friend, G. Ayoko, E. R. Jayaratne, M. Jamriska, P. Hopke and L. Morawska, Environ. Sci. Pollut. Res., 2012, 19, 2942–2950 CrossRef CAS PubMed.
- J. Kasumba, P. K. Hopke, D. C. Chalupa and M. J. Utell, Sci. Total Environ., 2009, 407, 5071–5084 CrossRef CAS PubMed.
- D. Thimmaiah, J. Hovorka and P. K. Hopke, Aerosol Air Qual. Res., 2009, 9, 209–236 CAS.
- D. Ogulei, P. K. Hopke, D. C. Chalupa and M. J. Utell, Aerosol Sci. Technol., 2007, 41, 179–201 CrossRef CAS.
- D. Ogulei, P. K. Hopke, A. R. Ferro and P. A. Jaques, J. Air Waste Manage. Assoc., 2007, 57, 190–203 Search PubMed.
- D. Ogulei, P. K. Hopke, L. Zhou, J. Patrick Pancras, N. Nair and J. M. Ondov, Atmos. Environ., 2006, 40, 396–410 CrossRef PubMed.
- L. Zhou, P. K. Hopke, C. O. Stanier, S. N. Pandis, J. M. Ondov and J. P. Pancras, J. Geophys. Res.: Atmos., 1984–2012, 2005, 110 Search PubMed.
- L. Zhou, E. Kim, P. Hopke, C. Stanier and S. Pandis, Aerosol Sci. Technol., 2004, 38, 118–132 CrossRef CAS.
- A. Al-Dabbous, A. Khan, M. Al-Rashidi and L. Awadi, Indoor Built Environ., 2013, 22, 456–464 CrossRef CAS PubMed.
- A. N. Al-Dabbous and P. Kumar, Atmos. Environ., 2014, 90, 113–124 CrossRef CAS PubMed.
- M. Carpentieri and P. Kumar, Atmos. Environ., 2011, 45, 5837–5852 CrossRef CAS PubMed.
- P. Joodatnia, P. Kumar and A. Robins, Atmos. Environ., 2013, 71, 364–375 CrossRef CAS PubMed.
- P. Joodatnia, P. Kumar and A. Robins, Atmos. Environ., 2013, 65, 40–51 CrossRef CAS PubMed.
- A. Goel and P. Kumar, Atmos. Environ., 2015 DOI:10.1016/j.atmosenv.2015.02.002.
- F. Azarmi, P. Kumar and M. Mulheron, J. Hazard. Mater., 2014, 279, 268–279 CrossRef CAS PubMed.
- P. Kumar and L. Morawska, Atmos. Environ., 2014, 90, 51–58 CrossRef CAS PubMed.
- P. Paatero, S. Eberly, S. G. Brown and G. A. Norris, Atmos. Meas. Tech., 2014, 7, 781–797 Search PubMed.
- G. Norris, R. Duvall, S. Brown and S. Bai, EPA Positive Matrix Factorization (PMF) 5.0 Fundamentals and User Guide, U.S. Environmental Protection Agency, Office of Research and Development, Washington, DC, 2014 Search PubMed.
- A. Reff, S. I. Eberly and P. V. Bhave, J. Air Waste Manage. Assoc., 2007, 57, 146–154 CAS.
- L. L. Ashbaugh, W. C. Malm and W. Z. Sadeh, Atmos. Environ., 1985, 19, 1263–1270 CrossRef CAS.
- D. C. Carslaw and K. Ropkins, Environ. Model. Software, 2012, 27–28, 52–61 CrossRef PubMed.
- E. R. Jayaratne, G. R. Johnson, P. McGarry, H. C. Cheung and L. Morawska, Atmos. Environ., 2011, 45, 3996–4001 CrossRef CAS PubMed.
- V. Tsiouri, K. Kakosimos and P. Kumar, Air Qual., Atmos. Health, 2015, 8, 67–80 CrossRef CAS.
- S. M. Al-Salem and A. R. Khan, Int. J. Chem. Eng., 2010, 879836 Search PubMed.
- M. U. Beg, T. Saeed, S. Al-Muzaini, K. R. Beg and M. Al-Bahloul, Ecotoxicol. Environ. Saf., 2003, 54, 47–55 CrossRef CAS.
- M. Kulmala, H. Vehkamäki, T. Petäjä, M. Dal Maso, A. Lauri, V. M. Kerminen, W. Birmili and P. H. McMurry, J. Aerosol Sci., 2004, 35, 143–176 CrossRef CAS PubMed.
- C. O'Dowd, G. McFiggans, D. J. Creasey, L. Pirjola, C. Hoell, M. H. Smith, B. J. Allan, J. M. C. Plane, D. E. Heard, J. D. Lee, M. J. Pilling and M. Kulmala, Geophys. Res. Lett., 1999, 26, 1707–1710 CrossRef.
- R. B. Stull, An introduction to boundary layer meteorology, Springer, 1988 Search PubMed.
- Y. Fujitani, P. Kumar, K. Tamura, A. Fushimi, S. Hasegawa, K. Takahashi, K. Tanabe, S. Kobayashi and S. Hirano, Sci. Total Environ., 2012, 437, 339–347 CrossRef CAS PubMed.
- A. Can, M. Rademaker, T. Van Renterghem, V. Mishra, M. Van Poppel, A. Touhafi, J. Theunis, B. De Baets and D. Botteldooren, Sci. Total Environ., 2011, 409, 564–572 CrossRef CAS PubMed.
- P. Kumar and B. Imam, Sci. Total Environ., 2013, 444, 85–101 CrossRef CAS PubMed.
- M. Jacobson, D. Kittelson and W. Watts, Environ. Sci. Technol., 2005, 39, 9486–9492 CrossRef CAS.
- M. Dall'Osto, A. Thorpe, D. Beddows, R. Harrison, J. Barlow, T. Dunbar, P. Williams and H. Coe, Atmos. Chem. Phys., 2011, 11, 6623–6637 CrossRef.
Footnote |
| † Electronic supplementary information (ESI) available. See DOI: 10.1039/c5em00027k |
| This journal is © The Royal Society of Chemistry 2015 |