 Open Access Article
Creative Commons Attribution 3.0 Unported Licence
A review of developments in pilot-plant testing and modelling of calcium looping process for CO2 capture from power generation systems
Dawid P.
Hanak
,
Edward J.
Anthony
* and
Vasilije
Manovic
Combustion and CCS Centre, Cranfield University, Bedford, Bedfordshire, MK43 0AL, UK. E-mail: b.j.anthony@cranfield.ac.uk
First published on 8th June 2015
Abstract
A nearly complete decarbonisation of the power sector is essential to meet the European Union target for greenhouse gas emissions reduction. Carbon capture and storage technologies have been identified as a key measure in reducing the carbon-intensity of the power sector. However, no cost-effective technology has yet been developed on a commercial scale, which is mostly due to high capital cost. Moreover, the mature technologies, such as amine scrubbing or oxy-combustion technologies, impose a high projected efficiency penalty (8–12.5% points) upon integration to the power plant. The calcium looping process, which is currently being tested experimentally in bench- and pilot-scale plants worldwide, is regarded as a promising alternative to the chemical solvent scrubbing approach, as it leads to the projected efficiency penalty of 6–8% points. The calcium looping concept has been developing rapidly due to the introduction of new test facilities, new correlations for process modelling, and process configurations for improved performance. The first part of this review provides an overview of the bench- and pilot-plant test facilities available worldwide. The focus is put on summarising the characteristics and operating conditions of the test facilities, as well as extracting the key experimental findings. Additionally, the experimental data suitable for validation or verification of the process models are presented. In the second part, the approaches to the carbonator and the calciner reactor modelling are summarised and classified in five model complexity levels. Moreover, the model limitations are assessed and the needs for modelling baselines for further process analyses are identified. Finally, in the third part the approaches for the integration of calcium looping to the power generation systems and for the improvement of the process performance are identified and evaluated. This review indicates that calcium looping integration resulted in the projected efficiency penalty of 2.6–7.9% points for the coal-fired power plants and 9.1–11.4% points for the combined-cycle power plants. Also, it was found that the calcium looping process can be used to develop a novel high-efficiency (46.7%LHV) coal-fired power generation system, making this technology even more promising compared to the other CO2 capture technologies.
Broader contextFossil fuels are expected to remain essential for the global power generation portfolio. As a result, carbon capture and storage technologies are expected to play a crucial role in greenhouse gas emissions reduction from the power generation sector. Mature technologies, such as amine scrubbing and oxy-combustion that are currently under demonstration at a commercial scale, are projected to reduce the net efficiency of electricity production by up to 12.5% points. For this reason, in order to minimise the efficiency penalty and the associated increase in the cost of electricity, novel CO2 capture technologies are being developed. Calcium looping processes appears to be a promising technology that could reduce the efficiency penalty to 7% points. Development of this technology has advanced at a rapid rate over the past decade, especially since 2009. This review provides a comprehensive overview of bench- and pilot-plant testing, the available models to represent the process performance, alternative process configurations to reduce energy requirements and approaches for process integration for commercial-scale power generation systems. It is shown that further pilot-plant testing to generate data for process models validation could significantly minimise prediction uncertainty. Also, the requirement for baseline modelling assumptions and further development in sorbent performance are highlighted as key to future development. |
1 Introduction
The European Union aims to reduce its greenhouse gas emissions relative to 1990 levels by 30% by 2020,1 40% by 2030,2,3 and 80–95% by 2050. To meet the 2050 target, a nearly complete decarbonisation of the power sector is required due to the high fossil fuel contribution in the energy mix.4 Power generation accounted for more than one-third of the total greenhouse gas emissions in 2010.5 For this reason, transformation of the power generation sector is key to limiting the average global temperature increase.6One reason behind the high carbon intensity of the power generation sector is the major share (42%) of coal-fired power plants (CFPP) in the global supply of electricity,7 the current average net thermal efficiency of which amounts to 33%LHV due to the high (75%) share of subcritical units in the global CFPP fleet.6 Moreover, due to the recent emergence of shale gas in North America, American exports of coal have increased. As a result, the price of coal has fallen significantly in Europe and electricity generation from coal has increased at the expense of gas-based electricity generation.6 If the current market trend continues, coal will continue to be used for power generation as predicted by the Energy Information Administration.8 Hence, a complete decarbonisation of the power sector may be even more challenging in the future.
Carbon capture and storage (CCS) technologies are expected to play a crucial role in greenhouse gas emissions reduction from the power generation sector.9 However, the first-of-a-kind large-scale CO2 capture plant was only commissioned in 2014,10 although the technology required for CCS deployment exists in other industries.6,11 This is because no cost-effective technology for fossil fuel power plants has yet been fully demonstrated on a commercial scale. A relatively high capital cost, due to the size of equipment required to accommodate the flue gas volume, and the efficiency penalty associated with a significant increase in the cost of electricity,12 make CCS infeasible at the moment. Nevertheless, the IEA 2 °C scenario predicts that 63% of the CFPPs will be equipped with CCS installations by 2050.6 There are several mature CO2 capture technologies that are close to market commercialisation in the power generation sector.13,14
The first full-scale capture project at Boundary Dam is based on a chemical absorption post-combustion capture plant using amine solvent,10 with other post-combustion plants and oxy-combustion CFPPs under construction or in the planning stage.9 Such technologies impose a significant projected efficiency penalty reaching up to 12.5% points, identified through analysis of the overall process performance using computational and modelling tools.15–18 A reduction in the process efficiency, in turn, affects fuel economy and thus the cost of electricity. Moreover, these CO2 capture technologies would require additional effort, and therefore cost, to mitigate the environmental, health and safety issues.14 These are the main drivers for development of novel technologies that would affect electricity generation to a lesser degree, and would not be harmful to the environment or human health. A promising alternative to both oxy-combustion and chemical solvent absorption is a second generation CO2 capture technology called calcium looping (CaL) that uses a calcium-based solid sorbent.
Development of the CaL process has advanced at a rapid rate over the past decade, especially since 2009. This is seen not only in the increased number of test facilities, but also in the increase in the development of process models. The CaL process has been widely investigated using thermodynamic and mathematical modelling, computational fluid dynamic (CFD) modelling and process modelling and integration into power generation systems. Analysis of mature technologies using process simulation and modelling tools has revealed that this approach allows a cost-effective investigation of concept feasibility and applicability, as well as development and optimisation of different process configurations. In addition, a whole process approach allows determination of the impact that integration of the CO2 capture plant imposes on the power plant. However, a reliable assessment of the process performance requires the process models to be validated with experimental data.
Although pilot plant facilities and modelling approaches have been reviewed (Table 1), some critical aspects have not been analysed in detail. Moreover, the field of CaL has been developing rapidly due to the introduction of new test facilities, new correlations for process modelling, and CaL process configurations for improved performance. The aim of this paper is to review the available test facilities worldwide, the modelling approaches, and the integration studies that will guide the future development of the CaL process. The focus of the first part of this review will be on recent developments in CaL technology. The second part reviews the available approaches for prediction of the CaL process performance. Finally, the third part identifies and evaluates the approaches for CaL integration into power generation systems.
| Source | Review scope |
|---|---|
| Stanmore and Gilot19 | – Summary of the sintering, sulphation, particle fragmentation and attrition effect on the sorbent activity. |
| – Detailed information on the correlations for mathematical modelling of carbonation, calcination, sulphation and sintering. | |
| – A brief overview of the models for prediction of the aerodynamics and trajectories of particles, as well as reaction rates in the circulating fluidised bed (CFB). | |
| Harrison20 | – Comparison of the standard steam-methane reforming process and the CaL process for H2 production. Review of the thermodynamic analyses, sorbent durability and process configurations. |
| – Review of the experimental studies on hydrogen production. | |
| Florin and Harris21 | – Review of process configurations for the enhanced hydrogen production from biomass gasification. |
| – Summary of the sorbent regeneration measures. | |
| – A brief reference to the sorbent activity decay. | |
| – Review of the experimental trials on hydrogen production from carbonaceous fuels using calcium looping. | |
| Blamey et al.13 | – Detailed description of the carbonation, calcination, sintering and sorbent performance under repeated cycle operation. |
| – Summary of sorbent deactivation and reactivation measures. | |
| – Review of the calcium looping process applications. | |
| – A brief summary of semi-empirical correlations allowing estimation of the sorbent conversion. | |
| Dean et al.14 | – Summary of the calcium looping cycle fundamentals, sorbent deactivation and sorbent performance. |
| – Review of the calcium looping thermodynamic and economic performance, as well as its applicability in the cement industry and hydrogen production. | |
| – A brief reference to the sorbent activity decay. | |
| – Review of the pilot plant trials for calcium looping before 2011. | |
| Anthony22 | – Review of sorbents performance improvements and reactivation strategies for natural and synthetic sorbents. |
| – Brief outline of calcium looping process applicability and experimental facilities. | |
| Liu et al.23 | – Review of sorbent performance enhancements. |
| – Review of synthesis methods for sintering-resistant sorbents. | |
| Kierzkowska et al.24 | – Summary of the carbonation reaction fundamentals. |
| – Review of recent developments in synthesis of CaO-based sorbents. | |
| Romano et al.25 | – Outline of CaL process simulations and notes on further modelling activities. |
| Boot-Handford et al.15 | – Summary of the process performance, sorbent deactivation and regeneration. |
| – A brief update on CaL pilot-plant trials. |
2 Calcium looping process for CO2 capture
2.1 Process description
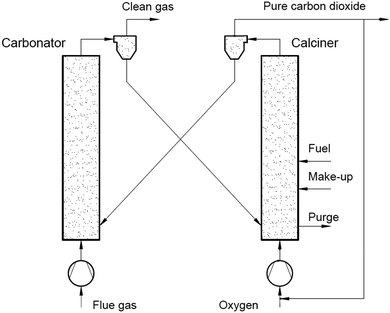
Use of calcium-based sorbents for CO2 absorption was patented in 1933 and the research was primarily directed towards sorption-enhanced hydrogen production.20,26 A configuration proposed by Hirama et al.27 and Shimizu et al.,28 which includes two interconnected CFBs operating under atmospheric pressure (Fig. 1), is the one most commonly referred to in the literature as appropriate for power generation systems. Application of such a configuration for the CaL process with appropriate design of the heat exchanger network (HEN) has been shown to have a thermal efficiency comparable to current combustion systems.29In the CaL process the flue gas from fuel combustion in air, which usually contains between 4%vol and 15%vol CO2 depending on the primary fuel used, is fed to the carbonator. In contrast to amine scrubbing, there is no requirement for flue gas precooling as absorption in the CaL process is conducted at a high temperature to assure high capture efficiency. Under such conditions, CO2 reacts chemically with CaO through an exothermic solid-gas reaction.
CO2 is removed from the flue gas in the form of solid CaCO3 at a reasonably fast rate.26,28,30,31 CO2 removal efficiency decreases rapidly as the temperature increases and becomes zero at approximately 775 °C as the equilibrium partial pressure of CO2 exceeds the partial pressure in flue gas containing 15%vol CO2 above this temperature.32 The optimal operating temperature of the carbonator ranges between 580 °C and 700 °C due to the trade-off between the reaction kinetics and the equilibrium driving forces.33,34
CaCO3 is transferred to another fluidised-bed reactor, the so-called calciner, in which it is calcined and CO2 is reclaimed.26 Calcination is conducted at 850–950 °C to achieve rapid reaction without excessive sintering.14,28,35 It needs to be highlighted that at 900 °C, the equilibrium CO2 partial pressure is about 1 bar,36 and hence a pure CO2 stream can be theoretically achieved in the calciner operated at that temperature under atmospheric conditions. However, the higher calciner temperature is favourable and required in terms of reaction kinetics. On the other hand, a practical conversion rate can be achieved at temperatures below 900 °C if the gas atmosphere in calciner is diluted by steam, which can be easily separated by condensation from the CO2 steam. Furthermore, since high-grade heat is available in the CaL process, which can be recovered to produce additional amounts of steam for the steam cycle, the higher carbonator and calciner temperatures are preferred in order to allow reaching desired steam parameters. Therefore, selection of the CaL operating temperatures can be seen as a design trilemma, in which the CO2 capture level is restricted and process performance must be maximised, while the unit size minimised. As calcination is endothermic, additional fuel in the calciner is required. To produce a CO2 stream of high purity, which can be directly transported for safe storage or use after the purification and compression stages, combustion takes place in an O2/CO2 environment.28,37,38 Although this configuration has been demonstrated at the pilot-plant scale,14 other configurations that use indirect heat sources may become available in future.30,39 It is estimated that the calcination step consumes 35% to 50% of the overall heat input to the system.40
If it were not for sorbent sintering, attrition, and sulphation, the cyclic operation of carbonation and calcination would be performed without sorbent purge and make-up, and these processes would only be limited by thermodynamic equilibrium and the chemical reaction and diffusion rates. Manovic and Anthony41 noted that the carbonator and the calciner should be operated within a particular temperature range in which the minimum temperature is determined by the desired reaction rate while the maximum temperature is related to the desired CO2 concentration. In general, the lower temperature limit is related to the desired partial pressure of CO2, hence purity of the CO2 stream, while the upper temperature is limited by the sorbent structural properties. Unfortunately, the conversion of the sorbent decreases with the number of carbonation and calcination cycles due to changes in particle structure,42 especially due to enhanced sintering of CaO, which has been shown to be enhanced above 900 °C.43 Regardless of having a negative impact on the sorbent performance, sulphur oxides would be efficiently captured due to the high Ca/S ratio in the calciner and the carbonator,44 through indirect (1) and direct sulphation (2).45
| CaO + SO2 + 0.5O2 → CaSO4 | (1) |
| CaCO3 + SO2 + 0.5O2 → CaSO4 + CO2 | (2) |
2.2 Calcium looping as a novel CO2 capture technology
CO2 capture technologies commonly referred to in literature are: absorption-based separation using physical or chemical solvents; adsorption-based separation using solid sorbents; membrane separation; cryogenic separation techniques and oxy-fuel combustion; and biological systems using microbes or algae (Fig. 2).46–49 However, due to the relatively low concentration of CO2 in the flue gas (4–15%vol), large volumes of flue gas need to be processed, and such technologies still have not been commercially deployed in the power industry due to a considerable drop in the net thermal efficiency of the integrated system, and also due to high equipment capital cost. As a result, the cost of electricity in the CFPPs and natural gas-fired combined cycle power plants retrofitted with CCS is expected to increase by 60–125% and 30–55%, respectively.50–52 Although this is the key reason why development of new technologies needs to be pursued, there are also other issues which must be considered, such as environmental impact and operational safety.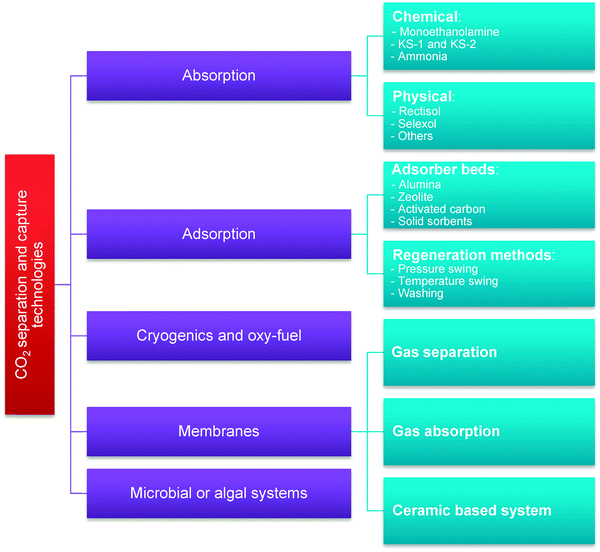 | ||
| Fig. 2 Classification of the CO2 separation and capture technologies (adapted with permission from Rao and Rubin.53 Copyright 2015 American Chemical Society). | ||
Application of amines for CO2 separation, such as monoethanolamine (MEA), has been first proposed for fuel gas or combustion gas by Bottoms in 1930.54 This technology has been widely applied for sour gas sweetening and is used to remove CO2 from natural gas or other industrial gases for ammonia and methanol production, as well as to produce CO2 for enhanced oil recovery.53,55,56 Using MEA or different amine-based solvents, such as piperazine (PZ) or methyldiethanolamine (MDEA), is currently the most likely technology to be applied to reduce the environmental impact of fossil fuel power plants.13,15,57 Although several amine scrubbing processes have been operated in other industries,58,59 the first full-scale demonstration plant using amine scrubbing technology from the power sector, which is Cansolv's integrated SO2/CO2 process fitted to Unit 3 of the Boundary Dam CFPP, and was only commissioned in 2014.10 The following problems need to be resolved before amine scrubbing can be widely deployed in power generation:
• Solvent regeneration uses steam from the power plant steam cycle creating a projected efficiency penalty of 9.5–12.5% points when reference MEA solvent is employed.16–18,60 Yet, recent studies identify that the projected efficiency penalty can be reduced to 8.5% points using amine-blends, such as MDEA/PZ,61 or to 7.0% points using PZ solvent.61,62
• Amine solvents are prone to degradation due to reaction with O2 and O2-containing components in the flue gas, such as NOx and SOx, resulting in heat stable salts.63
• Solvent concentration is limited to 30% (MEA) to prevent plant equipment corrosion.64
• Inappropriate handling and disposal of degradation products may cause environmental and health issues.14,64–66
Using ammonia for CO2 capture, which imposes a lower efficiency penalty, is proposed as an alternative to amine scrubbing.67 Development of ammonia-based CO2 capture processes reached the pilot-plant stage in a relatively short period of time. However, some projects were cancelled due to cost and schedule overruns.68–70 The main advantages of ammonia over amine-based solvents are:
• It is commercially available at a lower price than MEA.
• It has higher CO2 absorption capacity compared to an MEA solution of the same concentration.
• There is lower heat of reaction resulting in lower heat requirement for solvent regeneration. This is reflected in a projected efficiency penalty of 4.1 to 7% points71–73 although this has not been substantiated experimentally.59
• There is no solvent degradation on contact with the flue gas components.
• The stripper can be operated at elevated pressure, hence temperature, leading to reduced compression work.
• Ammonia is not as corrosive as amines and can be used as a multicomponent (CO2, SO2, NOx, HCl and HF) capture solvent.74–76
Unfortunately, although substitution of amines with ammonia may bring some reduction in the energy intensity of the capture process, it does not improve the process safety as ammonia is both a toxic substance and highly flammable. Moreover, a major drawback of ammonia is its high volatility leading to ammonia slip during the CO2 absorption process.63 To comply with environmental requirements, the ammonia slip can be controlled either by adding an additional ammonia water wash or by operating the absorber below 20 °C. Unfortunately, in both cases the resulting capital and operating costs increase and thus, as was expected,59,74,77 only a slight reduction of the average cost of CO2 avoided from $61/t-CO2 to $53/t-CO2 was reported.78
Another technology that is relatively close to market commercialisation is oxy-fuel combustion, in which the fuel is combusted in an O2-rich atmosphere. Although there are neither commercial nor full-scale demonstration plants operating at the moment,59 some projects are in the planning stage.97 However, a recent suspension of funding at an advanced stage of the FutureGen project79,80 shows that completion of such projects is highly dependent upon financial incentives and political climate. The primary advantage of oxy-combustion technology is that it produces a nearly pure CO2 stream after the flue gas has been through SOx and NOx emission control systems and ash separation units. This CO2 then only needs to be conditioned and dehydrated prior to compression and transport. The main challenges of this technology, which are likely to slow its wide implementation, are:
• The net efficiency of the oxy-fuel power plant is reduced by 8–12% points15 because of the cryogenic air separation unit (ASU) for O2 production.13
• High safety standards are required to prevent oxygen leakage.13
• The combustion temperature must be controlled to avoid hot spots in the combustion zone that would enhance NOx production in the boiler.15
• Air leakage into the boiler must be minimised to maintain desired purity of the CO2 stream and to minimise the power requirement of the CO2 compression and purification unit.81,82
If the direct combustion of fuel is considered as a means for satisfying the heat requirement in the calciner, the CaL process can be seen as a merging of the post-combustion CO2 capture and the oxy-combustion technologies, where only some portion of fuel is burned in an O2-rich environment. Currently, CaL concepts are being tested experimentally at bench- and pilot-scale plants worldwide. The main advantages of the CaL system over the solvent-based CO2 capture technologies are:
• Heat can be recovered and used to generate an additional amount of high-pressure steam through the exothermic carbonation of lime at 650–700 °C and utilisation of heat available in the process streams.83
• The predicted efficiency penalty is 7% to 8% points,84 with the CO2 capture stage accounting for 2% to 3%, which is mainly due to the oxygen requirement.39 This is comparable to the efficiency penalty of a flue gas desulphurisation unit (FGD) (0.5–4%).85
• The technology uses fluidised bed reactors, which have been commercially proven for coal combustion systems.
• Compared to an oxy-fuel power plant, 30–50% less O2 is required for oxy-combustion of fuel in the calciner, leading to smaller ASU size.28,39
• Natural limestone or dolomite, the source for CaO, is globally available and inexpensive31 and CaO is characterised by high CO2 absorption capacity.
• The average cost of CO2 avoided is estimated to be $29–50/t-CO2 which is more than 50% less than for amine scrubbing.78,86–89
• Compared to solvents, CaCO3 and CaO are much less hazardous to the operators’ health and the environment.14
Reduction in the sorbent CO2 carrying activity on cycling operation as a result of sintering, attrition and sulphation appears to be the major challenge of this technology. Although this results in a considerable amount of spent sorbent to be replaced, some part of the sorbent can be reused for cement production, increasing the profitability of both the power and cement industries.14
3 Review of calcium looping bench- and pilot-scale testing
Insight into system behaviour under various operating conditions is required to optimise process parameters and to assess feasibility, before commercial-scale installations are designed and built. Although the CaL process has only been considered for CO2 capture from fossil-fuel power systems since 1999, a number of test facilities have already been built (Table 2), with rapid progress after 2009. The review by Dean et al.14 devoted to the CaL process has described bench-scale tests using the 10 kWth unit at IFK (University of Stuggart), 30 kWth unit at the INCAR-CSIC, 75 kWth unit at CANMET Energy and 120 kWth unit at the Ohio State University. However, this review mostly focused on the attrition and material performance during the bench-scale tests. Moreover, the developments in the pilot-plant testing by 2010 and 2013 have been outlined by Anthony22 and Boot-Handford et al.,15 respectively. This section focuses on the progress in CaL process testing at a bench- and pilot-scale from 2010, with the aim of gathering the valuable design and operational data for development and validation of process models.| Research institute | Size (kWth) | Carbonator | Calciner | Inlet CO2 content (%vol) | Max. CO2 capture level (%) | CO2 purity (%vol) | ||||||
|---|---|---|---|---|---|---|---|---|---|---|---|---|
| Typea | Diameter (m) | Height (m) | Temperature (°C) | Typea | Diameter (m) | Height (m) | Temperature (°C) | |||||
| a BFB – bubbling fluidized bed; CFB – circulating fluidised bed; MB – moving bed; EB – entrained bed; RK – rotary kiln. b Equivalent diameter based on cross-section area. | ||||||||||||
| Industrial Technology Research Institute | 1 | BFB | 0.1 | 2.5 | 600–700 | MB | 0.05 | 0.9 | 800–900 | 12.5 | 99 | N/A |
| 3 | BFB | 0.1 | 2.5 | 600–700 | RK | 0.27 | 5 | 500–1000 | 12.5 | 99 | N/A | |
| 1900 | BFB | 3.3 | 4.2 | 650 | RK | 0.9 | 5 | 500–1000 | 12.1–14.5 | N/A | N/A | |
| Consejo Superior de Investigaciones Científicas | 30 | CFB | 0.1 | 6.5 | 568–722 | CFB | 0.1 | 6 | 800–1000 | 15–16 | 90 | 27 |
| 1700 | CFB | 0.65 | 15 | 600–715 | CFB | 0.75 | 15 | 820–950 | 12.5 | 90 | 85 | |
| Darmstadt University of Technology | 1000 | CFB | 0.59 | 8.66 | 650–670 | CFB | 0.4 | 11.35 | <1000 | 12–12.6 | 92 | N/A |
| IFK at University of Stuttgart | 10 | BFB | 0.114 | 3.5 | 630–700 | CFB | 0.071 | 12.4 | 850–900 | 15 | 97 | 20–55 |
| 200 | CFB | 0.023 | 10 | 650 | CFB | 0.021 | 10 | 875–930 | 15 | N/A | N/A | |
| 200 | CFB | 0.033 | 6 | 600–680 | CFB | 0.021 | 10 | 875–930 | 15–16 | 93 | N/A | |
| Ohio State University | 120 | EB | N/A | N/A | 450–650 | RK | N/A | N/A | 850–1300 | 3–25 | >90 | N/A |
| Vienna University of Technology | 100 | BFB | 0.28b | 2 | 650 | CFB | 0.08b | 5 | 850 | N/A | N/A | N/A |
| CANMET Energy | 75 | BFB/MB | 0.1 | 2–5 | 580–720 | CFB | 0.1 | 4.5–5 | 850–950 | 8 | 97 | N/A |
| Cranfield University | 25 | EB | 0.1 | 4.3 | 600–650 | BFB | 0.165 | 1.2 | 900–950 | 15 | 80 | N/A |
| Tsinghua University | 10 | BFB | 0.149 | 1 | 630 | BFB | 0.117 | 1 | 850 | 15 | 95 | 22.5 |
3.1 Industrial Technology Research Institute
3.1.1.1 Bench-scale unit. The Industrial Technology Research Institute (ITRI) in Taiwan has developed a 1 kWth bench-scale unit, which can be operated in either batch or continuous mode. The unit comprises a bubbling fluidised bed (BFB) carbonator (gas velocity of 0.2–0.4 m s−1), with a gas distributor located at the entrance, and a moving bed (MB) calciner. The solids are transported between the carbonator and the calciner through a 2.5-cm solid circulation pipe of 0.5 m length.90
The unit was modified by substituting the MB calciner with an air-fired rotary kiln calciner (RK) (Fig. 3). This increased the capacity to 3 kWth. The calciner was designed to have a length-to-diameter ratio of 18.5 and an inclination angle of 5°, based on operating experience from the cement industry. Such design corresponds to a residence time of approximately 30 min at a speed of 1 rpm. Furthermore, liquefied petroleum gas is directly fired in the calciner using the 58 kWth burner. The gas enters the BFB carbonator through the perforated plate distributor composed of 96 holes of 1.5 mm in diameter. Although the carbonation reaction is exothermic, the carbonator was heated using an external heating system to balance the heat losses to the environment.91
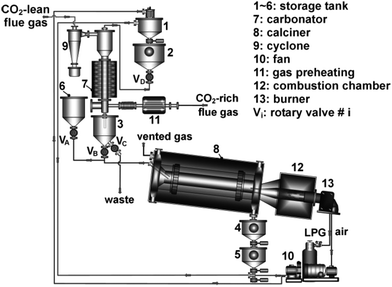 | ||
| Fig. 3 3 kWth bench-scale unit at ITRI (reprinted with permission from Chang et al.91 Copyright 2015 Wiley). | ||
3.1.1.2 Pilot-scale facility. Design of the 1.9 MWth pilot plant, which removes a tonne of CO2 per hour from the Hualien cement plant flue gas containing 20–25% of CO2,92 was based on experience with the 3 kWth unit. The perforated plate gas distributor was selected due to higher attainable velocities, based on cold model tests. The design consists of a double-layered perforated plate with 6 mm holes and an open-area ratio of 1.56%. As a means of temperature control thirty-six 2 m water-cooled double steel jackets were suspended at the top of the carbonator. The system is designed to operate with an average conversion of 20–40% and CO2 capture levels of 80–95%. Heat for calcination is provided through direct oxy-combustion of diesel in the RK calciner which requires flue gas recirculation for temperature control. A key benefit of this configuration is more uniform temperature distribution in the calciner and thus, increased usable length for calcination.
During 57 h of continuous operation 0.1 kg h−1 of fresh limestone was supplied to the calciner. The experiment revealed that the CO2 capture level in the carbonator was maintained at above 99% over the entire time. Although preliminary results indicated the practicability of such a configuration, the MB carbonator was difficult to operate.91
The first test performed using the modified 3 kWth unit was a batch test to evaluate operation of the RK calciner. It demonstrated that if the calciner is fed with fresh limestone at the rate of 6 kg h−1, the useable length for the calcination reaction is approximately 1.5 m, corresponding to a sorbent residence time of 9 minutes. This arises because a temperature of 1000 °C was observed 1 m from the combustion chamber and thus excessive sintering would occur in this region (Fig. 4). On the other hand, a temperature of 721 °C was observed 2 m from the combustion chamber causing operating conditions downstream of the calciner to be unsuitable for the endothermic calcination reaction. Nevertheless, the calcination efficiency was found to be higher than 96%, while the carbonation conversion was 63.7%, proving low sorbent sintering rates.91
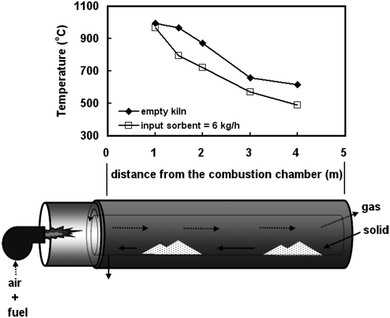 | ||
| Fig. 4 Temperature distribution in the rotary kiln calciner in the first test (reprinted with permission from Chang et al.91 Copyright 2015 Wiley). | ||
The 3 kWth pilot plant was then used to run a 100 h campaign, the main objective of which was to keep the CO2 capture level above 85%. This campaign showed that selection of the appropriate fresh sorbent make-up rate and spent sorbent purge rate is not only critical for reaching the desired CO2 capture level, but also for ensuring stable and efficient operation of the system; if the make-up rate was lower than the purge rate, the total solid inventory in the system was reduced and excessive degradation of the sorbent activity was observed. On the other hand, increasing the solid inventory through an increased make-up rate improved the CO2 capture level to above 99%. However, this would increase the operating cost of the process as it would require more heat input to the calciner. It needs to be highlighted that such a high level of inventory in the calciner had not been expected at the design stage, and thus, its efficiency dropped to 39% because insufficient heat was supplied through liquid petroleum gas combustion to sustain the endothermic calcination reaction.
When the inventory in the carbonator, which was operated at approximately 650 °C, fluctuated around the desired value the CO2 capture level varied between 80% and 100%. The average residence time of solids in the carbonator was 2 h, with an average conversion of solids in the carbonator of 30% and a calcination efficiency of 75%. This campaign also revealed that particle attrition is an important phenomenon in the CaL system as the mean particle size decreased from 248 μm to 188 μm over this period.91
3.2 Consejo Superior de Investigaciones Científicas
3.2.1.1 Bench-scale unit. The Instituto Nacional del Carbón – Consejo Superior de Investigaciones Científicas (INCAR-CSIC) has developed a 30 kWth unit which consists of two interconnected CFB reactors. The carbonator is 6 m high and 0.1 m in internal diameter. It is fluidised using a synthetic flue gas containing 3–25%vol of CO2 and is operated at 568–722 °C.93 The heating system in the carbonator is only used during system start-up. Coal is combusted in 2–6% excess air to maintain the desired temperature in the calciner.93 The calciner is 6.5 m high and the same internal diameter and is operated at 800–900 °C. Each reactor is equipped with a high-efficiency cyclone, from which the solids are directed through a vertical standpipe to the BFB loop seal.94
3.2.1.2 Pilot-scale facility. By combining the experience gained through running the 30 kWth unit and the industrial experience for large-scale CFB combustors, INCAR-CSIC in agreement with ENDESA, Foster Wheeler and HUNOSA, with substantial R&D support from University of Stuttgart (IFK), Lappeenranta University, Imperial College and the University of Ottawa and CanmetENERGY, developed a 1.7 MWth pilot plant designed to process approximately 1% of the flue gas produced in the 50 MWel La Pereda CFPP in Asturias, Spain (Table 4). This project, called CaOling, was part-funded by the European Union 7th Framework Programme. The pilot plant comprises two interconnected CFB reactors 15 m in height with an internal diameter of 0.75 m in the calciner and 0.65 m in the carbonator (Fig. 5) operating with gas velocities of 3–5 m s−1 which are similar to those encountered in industrial CFBs.95
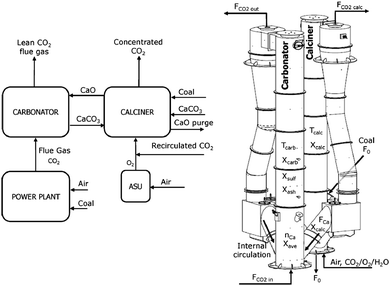 | ||
| Fig. 5 Design of the 1.7 MWth pilot plant at INCAR-CSIC (adapted with permission from Arias et al.96 Copyright 2015 Elsevier). | ||
The typical operating temperatures for the carbonator and calciner are 600–715 °C and 820–950 °C, respectively. The temperature in the carbonator can be controlled through removable bayonet tubes. The calciner is directly fired with coal, either in an oxy-combustion or air-combustion environment. Fresh limestone is continuously fed to the calciner to maintain the desired average conversion of sorbent of 0.1–0.7 (Table 3). In both CFB reactors the solids leaving the risers are separated from the gas stream in the high-efficiency cyclones, and then directed to the double BFB loop seals by gravity. This design allows control of the solid looping rates between, and thus the solid inventories in, the CFB reactors.96
| Input from power plant | Value | Pilot plant operating conditions | Value |
|---|---|---|---|
| a Nitrogen concentration calculated to balance the remaining constituents. | |||
| Flue gas flow rate (kg h−1) | 680–2300 | Maximum coal flow (kg h−1) | 325 |
| CO2 concentration (%vol) | 12.6 | Maximum fresh sorbent flow (kg h−1) | 300 |
| O2 concentration (%vol) | 5.5 | O2 flow to calciner (kg h−1) | 300–600 |
| H2O concentration (%vol) | 7.0 | CO2 flow to calciner (kg h−1) | 700–2250 |
| SO2 concentration (%vol) | 0.07 | Air flow to calciner (kg h−1) | 600–2500 |
| N2 concentration* (%vol) | 74.83 | Inventory in carbonator (kg m−2) | 100–1000 |
| Parameter | Minimum | Maximum |
|---|---|---|
| CFB calciner | ||
| Initial sorbent inventory (kg) | 4.5 | 5.0 |
| Sorbent make-up batch (kg) | 0.3 | 0.5 |
| Biomass consumption rate (kg h−1) | 4.0 | 7.6 |
| Coal consumption rate (kg h−1) | 2.6 | 5.8 |
| Air flow rate (air-firing mode) (kg h−1) | 8.0 | 14.4 |
| O2 flow rate (oxy-firing mode) (kg h−1) | 5.2 | 7.7 |
| Moving or bubbling FB carbonator | ||
| Air flow rate (slpm) | 40 | 100 |
| CO2 flow rate (slpm) | 7.5 | 19.0 |
| CO2 concentration at inlet (%vol) | 15.0 | 16.5 |
| Air flow for solid conveying (slpm) | 35 | 55 |
On extension of the risers' heights and reconstruction of the high-efficiency cyclones, the system stability was improved. The modified system operated with CO2 capture levels of 70–90%, which were close to the equilibrium value at 650 °C, depending on the gas velocity (2.0–2.1 m s−1) and the solids circulation rates (0.8–2.3 kg m−2 s−1). However, for the highly cycled particles, which can attain an average conversion close to the residual conversion of 0.07–0.12, the CO2 capture level dropped to 65–75% for a solids circulation rate of 1.0–1.8 kg m−2 s−1.94
In tests carried out by Rodríguez et al.,93 the 30 kWth unit was used to treat flue gas containing 20%vol CO2. Initially 20 kg of limestone was loaded into the system that was operated at 800–850 °C for the calciner and 630–700 °C for the carbonator, with gas velocities of 3 m s−1. The analysis revealed that the purity of the CO2 stream released from the calciner was approximately 27%vol and the concentration of CO2 in the clean gas was approximately 7%vol. This corresponded to an actual CO2 capture level of approximately 70%, which was lower than the equilibrium CO2 capture level within this temperature range. It was found that under realistic operating conditions an actual CO2 capture level of 70–90% was achievable for bed inventories of 400 kg m−2 for solid looping rates of 0.5–2.2 kg m−2 s−1.
Representative results from the experimental trials were reported for the first time by Sánchez-Biezma et al.97 (Fig. 6). These results confirm the findings from previous studies that if the process is operated with proper solid inventory and sorbent activity, the actual CO2 capture in the carbonator is close to the equilibrium value at given temperature (above 90% at 660 °C). Moreover, a SO2 capture level of more than 95% was achieved.
 | ||
| Fig. 6 Representative steady state results captured during testing of the 1.7 MWth pilot plant at INCAR-CSIC (reprinted with permission from Sánchez-Biezma et al.97 Copyright 2015 Elsevier). | ||
As no fresh limestone was added to the system, the conversion of the CaO to CaCO3 decreased towards the residual value of 0.1. Also, there were several issues with maintaining proper solid inventories when the oxy-firing mode was tested. Although CO2 purity in the gas leaving the calciner reached 85% when the calciner temperature was 950 °C, low solid inventory and sorbent activity caused the CO2 capture level to drop below the equilibrium level, to around 75%. Nevertheless, the authors claim that high CO2 capture levels can be achieved even if highly deactivated sorbent is used with high sulphate conversions, provided the system is operated with the proper solid inventory.
Arias et al.96 reported and thoroughly investigated the steady state operation of the 1.7 MWth pilot plant at INCAR-CSIC. In the initial phase of the experimental trials, a CO2 capture level of less than 40% was reached due to the high content of non-calcined limestone in the solid inventory because the calciner was operated below 920 °C. Moreover, the conversion dropped to 0.067 after more than 5 h of continuous operation without fresh limestone make-up. The same conclusion was drawn as in the study by Sánchez-Biezma et al.97 that a CO2 capture level of more than 80% can be reached, even when the sorbent has reached its residual conversion and there is a high SO2 capture level (95%), provided enough solid inventory is available. These results confirm trends determined using the 30 kWth unit and prove that the solid inventory and the sorbent conversion are the most relevant operating parameters in the carbonator reactor.
Tests conducted using both facilities revealed that the carbonator operates at nearly isothermal conditions, which allows the assumption of isothermal conditions in modelling the FB reactors. Moreover, the actual CO2 capture level was found to be close to that determined by equilibrium at a given temperature. Such assumption is, however, only valid for relatively active sorbent, as the experimental trials showed a reduction in CO2 capture level for highly cycled particles.
3.3 Institute of Energy Systems and Technology at Darmstadt University of Technology
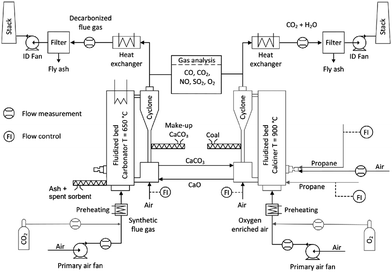 | ||
| Fig. 7 Process flow diagram of the 1 MWth pilot plant at Darmstadt University of Technology (reprinted with permission from Ströhle et al.98 Copyright 2015 Elsevier). | ||
Unlike other pilot plants, the solids between the loop seals of the CFBs are transferred by screw conveyors. These can be equipped with heat transfer jackets, allowing for accurate control of solids circulation rate and are capable of flexible operation under various loads. However, in a commercial-scale unit, large volumes of solids will be transferred between the reactors and the solid loads will vary due to changes in the power plant load, making the screw conveyors mechanically inefficient.99 The flue gas and the CO2 stream are subsequently cooled down in the heat exchangers, and then cleaned from fly ash in the fabric filters.
After increasing the power of the burners and the lances and improving the cyclone performance, a second test campaign using propane firing in the calciner was carried out. These changes led to a significant reduction in the make-up rate. Moreover, the fluidisation air was enriched with 50% O2 to maintain a desirable gas velocity in the calciner and to ensure nearly complete combustion of propane. Again, the carbonator was operated at 660 °C and was fed with synthetic flue gas containing 12%vol CO2. To maintain a desired average CO2 capture level in the carbonator, the solid looping rate was kept at 2000 kg h−1, which corresponded to an average Ca![[thin space (1/6-em)]](https://www.rsc.org/images/entities/char_2009.gif) :
:![[thin space (1/6-em)]](https://www.rsc.org/images/entities/char_2009.gif) C molar ratio of 11.6. The maximum CO2 capture level in the carbonator was found to be 85%, increasing to 92% when oxy-combustion of propane in the calciner is considered.
C molar ratio of 11.6. The maximum CO2 capture level in the carbonator was found to be 85%, increasing to 92% when oxy-combustion of propane in the calciner is considered.
In the third campaign, the calciner was fired with pulverised coal and the fluidisation air was enriched by 45–50% O2. The temperature in the carbonator reached 670 °C. The same amount of synthetic flue gas was used as in the second campaign. To reach the same CO2 capture level in the carbonator (85%), the solid looping ratio needed to be increased to approximately 2800 kg h−1 (Ca![[thin space (1/6-em)]](https://www.rsc.org/images/entities/char_2009.gif) :
:![[thin space (1/6-em)]](https://www.rsc.org/images/entities/char_2009.gif) C = 17.2). The CO2 concentration in the clean gas was close to the equilibrium CO2 concentration at that operating temperature. Therefore, the reaction was limited by chemical equilibrium leading to stable operating conditions. The CO2 capture level dropped to approximately 60% when the temperature in the carbonator dropped to 610 °C.98
C = 17.2). The CO2 concentration in the clean gas was close to the equilibrium CO2 concentration at that operating temperature. Therefore, the reaction was limited by chemical equilibrium leading to stable operating conditions. The CO2 capture level dropped to approximately 60% when the temperature in the carbonator dropped to 610 °C.98
3.4 Institute of Combustion and Power Plant Technology at University of Stuttgart
3.4.1.1 10 kWth bench-scale dual fluidised bed unit. The Institute of Combustion and Power Plant Technology (Institut für Feuerungs-und Kraftwerkstechnik, IFK) at the University of Stuttgart has developed a CaL bench-scale unit based on a 10 kWth dual fluidised bed (DFB) that can be operated in continuous mode.100 The practicability and stability of the DFB system was first analysed using a down-scaled cold model.101,102
In the 10 kWth IFK unit, the CFB (gas velocity of 4–6 m s−1) and the BFB (gas velocity less than 1.2 m s−1) can each be operated either as the carbonator or calciner. A benefit of operating the BFB as the carbonator and the CFB as the calciner is ease in process control. The novel configuration of this DFB system results in control of the calcium circulation rate between the beds by varying the cone valve opening and the BFB absolute pressure. Due to heat losses to the environment, the CFB, the BFB and the solid circulation system are electrically heated.103 The temperature in the calciner can be raised by direct natural gas combustion in O2-enriched air (40%vol O2), if the electric heating system capacity is insufficient.100
3.4.1.2 200 kWth pilot-scale dual fluidised bed facility. To investigate the long-term performance of the process under real combustion conditions, a 200 kWth pilot plant was built at the IFK. The pilot plant design includes a CFB calciner operating in a fast-fluidisation regime and a reconfigurable CFB carbonator that can operate either under a turbulent or fast-fluidised fluidisation regime (Fig. 8).104,105 A design involving two symmetric CFBs, which operate in a fast-fluidised regime, required redesign of the solid circulation system and implementation of two cone valves for controlling the looping ratios in both CFBs independently.105 Conversely, for the configuration with the carbonator operating in the turbulent regime, the solid circulation rate is controlled through the L-valve which is directly fed from the CFB calciner.104
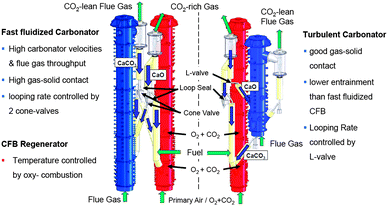 | ||
| Fig. 8 Comparison of 200 kWth DFB pilot plant configurations at IFK.106 | ||
The fast-fluidised CFB calciner, 10 m in height and 0.021 m in internal diameter, is equipped with a staged oxidant supply for oxy-combustion of solid fuel (coal, wood pellets, wood chips). Although the firing system is designed to handle up to 70%vol O2 to meet the energy demand in the calciner, flue gas recirculation is implemented to achieve realistic operating conditions. In the turbulent fluidised bed carbonator (6 m in height and 0.033 m in internal diameter), the heat is removed using the FB heat exchanger. It is also designed to operate under lower fluidisation velocities and with lower residence time than the CFB carbonator.104 The fast-fluidised CFB carbonator, 10 m high and 0.023 m in internal diameter,102 is fluidised with the flue gas, and the heat released due to the exothermal reaction is removed via a water-cooled heat exchanger in the dense bed region and bayonet cooler in the lean bed region. The facility has a 400 kWth gas burner to generate hot gas and heat up the system during start-up. To minimise the heat loss in the system, the reactors are lined with insulating concrete and refractory material resistant to abrasion.105
The effect of the carbonator operating temperature and the CO2 capture level was then analysed and compared with the equilibrium data. The CO2 capture level was reported to be close to that determined by chemical equilibrium at the given temperature, which was assured by maintaining a Ca![[thin space (1/6-em)]](https://www.rsc.org/images/entities/char_2009.gif) :
:![[thin space (1/6-em)]](https://www.rsc.org/images/entities/char_2009.gif) C ratio higher than 14.103 A recent study by Varela et al.107 identified that the CO2 capture level of 90% is achievable at Ca
C ratio higher than 14.103 A recent study by Varela et al.107 identified that the CO2 capture level of 90% is achievable at Ca![[thin space (1/6-em)]](https://www.rsc.org/images/entities/char_2009.gif) :
:![[thin space (1/6-em)]](https://www.rsc.org/images/entities/char_2009.gif) C ratio of 8, provided that steam is present in the carbonator and the calciner. Such behaviour is explained by likely enhancement of sorbent morphology in the presence of steam, favouring sorption and desorption of CO2. Moreover, the increase of the CO2 concentration in the calciner, which can be associated with CO2 recycle to lower O2 concentration in the fluidising gas, was found to significantly affect the reactor efficiency.
C ratio of 8, provided that steam is present in the carbonator and the calciner. Such behaviour is explained by likely enhancement of sorbent morphology in the presence of steam, favouring sorption and desorption of CO2. Moreover, the increase of the CO2 concentration in the calciner, which can be associated with CO2 recycle to lower O2 concentration in the fluidising gas, was found to significantly affect the reactor efficiency.
Although O2 concentrations reached 50%vol during wood pellet combustion, no hot spots were observed and the temperature profile in the calciner was uniform (875–930 °C). This indicates the key benefit of staged oxidant supply. However, the desired temperature of 650 °C was observed only in the dense region of the turbulent FB carbonator, while the temperature was reduced in the upper region. Nevertheless, the CO2 capture level was maintained above 90% indicating that most of the reaction takes place in the dense region. Fluctuations in the carbonator temperature (620–650 °C) have a minor effect on the carbonator efficiency. Furthermore, higher CO2 capture levels are obtained if wet flue gas, such as from the desulphurisation unit, is fed to the carbonator. These results were found to closely follow the trend determined by the equilibrium calculations revealing good gas-solid contact in the carbonator (Fig. 9). This means that lower looping ratios would be required to reach the desired CO2 capture level, leading to energy saving in the regenerator.104
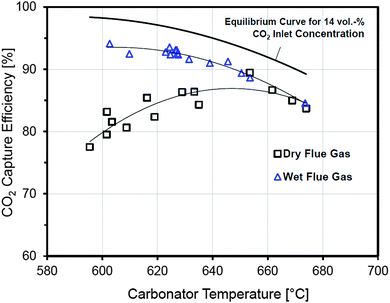 | ||
| Fig. 9 Effect of the carbonator temperature on the CO2 capture level data from the 200 kWth DFB at IFK.106 | ||
![[thin space (1/6-em)]](https://www.rsc.org/images/entities/char_2009.gif) :
:![[thin space (1/6-em)]](https://www.rsc.org/images/entities/char_2009.gif) C > 14 are assumed.
C > 14 are assumed.
3.5 Ohio State University
In the 120 kWth sub-pilot plant (Fig. 10) the CaO or Ca(OH)2 can be fed to the carbonator, which is the entrained bed (EB) reactor operated at 450–650 °C to allow for CO2 and SO2 capture. Sorbent regeneration is conducted in the electrically-heated RK calciner. Calcined sorbent is then hydrated using steam to improve the sorbent conversion over multiple cycles.112 Some of the deactivated sorbent (2–10%) is purged and the fresh sorbent is fed directly to the calciner.
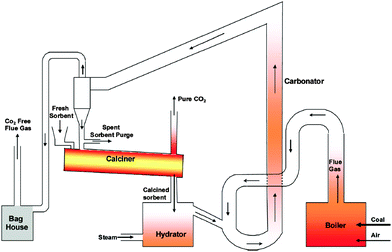 | ||
| Fig. 10 Process flow diagram of the Ohio State University sub-pilot plant (reprinted with permission from Wang et al.112 Copyright 2015 American Chemical Society). | ||
In the once-through test, Wang et al.112 showed that the presence of fly ash in the carbonator does not affect the CO2 and SO2 capture levels. In addition, the amount of fly ash entering the carbonator needs to be considered when deciding on the purge fraction to maintain the proper amount of active sorbent in the system.
The study clearly indicated that application of Ca(OH)2 with the mass median diameter (D50) of 3 μm results in CO2 capture levels between 40 and 100% for Ca![[thin space (1/6-em)]](https://www.rsc.org/images/entities/char_2009.gif) :
:![[thin space (1/6-em)]](https://www.rsc.org/images/entities/char_2009.gif) C ratios between 0.5 and 1.7. This performance was superior to traditional lime, as CO2 capture levels of 9% were found for ground lime (D50 = 600 μm) and pulverised ground lime (D50 = 18 μm) at the same Ca
C ratios between 0.5 and 1.7. This performance was superior to traditional lime, as CO2 capture levels of 9% were found for ground lime (D50 = 600 μm) and pulverised ground lime (D50 = 18 μm) at the same Ca![[thin space (1/6-em)]](https://www.rsc.org/images/entities/char_2009.gif) :
:![[thin space (1/6-em)]](https://www.rsc.org/images/entities/char_2009.gif) C ratio. Nevertheless, as pointed out by Dean et al.,14 separation and fluidisation of such small particles from the gas stream in industrial-scale reactors would be extremely challenging and, therefore, the process feasibility and practicability is somewhat questionable.
C ratio. Nevertheless, as pointed out by Dean et al.,14 separation and fluidisation of such small particles from the gas stream in industrial-scale reactors would be extremely challenging and, therefore, the process feasibility and practicability is somewhat questionable.
The results of the test campaign are detailed enough to validate the global performance of a model. Unfortunately, no detailed information is provided on the local data, such as the solid looping rates or limestone make-up.
3.6 CANMET Energy Technology Centre
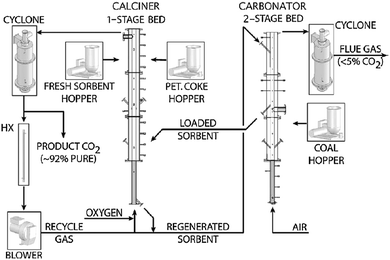 | ||
| Fig. 11 Schematic of the 75 kWth pilot plant developed at CANMET Energy (reprinted with permission from Hughes et al.29 Copyright 2015 Elsevier). | ||
Depending on the application the calciner is 4.5–5 m in height and 0.1 m in internal diameter and can be operated under air, O2-enriched air or oxy-firing with flue gas recycle. The carbonator was divided into two stages to distinguish the combustion/sulphation and carbonation processes. Therefore, depending on the test performed it is 2–5 m in height and 0.1 m in internal diameter. Such configuration allows air or a mixture of air and superheated steam to fluidise both stages. To minimise the heat losses in the system, the reactors are lined with refractory and insulation materials. Moreover, each reactor is equipped with three 4.5–5 kWel electric heaters that are used during start-up and sometimes to control the reactor temperature.33,113 The CANMET Energy pilot plant has a novel solid transport system for sorbent looping that includes a 45° “T” that collects solids from the calciner-pierced distributor. The solids rate through the conveying line to the carbonator is controlled using a solenoid valve. The calcined sorbent enters the carbonator through the L-valve. Similarly, the 45° “T” line allows the carbonated sorbent to be directed to the calciner or to the second stage of the carbonator for SO2 capture.
The tests performed by Lu et al.33 confirmed that the CaL system can operate with a CO2 capture level of 97% within the first several cycles. As the superficial gas velocity was increased, the CO2 capture level decreased, which can be associated with lower residence time of gas in the carbonator. A considerable drop in the CO2 capture level to approximately 72% was observed after 25 cycles. This confirms the impact of sorbent deactivation on process performance and implies the need for fresh sorbent make-up. The highest CO2 capture level (98%) was reached within the temperature window of 580–600 °C for fresh sorbent and approximately 700 °C after 20 cycles. When the temperature dropped below 500 °C, the reaction rate slowed significantly. This was reflected in the off-gas CO2 concentration of approximately 9–10%vol CO2, hence in a drop of CO2 capture level.
Finally, testing oxy-combustion of fuel in the calciner has proven this approach to be appropriate for providing heat for sorbent regeneration. There were no hot spots in the calciner, in spite of the high O2 concentration in the primary gas of 40–50%vol balanced with the recycled flue gas. The maximum concentration of CO2 was 85%vol.
3.7 Cranfield University
The calciner is directly heated through oxy-combustion of natural gas. The resulting flue gas is used as the fluidising medium. The flue gas generated in the air-combustion of natural gas, which contains 8%vol CO2, is used as the fluidising medium in the carbonator. The optimal operating gas input rates are presented in Table 5. Solid input to the calciner is achieved using a screw feeder with a maximum feeding rate of 1.6 kg h−1. This proves the practical applicability of the screw conveyors for solid fuel and sorbent handling in the CaL units, as explained in Section 3.3.1. The solid looping rates are controlled via two fluidised loop seals, at the top and bottom of the calciner.115 The unit has two cyclones at the top of the carbonator to ensure that the sorbent lost with the flue gas is kept to a minimum.114
| Fluidising gas | Carbonator | Calciner |
|---|---|---|
| CO2 volumetric flow rate (L min−1) | — | 40 |
| O2 volumetric flow rate (L min−1) | — | 16 |
| Air volumetric flow rate (L min−1) | 150 | — |
| CH4 volumetric flow rate (L min−1) | 22.5 | 11 |
Moreover, in batch runs the optimum CO2 capture level, which was close to 90%, occurred for particle sizes between 125–250 μm. This was in agreement with results from another study carried out in the same group by Kavosh.116 This behaviour was explained by an increase in the surface-to-volume ratio as the particle size was reduced. However, it was found that below 125 μm, the CO2 capture level dropped below 50%. It appears that such small particles were Geldart's group C, and thus were difficult to fluidise leading to bed agglomeration.117
The maximum CO2 capture level of 80% in the carbonator was reached after rig modifications resulting from the cold model, temperature and particle size distribution optimisation, and implementation of air shakers and heating elements to the loop seals to enhance solids transfer and temperature.115
3.8 Tsinghua University
In continuous CO2 capture from synthetic flue gas, the calciner was operated at 810 °C, which led to maximum purity of 22.5%vol CO2. On the other hand, the carbonator was operated at 640 °C reducing the CO2 fraction in the clean gas to 0.7%vol, which corresponds to a CO2 capture level of 95%. Under such operating conditions the average conversion in the carbonator reached 70.4%. Due to incomplete calcination, the average conversion of particles leaving the carbonator was 16.2%. Finally, Fang et al.118 have noted that after 7 h of continuous operation, the mean size of the particles was reduced to 0.16 mm and 0.42 mm in the calciner and the carbonator, respectively.
3.9 Vienna University of Technology
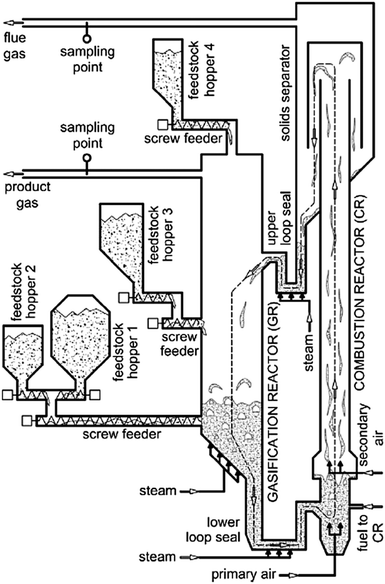 | ||
| Fig. 12 Process flow diagram of the 100 kWth bench-scale plant at Vienna University of Technology (reprinted with permission from Kirnbauer et al.126 Copyright 2015 Elsevier). | ||
In the conventional solid feedstock gasification process the BFB gasifier reactor operates at 850–900 °C, while air-combustion of fuel in the CFB combustor takes place at 920 °C. For this system, olivine was a suitable bed material with satisfactory resistance to attrition and moderate tar cracking activity.120 The solids are transported between the reactors via two loop seals which are fluidised with steam. The concept was then successfully used for development of the biomass-fired 8 MWth combined heat and power plant in Guessing, Austria that delivers 1.8 MWel of electricity and 4.5 MWth of heat to the local community.124
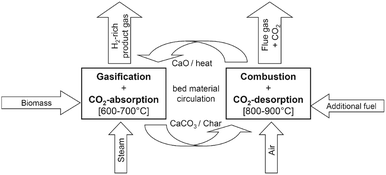 | ||
| Fig. 13 Schematic representation of the sorption-enhanced reforming process with in situ CO2 capture using calcium looping process (reprinted with permission from Koppatz et al.125 Copyright 2015 Elsevier). | ||
The analysis by Pfeifer et al.120 has revealed that compared to the conventional process, up to 70%vol higher H2 yields are achievable. This is largely the result of an equilibrium shift in the water-gas shift reaction caused by CO2 removal from the gasifier (Fig. 14). Moreover, a simultaneous reduction of the tar content from 4–8 g N−1 m−3 to 0.3–0.9 g N−1 m−3 was observed.
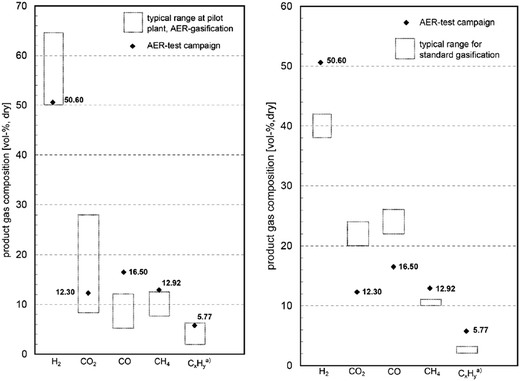 | ||
| Fig. 14 Comparison of the syngas composition in conventional and SER gasification processes and the typical range at the pilot plant (adapted with permission from Koppatz et al.125 Copyright 2015 Elsevier). | ||
A first test campaign using the 8 MWel Guessing CHP operating in SER mode was reported by Koppatz et al.125 A temperature difference was required between the BFB gasifier and the CFB combustors to allow for efficient carbonation–calcination reactions. Therefore, the gasification temperature was reduced from 850–900 °C to 650–750 °C, while the combustion temperature was reduced from 950 °C to 850 °C. This was achieved through low solid looping rates. Moreover, olivine was substituted with limestone as the bed material. The content of H2 and CH4 in the syngas, hence its quality, decreases with increase of the gasification temperature. This could be explained by reduction of the driving force for the carbonation reaction, as the equilibrium partial pressure of CO2 increases with temperature. The quality of the syngas produced in SER operating mode was higher than in the conventional process.
3.10 Summary
In most of the studies, the key parameter describing performance of the CaL process is the CO2 capture level. If a system is operated with appropriate solid inventory and sorbent conversion, the actual CO2 capture level is close to the value determined by chemical equilibrium. This allows validation of the global performance of a model, which could be either equilibrium- or kinetics-based. Furthermore, unconventional configurations developed at ITRI and Ohio State University, which include the RK calciner, would be beneficial for validating a model when the power and cement integration is investigated.The testing campaigns provide valuable insight in understanding process performance under varying operating conditions. Some information on local parameters, such as fluidising air temperature, flue gas composition and flow rate, CO2 concentration in the gases leaving the CaL system, solid inventories or looping rates were disclosed. However, no complete data were available for any of the reviewed experimental campaigns. Further tests and more detailed data are required to allow validation of a model at the local level, and thus increase the quality of its prediction.
4 Models for the calcium looping processes
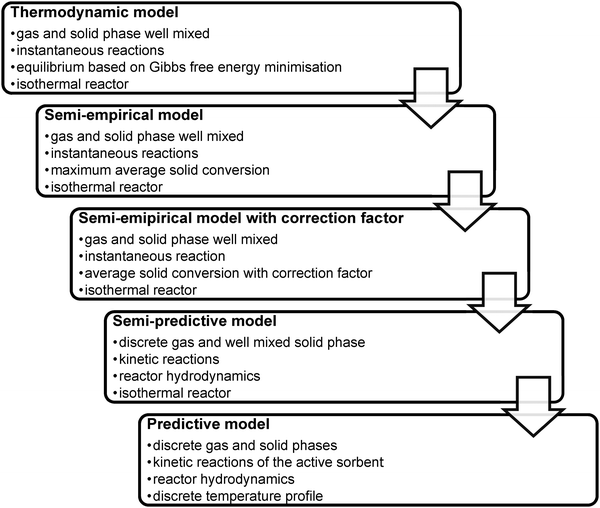
Development of novel power generation technologies needs to employ a range of analysis tools to evaluate various technology aspects. Therefore, experimental trials using bench- and pilot-scale facilities should be supported with analyses utilising mathematical and computational models that can be treated as a complementary source of information on process performance. Moreover, such models allow analysing the process scaling-up, and thus, expected net efficiency penalties, as well as operating and capital costs. Since the models vary in complexity and hence in computational requirements they can be applied at different stages of concept development to optimise the operating parameters of a process, to evaluate its performance under different operating conditions, or even to reliably size the equipment in the most time-efficient manner.The current literature offers a selection of models for the key units, the carbonator and the calciner. They range from models based purely on thermodynamic equilibrium, usually defined by Gibbs' free energy minimisation,26,32,127–131 through models considering sorbent degradation using semi-empirical correlations derived to fit experimental results,11,16,34,39,42,84,86,132–146 to semi-predictive28,30,31,37,93,135,147–149 and predictive models150 that account for FB hydrodynamics and reaction kinetics. As the complexity of the models increases, the accuracy of their predictions increases as well. It needs to be stressed, however, that models of different complexity are suitable at different stages of process development; for example, thermodynamic or semi-empirical models would be more suitable for conceptual design studies, while predictive models would be appropriate at an advanced project stage, such as front-end engineering design. The CaL models available in the literature are reviewed in this section and their limitations are identified.
4.1 Modelling of the sorbent average conversion
The greatest challenge of using solid sorbents to capture CO2 is the loss of their conversion with the number of carbonation–calcination cycles.145 Thus far, the decay in sorbent maximum conversion, which is defined as the ratio of the actual and the theoretical mass of CaO that could have been converted to CaCO3 for fully carbonated sorbent, has been represented using semi-empirical correlations. Since such representation includes fitting parameters, it would predict the activity decay well only for sorbent for which the values of fitting parameters were determined experimentally.Dean et al.14 have noted that the primary cause for sorbent deactivation is sintering of CaO during calcination at temperatures higher than 900 °C,151 and high CO2 and steam partial pressures.43 High affinity of sorbent to SO2 and H2S, which are often present in the flue gas generated in a power plant, especially in units without FGD plants, would further affect the process performance due to increase in the solid looping rate. Although the once-through test performed by Sun et al.152 in presence of SO2 revealed no difference in the CO2 capture in the chemically-controlled region of the carbonation, the calcination rate, and thus the sorbent conversion deteriorated as a result of CaSO4 accumulation. Such observation was also made by Grasa et al.153 The experimental trials showed that due to high Ca:S ratios in the system, the SO2 and H2S capture efficiencies could reach 100%.112 As the regeneration process of sulphated sorbent is possible only at very high temperatures or in reducing conditions,154,155 this would enhance sorbent sintering causing a further reduction in the activity. Moreover, attrition leading to excessive elutriation of sorbent and ash fouling could occur under such conditions.13,14
Sorbent performance is usually represented as a drop in the maximum sorbent particle conversion with the number of carbonation–calcination cycles (N). Since 2002, many semi-empirical correlations were developed to characterise the drop in the sorbent performance, for which the fitting parameters are often determined from the thermogravimetric analysis (TGA).28,156–160 Such correlations were developed for non-pretreated sorbents,42,139–145 and thermally pretreated sorbents34,138 that experience self-reactivation.34,161 Most of the semi-empirical correlations have been reviewed by Dean et al.,14 and only the most important ones, required to understand the more complex models, are presented here.
A first semi-empirical model for the maximum sorbent conversion was developed by Abanades145 based on the assumption that decay in the maximum carbonation conversion in the chemically-controlled stage depends only on the number of calcination–carbonation cycles.
| XN = kN+1 + Xr | (3) |
A study by Grasa and Abanades143 has confirmed that the sorbent conversion decreases asymptotically to residual conversion that amounts to 0.075–0.08 and is constant when the number of calcination–carbonation cycles is higher than 50. Based on the proportionality between conversion and the surface area of highly cycled particles through the product layer thickness (X = S/S0), Grasa and Abanades143 have proposed a semi-empirical correlation for decay of the sorbent maximum conversion which is formulated similarly to typical catalyst deactivation correlations.
 | (4) |
Li and Cai139 have adopted a five-parameter correlation, with a similar structure to the one proposed by Abanades.145
| XN = a1fN+11 + a2fN+12 + Xr | (5) |
 | (6) |
 | (7) |
 | (8) |
 | (9) |
 | (10) |
 | (11) |
 | (12) |
 | (13) |
 | (14) |
 | (15) |
| Xcalc = (1 − fcalc)Xcarb | (16) |
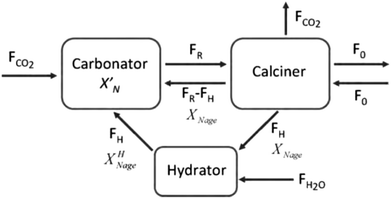 | ||
| Fig. 15 Calcium looping process with sorbent reactivation through hydration (reprinted with permission from Arias et al.137 Copyright 2015 Elsevier). | ||
Arias et al.137 have proposed a conversion model that can be used to predict the performance of a CaL plant with a hydrator operating in a continuous mode. As such a configuration does not produce any change in the number of carbonation–calcination cycles that each particle has undergone, the fraction of particles that has undergone N carbonation–calcination cycles can be still estimated using eqn (7). Moreover, since different fractions of sorbent having different maximum conversions are fed to the carbonator, the maximum conversion for a given calcination–carbonation cycle number N can be represented as:
 | (17) |
 | (18) |
 ) or non-pretreated (XNage) sorbent can then be estimated using eqn (4). The decay constant (kH) and the residual conversion (XHr) for the regenerated sorbent depend on the degree of hydration, and were estimated to be 0.63 and 0.15, respectively for 20% hydration, and 1.39 and 0.36, respectively for 60% hydration based on experimental data from Grasa et al.166 (Fig. 16).
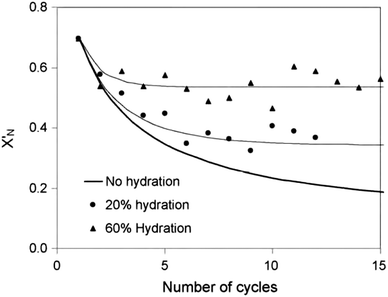 | ||
| Fig. 16 Comparison of the experimental data in Grasa et al.166 and the model prediction with FH/FR = 1 (reprinted with permission from Arias et al.137 Copyright 2015 Elsevier). | ||
Stable maximum conversions were reached for a relatively small number of cycles. This is a result of a balance between the increase in sorbent conversion due to hydration and the loss in each carbonation–calcination cycle due to sintering.137 Finally, the maximum average conversion of the sorbent can be determined as:
 | (19) |
4.2 Modelling of carbonation and calcination kinetic rates
 | (20) |
Eqn (20) was formulated in such a way that it could be used to describe both chemical- and diffusion-controlled regions of the carbonation reaction. Having estimated the values for activation energies and pre-exponential factors using data from both sources, Lee168 identified that the type of limestone does not have a great impact on the chemical-controlled regime parameters, while it does for the diffusion-controlled ones (Table 6). This was explained by the strong impact of the CaO morphology on the reaction rate in the diffusion-controlled region.
 | (21) |
 | (22) |
 | (23) |
 | (24) |
 | (25) |
 | (26) |
 | (27) |
 | (28) |
 | (29) |
 | (30) |
 | (31) |
 | (32) |
 | (33) |
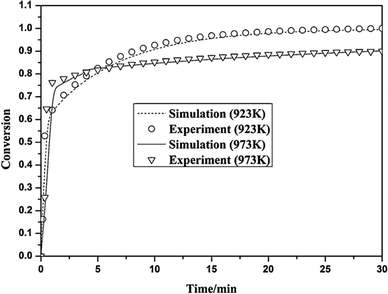 | ||
| Fig. 17 Validation of the Yu et al.172 model with the experimental data (reprinted with permisson from Yu et al.172 Copyright 2015 Elsevier). | ||
García-Labiano et al.176 proposed incorporating the Langmuir–Hinshelwood mechanism into the changing grain size model to describe the calcination process. The model is based on the similar mass balance to the one presented in eqn (24), but with the negative sign for the CO2 source term, and accounts for both the diffusion and the reaction of the gas in a differential volume of the particle.
 | (34) |
 | (35) |
 | (36) |
 | (37) |
 | (38) |
 | (39) |
 | (40) |
 | (41) |
 | (42) |
 | (43) |
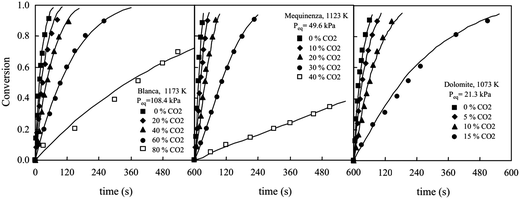
García-Labiano et al.176 have validated the prediction of the model at different CO2 partial and equilibrium pressures using different limestone compositions and found good agreement between the model prediction and the experimental data (Fig. 18). The changing grain size models, which were adapted to the carbonation and calcination processes, were found to closely represent the particle conversion at given temperature. Although these did not account for sorbent sulphation and ash accumulation, such models would provide a valuable tool in calciner modelling, provided they are coupled with reactor hydrodynamics.
4.3 Carbonator reactor modelling
 | (44) |
 | (45) |
 | (46) |
 | (47) |
 | (48) |
The average reaction rate expression shown in eqn (49) proposed by Alonso et al.30 does not consider the characteristic term for the grain models (1 − X)2/3. Although this change makes it slightly different from the expressions proposed by Abanades et al.136 and Grasa et al.,171 the authors claim that this will not have a significant effect on prediction accuracy, as the conversion is low despite the relatively fresh sorbent and thus this term would be close to unity.
 | (49) |
 | (50) |
 | (51) |
 | (52) |
 | (53) |
Finally, using the definition for the active fraction of sorbent (fa) proposed by Alonso et al.,30 an expression for the CO2 capture level, which links the average conversion of sorbent and the residence time distribution in the bed, was proposed.
 | (54) |
 | (55) |
 | (56) |
 | (57) |
 | (58) |
 | (59) |
 | (60) |
 | (61) |
| ub* = ub + 3umf | (62) |
| ub = u0 − umf + 0.711(gdb)0.5 | (63) |
 | (64) |
 | (65) |
 | (66) |
 | (67) |
 | (68) |
 | (69) |
 | (70) |
 | (71) |
 | (72) |
 | (73) |
Using TGA, Li et al.181 have identified that the carbonation rate was independent of temperature between 600 °C and 700 °C. Moreover, the maximum conversion of the sorbent was found to be independent of the CO2 concentration and increased with temperature. Based on these findings, Fang et al.135 proposed the following semi-empirical equation for the carbonation rate. It accounts for the effect of the total pressure on the rate of sorbent carbonation.
 | (74) |
Again, Fang et al.135 proposed using the two-zone K–L model179 to represent carbonator hydrodynamics. The model is similar to the one adapted by Abanades et al.,136 with a minor change to account for the solids present in the bubbles. Assuming the volume fraction of solids dispersed in the bubbles (yb) to be between 10−2 and 10−3, the mass balance for the bubble phase is:
 | (75) |
 | (76) |
| fa = Xmax,N − XN | (77) |
 | (78) |
In the carbonator model, the uniform riser temperature, particle size distribution and superficial velocity were assumed, along with no gas-side mass transfer resistance and perfect solid mixing. The model considered two statistical distributions. The first determines the carbonation–calcination cycle number that a given particle has already experienced using the correlations provided by Abanades145 and Rodríguez et al.11 These, in combination of the maximum sorbent conversion correlation by Grasa and Abanades143 with fitting parameters adjusted to consider sulphation, allow determining the maximum average sorbent conversion. The second characterises the fraction of particles of a given residence time in the carbonator, for which the average residence time is defined as in the model by Alonso et al.30 The active solid inventory is defined in eqn (80) to account for sulphation and ash accumulation effects.
 | (79) |
 | (80) |
 | (81) |
 | (82) |
 | (83) |
 | (84) |
The model developed recently by Romano84 is the most advanced carbonator semi-predictive model available currently as it considers the effect of reactor hydrodynamics on the CO2 capture level, reaction kinetics, the influence of sulphation on sorbent conversion and ash accumulation. Although it does not consider the diffusion region of the carbonation process, this region is usually neglected in industrial applications, to allow for a compact design of the CFB reactor.84,145
4.4 Calciner reactor modelling
| FCO2,calc = NCa·rcalc = (FCa + F0)(Xcarb,ave − Xcalc) | (85) |
 | (86) |
 | (87) |
 | (88) |
 | (89) |
 | (90) |
 | (91) |
 | (92) |
 | (93) |
The calciner semi-predictive model proposed by Martínez et al.,134 has the same level of complexity as the carbonator semi-predictive model by Alonso et al.30 Therefore, these models should be used together to represent CaL performance. The model has the same disadvantages that it does not consider sorbent sulphation and ash accumulation in the system.
 | (94) |
![[thin space (1/6-em)]](https://www.rsc.org/images/entities/char_2009.gif) 797 and the activation energy (Ea) of 150 kJ mol−1.
797 and the activation energy (Ea) of 150 kJ mol−1.
Unlike other calciner models, the model proposed by Fang et al.135 accounted for the reactor hydrodynamics using the same K–L model179 as presented for the carbonator model. In this model, the calcination rate constant and the fraction of CaCO3 that was not regenerated in the calcination stage are represented as:
 | (95) |
| fa = (1 − Xcalc)Xmax | (96) |
 | (97) |
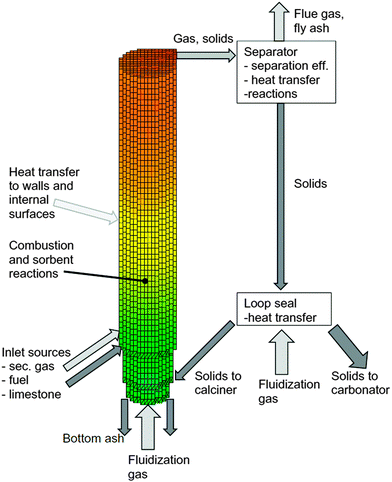 | ||
| Fig. 19 Three-dimensional CFB calciner model frame (reprinted with permission from Ylätalo et al.150 Copyright 2015 Elsevier). | ||
The model included detailed modelling of sulphation in the calciner using the correlations developed by Myöhänen et al.185 that account for the specific reaction surface area (Sm,i) of component i.
 | (98) |
 | (99) |
 | (100) |
4.5 Summary
The review of the carbonator reactor models undertaken in this section revealed that there are several approaches available in the open literature. However, some of the assumptions or formulations behind these models impose important limitations that may affect the accuracy of their predictions.The review findings show that five main complexity levels can be distinguished (Fig. 20). Models in the first level are based on first principles, energy and material conservation laws. At an early stage of concept development, which could include uncertainties related to process operating conditions and/or sorbent properties, thermodynamic models would perform well and could be used to estimate performance limited by equilibrium. The greatest limitation of such models is lack of correlation to the physical size of the reactor and the assumption of instantaneous reactions. Additionally, in most cases the equilibrium composition in the reactor, hence the sorbent conversion, is based on minimisation of Gibbs' free energy at specified operating conditions and does not depend on what happens upstream of the unit.
The last limitation of the thermodynamic models is partially eliminated in the semi-empirical models, which allow determination of the maximum average sorbent conversion depending on the solid looping rate and fresh sorbent make-up rate, as well as carbonator and calciner performance.11,39,139 These models, however, assume that the sorbent achieves its maximum average conversion under certain operating conditions, predicting actual reactor performance close to equilibrium performance. Although the results from experimental trials using the 1.7 MWth pilot plant at INCAR-CSIC showed that this assumption is valid for systems operating with high sorbent conversions, which require high fresh sorbent make-up rates, systems operating with low average conversions achieve around 60–90% of equilibrium performance (Fig. 21).
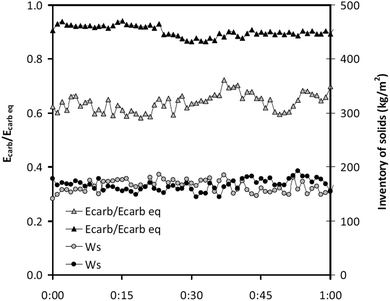 | ||
| Fig. 21 Comparison of the actual and the equilibrium performance of 1.7 MWth pilot plant at INCAR-CSIC operating at carbonator temperature of 660–690 °C with Xave = 0.11 (grey) and Xave = 0.21 (black) (reprinted with permission from Arias et al.96 Copyright 2015 Elsevier). | ||
To improve model accuracy, actual average sorbent conversion is determined by applying a correction factor to the maximum average sorbent conversion in the third level models. This factor can be either assumed,133,146 as presented in Section 5, or calculated based on the actual and average residence times of the sorbent in the reactor.30,134 The latter approach greatly enhances model prediction as the determined correction factor accounts for the solid inventory and the reaction kinetics in the reactor.
The fourth level is achieved through a detailed consideration of reaction kinetics and hydrodynamics in determining the performance of the reactor. Most of the semi-predictive models developed to predict the performance of the calciner135 and the carbonator28,84,135,136 used the hydrodynamic formulations developed by Kunii and Levenspiel,178,179,182,183 which offer an analytical solution. This approach improves the prediction as the gas concentration depends on the operating conditions and location in the reactor, as well as the sorbent properties. A number of parameters in the K–L model need to be specified, but their values have not been substantiated experimentally and could affect the accuracy of the model.
This, and other assumptions such as isothermal operation and well-mixed solid phase, can be eliminated by applying the predictive models that combine industrial CFD codes with experimentally-determined reaction kinetics to evaluate the reactor150,189 or the whole CaL plant188 performance. Such models are the most complex and, therefore, computationally demanding. Although predictive models give the closest representation of the CaL process, they are not applicable at the early stage of concept design because any change in the process design would be followed by a long simulation period required to assess the impact of that change.
In addition to presenting the current approaches for modelling of the CaL processes and identifying their limitations, this review has identified that neither sorbent sulphation nor ash accumulation are widely considered in the models currently developed. The only models accounting for sorbent sulphation were the carbonator model by Romano84 and the calciner model by Ylätalo et al.150 described in Sections 4.3.3 and 4.4.3, respectively. Although it was claimed by Abanades et al.136 that sorbent sulphation will have a minor effect on carbonation, the experimental analysis by Grasa et al.153 suggests that even a change in the sulphation level of 0.5% in each cycle affects the sorbent decay curve (Fig. 22).
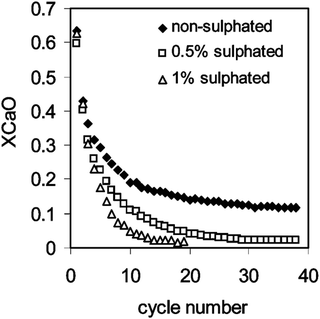 | ||
| Fig. 22 Decay in the carbonation conversion with the number of carbonation–calcination cycles under different sulphation conversions (reprinted with permission from Grasa et al.153 Copyright 2015 American Chemical Society). | ||
Despite the fact that ash presence in the system would increase the inert solid looping rate and the bed inventory required to achieve a given CO2 capture efficiency, the effect of ash accumulation in the system was only included in the model by Romano.84 Moreover, none of the reviewed models account for sorbent attrition and fragmentation, which was identified as another challenge of the CaL process.13 Therefore, in addition to the sulphation effect on sorbent performance and ash accumulation, loss of sorbent due to attrition and fragmentation should also be considered in the future modelling attempts. This can be done, for example, by implementing the semi-empirical model for sorbent attrition developed by Fennell et al.190 or by adapting the semi-detailed model developed for coal fragmentation by Senneca et al.191
5 Integration of calcium looping to power plants
A key reason for development of computational models for CO2 capture processes is the ease with which they can be used to analyse retrofit scenarios of existing power plants, or to develop novel concepts for cleaner power generation systems. Models can be a cost-efficient complement to experimental trials of a particular system design under various operating conditions. The greatest advantage of using computational models is the ease of conducting a process-wide analysis for determining optimal overall process performance by indicating the possible integration points.Since 1999, when the CaL integration was proposed as a viable option for CO2 capture from CFPPs,28 a number of studies have investigated different aspects of process integration aiming at improvement of the overall process performance. These included enhancement of process integration through heat exchange network analyses and reduction of CaL process energy requirements through implementation of alternative configurations. The applicability of the CaL process for CO2 capture from combined cycle power plants was also investigated.
The greatest disadvantage of conventional CO2 capture systems is a relatively high projected efficiency penalty leading to increased fuel consumption and cost. This section reviews process integration and conceptual studies to quantify efficiency penalties in CFPPs and combined cycle power plants. In addition, the modelling approach for both the power cycle and the CaL process are identified and limitations are analysed to provide a guide for further modelling attempts.
5.1 Conventional coal-fired power plants
With a Ca![[thin space (1/6-em)]](https://www.rsc.org/images/entities/char_2009.gif) :
:![[thin space (1/6-em)]](https://www.rsc.org/images/entities/char_2009.gif) C ratio of 8.29, which is slightly smaller than values reported in the pilot-plant tests, and average conversion of 11%, CO2 capture of 83% was reached in the carbonator, leading to an overall CO2 capture level of 90.4%. The waste heat in the CaL plant was recovered to produce superheated and reheated steam at subcritical conditions of 172.25 bar/566 °C and 30.4 bar/538 °C, respectively. The gross thermal efficiency of the secondary steam cycle was assumed to be 42.6%HHV. With the gross and net power outputs of the integrated system of 1000 MWel and 817 MWel, respectively, the net efficiency was estimated to be 33.4%HHV. This was 1.4% points higher than for an oxy-fired combustor with a primary steam cycle of the same gross power output and thus indicated feasibility of the CaL process for reducing CO2 emissions from the CFPPs.
C ratio of 8.29, which is slightly smaller than values reported in the pilot-plant tests, and average conversion of 11%, CO2 capture of 83% was reached in the carbonator, leading to an overall CO2 capture level of 90.4%. The waste heat in the CaL plant was recovered to produce superheated and reheated steam at subcritical conditions of 172.25 bar/566 °C and 30.4 bar/538 °C, respectively. The gross thermal efficiency of the secondary steam cycle was assumed to be 42.6%HHV. With the gross and net power outputs of the integrated system of 1000 MWel and 817 MWel, respectively, the net efficiency was estimated to be 33.4%HHV. This was 1.4% points higher than for an oxy-fired combustor with a primary steam cycle of the same gross power output and thus indicated feasibility of the CaL process for reducing CO2 emissions from the CFPPs.
Unfortunately, Shimizu et al.28 provided no benchmark to the reference CFPP without CO2 capture plant, which would provide insight into how the retrofit affected the overall performance of the system. Also, sorbent decay was ignored as only four carbonation–calcination cycles were considered in determining sorbent conversion. Furthermore, the performance of both steam cycles was assumed rather than estimated using thermodynamic calculation or process simulation. Although this assumption could be valid for a CFPP operating at a fixed load, it does not allow prediction of part-load operation without knowledge of the gross efficiency correlation. Additionally, by assuming the gross thermal efficiency, the analysis did not account for the power consumption of the CFPP auxiliary equipment, with only ASU and CO2 compression unit (CCU) considered in estimation of the net thermal efficiency. The power requirements for the CFPP and the CaL plant auxiliary equipment need to be considered to improve the prediction reliability and avoid over-estimating the net thermal efficiency of the integrated system.
![[thin space (1/6-em)]](https://www.rsc.org/images/entities/char_2009.gif) :
:![[thin space (1/6-em)]](https://www.rsc.org/images/entities/char_2009.gif) C ratio of 5. It needs to be highlighted that compared to the Ca
C ratio of 5. It needs to be highlighted that compared to the Ca![[thin space (1/6-em)]](https://www.rsc.org/images/entities/char_2009.gif) :
:![[thin space (1/6-em)]](https://www.rsc.org/images/entities/char_2009.gif) C values reported in the pilot-plant tests reviewed in Section 3, the assumed Ca
C values reported in the pilot-plant tests reviewed in Section 3, the assumed Ca![[thin space (1/6-em)]](https://www.rsc.org/images/entities/char_2009.gif) :
:![[thin space (1/6-em)]](https://www.rsc.org/images/entities/char_2009.gif) C ratio is 1.5–3 times lower. This would cause underestimation of the solid looping rate and thus, heat requirement in the calciner. In this study, the calciner was operated at 900 °C and heat for sorbent regeneration was provided through oxy-combustion of coal. The parasitic load stemmed only from the ASU power requirement as no CCU was considered.
C ratio is 1.5–3 times lower. This would cause underestimation of the solid looping rate and thus, heat requirement in the calciner. In this study, the calciner was operated at 900 °C and heat for sorbent regeneration was provided through oxy-combustion of coal. The parasitic load stemmed only from the ASU power requirement as no CCU was considered.
Yang et al.16 first proposed using heat in the CaL system to substitute the feedwater heating train in the primary steam cycle. Although this is a valid approach for integrated systems, which has been often proposed for integration of amine-based CO2 capture plants,60,73,192–194 its applicability to existing CFPPs could be limited by the swallowing capacity of the steam turbines and/or the electric generator. Moreover, the suggestion by Yang et al.16 that these extractions reduce the thermal efficiency of CFPPs is invalid from the thermodynamic point of view, as they increase the average temperature of heat addition in the boiler leading to an increase in thermal efficiency.195 Yet, the indicated power output increase of 148.8 MWel and increase in the net thermal efficiency from 19.4%LHV to 25.3%LHV, which stems from a higher degree of waste heat utilisation in the integrated system leading to minimisation of steam extractions, could not be achievable in reality due to operational limitations of the existing system. In another integration option, part of the boiler heat load was replaced by heat load from the CaL plant. The boiler in the CaL plant can provide 43.1% of the heat required by the system to operate with gross power output of 600 MWel and net thermal efficiency of 34.1%LHV. However, a further study on how such off-design operation conditions would affect the boiler performance needs to be conducted. Furthermore, in evaluating other integration options, the highest net thermal efficiency of 36.8%LHV and gross power output of 1000 MWel were reached when the waste heat from the CaL plant was utilised to generate high-pressure steam to drive the secondary steam cycle. This result revealed that implementation of a secondary steam cycle and its integration with the CaL plant provides superior performance compared to the other CFPP integration options. This is also beneficial in terms of long-term revenue and meeting market demand. However, the estimated minimum net efficiency penalty of 3.8% points (excluding power requirement for CO2 compression) may not be a representative result, due to low Ca![[thin space (1/6-em)]](https://www.rsc.org/images/entities/char_2009.gif) :
:![[thin space (1/6-em)]](https://www.rsc.org/images/entities/char_2009.gif) C ratio assumed in the carbonator.
C ratio assumed in the carbonator.
In addition to evaluating different integration options, the effect of CaL integration to CFPPs operating with different steam conditions was investigated. Martínez et al.83 analysed integration of a CaL plant to an existing 350 MWel subcritical CFPP with net efficiency of 36%LHV. The flue gas leaving the boiler, which contained 14.5%vol CO2, was desulphurised and then entered the CaL plant at typical stack conditions (1.16 bar/180 °C). Performance of the carbonator, which was operated at 650 °C, was represented using the model proposed by Alonso et al.30 described in Section 4.3.1 with the kinetic expression proposed by Grasa et al.196 The sorbent was regenerated in the calciner operating at 950 °C and complete calcination was assumed. The temperature in the calciner was maintained through oxy-combustion of South African coal. Even though this coal contains a relatively small amount of sulphur and the flue gas was desulphurised, an additional amount of CaCO3 (FCa/FS = 3) was provided with the make-up stream to account for sorbent sulphation losses. Moreover, part of the captured CO2 was recycled to maintain the O2 concentration in the oxidizing gas at 25%mol.
Heat in the carbonator, the clean gas stream and the CO2 stream was used to generate steam to run the secondary steam cycle (Fig. 23), the gross thermal efficiency of which was assumed to be 45%LHV. After deducting the auxiliary power consumption of the plant, the net thermal efficiency was 36%LHV. By adjusting the solid circulation rate, the CO2 capture level in the carbonator was maintained at 70–90%, leading to maximum net thermal efficiency of 33.1%LHV–33.4%LHV. Although an increase in the CO2 capture level required higher solid circulation rates, the increase in steam generation exceeded the increased heat requirement in the calciner leading to a rise in net thermal efficiency. The make-up rate was found to be a critical parameter as its increase led to reduction in net thermal efficiency, since more heat was required for fresh sorbent preheating. However, operation at low make-up rates would result in low conversion of the sorbent and thus high circulation rates requiring a larger reactor. Nevertheless, the viability of a CaL plant for subcritical CFPPs, for which the projected efficiency penalties ranged between 8.3% and 10.3% points, has been confirmed. Interestingly, if part of the spent sorbent was utilised in the cement plant as raw material, the amount of energy required for sorbent calcination was not accounted for in the net thermal efficiency calculation, leading to efficiency penalties between 7.5% and 9% points. The study clearly showed that this retrofit would be beneficial for the existing fleet of subcritical power plants, increasing their life span and environmental performance without a drastic net thermal efficiency drop, as is the case for conventional CO2 capture plants. Nevertheless, performance of the steam cycle, ASU and CCU is determined based on assumed performance indicators that may not be valid for part-load operation. Also, Martínez et al.37 benchmarked the performance of the integrated system against a hypothetical system rather than an existing power plant, which results in misleading conclusions regarding the projected efficiency penalty imposed on the retrofitted system. The performance of an integrated system should be benchmarked against the performance of an existing system to identify the net effect of the CaL plant integration.
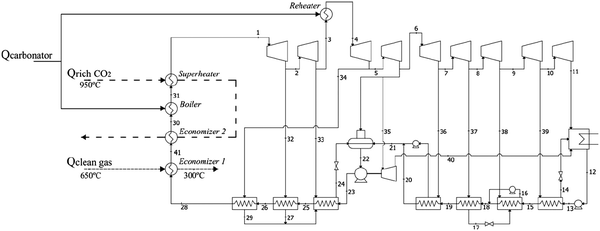 | ||
| Fig. 23 Reference integration configuration for the CaL plant and supercritical steam cycle (reprinted with permission from Martínez et al.83 Copyright 2015 John Wiley and Sons). | ||
Romeo et al.86 have investigated the integration of a secondary supercritical steam cycle (280 bar/600 °C/600 °C) with a CaL plant retrofitted to an existing 450 MWel supercritical CFPP. In the CaL plant design, the temperatures in the carbonator and the calciner were kept at 650 °C and 875 °C, respectively. The performance of the system was represented by assuming 5% purge leading to average sorbent conversion of about 20%. Heat for sorbent recovery was added through combustion of low-sulphur high-rank coal in pure O2-stream produced in the ASU with specific power of 220 kW h per t-O2. Romeo et al.86 claimed that no CO2 recirculation was needed to control the temperature in the calciner because of the large solid inflow at 650 °C and the endothermic character of the calcination reaction. Despite the fact that the pure O2 stream will be diluted by CO2 liberated in the calcination reaction, the local temperature of coal particles can be higher than the average bed temperature due to their combustion in a high-O2-concentration environment.197,198 Such high temperatures can lead to local hot spots in the calciner on contact of the coal and sorbent particles and cause enhanced sintering and, thus deactivation of the sorbent.199
Analysing the CaL process, Romeo et al.86 have proposed an integration configuration comprising five heat integration zones, in which waste heat from the carbonator, CO2 stream, clean gas stream and purge stream were utilised to generate live and reheated steam, as well as to preheat the feedwater. The secondary supercritical steam cycle driven by heat recovered in the CaL plant generated an additional 193.6 MWel of net power output with net efficiency of 26.7%LHV. Although this increased the net power output of the integrated system by 45.3%, the net thermal efficiency dropped by 7.9% points, from 44.9%LHV for the reference CFPP to 37.0%LHV for the integrated system.
Further improvement of the integrated system efficiency can be reached through development of integration schemes characterised with higher heat utilisation levels using a systematic HEN analysis, which is commonly applied in different industries. Such analysis has been used by Lara et al.200,201 to design the heat recovery system for waste heat recovery from the CaL plant, which captures CO2 from a 500 MWel CFPP with net thermal efficiency of 38.2%LHV, to generate steam to drive the secondary steam cycle (290 bar/600 °C/620 °C). Unfortunately, no information was provided on the assumptions made to assess the performance of the carbonator and the calciner. Among different HEN configurations proposed, the economically favoured configuration was reached when the streams were matched in such a way that they were exhausted in a single heat exchanger (Fig. 24). This configuration resulted in a net thermal efficiency increase of 0.2% points201 and 1.2% points.200
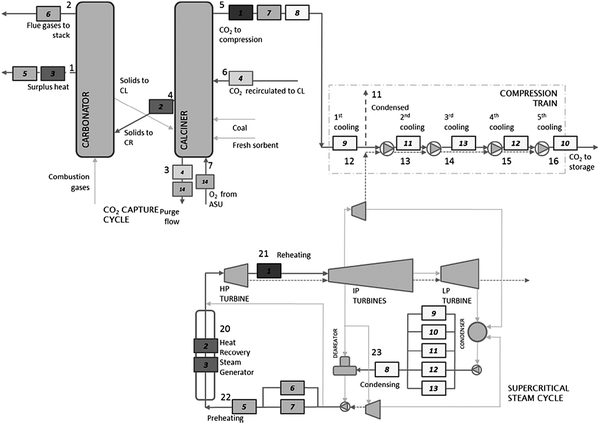 | ||
| Fig. 24 Economically favourable heat exchanger network design for CaL integration (reprinted with permission from Lara et al.200 Copyright 2015 Elsevier). | ||
In contrast to most previous studies, Vorrias et al.132 have investigated integration of a CaL plant to a lignite-fired power plant (235.4 bar/540 °C/540 °C) that delivers 330 MWel of gross power output with net thermal efficiency of 39.1%LHV. In this study the conventional CaL plant configuration, which comprises the carbonator and the calciner reactors interconnected with solid lines and operating at 650 °C and 900 °C, respectively, was used. Having assumed that the carbonation reaction reached chemical equilibrium, sorbent conversion in the carbonator was represented using the maximum average conversion model by Abanades et al.39 without the correction factor. The performance of the calciner was represented using the chemical and phase equilibrium through the Gibbs' free energy minimization at a given temperature. Also, the heat for sorbent regeneration is provided through oxy-combustion of lignite in an oxidizing medium containing 80%vol O2. Although Vorrias et al.132 claimed that this concentration was sufficient to avoid hot spots in the calciner that would increase the sorbent sintering rate, experimental and other modelling trials33,98,100,104,133 suggested that the O2 concentration should be below 50%vol to avoid hot-spots in the reactor and thus excessive degradation of the sorbent performance.
Further, to utilise high-grade heat to generate additional steam to run the secondary supercritical steam cycle (235.4 bar/540 °C/540 °C), Vorrias et al.132 proposed to integrate two systems for increased heat utilisation in the CaL plant. The first is a solid recirculation heat exchanger which is proposed to be a set of concentric L-valves as illustrated in Fig. 25a. It is assumed that the system performs as a co-current heat exchanger with a temperature approach of 10 °C. However, the performance of such a system at a large scale has not yet been demonstrated. Moreover, as lignite consists of a considerable amount of moisture (36.8%wt), oxy-combustion performance would be affected. Therefore, the second system, a BFB lignite dryer (Fig. 25b) which uses recompressed water vapour as a fluidising medium, was proposed to reduce the moisture content in lignite to 12%wt, comparable to the average moisture content of hard coal.202
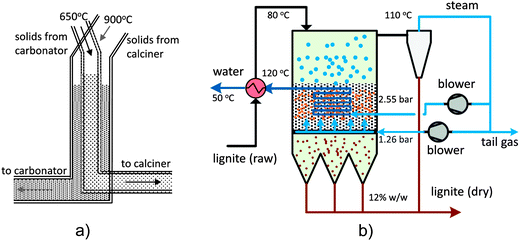 | ||
| Fig. 25 Design of (a) solid–solid heat exchanger and (b) lignite bubbling fluidised bed dryer (reprinted with permission from Vorrias et al.132 Copyright 2015 Elsevier). | ||
Analysis of the overall process performance revealed that the net thermal efficiency of the integrated system reached 34.1%LHV if both the solid–solid heat exchanger and the BFB lignite dryer were implemented. This falls to 34.0%LHV and 32.5%LHV, respectively, if only the first or second system is implemented. Nevertheless, the net projected efficiency penalty imposed on integration of the CaL plant reached the lowest value of 5.0% points, which is considerably lower than in previous studies. It is not known if such improvement results from implementing the proposed systems or using no correction factor to determine the actual average sorbent conversion and high O2 concentration in the oxidising medium. The net projected efficiency penalty due to CaL plant integration was found to be 2.9% points lower than for a corresponding MEA plant, but only 0.9% points lower for an oxy-fuel lignite-fired power plant.
In the first study proposing alternative configurations for efficiency improvement, Abanades et al.39 investigated integration of a 100 MWel supercritical CFPP with an assumed net thermal efficiency of 46%LHV. In the basic configuration, the flue gas was treated in the carbonator operated at 650 °C, the performance of which is modelled using eqn (8) and (9). A complete sorbent regeneration was conducted at 950 °C using oxy-combustion of coal. In addition, the overall CO2 capture level was assumed to be 90% and the captured CO2 was compressed to 100 bar prior to being transported. Considering the power requirement to run the CCU and the ASU, the efficiency of the integrated system dropped by 7.2% points, to 38.8%.
As the efficiency penalty in the CaL process stems mainly from the O2 production for oxy-fuel combustion in the calciner, Abanades et al.39 have proposed an alternative calciner design in which the heat for the sorbent regeneration is supplied through the metallic walls from an external source (Fig. 26). Their study assumed that the heat source is a fluidised bed combustor fuelled with an air and fuel mixture that operates at 1050 °C. Steam is used as a fluidising medium in the calciner operated at 850 °C, leading to a CO2 partial pressure of 0.4 bar. Although this configuration would be characterised by higher thermal efficiency and no requirement for O2 production, it would require materials that have not yet been tested in practice. Also, a close integration of the combustor and the calciner is required, as a considerable heat transfer area of 800 m2 is required. Despite the engineering challenges, this configuration was reported to have a net thermal efficiency of 39.4%, resulting in a projected efficiency penalty of 6.6% points. This is 1.6% points less than for the basic configuration.
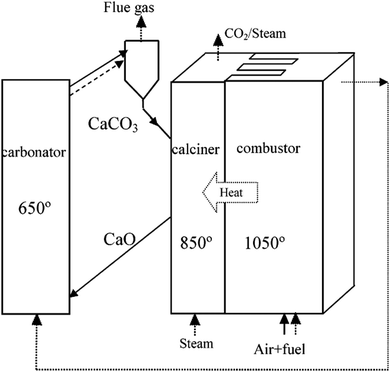 | ||
| Fig. 26 Heat transfer-integrated calciner and combustor (reprinted with permission from Abanades et al.39 Copyright 2015 American Chemical Society). | ||
To avoid application of untested materials, Abanades et al.39 proposed that the heat requirement of the calcination reaction could be satisfied using a solid heat carrier (Fig. 27). In this configuration, CO2 partial pressure of 0.4 bar, which is required to lower the calcination temperature to 850 °C, is achieved through utilisation of a vacuum. The process involves a common CFB combustor that is fired with an air and fuel mixture. The solid bed material, which is a dense material, such as Al2O3 or deteriorated CaO, is heated in the combustor, separated from the combustion gas stream and finally fed to the calciner. However, as this configuration assumes that the heat carrier particles would be mixed with the CO2 sorbent in the calciner, it is still not clear whether a continuous separation of these particles based on differences in their densities would be possible at the required scale. Nevertheless, this configuration offers net thermal efficiency of 40.0%LHV, which is 2.2% points over the basic CaL configuration.
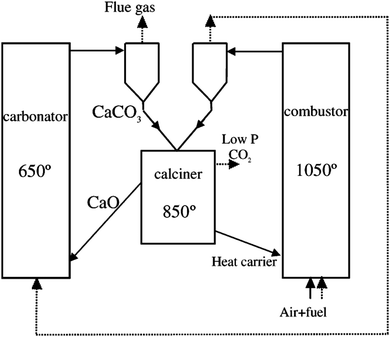 | ||
| Fig. 27 Indirect heat transfer from combustor to the calciner (reprinted with permission from Abanades et al.39 Copyright 2015 American Chemical Society). | ||
This configuration was also investigated by Martínez et al.148 who studied its integration with the supercritical steam cycle (600 °C/280 bar). The coal combustion took place at 1030 °C, with 15%vol of excess air that entered the combustor at 400 °C. The energy input to the system through the coal combustion was assumed to be 1 GWth. The flue gas, which contained 15.7%vol CO2, was used to reheat the steam in the steam cycle and to preheat the combustion air, and eventually entered the carbonator at 380 °C. The carbonator, which operated at 650 °C, was modelled using the carbonator model developed by Alonso et al.30 with the kinetic model for the multiple reaction cycles by Grasa et al.196 Under given operating conditions, the CO2 capture efficiency in the carbonator was estimated to be 89%. Again, a complete calcination process took place in the calciner operated at 950 °C, which corresponds to partial pressure of 1.93 bar. Heat for the sorbent regeneration came from the solid stream heated in the combustor. The pressure of the separated CO2 was increased to 150 bar in the CCU comprising the five-stage compressor and the pump, and then it was cooled to 40 °C.
Martínez et al.148 have identified five possible heat sources in the analysed CaL plant, which were heat released in the carbonator and heat carried with the clean gas, purge, flue gas and CO2 process streams. Having integrated these sources as illustrated in Fig. 28 and considering the power requirement for CO2 compression, the net power output of 378 MWel, corresponding to net thermal efficiency of 37.8%, was obtained. This was 4.3% points higher than a comparable oxy-fired CFPP.
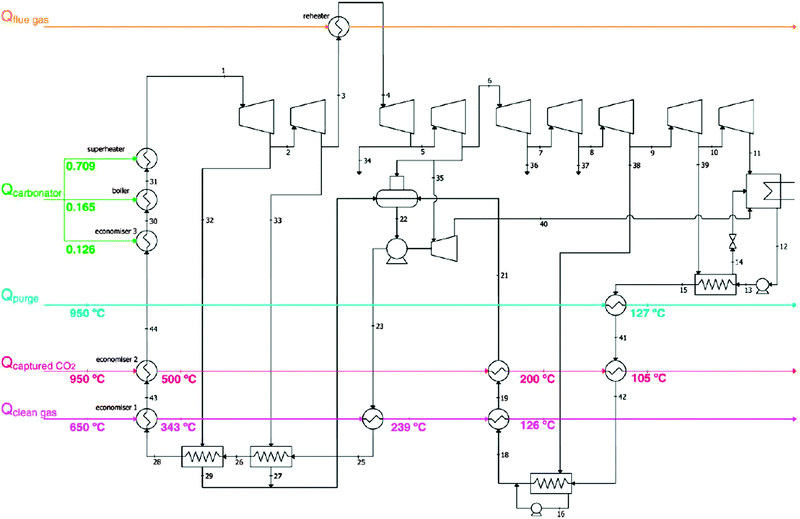 | ||
| Fig. 28 Heat integration of the three-fluidised-bed combustion system with CaL CO2 capture with the supercritical steam cycle (reprinted with permission from Martínez et al.148 Copyright 2015 Elsevier). | ||
More recently, Martínez et al.133 have proposed several process configurations that aim to reduce the efficiency penalty in a CaL plant integrated to a 500 MWel CFPP of gross thermal efficiency of 44.4%LHV. The temperature in the carbonator and calciner were set at 650 °C and 930 °C. The performance of the carbonator was represented by the maximum average conversion of the sorbent determined using the expression proposed by Abanades145 and Grasa et al.,171 and a correction factor of 0.8 to estimate the actual average conversion. Complete calcination was assumed in the calciner. As heat for sorbent regeneration was provided through oxy-combustion of coal, O2 was produced in the ASU, which was characterised with specific power consumption of 220 kW h per t-O2. Recirculated CO2 amounted to 40% of the inlet gas to control the temperature in the calciner.
The first configuration (Fig. 29a) assumes that heat is transferred from the solids leaving the calciner to the solids leaving the carbonator by means of an indirect heat exchanger integrated with the seal valves of the reactors. It is assumed that the solids leave both seal valves at the same temperature. However, this is not achievable in practice as there is no developed technology to carry out this process. To overcome this engineering challenge, Martínez et al.133 proposed using a single mixing seal valve for both reactors (Fig. 29b). Although in this configuration solids can directly exchange heat, the fraction of the active CaO entering the carbonator is reduced due to solid mixing. In the last configuration, the sensible heat of the CO2 stream leaving the calciner is recovered to preheat the solid particles from the carbonator in an additional heat recovery fluidised bed (Fig. 29c). Although the flue gas acts as a fluidising medium and mixes with the partially carbonated sorbent particles, no carbonation reaction could occur in the heat recovery bed. This is because the fast carbonation reaction cannot proceed, as the active CaO was trapped in the core of each solid particle, the surface of which has been covered with the CaCO3 layer formed in the carbonator.203 Although in this configuration the heat required by the calcination process is satisfied through oxy-fuel combustion, it is expected to increase the thermal efficiency of the CaL process by 1.4% points with a subsequent reduction in fuel consumption of 9%.
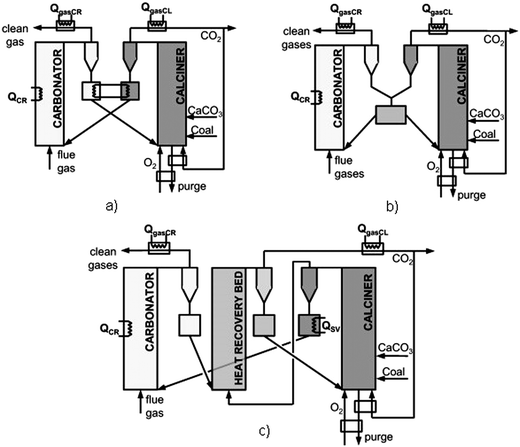 | ||
| Fig. 29 Alternative calcium looping process configurations including: (a) seal valve indirect heat exchanger, (b) mixing seal valve and (c) heat recovery fluidised bed (adapted with permission from Martínez et al.133 Copyright 2015 Elsevier). | ||
Another configuration proposed by Martínez et al.204 utilises a multi-step cyclonic preheater, which is similar to the ones used in the cement industry (Fig. 30). In this additional piece of equipment heat available in the CO2 stream leaving the calciner is utilised to preheat solids leaving the carbonator to around 725 °C prior to entering the calciner. The temperature in the carbonator and calciner were set at 650 °C and 950 °C. The performance of the carbonator and the calciner were represented by the Charitos et al.149 (Section 4.3.1) and Martínez et al.134 (Section 4.4.1) models, respectively. Although implementation of the cyclonic preheater has not changed the energetic efficiency of the integrated system, it reduced the energy requirement of the calciner. This was shown in reduction of the coal consumption by up to 13.3% and the oxygen consumption by 13.6%.
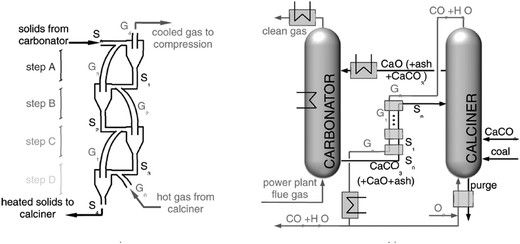 | ||
| Fig. 30 Improvement of the calcium looping process performance through implementation of the cyclonic preheater (reprinted with permission from Martínez et al.204 Copyright 2015 American Chemical Society). | ||
Finally, following the successful demonstration of the sub-pilot facility described in Section 3.5, Wang et al.26,32 have investigated a CFPP retrofit with the CaL plant involving a sorbent regeneration stage through hydration (Fig. 31). Compared to the conventional CaL process, the proposed CCR process comprises an additional reactor which aims to improve conversion of the sorbent.
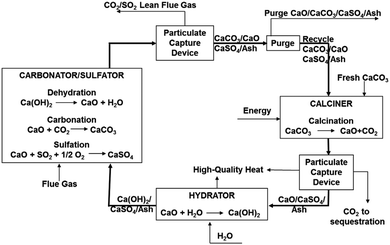 | ||
| Fig. 31 Conceptual design of hydrated calcium looping process (reprinted with permission from Wang et al.32 Copyright 2015 Elsevier). | ||
The performance of the calciner and hydrator reactors was computed based on the assumption that the systems reach equilibrium state at 1000 °C and 500 °C, respectively. In the conventional CaL process, a high calcination temperature would cause an excessive sintering of the sorbent leading to a reduction in the sorbent carrying capacity.13 This is not the case in the CCR process as the sorbent is reactivated on contact with steam in the hydrator. Probably the lack of CO2 recirculation to control the O2 concentration in the calciner was also due to the sorbent regeneration potential of the CCR process. Furthermore, in the experimental campaign using the sub-pilot CCR plant the CO2 capture level of 90% in the carbonator was achieved at a Ca![[thin space (1/6-em)]](https://www.rsc.org/images/entities/char_2009.gif) :
:![[thin space (1/6-em)]](https://www.rsc.org/images/entities/char_2009.gif) C of 1.3. In the carbonator model used by Wang et al.,26,32 a Ca
C of 1.3. In the carbonator model used by Wang et al.,26,32 a Ca![[thin space (1/6-em)]](https://www.rsc.org/images/entities/char_2009.gif) :
:![[thin space (1/6-em)]](https://www.rsc.org/images/entities/char_2009.gif) C ratio of 1.4 was used to determine the solid looping rate required to capture 90% of CO2 and 100% of SO2 at 625 °C.
C ratio of 1.4 was used to determine the solid looping rate required to capture 90% of CO2 and 100% of SO2 at 625 °C.
Wang et al.32 have analysed integration of the CCR process into the 561 MWel subcritical CFPP operating with an assumed net thermal efficiency of 33.5%HHV. As mentioned above, although this approach works relatively well at full-load operation, any deviation from this point would reduce the prediction accuracy. Waste heat from the CCR process was used to generate high-quality steam that is sent to the primary cycles and replaced part of the steam generated in the power boiler. This means that the existing boiler would need to operate in part-load mode. Analysing the integration impact on the overall process efficiency, they have found that a maximum net efficiency of 26.9%HHV was reached if the calciner was indirectly heated using the flue gas from the combustion process. On the other hand, when the calciner was directly heated through oxy-combustion of coal or natural gas, the net efficiency decreased to 26.5%HHV and 26.1%HHV, respectively. Such values for net thermal efficiency are considerably lower than in previous integration analyses reviewed. The main reason behind this is low net thermal efficiency of the reference power plant. The maximum projected efficiency penalty was estimated to be 7.4% points, which is considerably less than the 9–12% points estimated for amine-based or oxy-combustion systems. Furthermore, Wang et al.26 have shown that the projected efficiency penalty for the CCR process is 22.2% lower than for a traditional CaL process. As the latter process operates on higher average conversions, this reduction can be associated with reduction of the solid looping rates between the reactors, which leads to a decrease in the heat requirement in the calciner.
Ströhle et al.147 and Lasheras et al.31 have analysed integration of a CaL plant to a 1000 MWel ultra-supercritical CFPP (285 bar/600 °C/620 °C), which had a net thermal efficiency of 45.6%, with the aim of optimising overall process performance They assumed that a conventional CaL plant configuration was retrofitted to the existing FGD plant, thus the sulphation effect was kept to a minimum. Waste heat from the CaL plant was used to generate additional steam for the secondary steam cycle with an assumed net thermal efficiency of 49.98%. The performance of the calciner, operated at 900 °C, was determined using a Gibbs reactor and the heat for sorbent regeneration was provided through oxy-combustion of coal (wASU = 184 kW h per t-O2). The carbonator was operated at 650 °C with an assumed pressure drop of 100–200 mbar and SO2 conversion of 99% due to the large Ca/S ratio.
Ströhle et al.147 have compared two commonly applied approaches for carbonator modelling, the maximum average conversion of sorbent model by Abanades et al.39 and the 1D carbonator model by Abanades et al.136 and evaluated the differences between these approaches in terms of overall process performance. Assuming a CO2 capture level in the carbonator of 80%, application of the maximum average conversion model led to underestimation of the O2 input to the calciner, solid looping rates and heat available for steam generation. However, in contrast to studies by Martínez et al.133 and Berstad et al.,146 no correction was made to the maximum average conversion to determine the actual average conversion of the sorbent. Nevertheless, net thermal efficiencies were estimated to be 42.9% and 42.4% for the maximum average conversion and the predictive 1D carbonator model, respectively. It can be concluded, therefore, that application of the maximum average conversion model with a reasonable correction factor would give a reasonable prediction of the overall process performance.
In a study by Lasheras et al.,31 the effect of the uncertainty in the K–L CFB model, which requires specification of the decay constant (a) and the solid fraction in the dense region (εd), on the overall process performance was assessed. The analysis revealed that variation in the key input parameters led to 10% variation of the CO2 capture level in the carbonator (Fig. 32). This indicates that further experimental studies are required to identify the K–L model parameters.
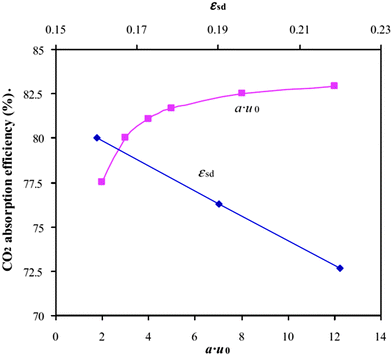 | ||
| Fig. 32 Effect of KL CFB model uncertainty on the CO2 capture level in the carbonator (reprinted with permission from Lasheras et al.31 Copyright 2015 Elsevier). | ||
5.2 Combined cycle power plants
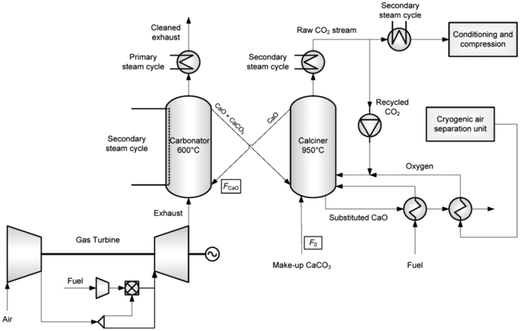 | ||
| Fig. 33 Conceptual design of integration of calcium looping plant to natural gas combined cycle power plant (reprinted with permission from Berstad et al.146 Copyright 2015 Elsevier). | ||
CO2 capture from NGCCs is more difficult than from CFPPs, as the CO2 concentration in the flue gas is approximately 4%vol. Therefore, to achieve a CO2 capture level between 85% and 86% in the carbonator, its operating temperature needs to be 600 °C. To represent the performance of the carbonator, the maximum average conversion model proposed by Rodríguez et al.11,40 was used. As the actual carbonation conversion (Xcarb) is usually lower than the maximum value, a correction factor of 0.75, expressed as the Xcarb/Xave ratio, was adapted to enhance the accuracy of the model prediction. Such a conservative assumption is in agreement with the experimental results as presented in Section 3. To reach the actual carbonation conversion of 0.2, a F0/FCaO ratio of 0.06 was used. The sorbent is regenerated in the calciner, which is modelled as an equilibrium reactor with a calcination efficiency of 100%. A temperature of 950 °C is maintained in the calciner by means of oxy-combustion of natural gas. The 95%mol-purity O2 stream is produced in the cryogenic ASU and mixed with the recycled CO2 to maintain 25%mol O2 concentration in the oxidising gas. The pressure drop in the calciner is accounted for through an increase of the recycled CO2 pressure of 0.03 bar. The remaining CO2 is directed to the CCU, which is modelled as four compression stages and one pumping stage with intercooling to 28 °C, where it is compressed to 150 bar before being transported.
The waste heat from the CaL plant was utilised to generate an additional amount of steam that was then used to drive the secondary steam cycle. As the solids transported from the calciner to the carbonator carry a considerable amount of energy, the effect of the heat recuperation between the solid streams on the energy requirement in the calciner was investigated. Overall, three options for steam conditions (120 bar/560 °C/560 °C, 120 bar/610 °C/610 °C and 202 bar/610 °C/610 °C) were analysed for two CaL process configurations (with and without solid–solid heat recuperation). The study revealed that in the best case scenario, where solid–solid heat recuperation was implemented and the HP steam was generated at 610 °C and 202 bar, the projected efficiency penalty amounted to 9.1% points. This was found to be 1.3% points higher than for the reference NGCC with a conventional MEA CO2 capture plant. Therefore, a CaL plant may not be a preferable option for NGCCs, which can be attributed to low CO2 concentration in flue gas that results in lower driving force for the carbonation reaction. In turn, to reach the desired CO2 capture level, the carbonator operating temperature needed to be lowered to 600 °C. The primary steam cycle location upstream of the CaL plant contributed to the efficiency penalty as less flue gas was fed to the primary waste heat steam generator. A possible solution for both issues was presented by Biliyok and Yeung205 who showed that exhaust gas recirculation and/or supplementary firing could increase the flue gas temperature, flow rate and CO2 concentration. However, feasibility of this solution is doubtful as it would further increase the capital cost by 20%, while reducing the levelised cost of electricity by only 6%.
Kunze et al.131 have proposed substituting a pre-combustion AGR system with a post-combustion CaL plant (Fig. 34). The carbonator was modelled as a stoichiometric reactor with conversion of 20% and operating temperature of 650 °C. The desired CO2 capture level in the carbonator of 90% was assured through adjusting the solids looping rate in the system. In contrast to the other studies, the calciner, which operated at 950 °C, was modelled as a stoichiometric reactor with conversion of 95% to account for sorbent sintering. The heat requirement for sorbent regeneration was met through direct oxy-combustion of syngas in the calciner. It was proposed that O2 was produced using the oxygen transfer membrane, which separates O2 from the high-pressure air diverted from the gas turbine compressor at temperatures of 850–900 °C, and then mixed with recycled CO2 to control the calcination temperature. The remaining CO2 was sent to purification and compression to 110 bar.
 | ||
| Fig. 34 Conceptual design of integration of calcium looping plant to IGCC (reprinted with permission from Kunze et al.131 Copyright 2015 Elsevier). | ||
The waste heat available in the CaL plant was utilised to generate high-pressure steam (250 bar/630 °C/650 °C) that was fed to a bottoming dual-pressure supercritical steam cycle. This substitution of a subcritical bottoming steam cycle in the conventional IGCC plant led to improvement in net thermal efficiency of 3.8% points, to 43.2%LHV and a 9.5% increase in the net thermal power, to 462 MWel. Such performance is in the range for the supercritical CFPPs without a CO2 capture plant.206,207 For this reason, the IGCC plants with CaL could be a feasible option for production of clean power from coal, with an increased reliability due to the lack of complicated chemical plant as in the conventional systems.
Alternative process configuration for a H2-fuelled IGCC power plant that comprises a DFB system has been proposed by Wang et al.130 (Fig. 35). The performance of each reactor in the system was based on the assumption that chemical and phase equilibrium is reached. The gasifier reactor is composed of the BFB gasifier, in which allothermal steam gasification of coal takes place at 700 °C, integrated with a carbonator riser operated at 600 °C. As the gasifier is assumed to operate with 50% conversion of coal, the unreacted char and sorbent are fed to the calciner, which operates at 900 °C. The heat required to sustain the calcination reaction stems from the oxy-combustion of char. The H2-rich gas is used to fuel an F-class gas turbine, in which the compressor operates at a pressure ratio of 17 and expander temperature of 1350 °C.
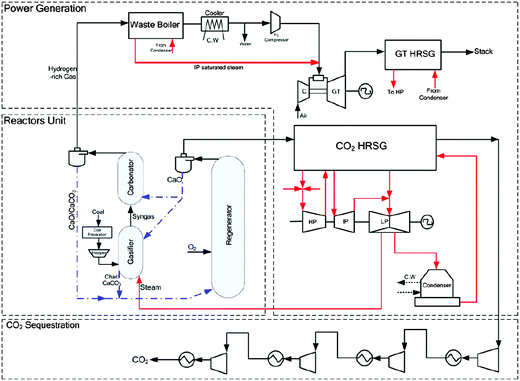 | ||
| Fig. 35 Conceptual design of integration of calcium looping plant to IGCC (reprinted with permission from Wang et al.130 Copyright 2015 Elsevier). | ||
The waste heat available in the integrated system is utilised to sustain the gasification reaction by diverting part of the regenerated sorbent to the gasifier and to generate the steam for the bottoming subcritical steam cycle (125 bar/565 °C/565 °C). The net thermal efficiency of the proposed process was 42.7%LHV, while a CO2 capture level of 95% was reached. The efficiency was considerably higher than for a supercritical CFPP retrofitted with an ammonia-based CO2 capture plant (net thermal efficiency of 27.9%HHV).208 This is also 5.7% points higher than for a CFPP retrofitted with the CaL plant analysed by Romeo et al.86 (Section 5.1.2).
It is also important to benchmark the process performance improvements through substitution of the dual-stage Selexol process, which is commonly considered in the IGCC power plants, with the CaL plant. Connell et al.129 have evaluated such performance improvement in an IGCC power plant, which comprises two F-class gas turbines (Case 2 in Black et al.209). In the considered CaL configuration, which was based on the double-looping CCR process developed and successfully demonstrated by Wang et al.,26,32 each reactor was assumed to reach chemical and phase equilibrium at a given operating temperature. In contrast to previous studies, the carbonator was operated at 33 bar, which required a temperature of 700 °C to allow Ca(OH)2 dissociation and hence the water/gas shift reaction. To increase the average sorbent conversion, and hence operate the system at Ca![[thin space (1/6-em)]](https://www.rsc.org/images/entities/char_2009.gif) :
:![[thin space (1/6-em)]](https://www.rsc.org/images/entities/char_2009.gif) C ratio of 1.3 that was identified in the pilot-plant testing to allow reaching more than 90% CO2 capture, the sorbent is hydrated at 2 bar and 493 °C. The reason for the hydrator being operated at an elevated pressure was to increase its operating temperature and allow for more waste heat recovery in the system. An operating temperature of more than 875 °C in the calciner is maintained through oxy-combustion of coal. The conceptual IGCC design assumes that the heat from the CaL plant is utilised to generate steam for the bottoming steam cycle (Fig. 36).
C ratio of 1.3 that was identified in the pilot-plant testing to allow reaching more than 90% CO2 capture, the sorbent is hydrated at 2 bar and 493 °C. The reason for the hydrator being operated at an elevated pressure was to increase its operating temperature and allow for more waste heat recovery in the system. An operating temperature of more than 875 °C in the calciner is maintained through oxy-combustion of coal. The conceptual IGCC design assumes that the heat from the CaL plant is utilised to generate steam for the bottoming steam cycle (Fig. 36).
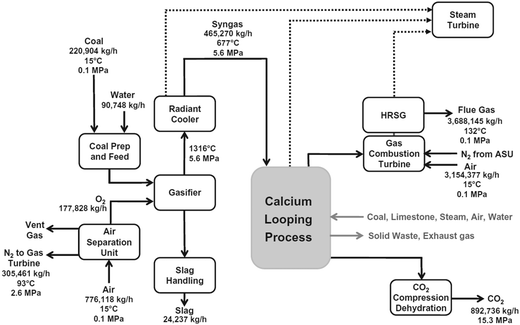 | ||
| Fig. 36 Conceptual design of integration of calcium looping plant to IGCC (reprinted with permission from Connell et al.129 Copyright 2015 Elsevier). | ||
Having compared the performance of the IGCC with the CCR process and the conventional IGCC with dual stage Selexol process, Connell et al.129 have found that net thermal efficiency increased by 0.4% points, from 32.7%HHV to 33.1%HHV, with the coal oxy-combustion accounting for 41% of the total heat input to the process. This performance was 6.5% points higher than for a comparable subcritical CFPP retrofitted with an MEA scrubbing system.209 More importantly, the net power output of the system increased by 71.7%, from 543.2 MWel to 932.9 MWel.
In the IGCC power plant, the CaL process can be used as either post-combustion, with the standard AGR process used for syngas treatment, or pre-combustion technology. Cormos and Cormos128 have investigated the difference between these approaches for a 561.15 MWel IGCC power plant of 44.36%LHV net thermal efficiency. The performance of all reactors in the system was determined based on thermodynamic equilibrium, as no significant differences were found when the kinetics of the calcination and carbonation processes were considered. In the investigated CaL plant, the carbonator and the calciner were operated at 650–700 °C and 900–950 °C, respectively. The temperature in the calciner was maintained through oxy-combustion of coal. It was also assumed that the CaL plant was fully heat-integrated with the rest of the plant.
In the first configuration, the CaL plant was proposed to be retrofitted after the power block (Fig. 37a), which would provide a flexible integrated system. Conversely, the second configuration assumes that the carbonator was located after the AGR plant (Fig. 37b). Steam is supplied directly to the calciner to facilitate the water/gas shift reaction allowing the H2-rich stream to be fed to the power block.
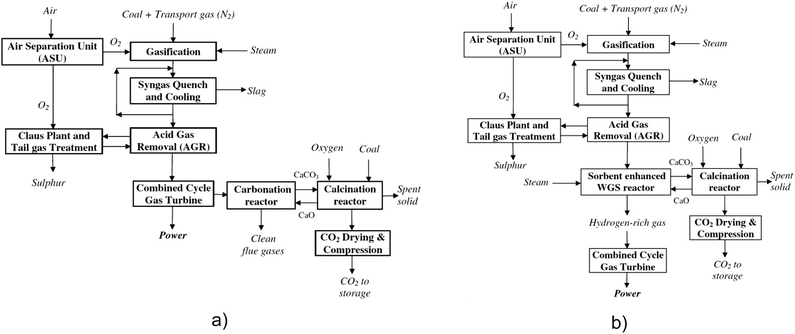 | ||
| Fig. 37 Conceptual design of integration of (a) post-combustion and (b) pre-combustion calcium looping plant to IGCC (adapted with permission from Cormos and Comros.128 Copyright 2015 Elsevier). | ||
Analysis of the overall plant performance indicators revealed that on integration of the CaL plant the net thermal efficiency dropped by 10.1% points for the post-combustion configuration and by 7.3% points for the pre-combustion configuration. With utilisation of the waste heat to produce high-pressure steam, which was then used to produce power in the bottoming steam cycle, the net power output increased by 14.6% and 19.4% for the post-combustion and pre-combustion configurations, respectively. Although such results show that the former configuration is more promising in terms of overall process performance, its higher integration degree would affect plant flexibility. Moreover, Cormos and Cormos128 have concluded that the net efficiency penalty of the post-combustion configuration is comparable with the one associated with conventional post-combustion scrubbing technologies. Hence application of CaL as a post-combustion CO2 capture plant will not bring any benefit in terms of process performance. However, the pre-combustion configuration was found to result in a net efficiency penalty 1–2% points lower than conventional pre-combustion scrubbing technologies.
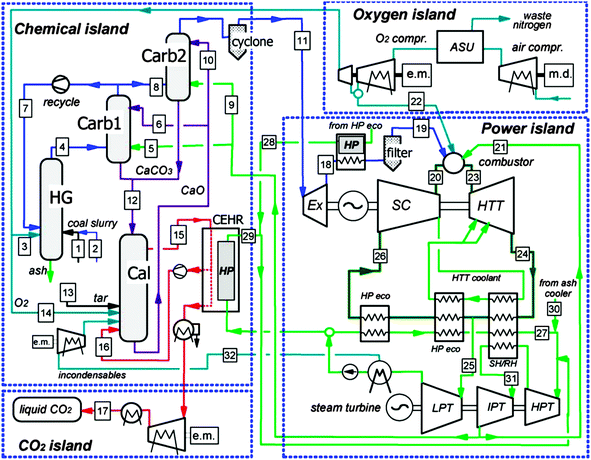 | ||
| Fig. 38 Conceptual design of Zero-Emissions COal MIXed technology (reprinted with permission from Romano and Lozza.210 Copyright 2015 Elsevier). | ||
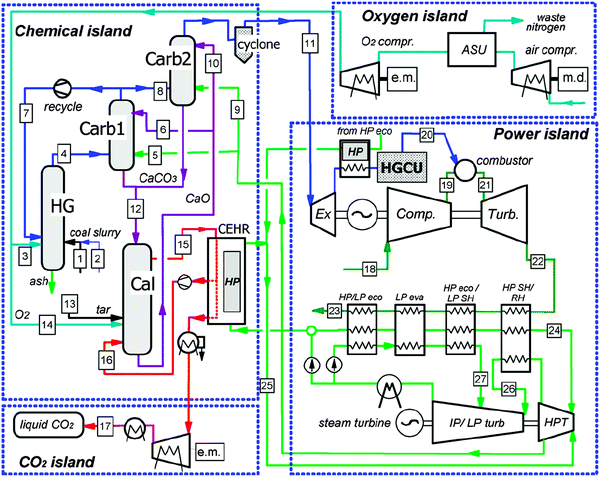 | ||
| Fig. 39 Conceptual design of Zero-Emissions COal Mixed technology with Air Gas turbine (reprinted with permission from Romano and Lozza.127 Copyright 2015 Elsevier). | ||
In the chemical island, where each reactor was assumed to operate under equilibrium conditions, coal slurry is gasified under an H2 atmosphere in a hydrogasifier producing syngas that is then shifted to the H2-rich stream in the carbonator. A small amount of O2 is utilised to sustain the operating temperature at 700–1000 °C, depending on the operating pressure ranging between 30 bar and 70 bar. The overall chemical reaction taking place in the hydrogasifier and the carbonator is presented in eqn (101). This reaction was found to be exothermal, as the heat released on the exothermal CO2 removal from the syngas was enough to sustain the steam reforming reaction. Part of the H2-rich stream is recycled from the carbonator to the hydrogasifier.
 | (101) |
The power island of ZECOMIX technology comprises a semi-closed Joule cycle, in which heat from the syngas oxy-combustion and the combustion gases are mixed with compressed steam to control the combustor outlet temperature. Such a mixture is expanded in a high-temperature steam turbine and then used for supercritical steam generation in the bottoming steam cycle. The incondensable species, such as CO2 and O2, are removed from the condenser and from the deaerator with part of the steam sent to the calciner. This approach allows the ASU load to be minimised as unreacted O2 is recycled to the calciner. Conversely, ZECOMAG technology has a more conventional power island, in which the syngas is burned with air in an open gas turbine cycle, and the discharged flue gas is used to generate supercritical steam in the dual-pressure heat recovery steam generator for the steam cycle.127 Despite its more conventional configuration, ZECOMAG cannot be considered as a zero-emissions technology as the gas turbine flue gas, which consists of CO2, NOx and SOx, is exhausted to the environment.
Analysis of the overall process performance revealed that ZECOMIX and ZECOMAG yield similar maximum net thermal efficiencies of 46.69%LHV and 46.74%LHV, respectively. The analysis also revealed that the net efficiency of ZECOMIX was degraded by 0.59% points on increase of the steam compressor pressure from 25 bar to 48.5 bar, and by 2.32% points on reduction of the calciner temperature to 920 °C. In addition, reduction of the average sorbent conversion in the carbonator from 66.7% to 20.0% was found to reduce the net thermal efficiency of ZECOMIX by 3% points and of ZECOMAG by 2.5%. This indicates that sorbent performance is critical in terms of the overall process efficiency. Finally, the net power output of 667.5 MWel for ZECOMIX when the steam compressor is operated with a pressure ratio of 25, was found to be 25.2% higher than for ZECOMAG with the gas turbine compressor operated with a pressure ratio of 20. The maximum net power output achievable by ZECOMIX was found to be 1242.2 MWel if the steam compressor inlet pressure was increased from 1.02 bar to 1.9 bar.
5.3 Summary
A very low net projected efficiency penalty of 2.6% points was estimated by Martínez et al.37 in investigating a subcritical CFPP retrofit with a CaL plant and supercritical secondary steam cycle. This shows that implementation of CaL plants into subcritical units, the majority of the current CFPP fleet, would result in a minor net efficiency penalty compared to conventional CO2 capture technologies. Nevertheless, the mean net projected efficiency penalty for a CFPP was 6–7% points with 2.5–3% points associated with the CaL plant itself and the remainder caused by the CCU. Yang et al.16 have estimated an extremely low net thermal efficiency of 21.2% for a CaL plant integrated into a CFPP without any heat recovery system. This implies that as high-grade heat is available in the CaL plant, it needs to be recovered efficiently to reach high overall performance.
The studies by Berstad et al.146 and Cormos and Cormos128 revealed that integration of a CaL plant as a post-combustion technology into the NGCC and the IGCC power plant would result in a net efficiency penalty comparable to conventional CO2 capture systems. This could be associated with low partial pressure of CO2 in the flue gas, and thus lower driving force for the carbonation reaction. However, in studies where a CaL plant was used as a substitute for a complex gas processing plant integrated as a pre-combustion CO2 capture technology into an IGCC system, the net thermal efficiency increased by 0.4129–3.8%131 points, and reached 43.2%LHV.131 The study by Romano and Lozza127,210 revealed that development of new coal-based power generation systems based on the CaL process, which are characterised by net thermal efficiencies of 46.69%LHV for CO2 capture higher than 95%, is feasible. Such values for net thermal efficiency, which are in the range of supercritical and ultra-supercritical CFPPs without CO2 capture plants, and increased process reliability due to the lack of complicated chemical plant indicate that gasification-based power plants with pre-combustion CaL could become a cost-efficient and environmentally-friendly technology for coal-based power generation, and could allow further coal utilisation.
It is important to highlight that all of the reviewed studies use different initial sets of assumptions regarding the reference power plant. Moreover, the reference net thermal efficiencies of the CFPPs gathered in Table 7 vary between 32.7–44.6%HHV (studies using higher heating value basis), and 36.0–46.0%LHV (studies using lower heating value basis). However, as mentioned in the introduction, the average net thermal efficiency of the existing global fleet has been identified to be 33%LHV, which corresponds to 30–31%HHV depending on fuel composition.211 As the sub-critical units, which operate with low net thermal efficiencies and yet account for around 75% of the global CFPP capacity,6 can be expected to be still in operation in the near future, the further analyses of the CaL process integration should focus on a portfolio of steam conditions to assure prediction accuracy and realism. This implies that baseline reference models for CaL process integration need to be established, which can be done, for example, by replicating CFPP (subcritical and supercritical), NGCC and IGCC models from the revised NETL report209 and developing ultra-supercritical CFPP model based on the European Benchmarking Task Force documents.212,213Table 7 reveals that not only are the reference CFPPs based on different steam conditions, from sub-critical to ultra-supercritical, but also their gross power outputs and net thermal efficiencies vary considerably. The performance of the reference IGCC plants vary significantly as well. As this makes a comparison of results across different analyses impossible, a set of baseline reference models, which should include models for CFPP, NGCC and IGCC plants with consideration of different steam conditions, needs to be established. Such baseline reference models would allow for a reliable comparison of further process developments using process simulations.
| Reference | Power plant type | Gross power output (MWel) | Reference net thermal efficiency (%LHV) | Net thermal efficiency of integrated system (%LHV) | Efficiency penalty (% points) |
|---|---|---|---|---|---|
| a SC – supercritical; USC – ultra-supercritical; SubC – Subcritical. b Steam conditions not specified. c Supercritical lignite-fired power plant. d HHV basis. e Net power output. | |||||
| Shimizu et al.28 | SC-CFPPa | 1000 | N/A | 33.4d | N/A |
| Yang et al.16 | SC-CFPPa | 600 | 40.6 | 25.3–36.8 | 3.8–15.3 |
| Abanades et al.39 | USC-CFPPa | 100 | 46 | 38.8–40.0 | 6–7.2 |
| Martínez et al.83 | SubC-CFPPa | 350 | 36 | 30.3–33.4 | 2.6–5.7 |
| Martínez et al.148 | SC-CFPPa | 433.7 | N/A | 37.8 | N/A |
| Martínez et al.133 | CFPPb | 500 | 44.35 | N/A | |
| Romeo et al.86 | SC-CFPPa | 450 | 44.93 | 37.0 | 7.93 |
| Lara et al.200 | SC-CFPPa | 500 | 38.2 | 33.0 | 5.2 |
| Lara et al.201 | SC-CFPPa | 500 | 38.2 | 34.0 | 6.2 |
| Ströhle et al.147 | USC-CFPPa | 1100 | 45.6 | 42.4–42.8 | 2.8–3.2 |
| Lasheras31 | USC-CFPPa | 1000 | 45.6 | 42.7 | 2.9 |
| Wang et al.32 | USC-CFPPa | 561 | 44.6d | 37.2–38.0d | 6.6–7.4 |
| Wang et al.26 | SubC-CFPPa | 500e | 35.8d | N/A | N/A |
| Wang et al.26 | SC-CFPPa | 500e | 39.0d | N/A | N/A |
| Vorrias et al.132 | SC-LFPPc | 330 | 42.5 | 37.5 | 5.0 |
| Berstad et al.146 | NGCC | 418.8 | 52.6d | 41.2–43.5d | 9.1–11.4 |
| Kunze et al.131 | IGCC | 510 | 39.4 | 43.2 | −3.8 |
| Wang et al.130 | IGCC | N/A | N/A | 42.7 | N/A |
| Connel et al.129 | IGCC | 734 | 32.7d | 33.1d | −0.4 |
| Cormos and Cormos128 | IGCC | 561.2 | 44.4 | 34.2–37.0 | 7.4–10.2 |
| Romano and Lozza210 | ZECOMIX | N/A | N/A | 44.4–46.7 | N/A |
| Romano and Lozza127 | ZECOMAG | N/A | N/A | 46.7 | N/A |
| Reference | Carbonator assumptions | Calciner assumptions | Modelling approach for other system components | ||||
|---|---|---|---|---|---|---|---|
| Model | Operating conditions | Model | Operating conditions | ASU | CCU | Secondary steam cycle | |
| Shimizu et al.28 | Semi-predictive model with KL hydrodynamics | T = 650 °C | Equilibrium | T = 950 °C | Assumed wASU = 25.9 MJ per kmol-O2 | Assumed wCCU = 24.5 MJ kmol−1-CO2 | Assumed ηg = 42.6%HHV |
Ca![[thin space (1/6-em)]](https://www.rsc.org/images/entities/char_2009.gif) : :![[thin space (1/6-em)]](https://www.rsc.org/images/entities/char_2009.gif) C = 8.29 C = 8.29 |
X calc = 100% | ||||||
| E carb = 83% | |||||||
| Yang et al.16 | Average conversion w/o correction | T = 650 °C | Equilibrium | T = 900 °C | Assumed wASU = 220 kW h per t-O2 | Not considered | Thermodynamic model |
Ca![[thin space (1/6-em)]](https://www.rsc.org/images/entities/char_2009.gif) : :![[thin space (1/6-em)]](https://www.rsc.org/images/entities/char_2009.gif) C = 5 C = 5 |
|||||||
| E carb = 85% | |||||||
| Abanades et al.39 | Average conversion w/o correction | T = 650 °C | Equilibrium | T = 950 °C | Estimated using process model | Estimated using process model | N/A |
| E carb = 75.2% | X calc = 100% | ||||||
| Martínez et al.83 | Semi-predictive model with simple hydrodynamics | T = 650 °C | Equilibrium | T = 950 °C | Assumed wASU = 160 kW h per t-O2 | Assumed wCCU = 100 kW h/t-CO2 | Assumed ηg = 45% |
| E carb = 70–90% | λ O2 = 1.05 | ||||||
| u 0 = 6 m s−1 | X calc = 100% | ||||||
| y O2,fluidising gas = 25%vol | |||||||
| Martínez et al.148 | Semi-predictive model with simple hydrodynamics | T = 650 °C | Equilibrium | T = 950 °C | Not specified | Estimated using adiabatic compression model with ηa = 75% | Thermodynamic model |
| E carb = 89% | E calc = 100% | ||||||
| Martínez et al.133 | Average conversion with correction | T = 650 °C | Equilibrium | T = 930 °C | Assumed wASU = 220 kW h per t-O2 | N/A | N/A |
| X carb/Xave = 0.8 | X calc = 100% | ||||||
| E carb = 90% | |||||||
| Romeo et al.86 | Average conversion w/o correction | T = 650 °C | Equilibrium | T = 875–950 °C | Assumed wASU = 220 kW h per t-O2 | N/A | Thermodynamic model |
| X carb = 20% | X calc = 100% | ||||||
| E carb = 85% | y O2,fluidising gas = 95%vol | ||||||
| Lara et al.200,201 | Average conversion w/o correction | T = 650 °C | Equilibrium | T = 950 °C | Assumed wASU = 220 kW h per t-O2 | Estimated using isentropic compression model with ηi = 80% | Thermodynamic model |
Ca![[thin space (1/6-em)]](https://www.rsc.org/images/entities/char_2009.gif) : :![[thin space (1/6-em)]](https://www.rsc.org/images/entities/char_2009.gif) C = 5 C = 5 |
F 0/FR = 0.025 | ||||||
| Ströhle et al.,147 Lasheras et al.31 | Average conversion w/o correction and Semi-predictive mode with K–L hydrodynamics | T = 650 °C | Equilibrium | T = 900 °C | Assumed wASU = 184.8 kW h per t-O2 | N/A | Assumed ηg = 50.3%LHV |
| E carb = 80% | λ O2 = 1.10 | ||||||
| E SO2 = 99% | X coal = 0.995 | ||||||
| Wang et al.26,32 | Equilibrium | T = 625 °C | Equilibrium | T = 1000 °C | Assumed wASU = 200 kW h per t-O2 | Assumed wASU = 119 kW h/t-CO2 | Assumed ηg = 42%HHV |
Ca![[thin space (1/6-em)]](https://www.rsc.org/images/entities/char_2009.gif) : :![[thin space (1/6-em)]](https://www.rsc.org/images/entities/char_2009.gif) C = 1.4 C = 1.4 |
y O2,fluidising gas = 95%vol | ||||||
| E carb = 90% | |||||||
| E SO2 = 100% | |||||||
| Vorrias et al.132 | Average conversion w/o correction | T = 650 °C | Equilibrium | T = 950 °C | Estimated using process model | Estimated using process model | Thermodynamic model |
Ca![[thin space (1/6-em)]](https://www.rsc.org/images/entities/char_2009.gif) : :![[thin space (1/6-em)]](https://www.rsc.org/images/entities/char_2009.gif) C = 7 C = 7 |
F 0/FCO2 = 0.1 | ||||||
| E carb = 90% | y O2,fluidising gas = 80%vol | ||||||
| Berstad et al.146 | Average conversion with correction | T = 600 °C | Equilibrium | T = 950 °C | Assumed wASU = 200 kW h per t-O2 | Estimated using polytrophic compression model with ηp = 75–80% | Thermodynamic model |
| X carb/Xave = 0.75 | F 0/FR = 0.06 | ||||||
| E carb = 85–86% | λ O2 = 1.03 | ||||||
| X calc = 100% | |||||||
| yO2,fluidising gas = 25%vol | |||||||
| Kunze et al.131 | Average conversion w/o correction | T = 650 °C | Equilibrium | T = 950 °C | Assumed wASU = 28 kW h per t-O2 | Assumed wASU = 83 kW h/t-CO2 | N/A |
| X carb = 0.2 | X calc = 95% | ||||||
| E carb = 90% | |||||||
| Wang et al.130 | Equilibrium | T = 600 °C | Equilibrium | T = 900 °C | Assumed wASU = 245 kW h per t-O2 | Estimated using isentropic compression model with ηi = 75% | Thermodynamic model |
| Connel et al.129 | Equilibrium | T = 700 °C | Equilibrium | T > 875 °C | N/A | N/A | N/A |
| E carb > 90% | |||||||
| Cormos and Cormos128 | Equilibrium | T = 650–700 °C | Equilibrium | T = 900–950 °C | Assumed wASU = 225 kW h per t-O2 | Estimated using process model | Thermodynamic model |
| Romano and Lozza127,210 | Equilibrium | T = 875–882 °C | Equilibrium | T = 1250 | Estimated | Estimated using isentropic compression model with ηi = 89.5% | Thermodynamic model |
| X carb = 0.5 | |||||||
Secondly, the studies reviewed assumed that total calcination is achieved in the calciner, with the exception of the study by Kunze et al.131 who assumed 95% conversion in the calciner to account for less favourable calcination conditions. Thirdly, all the studies utilised thermodynamic models to represent the calcination process, mostly achieving chemical equilibrium through Gibbs' free energy minimisation. Most of the studies analysing the combined cycle power plants used thermodynamic models also for the carbonator, with the exception of Berstad et al.,146 while more complex models, such as average conversion models16,39,132,133,147 and 1D carbonator models based on K–L hydrodynamics28,31,147 were used in analysing the CFPPs. Interestingly, the study by Ströhe et al.,147 in which both models have been compared, revealed that, although application of the maximum average conversion model without the correction factor resulted in underestimation of several process parameters, the overall process performance of a CFPP with a CaL process was the same for both models. Furthermore, the sensitivity study performed by Lasheras et al.31 revealed that the uncertainty in the K–L model can affect CaL plant performance by up to 10%. As this can have a significant effect on estimation of overall process performance, further experimental tests are necessary to identify the required parameters.
It is worth pointing out that the lower operating temperature (600 °C) of the carbonator in the CaL linked with the NGCC compared to studies reviewed in Section 5.1 (650 °C), which assessed integration of the CFPP and the CaL process, results in slower carbonation reaction, hence larger units are required. Moreover, low CO2 partial pressure in the NGCC flue gas makes the carbonation process more difficult, and thus the maximum CO2 capture level of only 86% in the carbonator was achieved. Although the carbonator temperature could be further lowered, favouring chemical equilibrium at the expense of reaction kinetics, the desired high-pressure steam temperature of 550–560 °C146 would not be achievable.
Finally, although the operating temperatures of the carbonator and the calciner were found to be similar in all studies reviewed, selection of several important parameters seem to be inconsistent (Table 8). Namely, some studies assume that the O2 in the calciner fluidising gas is diluted with recycled CO2, and its concentration varies from 25%vol83,146 to 80%vol.132 In addition, several studies claimed that no CO2 recycle is required and 95%vol-purity O2 can be directly fed to the calciner.26,32,86 Current pilot-plant testing activities were conducted with the O2 concentration below 50%vol.33,98,100,104 Therefore, to limit the sorbent deterioration, further integration studies should include the CO2 recycle to control the temperature in the calciner. Another important parameter is Ca![[thin space (1/6-em)]](https://www.rsc.org/images/entities/char_2009.gif) :
:![[thin space (1/6-em)]](https://www.rsc.org/images/entities/char_2009.gif) C ratio that has been assumed to be between 5–8.29 to reach the CO2 capture levels in the carbonator up to 90% using non-pretreated sorbent. It needs to be highlighted that the pilot-plant tests reviewed in Section 3 claimed that to reach such reduction in the CO2 emissions in the carbonator, the Ca
C ratio that has been assumed to be between 5–8.29 to reach the CO2 capture levels in the carbonator up to 90% using non-pretreated sorbent. It needs to be highlighted that the pilot-plant tests reviewed in Section 3 claimed that to reach such reduction in the CO2 emissions in the carbonator, the Ca![[thin space (1/6-em)]](https://www.rsc.org/images/entities/char_2009.gif) :
:![[thin space (1/6-em)]](https://www.rsc.org/images/entities/char_2009.gif) C ratio should be higher than 8–11.6.98,103,107 For this reason, in the studies where low Ca
C ratio should be higher than 8–11.6.98,103,107 For this reason, in the studies where low Ca![[thin space (1/6-em)]](https://www.rsc.org/images/entities/char_2009.gif) :
:![[thin space (1/6-em)]](https://www.rsc.org/images/entities/char_2009.gif) C ratios were used to reach high CO2 capture level in the carbonator, prediction of the process performance may be overly optimistic due to under-estimated solids looping rate, and thus heat requirement in the calciner. Moreover, the excess O2 and the relative limestone make-up rate, which is represented using F0/FR ratio, were found to vary between 1.03–1.10 and 0.025–0.06, respectively. This implies the need for establishing baseline design parameters for the CaL process that would allow comparing process performance across analyses.
C ratios were used to reach high CO2 capture level in the carbonator, prediction of the process performance may be overly optimistic due to under-estimated solids looping rate, and thus heat requirement in the calciner. Moreover, the excess O2 and the relative limestone make-up rate, which is represented using F0/FR ratio, were found to vary between 1.03–1.10 and 0.025–0.06, respectively. This implies the need for establishing baseline design parameters for the CaL process that would allow comparing process performance across analyses.
6 The future of calcium looping in power generation systems
In light of increasing environmental concerns, the power sector seems to be the first in line to be completely decarbonised by 2050. High reliance on coal, however, makes this a challenging task requiring implementation of CO2 capture technologies in the existing coal-based power generation fleet. Unfortunately, conventional technologies, which utilise chemical sorbents and oxy-fuel combustion, result in a considerable drop in system efficiency, leading to an increase in the cost of electricity. The CaL process is regarded as a feasible alternative to conventional technologies because not only is it characterised by lower loss in power plant efficiency, but it is also capable of increasing the power output of the system.CaL process viability and performance have been widely investigated in bench- and pilot-scale facilities the size of which varies between 1 kWth and 1.7 MWth. The test campaigns reported in the open literature provide valuable insight into the process operation that can be used for process model development. Nevertheless, this review has shown that the available data were not detailed enough for any test facility to be useful for detailed process model validation. This is caused by, for example, the uncertainty associated with the solid looping rate measurements. To allow detailed process model validation, however, more detailed data should be reported for future tests.
The CaL experimental trials have revealed that the actual CO2 capture level can be close to that determined by equilibrium provided sufficient solids inventory of moderate conversion and looping rate are maintained. However, deterioration of the sorbent performance, triggered mainly by sintering and sulphation, requires relatively high make-up rates to reach the desired level of average sorbent conversion, which affects the economic performance of the system. Therefore, the further developments of the sorbent performance enhancement measures and/or novel sorbents experiencing lower performance deterioration need to be pursued in the near to mid-term timescale.
To date, the predictions of process performance have been modelled with different levels of complexity. Five levels can be distinguished, which differ in application of the kinetic or equilibrium reactions, considering the concentration changes in the gas and solid phases and implementation of FB hydrodynamics. Importantly, the effect of sulphation on the sorbent activity and inert solids accumulation in the system were rarely included in the models available in the literature. Therefore, to improve the accuracy and reliability of the overall process performance prediction, future models should account for sorbent sulphation and ash accumulation.
Application of the CaL plant to typical coal-based power generation systems was found to impose lower efficiency penalties (6–7% points), compared to conventional CO2 capture systems, proving the technology viability. Moreover, novel power generation systems that are based on the CaL process have been proposed, and reach net thermal efficiencies close to those of ultrasupercritical CFPPs without CO2 capture. This implies that the CaL plant can serve as a base system for development of state-of-the-art power generation systems that could be implemented on a large scale in place of current technologies. Nevertheless, it is highlighted that the analyses performed to date used not only different CaL modelling approaches, but more importantly they employed different reference power plants and sets of CaL operating conditions. As this restricts the accuracy of process performance comparison across these analyses, the baseline reference models for the power plant and CaL plant need to be developed. In the near term, such baseline models would allow a reliable comparison of the process performances of the further analyses of the CaL process improvements.
List of abbreviations
| AGR | Acid gas removal |
| ASU | Air separation unit |
| BFB | Bubbling fluidised bed |
| CaL | Calcium looping |
| CaRS-CO2 | Calcium-based reaction separation for CO2 |
| CCR | Carbonation–calcination reaction process |
| CCS | Carbon capture and storage |
| CCU | CO2 compression unit |
| CFB | Circulating fluidised bed |
| CFD | Computational fluid dynamics |
| CFPP | Coal-fired power plant |
| DFB | Dual fluidised bed |
| EB | Entrained bed |
| FGD | Flue gas desulphurisation unit |
| HEN | Heat exchanger networks |
| IFK | The Institute of Combustion and Power Plant Technology (Institut für Feuerungs-und Kraftwerkstechnik) |
| IGCC | Integrated-gasification combined cycle power plant |
| INCAR-CSIC | The Instituto Nacional del Carbón – Consejo Superior de Investigaciones Científicas |
| ITRI | The Industrial Technology Research Institute |
| K–L | Kunii and Levenspiel model |
| MB | Moving bed |
| MDEA | Methyldiethanolamine |
| MEA | Monoethanolamine |
| NGCC | Natural gas combined cycle power plant |
| OSCAR | The Ohio State carbonation ash reactivation process |
| PZ | Piperazine |
| RK | Rotary kiln |
| SER | Sorption-enhanced reforming process |
| SME | Sorption-enhanced methane steam reforming |
| TGA | Thermo-gravimetric analyser |
| ZECOMAG | Zero-emissions coal mixed technology with air gas turbine |
| ZECOMIX | Zero-emissions coal mixed technology |
Nomenclature
Latin symbols
| A | Bed cross-section area, m2 |
| a 1 | Fitting parameter in Li and Cai133 correlation, — |
| a 2 | Fitting parameter in Li and Cai133 correlation, — |
| c 0 | Freundlich isotherm characteristic, — |
| C i | Concentration of species i, kmol m−3 |
| D | Diffusivity coefficient, m2 s−1 |
| d b | Bubble diameter, m s−1 |
| E | Activation energy, J kmol−1 |
| E carb | CO2 capture level in the carbonator, — |
| E calc | Efficiency of the calciner, — |
| f | Extent of calcination or carbonation, — |
| F 0 | CaCO3 makeup rate, kmol s−1 |
| f 1 | Fitting parameter in Li and Cai133 correlation, — |
| f 2 | Fitting parameter in Li and Cai133 correlation, — |
| f a | Active fraction of particles, — |
| F CO2 | CO2 flow rate in the flue gas, kmol s−1 |
| F H | Sorbent rate diverted to the hydrator, kmol s−1 |
| F R | CaO looping rate, kmol s−1 |
| h | CaCO3 layer thickness, nm |
| H D | Height of the dense phase, m |
| k | Kinetic rate constant or sorbent deactivation constant or proportionality constant, 1 s−1, m3 mol−1 s−1, m4 mol−1 s−1, — |
| K be | Bubble and emulsion interchange coefficient, — |
| k g | Mass transfer coefficient, m s−1 |
| N | Number of calcination–carbonation cycle, — |
| n | Sorbent sintering exponent or number of active sites in Langmuir–Hinshelwood mechanism, — |
| N Ca | Mole inventory of CaO in the bed, kmol |
| M i | Molar mass of species i, kg kmol−1 |
| P CO2 | Partial pressure of CO2, atm |
| r | Reaction rate, kmol m−3 s−1, 1 s−1 |
| R | Particle radius, m |
| r 0 | Mole fraction of particles that has never been calcined or initial grain radius, — or m |
| r C/S | Molar ratio of carbon and sulphur in the fuel, — |
| Re | Reynolds number, — |
| R g | Gas constant, J kmol−1 K−1 |
| r N | Mass fraction of particles that has undergone N carbonation–calcination cycles, — |
| r i | Un-reacted radius of CaO grain, M |
| S | Particle surface area, m2 m−3 |
| Sc | Schmidt number, — |
| Sh | Sherwood number, — |
| T | Temperature, K |
| t* | Actual residence time, s |
| u 0 | Superficial gas velocity, m s−1 |
| u b | Bubble rise velocity, m s−1 |
| u b* | Rising bubble gas velocity, m s−1 |
| v CO2 | Volume fraction of CO2 in the gas phase, — |
| V M,i | Molar volume of species i, m3 kmol−1 |
| W CaO | Mass inventory of CaO in the bed, kg |
| X | Sorbent conversion, — |
| y comb | mass ratio between fuel going to the main combustor and total fuel into the plant, — |
Greek symbols
| δ | Volume of bubbles per unit bed volume, — |
| ε | Porosity of sorbent particle or solid fraction in the reactor, — |
| θ | Fraction of the active sites, — |
| ρ i | Mass density of species i, kg m−3 |
| τ | Average residence time, s |
| φ e | Effectivity factor, — |
| Φ s | Particle sphericity, — |
| Ψ | Sorbent pore structural parameter, — |
Superscripts
| H | Hydrated sorbent |
Subscripts
| 0 | Initial conditions |
| ave,max | Refer to maximum average sorbent conversion |
| b | Refer to bubble zone |
| calc | Variable related to calciner operating conditions or stream leaving calciner |
| carb | Variable related to carbonator operating conditions or stream leaving carbonator |
| e | Refer to emulsion zone |
| eq | Equilibrium conditions |
| mf | Refer to minimum fluidising conditions |
| max | Refer to maximum sorbent conversion |
| r | Refer to residual sorbent conversion |
| s | Refer to intrinsic kinetic constant |
References
- European Commission, Communication from the Commission to the European Parliament, the Council, the European Economic and Social Committee and the Committee of the Regions, International climate policy post-Copenhagen: Acting now to reinvigorate global action on climate change, COM(2010) 86, Commission of the European Communities, Brussels, Belgium, 2010 Search PubMed.
- European Commission, Communication from the Commission to the European Parliament, the Council, the European Economic and Social Committee and the Committee of the Regions, A policy framework for climate and energy in the period from 2020 to 2030, European Commission, COM(2014) 15, Brussels, Belgium, 2014 Search PubMed.
- European Council, European Council 23/24 October 2014 – Conclusions, EUCO gv 169/14 CO EUR 13 CONCL 5, European Commission, Brussels, Belgium, 2014 Search PubMed.
- European Commission, Communication from the Commission to the European Parliament, the Council, the European Economic and Social Committee of the Regions - Energy Roadmap 2050, COM(2011) 885/2, European Commission, Brussels, Belgium, 2011 Search PubMed.
- UNEP, The Emissions Gap Report 2012, United Nations Environment Programme (UNEP), Nairobi, Kenya, 2012 Search PubMed.
- IEA, Tracking Clean Energy Progress 2013. IEA Input to the Clean Energy Ministerial, IEA Publications, Paris, France, 2013 Search PubMed.
- IEA, Power generation from coal: Measuring and reporting efficiency performance and CO2 emissions, IEA Publications, Paris, France, 2010 Search PubMed.
- EIA, International Energy Outlook 2011, DOE/EIA-0484(2011), U.S. Energy Information Administration, Washington, USA, 2011 Search PubMed.
- IEA, Technology Roadmap: Carbon capture and storage, IEA Publications, Paris, France, 2013 Search PubMed.
- K. Stéphenne, Start-up of world’s first commercial post-combustion coal fired ccs project: Contribution of Shell CANSOLV to Saskpower Boundary Dam ICCS project, in 12thInternational Conference on Greenhouse Gas Control Technologies, ed. T. Dixon, S. Twinning and H. Herzog, GHGT, Austin, TX, USA, 2014, vol. 63, p. 6106 Search PubMed.
- N. Rodríguez, M. Alonso and J. C. Abanades, Average activity of CaO particles in a calcium looping system, Chem. Eng. J., 2010, 156(2), 388–394 CrossRef PubMed.
- A. S. Bhown and B. C. Freeman, Analysis and status of post-combustion carbon dioxide capture technologies, Environ. Sci. Technol., 2011, 45(20), 8624–8632 CrossRef CAS PubMed.
- J. Blamey, E. Anthony, J. Wang and P. Fennell, The calcium looping cycle for large-scale CO2 capture, Prog. Energy Combust. Sci., 2010, 36(2), 260–279 CrossRef CAS PubMed.
- C. C. Dean, J. Blamey, N. H. Florin, M. J. Al-Jeboori and P. S. Fennell, The calcium looping cycle for CO2 capture from power generation, cement manufacture and hydrogen production, Chem. Eng. Res. Des., 2011, 89, 836–855 CrossRef CAS PubMed.
- M. E. Boot-Handford, J. C. Abanades, E. J. Anthony, M. J. Blunt, S. Brandani, N. Mac Dowell, J. R. Fernandez, M. C. Ferrari, R. Gross, J. P. Hallett, R. S. Haszeldine, P. Heptonstall, A. Lyngfelt, Z. Makuch, E. Mangano, R. T. J. Porter, M. Pourkashanian, G. T. Rochelle, N. Shah, J. G. Yao and P. S. Fennell, Carbon capture and storage update, Energy Environ. Sci., 2014, 7, 130–189 CAS.
- Y. Yang, R. Zhai, L. Duan, M. Kavosh, K. Patchigolla and J. Oakey, Integration and evaluation of a power plant with a CaO-based CO2 capture system, Int. J. Greenhouse Gas Control, 2010, 4(4), 603–612 CrossRef CAS PubMed.
- G. Xu, H. G. Jin, Y. P. Yang, Y. J. Xu, H. Lin and L. Duan, A comprehensive techno-economic analysis method for power generation systems with CO2 capture, Int. J. Energy Res., 2010, 34(4), 321–332 CrossRef CAS PubMed.
- K. Goto, K. Yogo and T. Higashii, A review of efficiency penalty in a coal-fired power plant with post-combustion CO2 capture, Appl. Energy, 2013, 111, 710–720 CrossRef CAS PubMed.
- B. R. Stanmore and P. Gilot, Review—calcination and carbonation of limestone during thermal cycling for CO2 sequestration, Fuel Process. Technol., 2005, 86(16), 1707–1743 CrossRef CAS PubMed.
- D. P. Harrison, Sorption-Enhanced Hydrogen Production: A Review, Ind. Eng. Chem. Res., 2008, 47(17), 6486–6501 CrossRef CAS.
- N. H. Florin and A. T. Harris, Enhanced hydrogen production from biomass with in situ carbon dioxide capture using calcium oxide sorbents, Chem. Eng. Sci., 2008, 63(2), 287–316 CrossRef CAS PubMed.
- E. J. Anthony, Ca looping technology: Current status, developments and future directions, Greenhouse Gases: Sci. Technol., 2011, 1(1), 36–47 CrossRef CAS PubMed.
- W. Liu, H. An, C. Qin, J. Yin, G. Wang, B. Feng and M. Xu, Performance enhancement of calcium oxide sorbents for cyclic CO2 capture-a review, Energy Fuels, 2012, 26(5), 2751–2767 CrossRef CAS.
- A. M. Kierzkowska, R. Pacciani and C. R. Müller, CaO-based CO2 sorbents: From fundamentals to the development of new, highly effective materials, ChemSusChem, 2013, 6(7), 1130–1148 CrossRef CAS PubMed.
- M.C. Romano, I. Martínez, R. Muroillo, B. Arstad, R. Blom, D.C. Ozcan, H. Ahn and S. Brandani, Process simulation of Ca-looping processes: Review and guidelines, 2013, 11th International Conference on Greenhouse Gas Control Technologies, GHGT 2012, 37, 18-22 November 2012, Kyoto, Japan, 142.
- W. Wang, S. Ramkumar and L. Fan, Energy penalty of CO2 capture for the Carbonation–Calcination Reaction (CCR) Process: Parametric effects and comparisons with alternative processes, Fuel, 2013, 104, 561–574 CrossRef CAS PubMed.
- T. Hirama, H. Hosoda, K. Kitano and T. Shimizu, Method of separating carbon dioxide from carbon dioxide containing gas and combustion apparatus having function to separate carbon dioxide from the combustion gas, UK Pat., 2291051A, 1996 Search PubMed.
- T. Shimizu, T. Hirama, H. Hosoda, K. Kitano, M. Inagaki and K. Tejima, A Twin Fluid-Bed Reactor for Removal of CO2 from Combustion Processes, Chem. Eng. Res. Des., 1999, 77(1), 62–68 CrossRef CAS.
- R. W. Hughes, D. Y. Lu, E. J. Anthony and A. Macchi, Design, process simulation and construction of an atmospheric dual fluidized bed combustion system for in situ CO2 capture using high-temperature sorbents, Fuel Process. Technol., 2005, 86(14–15), 1523–1531 CrossRef CAS PubMed.
- M. Alonso, N. Rodríguez, G. Grasa and J. C. Abanades, Modelling of a fluidized bed carbonator reactor to capture CO2 from a combustion flue gas, Chem. Eng. Sci., 2009, 64(5), 883–891 CrossRef CAS PubMed.
- A. Lasheras, J. Ströhle, A. Galloy and B. Epple, Carbonate looping process simulation using a 1D fluidized bed model for the carbonator, Int. J. Greenhouse Gas Control, 2011, 5(4), 686–693 CrossRef CAS PubMed.
- W. Wang, S. Ramkumar, D. Wong and L. Fan, Simulations and process analysis of the carbonation–calcination reaction process with intermediate hydration, Fuel, 2012, 92(1), 94–106 CrossRef CAS PubMed.
- D. Y. Lu, R. W. Hughes and E. J. Anthony, Ca-based sorbent looping combustion for CO2 capture in pilot-scale dual fluidized beds, Fuel Process. Technol., 2008, 89(12), 1386–1395 CrossRef CAS PubMed.
- J. M. Valverde, A model on the CaO multicyclic conversion in the Ca-looping process, Chem. Eng. J., 2013, 228, 1195–1206 CrossRef CAS PubMed.
- J. Yin, C. Qui, B. Feng, L. Ge, C. Luo, W. Liu and H. An, Calcium Looping for CO2 Capture at a Constant High Temperature, Energy Fuels, 2014, 28(1), 307–318 CrossRef CAS.
- E. H. Baker, The calcium oxide-carbon dioxide system in the pressure range 1-300 atmospheres, J. Chem. Soc., 1962, 464–470 RSC.
- I. Martínez, R. Murillo, G. Grasa and J. C. Abanades, Integration of a Ca-looping system for CO2 capture in an existing power plant, Energy Procedia, 2011, 4, 1699–1706 CrossRef PubMed.
- J. Valverde, P. E. Sanchez-Jimenez, A. Perejon and L. A. Perez-Maqueda, CO2 multicyclic capture of pretreated/doped CaO in the Ca-looping process. Theory and experiments, Phys. Chem. Chem. Phys., 2013, 15, 11775–11793 RSC.
- J. C. Abanades, E. J. Anthony, J. Wang and J. E. Oakey, Fluidized Bed Combustion Systems Integrating CO2 Capture with CaO, Environ. Sci. Technol., 2005, 39(8), 2861–2866 CrossRef CAS.
- N. Rodriguez, M. Alonso, G. Grasa and J. C. Abanades, Heat requirements in a calciner of CaCO3 integrated in a CO2 capture system using CaO, Chem. Eng. J., 2008, 138(1–3), 148–154 CrossRef CAS PubMed.
- V. Manovic and E. J. Anthony, Improvement of CaO-based sorbent performance for CO2 looping cycles, J. Therm. Sci., 2009, 13(1), 89–104 CrossRef.
- C. J. Abanades and D. Alvarez, Conversion limits in the reaction of CO2 with lime, Energy Fuels, 2003, 17, 308–315 CrossRef.
- R. H. Borgwardt, Calcium oxide sintering in atmospheres containing water and carbon dioxide, Ind. Eng. Chem. Res., 1989, 28(4), 493–500 CrossRef CAS.
- L. Zhen-Shan and C. Ning-Sheng, Process analysis of CO2 capture from flue gas using carbonation–calcination cycles, Environmental and Energy Engineering, 2008, 54(7), 1912–1925 Search PubMed.
- F. García-Labiano, A. Rufas, L. F. De Diego, M. D. L. Obras-Loscertales, P. Gayán, A. Abad and J. Adánez, Calcium-based sorbents behaviour during sulphation at oxy-fuel fluidised bed combustion conditions, Fuel, 2011, 90(10), 3100–3108 CrossRef PubMed.
- M. C. Duke, B. Ladewig, S. Smart, V. Rudolph and J. C. D. Da Costa, Assessment of post-combustion carbon capture technologies for power generation, Front. Chem. Eng. China, 2010, 4(2), 184–195 CrossRef CAS PubMed.
- M. Maroto-Valer, Developments and Innovation in Carbon Dioxide (CO2) Capture and Storage Technology, Volume 1 - Carbon Dioxide (CO2) Capture, Transport and Industrial Applications, Woodhead Publishing, Cambridge, UK, 2010 Search PubMed.
- S. A. Rackley, Carbon Capture and Storage, Elsevier, Burlington, USA, 2010 Search PubMed.
- B. Zhao and Y. Su, Process effect of microalgal-carbon dioxide fixation and biomass production: A review, Renewable Sustainable Energy Rev., 2014, 31, 121–132 CrossRef CAS PubMed.
- H. S. Kheshgi, H. Thomann, N. A. Bhore, R. B. Hirsch, M. E. Parker and G. F. Teletzke, Perspectives on CCS cost and economics, SPE Economics and Management, 2012, 4(1), 24–31 CrossRef PubMed.
- M. Renner, Carbon prices and CCS investment: A comparative study between the European Union and China, Energy Policy, 2014, 75, 327–340 CrossRef PubMed.
- CSIRO, Assessing Post-Combustion Capture for Coal-fired Power Stations in Asia-Pacific Partnership Countries, EP116217, CSIRO Advanced Coal Technology, Newcastle, NW, USA, 2012 Search PubMed.
- A. B. Rao and E. S. Rubin, A Technical, Economic and Environmental Assessment of Amine-Based CO2 Capture Technology for Power Plant Greenhouse Gas Control, Environ. Sci. Technol., 2002, 36(20), 4467–4475 CrossRef CAS.
- R. R. Bottoms, Process for separating acidic gases, U.S. Pat., 1783901, 1930, available online at: http://bit.ly/1GIWnoS, accessed 30/05/2015 Search PubMed.
- L. Kohl and R. B. Nielsen, Gas purification, 5th edn, Gulf Publishing Company, Huston, Texas, USA, 1997 Search PubMed.
- L. E. Öi, CO2 removal by absorption: Challenges in modelling, Math. Comp. Model. Dyn., 2010, 16(6), 511–533 CrossRef PubMed.
- J. C. M. Pires, F. G. Martins, M. C. M. Alvim-Ferraz and M. Simões, Recent developments on carbon capture and storage: an overview, Chem. Eng. Res. Des., 2011, 89(9), 1446–1460 CrossRef CAS PubMed.
- E. S. Rubin, H. Mantripragada, A. Marks, P. Versteeg and J. Kitchin, The outlook for improved carbon capture technology, Prog. Energy Combust. Sci., 2012, 38(5), 630–671 CrossRef CAS PubMed.
- P. Folger, Carbon Capture: A Technology Assessment, R41325, Congressional Research Service, 2013available online at: http://bit.ly/1esPfhA, accessed 30/05/2015 Search PubMed.
- D. P. Hanak, C. Biliyok, H. Yeung and R. Białecki, Heat integration and exergy analysis for a high ash supercritical coal-fired power plant integrated with a post-combustion carbon capture process, Fuel, 2014, 134, 126–139 CrossRef CAS PubMed.
- H. M. Kvamsdal, M. C. Romano, L. van der Ham, D. Bonalumi, P. van Os and E. Goetheer, Energetic evaluation of a power plant integrated with a piperazine-based CO2 capture process, Int. J. Greenhouse Gas Control, 2014, 28(1), 343–355 CrossRef CAS PubMed.
- D. H. Van Wagener, U. Liebenthal, J. M. Plaza, A. Kather and G. T. Rochelle, Maximizing coal-fired power plant efficiency with integration of amine-based CO2 capture in greenfield and retrofit scenarios, Energy, 2014, 72, 824–831 CrossRef CAS PubMed.
- R. Strube and G. Manfrida, CO2 capture in coal-fired power plants - impact on plant performance, Int. J. Greenhouse Gas Control, 2011, 5(4), 710–726 CrossRef CAS PubMed.
- R. Shao and A. Stangeland, Amines Used in CO2 Capture - Health and Environmental Impacts, The Bellona Foundation, 2009, available at: http://bit.ly/1fpznvO, accessed 30/05/2015 Search PubMed.
- B. Thitakamol, A. Veawab and A. Aroonwilas, Environmental impacts of absorption-based CO2 capture unit for post-combustion treatment of flue gas from coal-fired power plant, Int. J. Greenhouse Gas Control, 2007, 1(3), 318–342 CrossRef CAS.
- K. Veltman, B. Singh and E. G. Hertwich, Human and Environmental Impact Assessment of Postcombustion CO2 Capture Focusing on Emissions from Amine-Based Scrubbing Solvents to Air, Environ. Sci. Technol., 2010, 44(4), 1496–1502 CrossRef CAS PubMed.
- H. Bai and A. C. Yeh, Removal of CO2 Greenhouse Gas by Ammonia Scrubbing, Ind. Eng. Chem. Res., 1997, 36(6), 2490–2493 CrossRef CAS.
- T. Brown, C. C. Perry and B. Manthey, Pleasant Prairie carbon capture demonstration project, Progress report, Alstom, Wisconsin, 2009 Search PubMed.
- V. Telikapalli, F. Kozak, J. Francois, B. Sherrick, J. Black, D. Muraskin, M. Cage, M. Hammond and G. Spitznogle, CCS with the Alstom chilled ammonia process development program–Field pilot results, Energy Procedia, 2011, 4, 273–281 CrossRef PubMed.
- H. Yu, S. Morgan, A. Allport, A. Cottrell, T. Do, J. McGregor, L. Wardhaugh and P. Feron, Results from trialling aqueous NH3 based post-combustion capture in a pilot plant at Munmorah power station: Absorption, Chem. Eng. Res. Des., 2011, 89(8), 1204–1215 CrossRef CAS PubMed.
- J. P. Ciferno, P. DiPietro and T. Tarka, An economic scoping study for CO2 capture using aqueous ammonia, National Energy Technology Laboratory, Advanced Resources International, Energetics Incorporated, 2005 Search PubMed.
- E. Gal, Chilled-ammonia Post Combustion CO2 Capture System–Laboratory and Economic Evaluation Results, 1012797, EPRI, Palo Alto, CA, USA, 2006 Search PubMed.
- L. M. Romeo, S. Espatolero and I. Bolea, Designing a supercritical steam cycle to integrate the energy requirements of CO2 amine scrubbing, Int. J. Greenhouse Gas Control, 2008, 2(4), 563–570 CrossRef CAS PubMed.
- M. Wang, A. Lawal, P. Stephenson, J. Sidders and C. Ramshaw, Post-combustion CO2 capture with chemical absorption: A state-of-the-art review, Chem. Eng. Res. Des., 2011, 89(9), 1609–1624 CrossRef CAS PubMed.
- K. P. Resnik, J. T. Yeh and H. W. Pennline, Aqua ammonia process for simultaneous removal of CO2, SO2 and NOx, Int. J. Environ. Technol. Manage., 2004, 4(1–2), 89–104 CrossRef CAS.
- F. Shakerian, K. Kim, J. E. Szulejko and J. Park, A comparative review between amines and ammonia as sorptive media for post-combustion CO2 capture, Appl. Energy, 2015, 148, 10–22 CrossRef CAS PubMed.
- B. Zhao, Y. Su, W. Tao, L. i. Li and Y. Peng, Post-combustion CO2 capture by aqueous ammonia: A state-of-the-art review, Int. J. Greenhouse Gas Control, 2012, 9, 355–371 CrossRef CAS PubMed.
- M. Zhao, A. I. Minett and A. T. Harris, A review of techno-economic models for the retrofitting of conventional pulverised-coal power plants for post-combustion capture (PCC) of CO2, Energy Environ. Sci., 2013, 6(1), 25–40 CAS.
- B. Sutton, Statement from Peabody Energy on the Department Of Energy’s decision to suspend FutureGen, Peabody Energy, 2015, available online at http://bit.ly/1LsNh3d, 18/03/2015 Search PubMed.
- C. Marshall and M. Quiñones, Clean Coal Power Plant Killed, Again, Sci. Am., 2015, available online at: http://bit.ly/1DAqa2i, 18/03/2015 Search PubMed.
- R. Soundararajan and T. Gundersen, Coal based power plants using oxy-combustion for CO2 capture: Pressurized coal combustion to reduce capture penalty, Appl. Therm. Eng., 2013, 61(1), 115–122 CrossRef CAS PubMed.
- R. Soundararajan, T. Gundersen and M. Ditaranto, Oxy-combustion coal based power plants: Study of operating pressure, oxygen purity and downstream purification parameters, Italian Association of Chemical Engineering – AIDIC, 2014 Search PubMed.
- I. Martínez, R. Murillo, G. Grasa and J. Carlos Abanades, Integration of a Ca looping system for CO2 capture in existing power plants, AIChE J., 2011, 57(9), 2599–2607 CrossRef PubMed.
- M. C. Romano, Modeling the carbonator of a Ca-looping process for CO2 capture from power plant flue gas, Chem. Eng. Sci., 2012, 69(1), 257–269 CrossRef CAS PubMed.
- N. Markusson, The politics of FGD deployment in the UK (1980s-2009), Case study for the project CCS: Realising the potential, University of Edinburgh, Edinburgh, Scotland, 2012 Search PubMed.
- L. M. Romeo, J. C. Abanades, J. M. Escosa, J. Paño, A. Giménez, A. Sánchez-Biezma and J. C. Ballesteros, Oxyfuel carbonation–calcination cycle for low cost CO2 capture in existing power plants, Energy Convers. Manage., 2008, 49(10), 2809–2814 CrossRef CAS PubMed.
- J. C. Abanades, G. Grasa, M. Alonso, N. Rodriguez, E. J. Anthony and L. M. Romeo, Cost structure of a postcombustion CO2 capture system using CaO, Environ. Sci. Technol., 2007, 41(15), 5523–5527 CrossRef CAS.
- C. C. Cormos, Economic evaluations of coal-based combustion and gasification power plants with post-combustion CO2 capture using calcium looping cycle, Energy, 2014, 78, 665–673 CrossRef CAS PubMed.
- C. C. Cormos, Assessment of chemical absorption/adsorption for post-combustion CO2 capture from Natural Gas Combined Cycle (NGCC) power plants, Appl. Therm. Eng., 2015, 82, 120–128 CrossRef CAS PubMed.
- C. Huang, H. Hsu, W. Liu, J. Cheng, W. Chen, T. Wen and W. Chen, Development of post-combustion CO2 capture with CaO/CaCO3 looping in a bench scale plant, Energy Procedia, 2011, 4, 1268–1275 CrossRef CAS PubMed.
- M. H. Chang, C. M. Huang, W. H. Liu, W. C. Chen, J. Y. Cheng, W. Chen, T. W. Wen, S. Ouyang, C. H. Shen and H. W. Hsu, Design and Experimental Investigation of Calcium Looping Process for 3-kWth and 1.9-MWth Facilities, Chem. Eng. Technol., 2013, 36(9), 1525–1532 CrossRef CAS PubMed.
- X. CCSA, Taiwan inaugurates advanced carbon capture plant, CCSA Weekly Newsletter, 2013, 212(2), 4 Search PubMed.
- N. Rodríguez, M. Alonso and J. C. Abanades, Experimental investigation of a circulating fluidized-bed reactor to capture CO2 with CaO, AIChE J., 2011, 57(5), 1356–1366 CrossRef PubMed.
- M. Alonso, N. Rodríguez, B. González, G. Grasa, R. Murillo and J. C. Abanades, Carbon dioxide capture from combustion flue gases with a calcium oxide chemical loop. Experimental results and process development, Int. J. Greenhouse Gas Control, 2010, 4(2), 167–173 CrossRef CAS PubMed.
- A. Sánchez-Biezma, J. C. Ballesteros, L. Diaz, E. de Zárraga, F. J. Álvarez, J. López, B. Arias, G. Grasa and J. C. Abanades, Postcombustion CO2 capture with CaO. Status of the technology and next steps towards large scale demonstration, Energy Procedia, 2011, 4, 852–859 CrossRef PubMed.
- B. Arias, M. E. Diego, J. C. Abanades, M. Lorenzo, L. Diaz, D. Martínez, J. Alvarez and A. Sánchez-Biezma, Demonstration of steady state CO2 capture in a 1.7MWth calcium looping pilot, Int. J. Greenhouse Gas Control, 2013, 18, 237–245 CrossRef CAS PubMed.
- A. Sánchez-Biezma, J. Paniagua, L. Diaz, M. Lorenzo, J. Alvarez, D. Martínez, B. Arias, M. E. Diego and J. C. Abanades, Testing postcombustion CO2 capture with CaO in a 1.7 MWt pilot facility, Energy Procedia, 2013, 37, 1–8 CrossRef PubMed.
- J. Ströhle, M. Junk, J. Kremer, A. Galloy and B. Epple, Carbonate looping experiments in a 1 MWth pilot plant and model validation, Fuel, 2014, 127, 13–22 CrossRef PubMed.
- L. Bates, Screw conveyors, in Bulk solids handling: equipment selection and operation, ed. D. McGlinchey, Blackwell Publishing Ltd, UK, 2008, 1st edn, pp. 197–220 Search PubMed.
- N. Rodríguez, M. Alonso, J. C. Abanades, A. Charitos, C. Hawthorne, G. Scheffknecht, D. Y. Lu and E. J. Anthony, Comparison of experimental results from three dual fluidized bed test facilities capturing CO2 with CaO, Energy Procedia, 2011, 4, 393–401 CrossRef PubMed.
- A. Charitos, C. Hawthorne, A. R. Bidwe, L. Korovesis, A. Schuster and G. Scheffknecht, Hydrodynamic analysis of a 10 kWth Calcium Looping Dual Fluidized Bed for post-combustion CO2 capture, Powder Technol., 2010, 200(3), 117–127 CrossRef CAS PubMed.
- H. Dieter, A. R. Bidwe, G. Varela-Duelli, A. Charitos, C. Hawthorne and G. Scheffknecht, Development of the calcium looping CO2 capture technology from lab to pilot scale at IFK, University of Stuttgart, Fuel, 2014, 127, 23–37 CrossRef CAS PubMed.
- A. Charitos, C. Hawthorne, A. R. Bidwe, S. Sivalingam, A. Schuster, H. Spliethoff and G. Scheffknecht, Parametric investigation of the calcium looping process for CO2 capture in a 10 kWth dual fluidized bed, Int. J. Greenhouse Gas Control, 2010, 4(5), 776–784 CrossRef CAS PubMed.
- H. Dieter, C. Hawthorne, M. Zieba and G. Scheffknecht, Progress in Calcium Looping Post Combustion CO2 Capture: Successful Pilot Scale Demonstration, Energy Procedia, 2013, 37, 48–56 CrossRef CAS PubMed.
- C. Hawthorne, H. Dieter, A. Bidwe, A. Schuster, G. Scheffknecht, S. Unterberger and M. Käβ, CO2 capture with CaO in a 200 kWth dual fluidized bed pilot plant, Energy Procedia, 2011, 4, 441–448 CrossRef CAS PubMed.
- H. Dieter, Design concepts, operating experiences and experimental results of the 200 kWth calcium-looping pilot plant, 2nd International Workshop on Oxy-FBC Technology, 28-29 June, Stuttgart, 2012, available at: http://bit.ly/1aqVqok, 30/05/2015.
- G. Varela, A. Charitos, M. E. Diego, E. Stavroulakis, H. Dieter and G. Scheffknecht, Investigations at a 10 kWth calcium looping dual fluidized bed facility: Limestone calcination and CO2 capture under high CO2 and water vapor atmosphere, Int. J. Greenhouse Gas Control, 2015, 33, 103–112 CrossRef PubMed.
- A. Ghosh-Dastidar and S. Mahuli, Calcium carbonate sorbent and methods of making and using same, US Pat., 5779464, 1998 Search PubMed.
- S. Mahuli and R. Agnihotri, Suspension carbonation process of reaction of partially utilized sorbent, US Pat., 6309996 B1, 2001 Search PubMed.
- H. Gupta, T. J. Thomas, A. A. Park, M. V. Iyer, P. Gupta, R. Agnihotri, R. A. Jadhav, H. W. Walker, L. K. Weavers, T. Butalia and L. Fan, Pilot-scale demonstration of the OSCAR process for high-temperature multipollutant control of coal combustion flue gas, using carbonated fly ash and mesoporous calcium carbonate, Ind. Eng. Chem. Res., 2007, 46(14), 5051–5060 CrossRef CAS.
- L. Fan, H. Gupta and M. V. Iyer, Separation of carbon dioxide (CO2) from gas mixtures by calcium based reaction reparation (CaRS-CO2) process, US Pat., 0233029, 2008 Search PubMed.
- W. Wang, S. Ramkumar, S. Li, D. Wong, M. Iyer, B. B. Sakadjian, R. M. Statnick and L. Fan, Subpilot demonstration of the carbonation-calcination reaction (CCR) process: High-temperature CO2 and sulfur capture from coal-fired power plants, Ind. Eng. Chem. Res., 2010, 49(11), 5094–5101 CrossRef CAS.
- R. T. Symonds, D. Y. Lu, R. W. Hughes, E. J. Anthony and A. Macchi, CO2 capture from simulated syngas via cyclic carbonation–calcination for a naturally occurring limestone: Pilot-plant testing, Ind. Eng. Chem. Res., 2009, 48(18), 8431–8440 CrossRef CAS.
- A. Cotton, K. N. Finney, K. Patchigolla, R. E. A. Eatwell-Hall, J. E. Oakey, J. Swithenbank and V. Sharifi, Quantification of trace element emissions from low-carbon emission energy sources: (I) Ca-looping cycle for post-combustion CO2 capture and (II) fixed bed, air blown down-draft gasifier, Chem. Eng. Sci., 2014, 107, 13–29 CrossRef CAS PubMed.
- A. M. Cotton, Engineering scale-up and environmental effects of the calcium looping cycle for post-combustion CO2 capture, PhD thesis, Cranfield University, Cranfield, UK, 2013 Search PubMed.
- M. Kavosh, Process engineering and development of post-combustion CO2 separation from fuels using limestone in CaO-looping cycle, PhD thesis, Cranfield University, Cranfield, 2011 Search PubMed.
- D. Geldart, Types of gas fluidization, Powder Technol., 1973, 7(5), 285–292 CrossRef CAS.
- F. Fang, Z. S. Li and N. S. Cai, Continuous CO2 capture from flue gases using a dual fluidized bed reactor with calcium-based sorbent, Ind. Eng. Chem. Res., 2009, 48(24), 11140–11147 CrossRef CAS.
- I. Aigner, C. Pfeifer and H. Hofbauer, Co-gasification of coal and wood in a dual fluidized bed gasifier, Fuel, 2011, 90(7), 2404–2412 CrossRef CAS PubMed.
- C. Pfeifer, J.C. Schmid, T. Pröll and H. Hofbauer, Next generation biomass gasifier, Proceedings of the 19th European Biomass Conference and Exhibition, June 6-10 2010, Berlin, Germany, 2010.
- M. Broda, V. Manovic, Q. Imtiaz, A. M. Kierzkowska, E. J. Anthony and C. R. Müller, High-purity hydrogen via the sorption-enhanced steam methane reforming reaction over a synthetic CaO-based sorbent and a Ni catalyst, Environ. Sci. Technol., 2013, 47(11), 6007–6014 CrossRef CAS PubMed.
- J. R. Hufton, S. Mayorga and S. Sircar, Sorption-enhanced reaction process for hydrogen production, AIChE J., 1999, 45(2), 248–256 CrossRef CAS PubMed.
- S. Rawadieh and V. G. Gomes, Steam reforming for hydrogen generation with in situ adsorptive separation, Int. J. Hydrogen Energy, 2009, 34(1), 343–355 CrossRef CAS PubMed.
- H. Hofbauer, R. Rauch, K. Bosch, R. Koch and C. Aichernig, Biomass CHP Plant Güssing – A Success Story, in Pyrolysis and Gasification of Biomass and Waste, ed. A. V. Bridgwater, CPL Press, Newsbury, UK, 2003, pp. 371–383 Search PubMed.
- S. Koppatz, C. Pfeifer, R. Rauch, H. Hofbauer, T. Marquard-Moellenstedt and M. Specht, H2 rich product gas by steam gasification of biomass with in situ CO2 absorption in a dual fluidized bed system of 8 MW fuel input, Fuel Process. Technol., 2009, 90(7–8), 914–921 CrossRef CAS PubMed.
- F. Kirnbauer, V. Wilk and H. Hofbauer, Performance improvement of dual fluidized bed gasifiers by temperature reduction: The behavior of tar species in the product gas, Fuel, 2013, 108, 534–542 CrossRef CAS PubMed.
- M. C. Romano and G. G. Lozza, Long-term coal gasification-based power with near-zero emissions. Part B: Zecomag and oxy-fuel IGCC cycles, Int. J. Greenhouse Gas Control, 2010, 4(3), 469–477 CrossRef CAS PubMed.
- C. C. Cormos and A. M. Cormos, Assessment of calcium-based chemical looping options for gasification power plants, Int. J. Hydrogen Energy, 2013, 38(5), 2306–2317 CrossRef CAS PubMed.
- D. P. Connell, D. A. Lewandowski, S. Ramkumar, N. Phalak, R. M. Statnick and L. Fan, Process simulation and economic analysis of the Calcium Looping Process (CLP) for hydrogen and electricity production from coal and natural gas, Fuel, 2013, 105, 383–396 CrossRef CAS PubMed.
- D. Wang, S. Chen, C. Xu and W. Xiang, Energy and exergy analysis of a new hydrogen-fueled power plant based on calcium looping process, Int. J. Hydrogen Energy, 2013, 38(13), 5389–5400 CrossRef CAS PubMed.
- C. Kunze, S. De and H. Spliethoff, A novel IGCC plant with membrane oxygen separation and carbon capture by carbonation-calcinations loop, Int. J. Greenhouse Gas Control, 2011, 5(5), 1176–1183 CrossRef CAS PubMed.
- I. Vorrias, K. Atsonios, A. Nikolopoulos, N. Nikolopoulos, P. Grammelis and E. Kakaras, Calcium looping for CO2 capture from a lignite fired power plant, Fuel, 2013, 113, 826–836 CrossRef CAS PubMed.
- A. Martínez, Y. Lara, P. Lisbona and L. M. Romeo, Energy penalty reduction in the calcium looping cycle, Int. J. Greenhouse Gas Control, 2012, 7, 74–81 CrossRef PubMed.
- I. Martínez, G. Grasa, R. Murillo, B. Arias and J. C. Abanades, Modelling the continuous calcination of CaCO3 in a Ca-looping system, Chem. Eng. J., 2013, 215–216, 174–181 CrossRef PubMed.
- F. Fang, Z. Li and N. Cai, Experiment and modeling of CO2 capture from flue gases at high temperature in a fluidized bed reactor with Ca-based sorbents, Energy Fuels, 2009, 23(1), 207–216 CrossRef CAS.
- C. J. Abanades, E. J. Anthony, D. Y. Lu, C. Salvador and D. Alvarez, Capture of CO2 from combustion gases in a fluidized bed of CaO, Environmental and Energy Engineering, 2004, 50(7), 1614–1622 Search PubMed.
- B. Arias, G. S. Grasa and J. C. Abanades, Effect of sorbent hydration on the average activity of CaO in a Ca-looping system, Chem. Eng. J., 2010, 163(3), 324–330 CrossRef CAS PubMed.
- P. Lisbona, A. Martínez, Y. Lara and L. M. Romeo, Integration of carbonate CO2 capture cycle and coal-fired power plants. A comparative study for different sorbents, Energy Fuels, 2010, 24(1), 728–736 CrossRef CAS.
- Z. Li, N. Cai and E. Croiset, Process analysis of CO2 capture from flue gas using carbonation–calcination cycles, AIChE J., 2008, 54(7), 1912–1925 CrossRef CAS PubMed.
- J. M. Valverde, P. E. Sanchez-Jimenez and L. A. Perez-Maqueda, Ca-looping for postcombustion CO2 capture: a comparative analysis on the performances of dolomite and limestone, Appl. Energy, 2015, 138, 202–215 CrossRef CAS PubMed.
- J. Wang and E. J. Anthony, A common decay behavior in cyclic processes, Chem. Eng. Commun., 2007, 194(11), 1409–1420 CrossRef CAS PubMed.
- J. Wang and E. J. Anthony, On the decay behavior of the CO2 absorption capacity of CaO-based sorbents, Ind. Eng. Chem. Res., 2005, 44(3), 627–629 CrossRef CAS.
- G. S. Grasa and J. C. Abanades, CO2 capture capacity of CaO in long series of carbonation–calcination cycles, Ind. Eng. Chem. Res., 2006, 45(26), 8846–8851 CrossRef CAS.
- A. I. Lysikov, A. N. Salanov and A. G. Okunev, Change of CO2 carrying capacity of CaO in isothermal recarbonation-decomposition cycles, Ind. Eng. Chem. Res., 2007, 46(13), 4633–4638 CrossRef CAS.
- J. C. Abanades, The maximum capture efficiency of CO2 using a carbonation–calcination cycle of CaO/CaCO3, Chem. Eng. J., 2002, 90(3), 303–306 CrossRef CAS.
- D. Berstad, R. Anantharaman and K. Jordal, Post-combustion CO2 capture from a natural gas combined cycle by CaO/CaCO3 looping, Int. J. Greenhouse Gas Control, 2012, 11, 25–33 CrossRef CAS PubMed.
- J. Ströhle, A. Lasheras, A. Galloy and B. Epple, Simulation of the carbonate looping process for post-combustion CO2 capture from a coal-fired power plant, Chem. Eng. Technol., 2009, 32(3), 435–442 CrossRef PubMed.
- I. Martínez, R. Murillo, G. Grasa, N. Rodríguez and J. C. Abanades, Conceptual design of a three fluidised beds combustion system capturing CO2 with CaO, Int. J. Greenhouse Gas Control, 2011, 5(3), 498–504 CrossRef PubMed.
- A. Charitos, N. Rodríguez, C. Hawthorne, M. Alonso, M. Zieba, B. Arias, G. Kopanakis, G. Scheffknecht and J. C. Abanades, Experimental Validation of the Calcium Looping CO2 Capture Process with Two Circulating Fluidized Bed Carbonator Reactors, Ind. Eng. Chem. Res., 2011, 50(16), 9685–9695 CrossRef CAS.
- J. Ylätalo, J. Parkkinen, J. Ritvanen, T. Tynjälä and T. Hyppänen, Modeling of the oxy-combustion calciner in the post-combustion calcium looping process, Fuel, 2013, 113, 770–779 CrossRef PubMed.
- R. H. Borgwardt, Sintering of nascent calcium oxide, Chem. Eng. Sci., 1989, 44(1), 53–60 CrossRef CAS.
- P. Sun, J. R. Grace, C. J. Lim and E. J. Anthony, Removal of CO2 by calcium-based sorbents in the presence of SO2, Energy Fuels, 2007, 21(1), 163–170 CrossRef CAS.
- G. S. Grasa, M. Alonso and J. C. Abanades, Sulfation of CaO particles in a carbonation–calcination loop to capture CO2, Ind. Eng. Chem. Res., 2008, 47(5), 1630–1635 CrossRef CAS.
- E. J. Anthony and D. L. Granatstein, Sulfation phenomena in fluidized bed combustion systems, Prog. Energy Combust. Sci., 2001, 27(2), 215–236 CrossRef CAS.
- A. Lyngfelt and B. Leckner, Sulphur capture in fluidized bed boilers: The effect of reductive decomposition of CaSO4, Chem. Eng. J., 1989, 40(2), 59–69 CrossRef CAS.
- R. Baker, The reversibility of the reaction CaCO3 ← CaO + CO2, J. Appl. Chem. Biotechnol., 1973, 23(10), 733–742 Search PubMed.
- C. Salvador, D. Lu, E. J. Anthony and J. C. Abanades, Enhancement of CaO for CO2 capture in an FBC environment, Chem. Eng. J., 2003, 96(1–3), 187–195 CrossRef CAS PubMed.
- G. P. Curran, C. E. Fink and E. Gorin, Carbon dioxide-acceptor gasification process: studies of acceptor properties, Advanced Chemistry Services, 1967, 69, 141–165 CAS.
- A. Silaban, M. Narcida and D. P. Harrison, Characteristics of the reversible reaction between CO2(g) and calcined dolomite, Chem. Eng. Commun., 1996, 146(1), 149–162 CrossRef CAS PubMed.
- M. Aihara, T. Nagai, J. Matsushita, Y. Negishi and H. Ohya, Development of porous solid reactant for thermal-energy storage and temperature upgrade using carbonation/decarbonation reaction, Appl. Energy, 2001, 69(3), 225–238 CrossRef CAS.
- V. Manovic, E. J. Anthony, G. Grasa and J. C. Abanades, CO2 looping cycle performance of a high-purity limestone after thermal activation/doping, Energy Fuels, 2008, 22(5), 3258–3264 CrossRef CAS.
- H. C. Mantripragada and E. S. Rubin, Calcium looping cycle for CO2 capture - Performance, cost and feasibility analysis, Energy Procedia, 2013, 63, 2199–2206 CrossRef PubMed.
- V. Manovic and E. J. Anthony, Steam reactivation of spent CaO-based sorbent for multiple CO2 capture cycles, Environ. Sci. Technol., 2007, 41(4), 1420–1425 CrossRef CAS.
- P. S. Fennell, J. F. Davidson, J. S. Dennis and A. N. Hayhurst, Regeneration of sintered limestone sorbents for the sequestration of CO2 from combustion and other systems, J. Energy Inst., 2007, 80(2), 116–119 CrossRef CAS PubMed.
- R. W. Hughes, D. Lu, E. J. Anthony and Y. Wu, Improved long-term conversion of limestone-derived sorbents for in situ capture of CO2 in a fluidized bed combustor, Ind. Eng. Chem. Res., 2004, 43(18), 5529–5539 CrossRef CAS.
- G. Grasa, R. Murillo, M. Alonso, B. González, N. Rodríguez and J.C. Abanades, Steam reactivation of CaO-based natural sorbents applied to a carbonation–calcination loop for CO2 capture, 4th International Conference on Clean Coal Technologies, Dresden, Germany, 2009. Cited in CrossRef CAS PubMed; B. Arias, G. S. Grasa and J. C. Abanades, Effect of sorbent hydration on the average activity of CaO in a Ca-looping system, Chem. Eng. J., 2010, 163, 324–330 CrossRef CAS PubMed.
- J. Blamey, V. Manovic, E. J. Anthony, D. R. Dugwell and P. S. Fennell, On steam hydration of CaO-based sorbent cycled for CO2 capture, Fuel, 2015, 150, 269–277 CrossRef CAS PubMed.
- D. K. Lee, An apparent kinetic model for the carbonation of calcium oxide by carbon dioxide, Chem. Eng. J., 2004, 100(1–3), 71–77 CrossRef CAS PubMed.
- S. Bhatia and D. Perlmutter, Effect of the product layer on the kinetics of the CO2-lime reaction, AIChE J., 1983, 29(1), 79–86 CrossRef CAS PubMed.
- G. Gupta and L. S. Fan, Carbonation-calcination cycle using high reactivity calcium oxide for carbon dioxide separation from flue gas, Ind. Eng. Chem. Res., 2002, 41, 4035–4042 CrossRef.
- G. S. Grasa, J. C. Abanades, M. Alonso and B. González, Reactivity of highly cycled particles of CaO in a carbonation–calcination loop, Chem. Eng. J., 2008, 137(3), 561–567 CrossRef CAS PubMed.
- Y. S. Yu, W. Q. Liu, H. An, F. S. Yang, G. X. Wang, B. Feng, Z. X. Zhang and V. Rudolph, Modeling of the carbonation behavior of a calcium based sorbent for CO2 capture, Int. J. Greenhouse Gas Control, 2012, 10, 510–519 CrossRef CAS PubMed.
- S. K. Mahuli, R. Agnihotri, R. Jadhav, S. Chauk and L. Fan, Combined calcination, sintering and sulfation model for CaCO3-SO2 reaction, AIChE J., 1999, 45(2), 367–381 CrossRef CAS PubMed.
- P. Sun, J. R. Grace, C. J. Lim and E. J. Anthony, Determination of intrinsic rate constants of the CaO-CO2 reaction, Chem. Eng. Sci., 2008, 63(1), 47–56 CrossRef CAS PubMed.
- R. H. Borgwardt, Calcination kinetics and surface area of dispersed limestone particles, AIChE J., 1985, 31(1), 103–111 CrossRef CAS PubMed.
- F. García-Labiano, A. Abad, L. F. de Diego, P. Gayán and J. Adánez, Calcination of calcium-based sorbents at pressure in a broad range of CO2 concentrations, Chem. Eng. Sci., 2002, 57(13), 2381–2393 CrossRef.
- J. S. Dennis and A. N. Hayhurst, The effect of CO2 on the kinetics and extent of calcination of limestone and dolomite particles in fluidised beds, Chem. Eng. Sci., 1987, 42(10), 2361–2372 CrossRef CAS.
- D. Kunii and O. Levenspiel, Fluidization engineering, Butterworth-Heinemann, Stoneham, MA, USA, 2nd edn, 1991 Search PubMed.
- D. Kunii and O. Levenspiel, Fluidized reactor models. 1. For bubbling beds of fine, intermediate and large particles. 2. For the lean phase. Freeboard and fast fluidization, Ind. Eng. Chem. Res., 1990, 29(7), 1226–1234 CrossRef CAS.
- E. Turnbull and J. F. Davidson, Fluidized combustion of char and volatiles from coal, AIChE J., 1984, 30(6), 881–889 CrossRef CAS PubMed.
- Z. Li and N. Cai, Modeling of multiple cycles for sorption-enhanced steam methane reforming and sorbent regeneration in fixed bed reactor, Energy Fuels, 2007, 21(5), 2909–2918 CrossRef CAS.
- D. Kunii and O. Levenspiel, Circulating fluidized-bed reactors, Chem. Eng. Sci., 1997, 52(15), 2471–2482 CrossRef CAS.
- D. Kunii and O. Levenspiel, The K-L reactor model for circulating fluidized beds, Chem. Eng. Sci., 2000, 55(20), 4563–4570 CrossRef CAS.
- I. Martínez, G. Grasa, R. Murillo, B. Arias and J. C. Abanades, Kinetics of calcination of partially carbonated particles in a Ca-looping system for CO2 capture, Energy Fuels, 2012, 26(2), 1432–1440 CrossRef.
- K. Myöhänen and T. Hyppänen, A three-dimensional model frame for modelling combustion and gasification in circulating fluidized bed furnaces, Int. J. Chem. React. Eng., 2011, 9, A25 Search PubMed.
- G. D. Silcox, J. C. Kramlich and D. W. Pershing, Mathematical model for the flash calcination of dispersed CaCO3 and Ca(OH)2 particles, Ind. Eng. Chem. Res., 1989, 28(2), 155–160 CrossRef CAS.
- Thermochemical data of pure substances, VCH Verlagsgesellshaft mbH, ed. I. Barin, Federal Republic of Germany, Weumheim, 1989 Search PubMed.
- K. Atsonios, M. Zeneli, A. Nikolopoulos, N. Nikolopoulos, P. Grammelis and E. Kakaras, Calcium looping process simulation based on an advanced thermodynamic model combined with CFD analysis, Fuel, 2015, 153, 371–381 Search PubMed.
- J. Ylätalo, J. Ritvanen, B. Arias, T. Tynjälä and T. Hyppänen, 1-Dimensional modelling and simulation of the calcium looping process, Int. J. Greenhouse Gas Control, 2012, 9, 130–135 CrossRef PubMed.
- P. S. Fennell, R. Pacciani, J. S. Dennis, J. F. Davidson and A. N. Hayhurst, The effects of repeated cycles of calcination and carbonation on a variety of different limestones, as measured in a hot fluidized bed of sand, Energy Fuels, 2007, 21(4), 2072–2081 CrossRef CAS.
- O. Senneca, M. Urciuolo and R. Chirone, A semidetailed model of primary fragmentation of coal, Fuel, 2013, 104, 253–261 CrossRef CAS PubMed.
- J. R. Gibbins and R. I. Crane, Scope for reductions in the cost of CO2 capture using flue gas scrubbing with amine solvents, Proc. Inst. Mech. Eng., Part A, 2004, 218(4), 231–239 CrossRef.
- R. Khalilpour and A. Abbas, HEN optimization for efficient retrofitting of coal-fired power plants with post-combustion carbon capture, Int. J. Greenhouse Gas Control, 2011, 5(2), 189–199 CrossRef CAS PubMed.
- S. Kishimoto, T. Hirata, M. Iijima, T. Ohishi, K. Higaki and R. Mitchell, Current status of MHI’s CO2 recovery technology and optimization of CO2 recovery plant with a PC fired power plant, Energy Procedia, 2009, 1(1), 1091–1098 CrossRef CAS PubMed.
- Y. A. Cengel and M. A. Boles, Thermodynamics: an engineering approach, McGraw-Hill, New York, NY, USA, 6th in SI units edn, 2007 Search PubMed.
- G. Grasa, R. Murillo, M. Alonso and J. C. Abanades, Application of the random pore model to the carbonation cyclic reaction, AIChE J., 2009, 55(5), 1246–1255 CrossRef CAS PubMed.
- T. Joutsenoja, P. Heino, R. Hernberg and B. Bonn, Pyrometric temperature and size measurements of burning coal particles in a fluidized bed combustion reactor, Combust. Flame, 1999, 118(4), 707–717 CrossRef CAS.
- V. Manovic, M. Komatina and S. Oka, Modeling the temperature in coal char particle during fluidized bed combustion, Fuel, 2008, 87(6), 905–914 CrossRef CAS PubMed.
- R. T. Symonds, D. Y. Lu, V. Manovic and E. J. Anthony, Pilot-scale study of CO2 capture by CaO-based sorbents in the presence of steam and SO2, Ind. Eng. Chem. Res., 2012, 51(21), 7177–7184 CrossRef CAS.
- Y. Lara, P. Lisbona, A. Martínez and L. M. Romeo, A systematic approach for high temperature looping cycles integration, Fuel, 2014, 127, 4–12 CrossRef CAS PubMed.
- Y. Lara, P. Lisbona, A. Martínez and L. M. Romeo, Design and analysis of heat exchanger networks for integrated Ca-looping systems, Appl. Energy, 2013, 111, 690–700 CrossRef CAS PubMed.
- ECN, ECN Phyllis classification, 2012, available at: http://bit.ly/1hrh1cu, accessed 30/05/2015.
- B. Arias, J. C. Abanades and G. S. Grasa, An analysis of the effect of carbonation conditions on CaO deactivation curves, Chem. Eng. J., 2011, 167(1), 255–261 CrossRef CAS PubMed.
- A. Martínez, Y. Lara, P. Lisbona and L. M. Romeo, Operation of a cyclonic preheater in the ca-looping for CO2 capture, Environ. Sci. Technol., 2013, 47(19), 11335–11341 CrossRef PubMed.
- C. Biliyok and H. Yeung, Evaluation of natural gas combined cycle power plant for post-combustion CO2 capture integration, Int. J. Greenhouse Gas Control, 2013, 19, 396–405 CrossRef CAS PubMed.
- B. G. Miller, Clean Coal Engineering Technology, Butterworth-Heinemann, Boston, USA, 2011 Search PubMed.
- IEA, CO2 Emissions from Fuel Combustion - Highlights, OECD/IEA, Paris, France, 2012 edn, 2012 Search PubMed.
- P. Versteeg and E. S. Rubin, A technical and economic assessment of ammonia-based post-combustion CO2 capture at coal-fired power plants, Int. J. Greenhouse Gas Control, 2011, 5(6), 1596–1605 CrossRef CAS PubMed.
- J. Black, Cost and Performance Baseline for Fossil Energy Plants Volume 1: Bituminous Coal and Natural Gas to Electricity, DOE/2010/1397 Revision 2a, National Energy Technology Laboratory, 2013 Search PubMed.
- M. C. Romano and G. G. Lozza, Long-term coal gasification-based power plants with near-zero emissions. Part A: Zecomix cycle, Int. J. Greenhouse Gas Control, 2010, 4(3), 459–468 CrossRef CAS PubMed.
- IEA, Technology Roadmap: High-Efficiency, Low-Emissions Coal-Fired Power Generation, OECD/IEA, Paris, France, 2012 Search PubMed.
- R. Anantharaman, O. Bolland, N. Booth, E. van Dorst, C. Ekstrom, E. Sanchez Fernandes, F. Franco, E. Macchi, G. Manzolini, D. Nikolic, A. Pfeffer, M. Prins, S. Rezvani and L. Robinson, CArbon-free Electricity by SEWGS: Advanced materials, Reactor- and process design. D 4.9 European best practice guidelines for assessment of CO2 capture technologies, 213206 FP7 - ENERGY.2007.5.1.1, Politecnico di Milano, Alstom UK, 2011 Search PubMed.
- O. Bollard, N. Booth, F. Franco, E. Macchi, G. Manzolini, R. Naqvi, A. Pfeffer, S. Rezvani and M. Abu Zara, Enabling advanced pre-combustion capture techniques and plants. D 1.4.1 Common Framework Definition Document, 211971 FP7 - ENERGY.2007.5.1.1, Alstom UK, 2009 Search PubMed.
| This journal is © The Royal Society of Chemistry 2015 |

