
 Open Access Article
 This Open Access Article is licensed under a
 Creative Commons Attribution 3.0 Unported Licence
Sub-ns triplet state formation by non-geminate recombination in PSBTBT:PC70BM and PCPDTBT:PC60BM organic solar cells†
Fabian
Etzold
a,
Ian A.
Howard
a,
Nina
Forler
a,
Anton
Melnyk
a,
Denis
Andrienko
a,
Michael Ryan
Hansen‡
 *b and
Frédéric
Laquai‡
*ac
*b and
Frédéric
Laquai‡
*ac
aMax Planck Institute for Polymer Research, Ackermannweg 10, D-55128 Mainz, Germany. E-mail: laquai@mpip-mainz.mpg.de
bInterdisciplinary Nanoscience Center (iNANO) and Department of Chemistry, Gustav Wieds Vej 14, DK-8000 Aarhus C, Denmark. E-mail: mrh@chem.au.dk
cPhysical Sciences and Engineering Division (PSE), Material Science and Engineering (MSE), Solar and Photovoltaics Engineering Research Center (SPERC), King Abdullah University of Science and Technology (KAUST), Thuwal 23955-6900, Kingdom of Saudi Arabia. E-mail: frederic.laquai@kaust.edu.sa
First published on 2nd March 2015
Abstract
The solid-state morphology and photo-generated charge carrier dynamics in low-bandgap polymer:fullerene bulk heterojunction photovoltaic blends using the donor–acceptor type copolymers PCPDTBT or its silicon-substituted analogue PSBTBT as donors are compared by two-dimensional (2D) solid-state nuclear magnetic resonance (NMR) and femto-to microsecond broadband Vis-NIR transient absorption (TA) pump–probe spectroscopy. The 2D solid-state NMR experiments demonstrate that the film morphology of PCPDTBT:PC60BM blends processed with additives such as octanedithiol (ODT) are similar to those of PSBTBT:PC60BM blends in terms of crystallinity, phase segregation, and interfacial contacts. The TA experiments and analysis of the TA data by multivariate curve resolution (MCR) reveal that after exciton dissociation and free charge formation, fast sub-nanosecond non-geminate recombination occurs which leads to a substantial population of the polymer's triplet state. The extent to which triplet states are formed depends on the initial concentration of free charges, which itself is controlled by the microstructure of the blend, especially in case of PCPDTBT:PC60BM. Interestingly, PSBTBT:PC70BM blends show a higher charge generation efficiency, but less triplet state formation at similar free charge carrier concentrations. This indicates that the solid-state morphology and interfacial structures of PSBTBT:PC70BM blends reduces non-geminate recombination, leading to superior device performance compared to optimized PCPDTBT:PC60BM blends.
Broader contextThe growing demand of electrical power paired with the limited abundance of fossil energy sources steadily increases the importance of alternative and sustainable energy sources such as solar power. In this respect a very promising technology is organic photovoltaics, since large area devices can be produced at low costs. While in the first generation of organic photovoltaic materials the absorption was mostly limited to the visible part of the solar spectrum thereby significantly limiting the solar photon harvesting, the development of novel donor–acceptor type materials has recently pushed efficiencies towards 10%. However, many of the novel low-bandgap systems underperform as additional loss channels such as triplet state formation exist. Sophisticated transient spectroscopy studies paired with advanced data analysis methods can help to unravel these loss processes and to develop meaningful structure–property relations for a more guided material design. In fact, a careful control of interfacial and bulk morphology appears to be essential to suppress these undesired loss channels. |
Introduction
The past years have witnessed a steady increase of the power conversion efficiency (PCE) of solution-processed organic solar cells now reaching 9% PCE for single junction photovoltaic devices and even exceeding 10% PCE for tandem solar cells.1 The substantial improvement during the last years was in part a consequence of the development of novel low-bandgap polymers, covering a broader spectral range of the solar photon flux compared to mid-bandgap polymers such as the heavily researched polymer regioregular poly(3-hexylthiophene).2 The alternating donor–acceptor (D–A) copolymers poly[2,6-(4,4-bis-(2-ethylhexyl)-4H-cyclopenta[2,1-b;3,4-b′]-dithiophene)-alt-4,7-(2,1,3-benzothiadiazole)] (PCPDTBT) and poly[(4,4′-bis(2-ethylhexyl)dithieno[3,2-b:2′,3′-d]silole)-2,6-diyl-alt-(2,1,3-benzothiadiazole)-4,7-diyl] (PSBTBT) are prototypes of such low-bandgap polymers with an onset of photocurrent generation beyond 800 nm.3 The chemical structure of the two copolymers is very similar, where the only difference between them is that the bridgehead carbon atom (where the solubilizing side chains are attached) in PCPDTBT is substituted by a silicon atom in PSBTBT.Both polymers have attracted much attention as electron donor material in photovoltaic blends with [6,6]-phenyl C70-butyric acid methyl ester (PC70BM) as acceptor, reaching PCEs around 5%.3b,4 However, the highest PCE for PCPDTBT could only be reached when using high boiling point cosolvents, such as octanedithiol (ODT) or 1,8-diiodooctane (DIO), during film preparation. The cosolvents cause partial demixing of the blend's components and create larger polymer-rich domains with increased order thereby facilitating charge separation, transport, and extraction.5 Interestingly, for PSBTBT:PCBM, a cosolvent is not necessary to achieve optimum device performance as the silicon-substitution has a significant impact on the morphology of the blend, which in fact is similar to the effect of solvent additives on the morphology of PCPDTBT:PCBM blend films. Several previous studies have addressed the origin of the increased performance of PSBTBT:PCBM compared to PCPDTBT:PCBM. Hou et al. reported a three times higher hole mobility in pristine PSBTBT compared to pristine PCPDTBT in organic field effect transistors (OFETs).3b According to Chen et al., the increase in hole mobility is caused by improved π–π stacking due to the larger bond length of the C–Si bond in PSBTBT compared to the C–C bond in PCPDTBT. The greater bond length was shown to reduce steric hindrance from the bulky alkyl sidechains thereby leading to increased semi-crystallinity for PSBTBT compared to the largely amorphous PCPDTBT.6 Similar explanations were put forward by Morana et al., who used X-ray diffraction (XRD) to show improved π–π stacking. The authors further reported a higher charge photogeneration yield for PSBTBT:PCBM blends and correlated this property with a reduction of charge-transfer (CT) state formation and recombination at the interface.7 Guilbert et al. investigated the influence of the bridgehead atom by wide-angle X-ray scattering and molecular modeling and found that the substitution of the carbon atom by a silicon atom led to a decreased π–π stacking distance in conjunction with an increased lamellar stacking distance.8
Very recently, Rao et al. reported that non-geminate recombination leads to the formation of polymer triplet states in the low-bandgap polymer:fullerene system PCPDTBT:PC70BM, which in turn strongly affects the device performance.9 Recent results by Chow et al. further revealed that upon addition of ODT triplet generation was promoted due to increased generation of free charges.10A limitation of the device performance by triplet state generation in PCPDTBT:PCBM was also proposed by Di Nuzzo et al.,11 while Distler et al. recently extended the quasi-steady state photo-induced absorption (cw-PIA) studies reported previously to PSBTBT:PC70BM blends for which they demonstrated negligible triplet generation.12 However, cw-PIA measurements do not accurately capture generation and recombination processes, as the technique measures lifetime and concentration-averaged photo-induced absorption signals, and therefore the role of triplet states in PSBTBT:PCBM photovoltaic blends still remains unclear. In fact, compared to PCPDTBT:PCBM blends, where enhanced triplet generation has been observed in optimized morphologies created by adding the cosolvent ODT,10 it is yet unknown how the substitution of the carbon bridgehead atom by silicon affects the photophysical processes in a solar cell. Specifically, this involves the charge generation, formation of triplet states, and excited state dynamics in comparison to the carbon-bridged analogue PCPDTBT. Only very recently Tamai et al. reported transient absorption (TA) experiments on PSBTBT:PCBM blends, covering the Vis-NIR spectral range and ps–μs dynamic range.13 The authors concluded that exciton dissociation is in part diffusion-limited and they could distinguish between hole polarons in disordered (amorphous) and semi-crystalline polymer domains on the basis of their different spectral signatures. They also found that the former are prone to sub-nanosecond geminate recombination, while the latter are longer-lived and contribute to the photocurrent. Hole transfer from disordered to ordered domains was also observed, however, triplet state formation was not reported in their study.13
Here, we investigated the solid-state morphology and charge generation and recombination processes in PSBTBT:PCBM blends by solid-state NMR and transient absorption pump–probe spectroscopy, respectively, and compared the results to those recently obtained on PCPDTBT:PCBM and PSBTBT:PCBM blends by others and us.5d,10,13 Specifically, we address the origin for the performance increase observed if PSBTBT is used instead of PCPDTBT in a photovoltaic blend. We demonstrate by soft-modeling of the experimentally obtained TA data, namely by multivariate curve resolution alternating least squares (MCR-ALS) analysis, that triplet state formation by fast sub-nanosecond non-geminate recombination constitutes a loss channel in PCPDTBT:PCBM blends prepared with ODT, whereas this loss channel is significantly reduced in the PSBTBT:PCBM blend in part explaining the much higher device performance of the latter.
Experimental
Materials
The PCPDTBT polymer used in the present study was obtained from 1-material Organic Nano Electronic and used as received. The molecular weight of the polymer was Mn = 14.000 g mol−1. PSBTBT was purchased from Konarka with a molecular weight of Mn = 16.000 g mol−1 and a polydispersity of 3.72 and was also used as received. We determined the molecular weights in-house using hot GPC with trichlorobenzene at 80 °C as eluent and referenced against polystyrene standards.Sample preparation
The solar cells were processed on ITO-covered glass substrates (Präzisions Glas & Optik GmbH, Germany) patterned by wet etching. On top of the ITO a PEDOT:PSS layer was spin-cast from aqueous solution at 3000 rpm in 60 s and afterwards dried in a glovebox at 150 °C for 10 minutes. Above that the active layer was spin-cast followed by the evaporation of a 10 nm calcium and a 100 nm aluminum electrode. For the preparation of PCPDTBT![[thin space (1/6-em)]](https://www.rsc.org/images/entities/char_2009.gif) :PC60BM blends, both materials were dissolved together in ratio of 1:2 with a polymer concentration of 10 mg ml−1 in chlorobenzene or a chlorobenzene ODT mixture containing 3 vol% of ODT. The solution was spin-cast at 80 °C at 1400 rpm for 40 s. PSBTBT:PC70BM samples were spin-cast from a dichlorobenzene solution in ratio of 1:1.5 with a polymer concentration of 14 mg ml−1 at 1400 rpm for 40 s at 70 °C.
:PC60BM blends, both materials were dissolved together in ratio of 1:2 with a polymer concentration of 10 mg ml−1 in chlorobenzene or a chlorobenzene ODT mixture containing 3 vol% of ODT. The solution was spin-cast at 80 °C at 1400 rpm for 40 s. PSBTBT:PC70BM samples were spin-cast from a dichlorobenzene solution in ratio of 1:1.5 with a polymer concentration of 14 mg ml−1 at 1400 rpm for 40 s at 70 °C.
Samples used for optical spectroscopy were spin-cast on cleaned quartz substrates with the same conditions as for solar cell preparation. For experiments on polymer:triplet sensitizer films, 40 wt% of PtOEP was used.
Samples for solid-state NMR spectroscopy were dropcast on glass substrates from different solvents indicated in the main text and dried for several days in the glovebox. Subsequent application of vaccum was used to remove residual solvents. Afterwards, the polymer film was scratched from the glass substrate and transferred into an NMR rotor.
Solid-state NMR spectroscopy
Solid-state magic-angle spinning (MAS) NMR experiments were carried out on a Bruker Avance III spectrometer operating at 20.0 T (νL = 850.27 MHz for 1H, νL = 213.82 MHz for 13C) using a commercial 2.5 mm double resonance probe (Bruker). 1D 13C MAS NMR spectra used for assignment purposes (see Fig. S1, ESI†) were obtained through 13C{1H} cross-polarization (CP) at a spinning frequency of 25.0 kHz with a repetition delay of 2 s and a total number of scans varying from 24576 to 49152, depending on the available amount of sample. 2D 13C{1H} frequency switched Lee-Goldburg (FSLG) heteronuclear correlation (HETCOR) spectra were recorded at a spinning frequency of 15.0 kHz using a repetition delay of 2 s and a number of scans varying from 896 and 2176 for a total of the 40 t1 increments. The 2D experiments employed LG-CP conditions to suppress 1H spin diffusion during CP. For all 1D and 2D NMR experiments the specific CP and LG-CP conditions, respectively, were preoptimized on L-alanine. The CP contact time was set to 3.0 ms for all experiments and two-pulse phase modulation (TPPM) high-power 1H decoupling was applied during acquisition. All spectra were referenced to adamantane as a secondary standard (δiso = 1.85 ppm for 1H, δiso = 38.484 for 13C). Identical processing conditions were used for all 1D and 2D NMR spectra. All 2D NMR spectra were plotted on the same intensity scale with 12 contour lines from 5.0 to 99.0% of the maximum intensity using the commercial topspin software (Bruker).
Solar cell characterization
The solar cell device efficiency was measured in nitrogen-filled glovebox with a solar simulator (K. H. Steuernagel Lichttechnik GmbH, Germany) imitating AM1.5G conditions with an intensity of 80 mW cm−2.Steady-state spectroscopy
Absorption spectra and charge induced absorption spectra on oxidized films were recorded with a Perkin-Elmer Lambda spectrophotometer.Transient absorption spectroscopy
The transient absorption experiments were carried out with a home-built pump–probe setup. The output of a titanium:sapphire amplifier (Coherent LIBRA HE, 3.5 mJ, 1 kHz, 100 fs) was used to pump two independent optical parametric amplifiers (Coherent OPerA Solo), of which one was used to generate a pump pulse. The second OPA was used generate a seed pulse for supercontinuum generation, which served as the broadband probe pulse. For measurements in the probe range between 500–1100 nm a 1300 nm seed pulse was focused into a 3 mm c-cut sapphire crystal, probe pulses between 1000–1500 nm were generated by focusing a 2100 nm pulse into yttrium orthovanadate (YVO4) crystal. Time resolution was obtained by delaying the pump pulses on a motorized delay stage between 150 fs and 4 ns in relation to the probe pulse. For experiments conducted between 1 ns and 1 ms the excitation pulse was provided by an actively Q-switched Nd:YVO4 laser (AOT Ltd MOPA) at 532 nm. The delay between pump and probe in this case was controlled by an electronic delay generator (Stanford Research Systems DG535). TA measurements were performed at room temperature under a dynamic vacuum of <10−5 mbar. The transmission of the probe pulses was measured by a linear silicon photodiode array or a linear extended InGaAs array.Results
Blend morphology
The blend morphology of PSBTBT:PC60BM blends in terms of local molecular order and interfacial structure was investigated by solid-state NMR spectroscopy and compared to the NMR results that we recently obtained on PCPDTBT:PC60BM blends.5d Using this technique we utilize the fact that the isotropic 13C NMR line width, obtained under fast magic-angle spinning (MAS), reflects the distribution of local site geometries and thereby, the average degree of ordering at the molecular level.14 A further advantage of solid-state NMR is its ability to probe the spatial proximity of chemical groups on the sub-nanometer scale via through-space dipole–dipole coupling between nuclear spins. Thus, the combination of 13C chemical shift information combined with two-dimensional (2D) 13C dipolar-mediated heteronuclear correlation (HETCOR) NMR is a powerful approach for studying molecular packing and heterogeneities in addition to spatial arrangements of molecular entities.15Fig. 1b–d summarize the 2D solid-state 13C{1H} FSLG-HETCOR NMR spectra of PCPDTBT:PC60BM and PSBTBT:PC60BM blends both drop-cast from o-DCB and, in the case of PCPDTBT:PC60BM, also from o-DCB containing 2.44% (vol%) ODT as a solvent-additive.5d PCPDTBT:PC60BM obtained from dissolution in pure o-DCB exhibited the broadest 13C signals of all blends (Fig. 1b) and thus, the lowest degree of local molecular ordering. Processing the same material with ODT resulted in an increased molecular order, as indicated by the narrower 13C line widths in the aliphatic region (10–60 ppm), which is even more pronounced for the aromatic 13C signals in the 110–160 ppm region (Fig. 1c). We note that similar effects concerning local molecular order have recently been reported for pure PSBTBT when addressing the effects of thermal annealing.16 Nevertheless, the PSBTBT:PC60BM blend showed most narrow 13C line widths and thereby the highest average local ordering of all samples even without addition of ODT to the solution (Fig. 1d).
 | ||
| Fig. 1 (a) Chemical structures for PCPDTBT, PSBTBT, and PC60BM, showing the labeling scheme and possible intra- and inter-molecular contacts. 2D 13C{1H} FSLG-HETCOR NMR spectra for (b) PCPDTBT:PC60BM (1:2), (c) PCPDTBT:PC60BM (1:2) with 2.44% ODT, and (d) PSBTBT:PC60BM (1:1.5). All blends were drop-cast from o-DCB. The solid-state NMR experiments were acquired at ambient temperature under MAS conditions of 15.0 kHz using a 3.0 ms LG-CP contact time. The 2D NMR spectra are accompanied by their respective 1D 13C- (top axis) and 1H skyline projections (right axis). All spectra are plotted on the same intensity scale with contour lines from 5.0 to 99% of the maximum intensity. | ||
The aliphatic resonance highlighted in green in the 2D 13C{1H} FSLG-HETCOR NMR spectrum of PCPDTBT:PC60BM drop-cast from o-DCB (Fig. 1b) can be unambiguously assigned to the methylene group (C6) next to the bridgehead carbon atom of the 2-ethylhexyl side chains (see Fig. 1a and Fig. S1, ESI†). The absence of this 1H–13C heteronuclear correlation after processing PCPDTBT:PC60BM with ODT (Fig. 1c) suggest changes in the 2-ethylhexyl side chain conformation. The absence or strong intensity reduction for the C6 signal is likely due to an interference between the local molecular mobility of the CH2 group and the time scale of the NMR experiment as has been observed in recent solid-state NMR studies as well.17 This interference leads to a signal loss and possible broadening when the frequency of the associated motion is matched by the frequency of either (i) the involved 1H–13C dipole–dipole couplings, (ii) the proton decoupling/cross-polarization fields, or (iii) the magic-angle spinning.18 Thus, this difference between the two blends is most likely related to a spatially more favorable 2-ethylhexyl side-chain arrangement for PCPDTBT:PC60BM processed with ODT. These observations are in agreement with literature reports showing that ODT acts as a small-molecule plasticizer for PCPDTBT:PC60BM blends, amorphous polymer:fullerene systems and also small molecules.4b,19
For PSBTBT, the replacement of the bridgehead carbon atom by silicon (Fig. 1d) leads to a new correlation signal located at δiso(13C) ∼ 20 ppm (highlighted in green, filled rectangle). This signal can be assigned to the methylene group (C6) of PSBTBT (see Fig. 1 and Fig. S1, ESI†). The characteristic shift to lower 13C chemical shift (or equivalent higher field) is not only caused by the change in chemical nature of the bridgehead atom, but also comes as a result of changes in bond lengths and angles around the silicon atom compared to its carbon analogue as shown in a recent study.20 This study further concluded that such changes in bond length and bond angles lead to an increase of the angle between donor and acceptor groups, going from 10° in PCPDTBT to 19° in PSBTBT.20 More importantly, the observation of the methylene signal for C6 in PSBTBT:PC60BM is quite characteristic, since this is not observed for PCPDTBT:PC60BM processed with ODT (cf.Fig. 1b and c). Thus, the data obtained here for the PSBTBT:PC60BM blend suggest a significant change in the solid-state morphology that is not only related to the 2-ethylhexyl side chain organization, but also to an increase in molecular order and packing/aggregation of the PSBTBT polymer chains. These changes are likely the cause for achieving an increased PCE even without the use of ODT.
All three 2D 13C{1H} FSLG-HETCOR NMR spectra shown in Fig. 1c and d include a number of correlations between aliphatic (δiso(1H) < ∼5 ppm and δiso(13C) ∼ 10–60 ppm) and aromatic (δiso(1H) > ∼5 ppm and δiso(13C) ∼ 110–160 ppm) units. These correlation signals can be assigned to intramolecular 1H–13C pairs of aliphatic and aromatic functionalities that are either directly bonded or in close proximity to each other. Besides these intrinsic, expected connectivities, intermolecular contacts between aliphatic–aliphatic and between aromatic–aromatic moieties can also contribute to the signal intensity in the aforementioned regions. This includes intermolecular contacts between aliphatic side chains that occur between stacks of PCPDTBT/PSPTBT polymer chains and aromatic–aromatic donor–acceptor contacts, arising from closely stacked PSBTBT and PCPDTBT polymer chains.21 In the 2D 13C{1H} FSLG-HETCOR NMR spectrum of PCPDTBT:PC60BM drop-cast from pure o-DCB (Fig. 1b), additional correlation signals are present between aliphatic 13C and aromatic 1H moieties (highlighted in orange). Such signals can in principle arise from intramolecular contacts caused by back folding of 2-ethylhexyl side chains onto the PCPDTBT backbone or folding of the butyric methyl ester functionalities (handle) onto the fullerene of PCBM. Both scenarios would inhibit the growth of sufficiently large PCPDTBT and PCBM domains, leading to an intimate molecular mixing of the two blend components. Such a scenario is likely to be accompanied by a low PCE due to dominant recombination processes.5d Another possibility is that the mixing of PCPDTBT and PCBM leads to intercalation of the 2-ethylhexyl side chains and butyric methyl ester functionalities between adjacent aromatic moieties as indicated in Fig. 1a. However, processing the PCPDTBT:PC60BM blend with ODT clearly leads to the disappearance of these aliphatic carbon and aromatic proton correlations in the 2D 13C{1H} FSLG-HETCOR NMR spectrum (Fig. 1c). Likewise, these correlation signals are also absent in the 2D 13C{1H} FSLG-HETCOR NMR spectrum of PSBTBT processed without ODT (Fig. 1d). Thus, the blends of PCPDTBT:PC60BM processed with ODT and that of PSPTBT:PC60BM both appear to have better defined intra- and intermolecular ordering of the constituents that is accompanied by the formation of larger polymer- and PCBM-rich domains in the blend.5d The improved ordering of both polymer and PCBM and, in particular, the separation of aromatic and aliphatic functionalities, is known to correlate with improved aromatic–aromatic interfaces and enhanced charge transport properties.7,22
Steady-state absorption and photovoltaic performance
Fig. 2a shows the absorption spectra of a PSBTBT:PC70BM (1:1.5) blend, a PCPDTBT:PC60BM (1:2) blend, and a PCPDTBT:PC60BM (1:2) blend processed with the solvent additive ODT. As reported earlier, the addition of ODT to the solution prior to spin-casting the film causes a red-shift of the polymer's absorption in conjunction with a more pronounced vibronic structure, indicating demixing of the blend's components and enhanced order of the polymer. The red-shift and vibronic structure are even more pronounced in the PSBTBT blend in line with the enhanced semi-crystallinity reported for this system.6 The absorption difference between 450–600 nm of the PCPDTBT compared to the PSBTBT blends is the result of the additional absorption caused by the C70-fullerene derivative used in the latter blend. PC70BM increased the device performance (see Fig. 2b) due to enhanced harvesting of solar illumination by increasing the photoactive layer's absorption. As we have recently shown, PCPDTBT:PC60BM devices prepared without ODT have a JSC of 3.8 mA cm−2 and a FF of only 0.38 that result in a low PCE of 1.0%. Addition of ODT to the solution for spin-casting doubled the PCE to 2.2% for PC60BM and 2.7% for PC70BM, respectively, however the FF still remained rather low at 0.45. Solar cells built from PSBTBT:PC70BM show a JSC of 10.4 mA cm−2, and a fill-factor of 0.64 yielding a PCE of 4.6%, which is in good agreement with the efficiencies very recently reported by Di Nuzzo et al.23 The increase in FF indicates that field-dependent processes are strongly reduced in PSBTBT:PC70BM compared to PCPDTBT:PC60BM. In fact, Albrecht et al. have recently shown that charge generation is strongly field-dependent in PCPDTBT:PC70BM blends, while it is only weakly-field dependent in PSBTBT:PC60BM blends, resulting in a higher JSC and FF of the latter.24
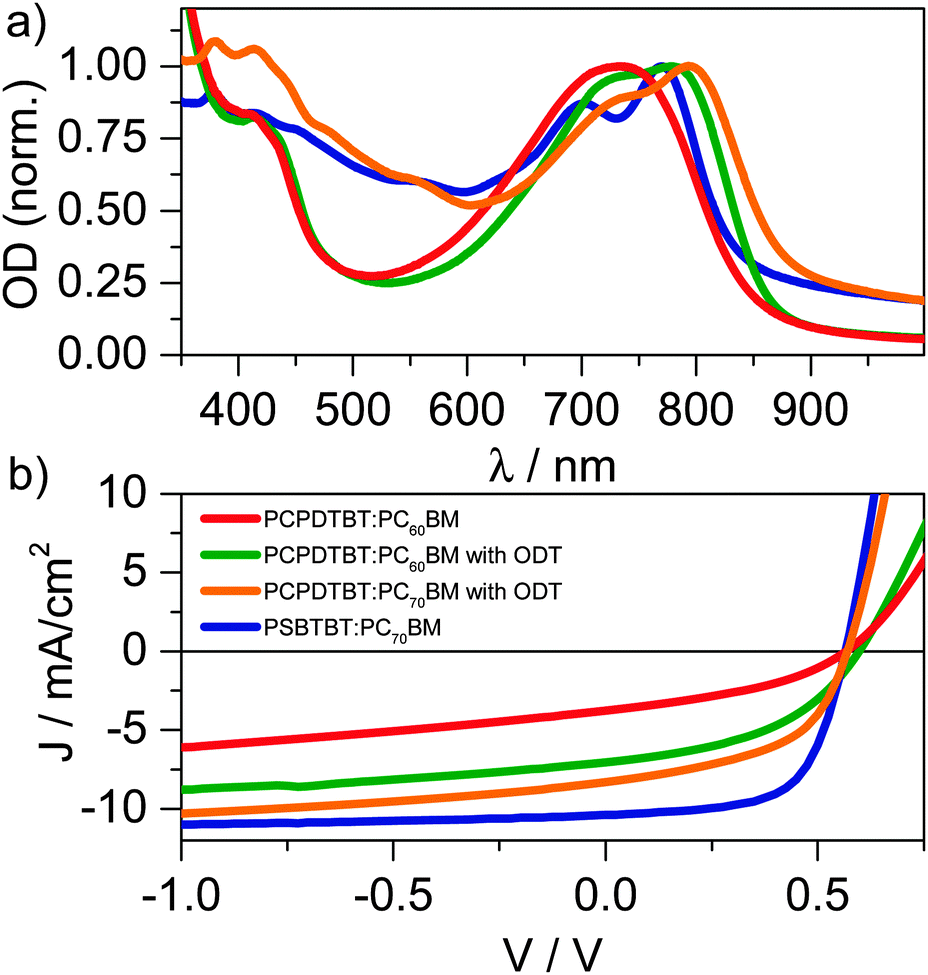 | ||
| Fig. 2 (a) Absorption spectra of PCPDTBT:PC60BM (1:2) prepared without ODT (red), PCPDTBT:PC60BM (1:2) prepared with ODT (green), PCPDTBT:PC70BM prepared with ODT (orange) and PSBTBT:PC70BM (1:1.5) (blue). (b) J–V curves of the respective photovoltaic devices measured with a solar simulator at 80 mW cm−2 (same color code as in panel (a)). | ||
ps–μs excited state dynamics in PSBTBT:PC70BM
The exciton and charge carrier dynamics in blends of PSBTBT:PC70BM were investigated by broadband Vis-NIR transient absorption (TA) pump–probe spectroscopy covering a dynamic range from pico-to microseconds. Here, we demonstrate that the charge generation dynamics depend on the excitation wavelength and furthermore that after exciton dissociation has been completed and free charge carriers have been created, another excited state is generated in a consecutive process. By applying evolving factor analysis (EFA) and model-free multivariate curve resolution (MCR) on the TA data as recently discussed by us and further explained in the ESI,†25 we extract the minimum number of excited states contributing to the experimentally-determined TA data matrix and the individual spectra and dynamics of all excited states. Finally, by comparison with the separately measured triplet-state induced absorption spectrum we identify the consecutively generated component as the polymer triplet state.Fig. 3 shows the ps–ns Vis-NIR TA spectra of a PSBTBT:PC70BM blend after excitation of the polymer at 800 nm. The spectra exhibit a positive signal below 800 nm, which we assign to the ground state bleach (GSB) of the polymer, as its spectral position coincides with the ground state absorption. At longer wavelength a broad photoinduced absorption (PA) was observed that reaches further into the NIR spectral region even beyond 1500 nm. Plotting the signal dynamics of the PA between 1450–1500 nm shows that it drops substantially within the first 10 ps after photoexcitation. A comparison with TA spectra of a pristine PSBTBT film (see Fig. S2, ESI†) suggests that the PA in this spectral region is dominated by singlet exciton-induced absorption of the polymer. It appears that upon excitation at 800 nm some excitons are generated in polymer-rich regions of the film and have to diffuse to the interface prior to charge transfer.
 | ||
| Fig. 3 (a) ps–ns TA spectra of PSBTBT:PC70BM measured after excitation at 800 nm. (b) Ground state bleach (GSB) dynamics averaged between 760–780 nm after excitation of the polymer at 800 nm (red) or the fullerene at 530 nm (green). | ||
In stark contrast to excitation of the polymer at 800 nm, excitation at 530 nm predominantly excites the fullerene-rich regions of the blend. The GSB of the polymer shows a prolonged rise up to a few hundred picoseconds, indicating that the initially created excitons do not reside on the polymer prior to charge transfer, but rather on the fullerene.5d In fact, the prolonged rise of the polymer's bleach in conjunction with a rise of the charge-induced absorption also suggests that diffusion of excitons in the PC70BM domains is rather slow and that fullerene-rich domains are extended in the blend. Furthermore, the dynamics show a pronounced fluence dependence indicating fullerene exciton–exciton and/or exciton-charge annihilation prior to the exciton dissociation at the interface. However, we note that higher order effects are only relevant at excitation densities largely exceeding 1-sun conditions, while they are absent at the lowest fluences used in our TA experiments.
In order to determine how many excited states contribute to the measured TA data matrix, we performed EFA25 on the PSBTBT:PC70BM blend's sub-ns TA NIR data for all excitation densities after exclusive excitation of the polymer at 800 nm. At approximately 10 ps, that is, the time required for complete polymer exciton quenching, the TA NIR data can be accurately described by a single component. We assigned this component to charges generated upon exciton dissociation at the interface as commonly observed in polymer:fullerene blends. Surprisingly, at later delay times a second component was clearly revealed by EFA, whose onset shifted to earlier delay times with increasing pump fluence, indicating that its generation is controlled by a fluence-dependent process (see Fig. S3 for EFA plots, ESI†). To determine the associated component spectra and dynamics we applied multivariate curve resolution (MCR) analysis with alternating least squares (ALS), using a matrix factorization algorithm recently developed by Tauler et al.26 (see also SI and Fig. S4, ESI†). We note that MCR analysis is a common tool in other spectroscopy communities, for instance, it is used in NMR spectroscopy to separate the individual contributions of components in liquid-state and diffusion ordered spectroscopy (DOSY) NMR spectra27 and in HPLC-DAD to identify single components in a multicomponent mixture.28 We have recently applied MCR analysis to TA experiments on polymer:perylene diimide blends to unravel the efficiency-limiting processes in these photovoltaic systems.29 Here, we determined that three components contribute to the TA data matrix on the ps–ns timescale, while it is only two components on the ns–μs timescale. Thus, we first analyzed the ns–μs data as the complexity of the data analysis increases with the number of components. Fig. 4 shows the results of the MCR-ALS analysis of the TA data of PSBTBT:PC70BM on the ns–μs timescale constrained to non-negativity of spectra and concentration profiles.
 | ||
| Fig. 4 Comparison of the component spectra 1 (open squares) and 2 (open dots) obtained by MCR-ALS analysis of the ns–μs TA data of PSBTBT:PC70BM to the experimentally-determined triplet-induced (solid black line) and charge-induced (solid red line) absorption spectrum. Note the perfect match of component 1 to the triplet-induced absorption of the polymer obtained on a polymer:triplet sensitizer (PtOEP) blend and of component 2 to the TA spectrum of PSBTBT:PC70BM at 20 ps, where charge carriers are the dominant species in the blend. | ||
Interestingly, the spectrum of component 1 that results from the MCR-ALS analysis is virtually the same as the triplet-induced absorption shown in Fig. 4, which we measured on a blend of PSBTBT and the triplet sensitizer platinum octaethylporphyrin (PtOEP), as we have previously also demonstrated for PCPDTBT.5d We fixed the triplet spectrum in the MCR analysis and obtained a set of potential spectra (Fig. S5a, ESI†) and concentration profiles (Fig. S5b, ESI†) for component 2. A comparison of both component spectra obtained by MCR-ALS analysis (see Fig. 4) to the separately measured triplet- and charge-induced absorption spectra confirmed that the ns-μs transient absorption surface of PSBTBT:PC70BM can indeed be very well described by these two states.
Fig. 5 shows the dynamics of triplets and charges for three different excitation densities obtained by factorization of the ns–μs TA surface based on the triplet-induced absorption spectrum and the charge-induced absorption spectrum. The concentration profiles shown in Fig. 5 (Fig. S9 for normalized kinetics, ESI†) clearly demonstrate that charges and triplets exhibit concentration dependent decay dynamics. In case of the charge carriers fluence dependent dynamics point to non-geminate recombination, but in case of the triplet states an exponential decay with an inverse rate of several hundred nanoseconds or even microseconds is expected, if triplets decayed with their intrinsic lifetime. However, the concentration dependence of the triplet dynamics suggests that charge-triplet annihilation and triplet–triplet annihilation occur and dominate the triplet dynamics as recently also demonstrated for PCPDTBT:PC70BM blends.10
 | ||
| Fig. 5 ns–μs concentration profiles of triplets (solid lines) and charges (dashed lines) in a PSBTBT:PC70BM blend for three fluences calculated using a cross-section ratio of σtriplets = 2σcharges. | ||
To analyze the ps–ns TA data we added the absorption spectrum of the polymer singlet states obtained on a pristine PSBTBT film by TA spectroscopy (see Fig. S2, ESI†) to the data analysis. In fact, using a combination of the charge-induced, triplet-induced, and singlet-induced absorption spectra as input parameters, we were able to uniquely determine the contribution of each species on the ps–ns timescale. Fig. 6 shows the NIR transient absorption data surface of a PSBTBT:PC70BM blend after excitation at 800 nm with a low fluence of 2.9 μJ cm−2 and depicts the normalized component spectra as obtained by matrix factorization. The respective concentration profiles are shown as well for the three lowest fluences between 1.4–2.9 μJ cm−2. The concentration profiles were obtained by matrix division using a cross-section ratio of σexcitons = 2.8 × σcharges and σtriplet = 2σcharges, the latter which has recently been reported for PCPDTBT:PC70BM, assuming that the cross section ratio is similar in PSBTBT:PC70BM.30 The cross-sections of charges and singlet excitons were simply determined from the TA spectra of the blend at a delay time of 20 ps, that is, at a time when only charges were present in the blend, and from measurements on a pristine polymer film, respectively, according to
 | (1) |
 | ||
| Fig. 6 NIR transient data surface of a PSBTBT:PC70BM blend after excitation at 800 nm. The right panel displays the normalized spectra of the individual excited states, i.e. polymer triplets (solid line), polymer singlets (line with crosses), and charges (line with open boxes). The bottom panel shows the corresponding concentration profiles for three different excitation densities, 1.4 μJ cm−2 (blue), 1.9 μJ cm−2 (green), and 2.9 μJ cm−2 (red). | ||
The polymer excitons decay in about 10 ps and cause a concomitant rise of the charge-induced absorption on the same timescale pointing towards a diffusion-limited exciton dissociation process as already discussed above. However, a fraction of charges was already present directly after excitation, indicating ultrafast charge generation faster than our time resolution of ∼200 fs. The rise of the charge-induced absorption continues up to 10–20 ps and is followed by fluence dependent recombination (see also Fig. S8 for normalized dynamics, ESI†). The decay of the charges is correlated with the rise of the population of polymer triplet states, starting at around 100 ps for the lowest fluence used in our experiments. We note that the onset of triplet formation obtained by MCR-ALS analysis is in excellent agreement with the results obtained by EFA (see above).
Excited state dynamics in PCPDTBT:PC60BM blends
In this section we compare the results obtained on the ps–ns timescale for PSBTBT:PC70BM presented above with data obtained on PCPDTBT:PC60BM blends prepared with and without solvent additives. To the best of our knowledge, such an analysis of the ps–ns dynamics in PCPDTBT:PC60BM has not been presented yet, while the ns–μs dynamics have been presented earlier.10We note that the device performance of PCPDTBT:PC60BM blends prepared with and without ODT and PCPDTBT:PC70BM blends prepared with ODT is significantly worse than that of PSBTBT:PC70BM blends. In Fig. 2 we compare the J–V curves of all systems clearly demonstrating that the performance of the PCPDTBT:PC60BM and PCPDTBT:PC70BM devices is limited by the low fill-factor independent of the fullerene derivative used. We have previously reported the charge generation and recombination processes in PCPDTBT:PC60BM prepared with and without ODT and used a simple two-pool model to parameterize the carrier dynamics.5d In light of the recent results reported by Chow et al.10 and our results obtained on PSBTBT:PC70BM blends shown here, we revisited the data analysis after retaking the PCPDTBT:PC60BM TA data using an improved NIR TA setup with enhanced signal to noise ratio. Interestingly, the EFA analysis of the ps–ns and ns–μs TA data measured for PCPDTBT:PC60BM indicated, as observed for the PSBTBT:PC70BM system, that after polymer exciton quenching was completed a second component in addition to the charge carriers is generated. Applying MCR-ALS analysis to the TA data obtained on PCPDTBT:PC60BM blends prepared with ODT revealed that the generation of the second component is significantly faster in this blend causing its total concentration to be higher compared to a blend prepared without ODT. Fig. 7 displays the concentration profiles obtained from the factorization of the sub-ns TA data of the blend processed without ODT (a) and processed with ODT (b). In line with the interpretation of the data on PSBTBT:PC70BM, we identified the second component as the polymer triplet state by comparison with the independently measured triplet-induced absorption spectrum (see ESI†). We note that the triplet as well as the charge-induced absorption spectra in the blend prepared without ODT are slightly blue-shifted compared to the PCPDTBT:PC60BM blend prepared with ODT in good agreement with recent literature results.10 Furthermore, the generation of triplets is slower in the former than in the PCPDTBT:PC60BM blend prepared with ODT. For the PCPDTBT:PC60BM system prepared without ODT the triplet-induced spectrum obtained by TA measurements on the pristine polymer is in perfect agreement with the spectrum obtained by MCR-ALS analysis of the TA data clearly supporting the assignment of triplet state formation (see Fig. S11, ESI†). Furthermore, we found that the TA spectrum obtained on the same blend after a delay of 20 ps, where we expect only charges to be present, is virtually the same as the spectrum of the other component (see Fig. S11, ESI†). Hence, at 20 ps mostly charge carriers contributed to the TA signal measured at the lowest excitation fluence. However, the TA spectra at 20 ps of a PCPDTBT:PC60BM blend prepared without ODT exhibited a blue-shift with increasing pump fluence, indicating that at high fluences triplets are already created on the sub-100 ps time scale (Fig. S12, ESI†). Nevertheless, the spectra obtained at the two lowest fluences resemble those of the charges, suggesting that triplets were not yet present. The fluence dependent blue-shift of the spectra obtained at 20 ps from PCPDTBT:PC60BM blends prepared with ODT is more pronounced compared to the system prepared without ODT (see Fig. S12b, ESI†). This implies that the TA spectrum at 20 ps of the blend prepared with ODT already contains a contribution from triplets and indicates that triplet formation is faster in this blend. The residual deviation of the factorized spectra from the experimentally obtained TA data for all samples can be found in the ESI† (Fig. S13–S18).
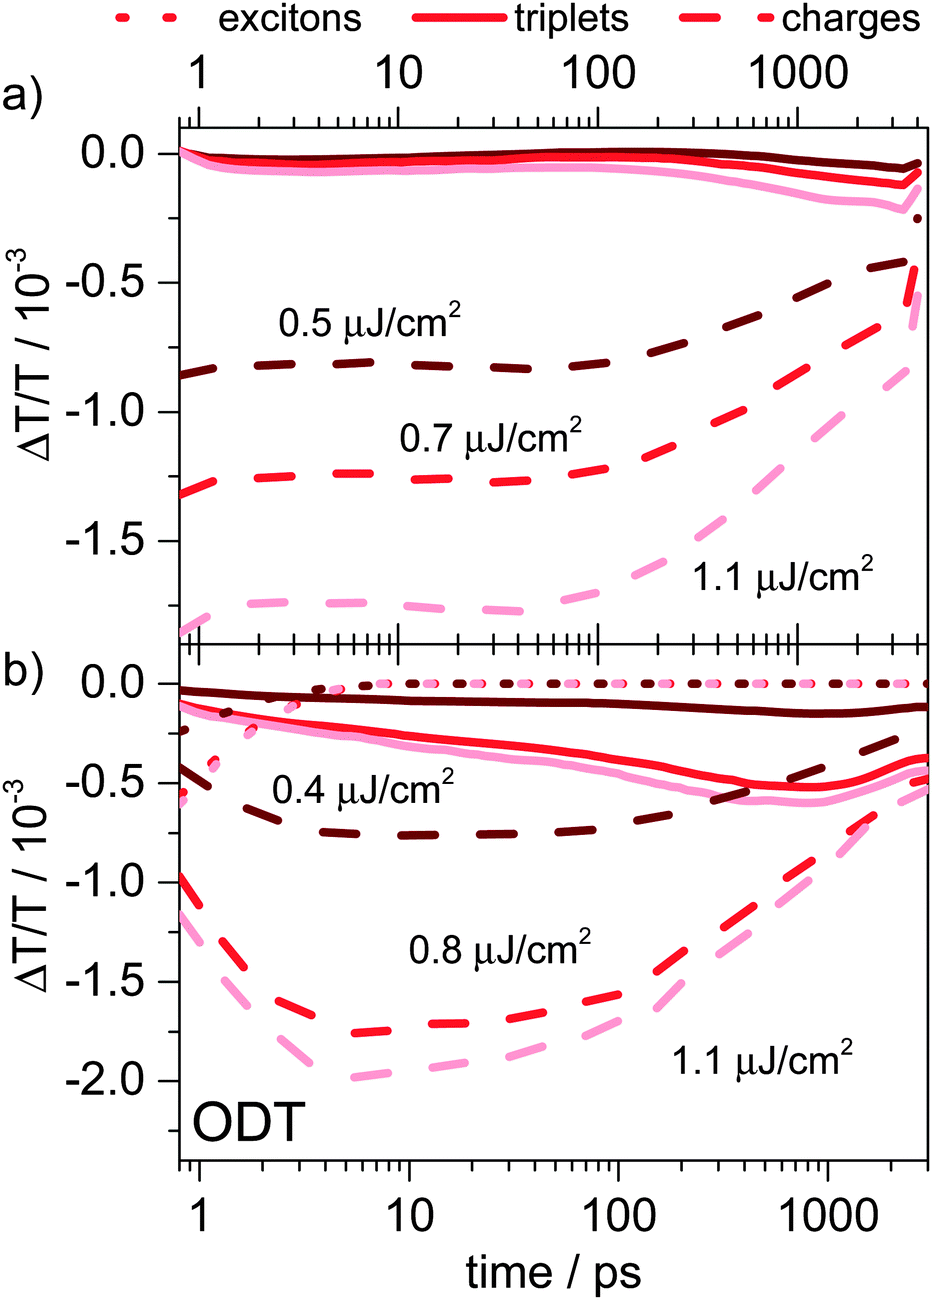 | ||
| Fig. 7 (a) Picosecond to nanosecond singlet (dotted line), triplet (solid line), and charge carrier (dashed line) dynamics in PCPDTBT:PC60BM blends processed without ODT and (b) in PCPDTBT:PC60BM blends processed with ODT as obtained by MCR analysis. | ||
As mentioned above, PCPDTBT:PC60BM blends processed with ODT and PSBTBT:PC70BM blends show similar solid-state morphology in terms of molecular order and phase separation as demonstrated by our solid-state NMR experiments (see Fig. 1). This is in line with the early-time excited-state dynamics obtained by TA experiments shown in Fig. 8, as the singlet exciton concentration profiles (dotted lines) demonstrate very similar singlet state dynamics in both samples. However, after exciton dissociation and charge generation is completed the temporal evolution of the charge carriers significantly differs for the two blends, showing only a minor decay of approximately 15% on the first two nanoseconds for PSBTBT:PC70BM blends, but a more than 60% decay in the PCPDTBT:PC60BM blends processed with ODT. The fast decay of charges in the latter is accompanied by a fast rise of the triplet population in contrast to PSBTBT:PC70BM blends, in which the onset of triplet formation is approximately at 100 ps.
 | ||
| Fig. 8 Comparison of ps–ns singlet (dotted line), charge (dashed line) and triplet (solid line) state dynamics in a PSBTBT:PC70BM blend (top panel) with those of a PCPDTBT:PC60BM blend (bottom panel). Both samples were excited at 800 nm. | ||
Discussion
Our TA measurements and data analyses revealed that after exciton dissociation and charge transfer is completed another excited state is generated. The presence and rise of this additional component besides the formation of free charges was indicated by evolving factor analysis. Successive MCR-ALS analysis of the TA datasets allowed us to determine the component spectra and their dynamics. Comparison of the component spectra to independently obtained absorption spectra of singlet and triplet excitons as well as charges allowed to identify the presence of these states and their dynamics in the ps–ns and ns–μs time region. However, it is not straightforward to pin down the mechanism behind the formation of triplet states. The fluence dependence of the onset of triplet state formation corresponding to the rise of the triplet-induced absorption plus the observation of enhanced triplet state formation upon more efficient free charge carrier formation in the PCPDTBT:PCBM blends implies that they are generated by non-geminate recombination of free charge carriers as very recently also suggested by Rao et al. and Chow et al.9,10 In fact, when two oppositely charged free carriers encounter at the donor–acceptor interface, they may create a loosely-bound charge transfer state across the interface prior to recombination.31,32 Since the electron spins of the free charge carriers are initially uncorrelated, simple spin statistics determines that three quarters of the interfacial states should be spin triplets, while one quarter is expected to be spin singlets, very much alike the recombination of free charges injected from electrodes in organic light-emitting diodes (OLEDs). However, the interfacial CT states created upon free charge recombination can re-dissociate into free charges, spin flip from the singlet to the triplet or vice versa, or recombine controlled by the kinetics of these processes as suggested by Rao et al.9 Alternatively, triplet formation could occur via intersystem crossing of CT states immediately created after singlet exciton dissociation.33 However, recent measurements on PCPDTBT:PC60BM and PSBTBT:PC60BM blends revealed a lifetime of these CT states of a few hundred picoseconds only,13,34 which appears to be too short to create a substantial yield of triplets by intersystem crossing (ISC).The population of polymer triplet states occurs, if the triplet state of the polymer is lower in energy than the interfacial triplet CT state, causing a downhill energy transfer process, which competes with re-dissociation of the CT state. This process adds another loss channel to the efficiency-limiting processes in organic solar cells, and hence likely decreases its efficiency. Fig. 9 sketches an overview of the possible processes in the investigated polymer:fullerene bulk heterojunction blends.
 | ||
| Fig. 9 Scheme of the proposed photophysical processes in low-bandgap polymer:fullerene solar cells. The extraction of free charge carriers (green) (1.) is in competition with their recombination (red) (9.). When free charge carriers of uncorrelated spin recombine (2.), CT states with spin singlet and spin triplet character are formed presumably in a 1:3 ratio. They can either redissociate (3.) or the 1CT states can relax and recombine geminately to the ground state (5.). In addition, intersystem crossing from the 1CT states to 3CT states may occur (4.). The geminate recombination of the 3CT states is slower than that of the 1CT states (6.), allowing redissociation (3.) and energy transfer to the polymer triplet state (7.). The polymer triplet states then undergo charge-triplet and triplet–triplet annihilation to the ground state (8.). | ||
A comparison of the PSBTBT:PC70BM blend and the PCPDTBT:PC60BM blend prepared with ODT revealed that the triplet generation in the latter was significantly enhanced. We note that our TA measurements were conducted on blend films without any electrodes, that is, in the absence of any electric field, corresponding to open-circuit conditions in a solar cell. Hence, all photogenerated charge carriers are forced to eventually recombine to the ground state. Due to the higher charge carrier mobility in the PSBTBT:PC70BM blend compared to the PCPDTBT:PC60BM blend,3b non-geminate recombination is expected to be faster in the former and thus enhanced triplet formation is expected, but interestingly not observed. This points to a suppression of triplet generation in PSBTBT:PC70BM blends. The reason for the reduced triplet generation yield is not entirely clear and cannot be deduced from our spectroscopic data. In fact, an unfavorable energy level alignment of the charge-transfer triplet state (3CT) with respect to the polymer triplet levels (Tn) could decrease the transfer rate. However, first principles calculations of isolated oligomers (B3LYP/6-311g(d,p)) showed that both silicon and carbon based polymers have very similar level alignment in both ground and excited states (see the ESI† for details), in agreement with more accurate results of GW+BSE calculations.35 One can therefore conclude that the change in the electronic structure is not sufficient to explain the difference in solar cell efficiencies. Hence, the difference should be attributed to different packing of polymer chains, leading to different electrostatic environment for these two polymers as discussed above on the basis of solid-state NMR experiments. As suggested by Rao et al. delocalization of the 3CT states can facilitate the re-dissociation into free charge carriers and effectively suppress the triplet transfer to the polymer. In fact, the higher degree of crystallinity in PSBTBT compared to PCPDTBT6,7 is in accordance with this mechanism. Crystallinity and order may enhance the wavefunction delocalization at the interface, leading to a faster splitting of the interfacial states into free charge carriers. Furthermore, the higher charge carrier mobility in PSBTBT can reduce triplet generation at the interface, as CT-states may re-dissociate more quickly into free charges. However, the PCPDTBT:PC60BM blend prepared with ODT exhibited more triplet generation than the PCPDTBT:PC60BM system prepared without ODT in line with the results recently presented by Chow et al. for the ns–μs timescale,10 which is in contrast to the higher order and increased component demixing in the former. Here, a less efficient triplet generation in the blend prepared without ODT appears to be a consequence of less efficient free charge carrier generation, as the structure is dominated by small domains and a high degree of intermixing causing a significant fraction of geminate recombination on the sub-ns timescale in turn supporting the assignment of triplet formation to non-geminate recombination of free charges. Recently, Di Nuzzo et al. investigated triplet generation in PCPDTBT:PC60BM blends prepared with ODT by cw-PIA measurements.11 The authors concluded that processing with ODT decreased the yield of triplet states. However, cw-PIA measurements yield lifetime and concentration-averaged signals and therefore are difficult to compare. Very recently, Distler et al. reported similar measurements on PSBTBT:PC60BM blends and came to the conclusion that triplet states were not present.12 This does not necessarily disagree with the results presented by us, as firstly, the yield of triplets was small in PSBTBT:PC70BM blends and secondly, rapid charge-triplet quenching and triplet–triplet annihilation was observed effectively reducing the triplet state lifetime. Both possibilities most likely lead to the absence of any triplet-induced absorption signal in steady-state PIA measurements.
Does triplet state formation by non-geminate recombination play a role for the photovoltaic performance at one-sun illumination conditions? In our TA experiments the lowest charge carrier density at which we could still achieve a reasonable signal-to-noise ratio was around 2 × 1017 cm−3. Chow et al. performed TA experiments at even smaller carrier densities between 1016–1017 1/cm−3, which explains the slower triplet generation observed in their experiments and supports that they are created by non-geminate recombination of free charges.10 The free charge carrier density of a solar cell operated at open-circuit conditions was determined to be between 1016 and 1017 cm−3 by Credgington et al. using a charge extraction experiment.36 This implies that our lowest excitation densities were close to solar operating conditions and thus, the effects observed in our experiments could indeed play a role for the photovoltaic performance.
However, the quantitative analysis of the generation and recombination rates is difficult as the absolute cross-sections of the invoked excited states are unknown. Nevertheless, some conclusions regarding the device performance can be drawn from the blend's IQE estimated from the EQE measurements and the film absorption following the approach recently published by Burkhard et al.37 In the case of PSBTBT:PC70BM, we obtained a maximum IQE of 73%, which is in excellent agreement with measurements recently presented by Albrecht et al.24a This implies that about 30% of the initial photoexcitations are somehow lost in PSBTBT:PC70BM. The comparably high fill-factor of the photovoltaic devices further indicates that losses are mainly due to field-independent processes and that charge generation was only weakly field-dependent.24a In contrast in PCPDTBT:PC60BM blends prepared with ODT the maximum IQE was determined to 52%. The lower IQE and fill-factor of the devices (see Fig. 2) point to faster non-geminate recombination, which is in good agreement with the high triplet generation yield. Due to the early (sub-100 ps) onset of non-geminate recombination, a meaningful quantification of the geminate losses in this material system was difficult. However, literature reports confirm that geminate recombination in PCPDTBT:PC60BM prepared with ODT is reduced compared to the blend prepared without ODT.30 In fact, for the latter a much lower IQE of only 28% was calculated. We note that in our previous study of the photophysics of PCPDTBT:PC60BM we determined the amount of geminate recombination from the decay of the ground state bleach on the first 2 ns based on the assumption that non-geminate recombination did not play a role on this time scale.5d This is true for the lowest fluence used in this work, which showed little triplet generation. Hence, a fraction of geminate recombination of about 50% as reported previously is a good estimate of the upper limit. Apart from fast non-geminate recombination competing with charge extraction, the fill-factors of PCPDTBT:PC60BM blends are also affected by field-dependent charge generation as recently demonstrated by Albrecht et al.24b Finally we add that in contrast to the TA measurements very recently presented by Tamai et al. our experiments did not unambiguously reveal a difference between polarons in disordered and ordered polymer regions.13 We found the charge-induced absorption around 1000 nm assigned to polarons in disordered regions by Tamai et al. to be rather weak in our samples. A likely explanation is that our PSBTBT polymer had a significantly higher molecular weight of Mn = 16.000 g mol−1 and Mw = 60.000 g mol−1 and thus could be much better ordered having mostly semicrystalline regions than the PSBTBT used by Tamai et al., which had a Mn and Mw of only 8.500 g mol−1 and 17.000 g mol−1, respectively, and likely more disordered regions.
Conclusions
The charge generation in the low-bandgap polymer:fullerene blends PCPDTBT:PC60BM and PSBTBT:PC70BM depends on the blend's nanoscale morphology. In PCPDTBT:PC60BM blends the nanoscale morphology is clearly affected by solvent additives as revealed by 2D solid-state NMR experiments. Enhanced demixing induced by solvent additives turns on diffusion-limited exciton dissociation on a sub-10 ps timescale as larger polymer-rich domains are created. Without solvent additives an intimately mixed blend is obtained and charge transfer after excitation of the polymer is exclusively ultrafast. However, after excitation of the fullerene-rich domains diffusion-limited exciton dissociation is always observed. The exciton dissociation dynamics in PSBTBT:PC70BM blends closely resemble those of the PCPDTBT:PC60BM blend prepared with solvent additives as the demixing of the blend's components is enhanced by the higher degree of molecular order for the PSBTBT-rich domains even without the use of solvent additives as demonstrated by our solid-state NMR experiments. Apart from the generation of free charge carriers the evolution of another excited state is observed on the sub-ns timescale as confirmed by evolving factor analysis of the NIR TA data. Model-free multivariate curve resolution of the TA data surface shows that the onset of generation of the second component is intensity-dependent and a comparison of the component-associated spectra extracted by MCR-ALS with the spectra of charges and triplets obtained from independent sensitization experiments allows to assign the second component to the polymer's triplet state likely created by non-geminate recombination of free charges. A comparison of the triplet dynamics of the different polymer:fullerene blends reveals that triplet state generation is suppressed in PSBTBT:PC70BM compared to PCPDTBT:PC60BM prepared with ODT, most likely due to the enhanced crystallinity of the PSBTBT polymer suppressing the encounter of charges at the interface, enhancing the delocalization of interface states, and thereby reducing the non-geminate recombination of free charges in turn leading to the significantly higher device performance for PSBTBT:PC70BM blends compared to PCPDTBT:PC60BM blends.Acknowledgements
F. Etzold acknowledges financial support from the Max Planck Graduate Center (MPGC) with the Johannes Gutenberg-University Mainz and from the Deutsche Forschungsgemeinschaft (DFG) in the framework of the priority program 1355 (SPP 1355) “Elementary Processes in Organic Photovoltaics” and R. Tilch for help with sample preparation. F. Laquai thanks the Max Planck Society for funding the Max Planck Research Group. I.A. Howard thanks the Alexander von Humboldt Foundation and the Max Planck Society for research scholarships. N. Forler acknowledges a research scholarship of the Max Planck Society. M. R. Hansen acknowledges financial support from the Villum Foundation under the Young Investigator Programme (VKR023122). A. Melnyk thanks the Graduate School Materials Science in Mainz (MAINZ) for support.Notes and references
- (a) Z. He, C. Zhong, S. Su, M. Xu, H. Wu and Y. Cao, Nat. Photonics, 2012, 6, 591 Search PubMed; (b) J. You, C. C. Chen, Z. Hong, K. Yoshimura, K. Ohya, R. Xu, S. Ye, J. Gao, G. Li and Y. Yang, Adv. Mater., 2013, 25, 3973 CrossRef CAS PubMed.
- E. Bundgaard and F. C. Krebs, Sol. Energy Mater. Sol. Cells, 2007, 91, 954 CrossRef CAS PubMed.
- (a) D. Mühlbacher, M. Scharber, M. Morana, Z. Zhu, D. Waller, R. Gaudiana and C. Brabec, Adv. Mater., 2006, 18, 2884 CrossRef; (b) J. Hou, H.-Y. Chen, S. Zhang, G. Li and Y. Yang, J. Am. Chem. Soc., 2008, 130, 16144 CrossRef CAS PubMed.
- (a) J. Peet, J. Y. Kim, N. E. Coates, W. L. Ma, D. Moses, A. J. Heeger and G. C. Bazan, Nat. Mater., 2007, 6, 497 CrossRef CAS PubMed; (b) J. K. Lee, W. L. Ma, C. J. Brabec, J. Yuen, J. S. Moon, J. Y. Kim, K. Lee, G. C. Bazan and A. J. Heeger, J. Am. Chem. Soc., 2008, 130, 3619 CrossRef CAS PubMed.
- (a) Z. Li and C. R. McNeill, J. Appl. Phys., 2011, 109, 074513 CrossRef PubMed; (b) S. Cho, J. K. Lee, J. S. Moon, J. Yuen, K. Lee and A. J. Heeger, Org. Electron., 2008, 9, 1107 CrossRef CAS PubMed; (c) I. W. Hwang, S. Cho, J. Y. Kim, K. Lee, N. E. Coates, D. Moses and A. J. Heeger, J. Appl. Phys., 2008, 104 Search PubMed; (d) F. Etzold, I. A. Howard, N. Forler, D. M. Cho, M. Meister, H. Mangold, J. Shu, M. R. Hansen, K. Mullen and F. Laquai, J. Am. Chem. Soc., 2012, 134, 10569 CrossRef CAS PubMed.
- H.-Y. Chen, J. Hou, A. E. Hayden, H. Yang, K. N. Houk and Y. Yang, Adv. Mater., 2010, 22, 371 CrossRef CAS PubMed.
- M. Morana, H. Azimi, G. Dennler, H.-J. Egelhaaf, M. Scharber, K. Forberich, J. Hauch, R. Gaudiana, D. Waller, Z. Zhu, K. Hingerl, S. S. van Bavel, J. Loos and C. J. Brabec, Adv. Funct. Mater., 2010, 20, 1180 CrossRef CAS.
- A. A. Y. Guilbert, J. M. Frost, T. Agostinelli, E. Pires, S. Lilliu, J. E. Macdonald and J. Nelson, Chem. Mater., 2013, 26, 1226 CrossRef.
- A. Rao, P. C. Chow, S. Gelinas, C. W. Schlenker, C. Z. Li, H. L. Yip, A. K. Jen, D. S. Ginger and R. H. Friend, Nature, 2013, 500, 435 CrossRef CAS PubMed.
- P. C. Y. Chow, S. Gélinas, A. Rao and R. H. Friend, J. Am. Chem. Soc., 2014, 136, 3424 CrossRef CAS PubMed.
- D. Di Nuzzo, A. Aguirre, M. Shahid, V. S. Gevaerts, S. C. J. Meskers and R. A. J. Janssen, Adv. Mater., 2010, 22, 4321 CrossRef CAS PubMed.
- A. Distler, P. Kutka, T. Sauermann, H.-J. Egelhaaf, D. M. Guldi, D. Di Nuzzo, S. C. J. Meskers and R. A. J. Janssen, Chem. Mater., 2012, 24, 4397 CrossRef CAS.
- Y. Tamai, K. Tsuda, H. Ohkita, H. Benten and S. Ito, Phys. Chem. Chem. Phys., 2014, 16, 20338 RSC.
- (a) M. Mehring, Bunsen-Ges. Phys. Chem. Ber., 1996, 100, 1091 CrossRef CAS; (b) S. Cadars, A. Lesage, C. J. Pickard, P. Sautet and L. Emsley, J. Phys. Chem. A, 2009, 113, 902 CrossRef CAS PubMed.
- (a) R. C. Nieuwendaal, H. W. Ro, D. S. Germack, R. J. Kline, M. F. Toney, C. K. Chan, A. Agrawal, D. Gundlach, D. L. VanderHart and D. M. Delongchamp, Adv. Funct. Mater., 2012, 22, 1255 CrossRef CAS; (b) J. Shu, D. Dudenko, M. Esmaeili, J. H. Park, S. R. Puniredd, J. Y. Chang, D. W. Breiby, W. Pisula and M. R. Hansen, J. Am. Chem. Soc., 2013, 135, 11075 CrossRef CAS PubMed; (c) D. Dudenko, A. Kiersnowski, J. Shu, W. Pisula, D. Sebastiani, H. W. Spiess and M. R. Hansen, Angew. Chem., Int. Ed., 2012, 51, 11068 CrossRef CAS PubMed; (d) K. R. Graham, C. Cabanetos, J. P. Jahnke, M. N. Idso, A. El Labban, G. O. Ngongang Ndjawa, T. Heumueller, K. Vandewal, A. Salleo, B. F. Chmelka, A. Amassian, P. M. Beaujuge and M. D. McGehee, J. Am. Chem. Soc., 2014, 136, 9608 CrossRef CAS PubMed.
- P. M. Beaujuge, H. N. Tsao, M. R. Hansen, C. M. Amb, C. Risko, J. Subbiah, K. R. Choudhury, A. Mavrinskiy, W. Pisula, J.-L. Brédas, F. So, K. Müllen and J. R. Reynolds, J. Am. Chem. Soc., 2012, 134, 8944 CrossRef CAS PubMed.
- (a) A. Gitsas, G. Floudas, M. Mondeshki, I. Lieberwirth, H. W. Spiess, H. Iatrou, N. Hadjichristidis and A. Hirao, Macromolecules, 2010, 43, 1874 CrossRef CAS; (b) L. Jasinska-Walc, M. Villani, D. Dudenko, O. van Asselen, E. Klop, S. Rastogi, M. R. Hansen and C. E. Koning, Macromolecules, 2012, 45, 2796 CrossRef CAS.
- W. P. Rothwell and J. S. Waugh, J. Chem. Phys., 1981, 74, 2721 CrossRef CAS PubMed.
- (a) L. A. Perez, K. W. Chou, J. A. Love, T. S. van der Poll, D.-M. Smilgies, T.-Q. Nguyen, E. J. Kramer, A. Amassian and G. C. Bazan, Adv. Mater., 2013, 25, 6380 CrossRef CAS PubMed; (b) A. Sharenko, D. Gehrig, F. Laquai and T.-Q. Nguyen, Chem. Mater., 2014, 26, 4109 CrossRef CAS.
- M. C. Scharber, M. Koppe, J. Gao, F. Cordella, M. A. Loi, P. Denk, M. Morana, H.-J. Egelhaaf, K. Forberich, G. Dennler, R. Gaudiana, D. Waller, Z. Zhu, X. Shi and C. J. Brabec, Adv. Mater., 2010, 22, 367 CrossRef CAS PubMed.
- D. Niedzialek, V. Lemaur, D. Dudenko, J. Shu, M. R. Hansen, J. W. Andreasen, W. Pisula, K. Müllen, J. Cornil and D. Beljonne, Adv. Mater., 2013, 25, 1939 CrossRef CAS PubMed.
- (a) J. T. Rogers, K. Schmidt, M. F. Toney, E. J. Kramer and G. C. Bazan, Adv. Mater., 2011, 23, 2284 CrossRef CAS PubMed; (b) P. M. Beaujuge and J. M. J. Fréchet, J. Am. Chem. Soc., 2011, 133, 20009 CrossRef CAS PubMed.
- D. Di Nuzzo, L. J. A. Koster, V. S. Gevaerts, S. C. J. Meskers and R. A. J. Janssen, Adv. Energy Mater., 2014, 4 DOI:10.1002/aenm.201400416.
- (a) S. Albrecht, K. Vandewal, J. R. Tumbleston, F. S. U. Fischer, J. D. Douglas, J. M. J. Fréchet, S. Ludwigs, H. Ade, A. Salleo and D. Neher, Adv. Mater., 2014, 26, 2533 CrossRef CAS PubMed; (b) S. Albrecht, W. Schindler, J. Kurpiers, J. Kniepert, J. C. Blakesley, I. Dumsch, S. Allard, K. Fostiropoulos, U. Scherf and D. Neher, J. Phys. Chem. Lett., 2012, 640 CrossRef CAS.
- I. A. Howard, H. Mangold, F. Etzold, D. Gehrig and F. Laquai, Ultrafast Dynamics in Molecules, Nanostructures and Interfaces, World Scientific, Singapore, 2013 Search PubMed.
- (a) A. de Juan and R. Tauler, Anal. Chim. Acta, 2003, 500, 195 CrossRef CAS; (b) A. de Juan, M. Maeder, M. Martínez and R. Tauler, Chemom. Intell. Lab. Syst., 2000, 54, 123 CrossRef CAS; (c) A. de Juan and R. Tauler, Crit. Rev. Anal. Chem., 2006, 36, 163 CrossRef CAS; (d) J. Jaumot, R. Gargallo, A. de Juan and R. Tauler, Chemom. Intell. Lab. Syst., 2005, 76, 101 CrossRef CAS PubMed.
- (a) R. Huo, R. Wehrens and L. M. C. Buydens, J. Magn. Reson., 2004, 169, 257 CrossRef CAS PubMed; (b) I. Toumi, S. Caldarelli and B. Torrésani, Prog. Nucl. Magn. Reson. Spectrosc., 2014, 81, 37 CrossRef CAS PubMed.
- A. de Juan, J. Jaumot and R. Tauler, Anal. Methods, 2014, 6, 4964 RSC.
- D. W. Gehrig, S. Roland, I. A. Howard, V. Kamm, H. Mangold, D. Neher and F. Laquai, J. Phys. Chem. C, 2014, 118, 20077 CAS.
- P. C. Chow, S. Gelinas, A. Rao and R. H. Friend, J. Am. Chem. Soc., 2014, 136, 3424 CrossRef CAS PubMed.
- (a) A. J. Ferguson, N. Kopidakis, S. E. Shaheen and G. Rumbles, J. Phys. Chem. C, 2011, 115, 23134 CrossRef CAS; (b) I. A. Howard, F. Etzold, F. Laquai and M. Kemerink, Adv. Energy Mater., 2014, 4 Search PubMed, n/a.
- A. A. Bakulin, A. Rao, V. G. Pavelyev, P. H. M. van Loosdrecht, M. S. Pshenichnikov, D. Niedzialek, J. Cornil, D. Beljonne and R. H. Friend, Science, 2012, 335, 1340 CrossRef CAS PubMed.
- S. Westenhoff, I. A. Howard, J. M. Hodgkiss, K. R. Kirov, H. A. Bronstein, C. K. Williams, N. C. Greenham and R. H. Friend, J. Am. Chem. Soc., 2008, 130, 13653 CrossRef CAS PubMed.
- D. Jarzab, F. Cordella, J. Gao, M. Scharber, H.-J. Egelhaaf and M. A. Loi, Adv. Energy Mater., 2011, 1, 604 CrossRef CAS.
- B. Baumeier, M. Rohlfing and D. Andrienko, J. Chem. Theory Comput., 2014, 10, 3104 CrossRef CAS.
- D. Credgington, R. Hamilton, P. Atienzar, J. Nelson and J. R. Durrant, Adv. Funct. Mater., 2011, 21, 2744 CrossRef CAS.
- G. F. Burkhard, E. T. Hoke and M. D. McGehee, Adv. Mater., 2010, 22, 3293 CrossRef CAS PubMed.
Footnotes |
| † Electronic supplementary information (ESI) available: Additional spectroscopic data, information about the EFA and MCR analysis, the residuals of the factorization, and first principle calculations. See DOI: 10.1039/c4ee03630a |
| ‡ Questions regarding the solid-state NMR experiments should be addressed to M. R. Hansen, while all other questions should be addressed to F. Laquai. |
| This journal is © The Royal Society of Chemistry 2015 |