 Open Access Article
Creative Commons Attribution 3.0 Unported Licence
Controlled ligand distortion and its consequences for structure, symmetry, conformation and spin-state preferences of iron(II) complexes†‡
Nicole
Kroll
a,
Kolja
Theilacker
b,
Marc
Schoknecht
a,
Dirk
Baabe
c,
Dennis
Wiedemann
a,
Martin
Kaupp
*b,
Andreas
Grohmann
*a and
Gerald
Hörner
*a
aTechnische Universität Berlin, Institut für Chemie, Sekr. C2, Straße des 17. Juni 135, 10623 Berlin, Germany. E-mail: Gerald.Hoerner@tu-berlin.de; Andreas.Grohmann@tu-berlin.de; Fax: +49 30 314 79656; Tel: +49 30 314 27936
bTechnische Universität Berlin, Institut für Chemie, Theoretische Chemie/Quantenchemie, Sekr. C7, Straße des 17. Juni 135, 10623 Berlin, Germany. E-mail: Martin.Kaupp@tu-berlin.de; Fax: +49 30 314 21075; Tel: +49 30 314 79682
cTechnische Universität Braunschweig, Institut für Anorganische und Analytische Chemie, Hagenring 30, 38106 Braunschweig, Germany. Fax: +49 531 391 5387; Tel: +49 531 391 5383
First published on 13th October 2015
Abstract
The ligand-field strength in metal complexes of polydentate ligands depends critically on how the ligand backbone places the donor atoms in three-dimensional space. Distortions from regular coordination geometries are often observed. In this work, we study the isolated effect of ligand-sphere distortion by means of two structurally related pentadentate ligands of identical donor set, in the solid state (X-ray diffraction, 57Fe-Mössbauer spectroscopy), in solution (NMR spectroscopy, UV/Vis spectroscopy, conductometry), and with quantum-chemical methods. Crystal structures of hexacoordinate iron(II) and nickel(II) complexes derived from the cyclic ligand L1 (6-methyl-6-(pyridin-2-yl)-1,4-bis(pyridin-2-ylmethyl)-1,4-diazepane) and its open-chain congener L2 (N1,N3,2-trimethyl-2-(pyridine-2-yl)-N1,N3-bis(pyridine-2-ylmethyl) propane-1,3-diamine) reveal distinctly different donor set distortions reflecting the differences in ligand topology. Distortion from regular octahedral geometry is minor for complexes of ligand L2, but becomes significant in the complexes of the cyclic ligand L1, where trans elongation of Fe−N bonds cannot be compensated by the rigid ligand backbone. This provokes trigonal twisting of the ligand field. This distortion causes the metal ion in complexes of L1 to experience a significantly weaker ligand field than in the complexes of L2, which are more regular. The reduced ligand-field strength in complexes of L1 translates into a marked preference for the electronic high-spin state, the emergence of conformational isomers, and massively enhanced lability with respect to ligand exchange and oxidation of the central ion. Accordingly, oxoiron(IV) species derived from L1 and L2 differ in their spectroscopic properties and their chemical reactivity.
Introduction
In vitro modelling of the biological function of a metal ion requires both an understanding of the factors governing its reactivity, and their control. An important determinant, which is often difficult to study in isolation from other factors, is the distortion of the ligand sphere as imposed by the biological matrix (cf. the concept of the entatic state1,2). Studies of entasis, both in vivo and in vitro,3–7 are most numerous for copper-based redox catalytic systems. Here, catalytic activity is associated with the mismatch between actual coordination geometry and coordination chemical preference, which is tetrahedral for copper(I) and square planar (pyramidal) for copper(II). We posit that redox processes involving metal centres other than copper are similarly controlled by ligand-field distortion and therefore synthetically addressable. In particular, the electronic nature and reactivity of oxoiron(IV) species deriving from catalytically active iron(II) complexes, both in vivo and in vitro,8–17 are expected to be highly susceptible to ligand-field effects. For instance, variation of the ligand-field strength has been used by Que et al. to tune the spin-state energetics of oxoiron(IV) in a functional model of taurine dioxygenase (TauD) through variation of a donor atom (N vs. O).18In this work, we describe ligand-imposed distortion of the coordination environment as a powerful tool to tune the geometry, electronics and reactivity of a pair of iron(II) complexes. In two closely related N5 ligands of identical donor atom set, distortion of the latter allows us to study the effects of changes in ligand-sphere geometry and symmetry. This approach decouples the metal centre under study from first-order ligand-field strength effects, as induced by donor set variation, either in terms of donor element (e.g., N vs. O, vide supra) or in terms of hybridisation state within one class of donor atom (e.g., sp2 N vs. sp3 N). Control of ligand-field strength19via incremental distortion of the geometry necessitates control of intra-ligand strain20 and thus, synthesis of “tailor-made” polydentate ligands. In previous work, we have provided synthetic access to numerous polydentate nitrogen-dominated ligand systems21,22 and have reported on structures and reactivity of their transition-metal complexes (e.g., iron(II/III/V),23–25 cobalt(II/III),26 copper(II)27).
For the study presented here, we have prepared the cyclic ligand L1 (6-methyl-6-(pyridin-2-yl)-1,4-bis(pyridin-2-ylmethyl)-1,4-diazepane),28,29 and its open-chain congener L2 (N1,N3,2-trimethyl-2-(pyridine-2-yl)-N1,N3-bis(pyridine-2-ylmethyl) propane-1,3-diamine). They both share the trisimine-bisamine donor set of the established pentadentate N5 ligand N-benzyl-N,N′,N′-tris(pyridin-2-ylmethyl)-ethane-1,2-diamine (Bn-TPEN),30,31 but differ in the connectivity and hence, structural flexibility of the central diamine unit (Scheme 1).
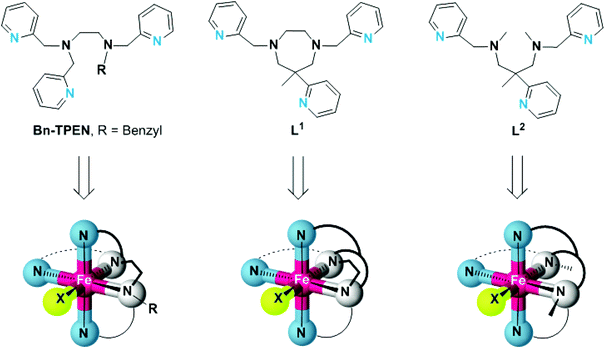 | ||
| Scheme 1 Structures of the pentadentate N5 ligands Bn-TPEN, L1 and L2, and structural sketches of the resulting hexacoordinate iron(II) complexes. | ||
As is detailed here, structures and electronic properties of iron(II) complexes [FeLn(X)] of these ligands reflect the differences in ligand topology and the inherent ligand-field strength of the co-ligand X. We have characterised the constitution, structure, and electronics of their iron(II) complexes in the solid state as well as in solution and by density-functional theory methods. Trigonal distortion of the coordination sphere, as a consequence of the angular constraint in L1, is clearly shown to reduce the ligand-field strength significantly, thereby favouring electronic high-spin states of the iron(II) centres. Preliminary results indicate that ligand-imposed distortion also causes the related oxoiron(IV) species to show distinctly different spectroscopic properties and reactivity.
Results and discussion
Ligand synthesis
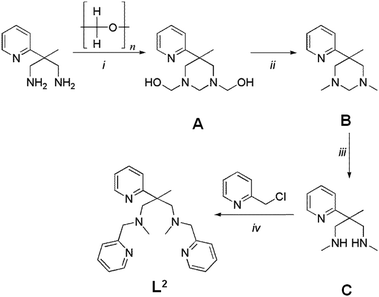
Synthetic details for the 1,4-diazepane-based ligand L1 have been given in a previous publication.29 The open-chain ligand L2 was prepared from 2-methyl-2-(pyridine-2-yl)-propane-1,3-diamine32 in four steps with an overall yield of ca. 40%, (Scheme 2). Experimental details and analytical results are given in the Experimental section.
1H-NMR spectra of the ligands in CDCl3 are unexceptional. A 2![[thin space (1/6-em)]](https://www.rsc.org/images/entities/char_2009.gif) :
:![[thin space (1/6-em)]](https://www.rsc.org/images/entities/char_2009.gif) 1 intensity pattern in the pyridine-based resonances indicates (time-averaged) Cs symmetry in solution in both cases. The spectra of both ligands are overall similar. This suggests similar structural preferences in solution, i.e., the structural constraints of the diazepane ring in L1 (Scheme 1) do not restrict the conformational space of the picolyl donor groups to a significant extent.
1 intensity pattern in the pyridine-based resonances indicates (time-averaged) Cs symmetry in solution in both cases. The spectra of both ligands are overall similar. This suggests similar structural preferences in solution, i.e., the structural constraints of the diazepane ring in L1 (Scheme 1) do not restrict the conformational space of the picolyl donor groups to a significant extent.
Coordination chemistry of L1 and L2
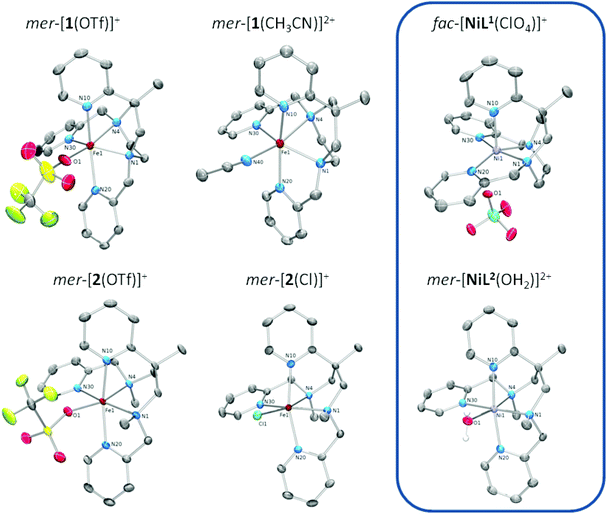 | ||
| Fig. 1 Structures of the complex cations of iron(II) and nickel(II) complexes of the ligands L1 (top) and L2 (bottom)); ‘mer’ and ‘fac’ refer to the juxtaposition of the three pyridine donors (see Scheme 3). ORTEP representations with displacement ellipsoids at the 50% probability level; hydrogen atoms and counter ions omitted for clarity. | ||
| [1(X)]Y | [2(X)]Y | |||||
|---|---|---|---|---|---|---|
X = Cl−, Y = PF6−![[thin space (1/6-em)]](https://www.rsc.org/images/entities/char_2009.gif) a a |
X = Br−, Y = PF6−![[thin space (1/6-em)]](https://www.rsc.org/images/entities/char_2009.gif) a a |
X = Y = OTf− | X = MeCN, Y = (BPh4−)2 | X = Cl−, Y = PF6− | X = Y = OTf− | |
| a Data from ref. 29. b Oxygen atom O1 is disordered over two positions (O1A, O1B): parameters involving O1A are given in the table; d(Fe1–O1B) = 204.5(8) pm; angle(N1–Fe1–O1B) = 167.3(3)°; Σ = 149.3° (for O1B); S(Oh) = 5.15 (for O1B). c Fe–N bond-length variation in the N4 equatorial plane. d N10/N20/N30/N1 torsion angle. e Continuous shape measure for octahedral coordination. f Continuous shape measure for trigonal prismatic coordination. | ||||||
| Bond lengths | ||||||
| Fe1–N1 | 218.78(17) | 218.7(3) | 218.0(2) | 216.05(15) | 223.12(16) | 219.54(15) |
| Fe1–N4 | 233.73(17) | 231.1(3) | 227.4(2) | 228.05(15) | 233.01(15) | 221.01(16) |
| Fe1–N10 | 216.25(18) | 215.9(3) | 215.8(2) | 214.47(15) | 218.37(15) | 216.26(16) |
| Fe1–N20 | 226.33(18) | 225.9(3) | 226.3(2) | 228.84(16) | 216.92(15) | 217.25(16) |
| Fe1–N30 | 213.17(18) | 213.4(3) | 213.2(2) | 210.50(15) | 220.00(16) | 216.69(16) |
| Fe1–X | 237.38(6) | 253.97(6) | 214.1(7)b | 214.45(16) | 238.84(5) | 211.94(14) |
| Bond angles | ||||||
| N1–Fe1–N4 | 71.15(6) | 71.70(11) | 72.50(8) | 72.41(6) | 86.56(6) | 92.16(6) |
| N1–Fe1–N30 | 139.23(7) | 140.16(12) | 141.30(9) | 141.08(6) | 160.92(6) | 169.10(6) |
| N4–Fe1–X | 167.17(5) | 168.04(8) | 167.7(4) | 166.61(6) | 166.66 (4) | 163.31(6) |
| N10–Fe1–N20 | 165.00(7) | 164.63(11) | 158.92(9) | 163.91(6) | 163.27 (6) | 163.21(6) |
| Distortion parameters | ||||||
| Σ/° | 134.0 | 142.1 | 145.0b | 140.4 | 89.8 | 81.1 |
| Δdeq/pmc | 13.1 | 12.5 | 13.1 | 18.3 | 6.2 | 3.2 |
| N4 torsiond | 50.2 | 44.8 | 11.1 | 13.9 | ||
| S(Oh)e | 5.09 | 5.22 | 5.95b | 4.80 | 1.86 | 1.84 |
| S(TP)f | 7.38 | 7.96 | 5.19 | 6.45 | 11.31 | 10.06 |
The coordination polyhedron of the iron(II) complexes is a (slightly distorted) octahedron in the case of [2(X)]n+, but fails to obey any regular geometry in the case of [1(X)]n+. The much stronger distortion of the coordination sphere in [1(X)]n+ is obviously due to constraints imposed by its cyclic ligand backbone. In particular, it is the 1,4-diazepane ring that forces and fixes the cis angle subtended by the amine-donor atoms at a value much smaller than the ideal value of 90°. As a consequence, the cis-angle distortion Σ (summed deviation of the 12 cis angles in the polyhedron from 90°)33 is substantially higher for [1(X)]n+ than in [2(X)]n+.
Iron–nitrogen bond lengths are in the range 210 pm < d(Fe–N) < 235 pm in all cases (see Table 1). This clearly indicates iron(II) in its high-spin electronic configuration (hs, S = 2, t2g4eg2),34,35 irrespective of both the nature of the N5 ligand and the identity of the co-ligand. It is noted, however, that UV/Vis and 1H-NMR data of [2(MeCN)]+ in acetonitrile solution at low temperature and Mössbauer spectra of powder samples of [2(MeCN)](OTf)2 reveal significant contributions of low-spin iron(II) (ls, S = 0, t2g6eg0) (vide infra). While XRD data of the acetonitrile complex of L2 are as yet unavailable (single crystals could not be obtained), its behaviour in solution and in the solid state resembles the closely related N5 ligand Bn-TPEN, whose iron(II) complex with coordinated acetonitrile [Fe(Bn-TPEN)(CH3CN)]2+ shows low-spin characteristics in the solid state and in solution.30
The Fe–N bonds trans to the co-ligands X, which involve one of the amine N atoms, are elongated in the solid-state structures (Fe1–N4 in Fig. 1 and Table 1) owing to the operation of a strong trans influence. This causes secondary structural effects, which are distinctly different between the two types of N5 ligand.
Firstly, complexes of the ring-derived ligand L1 show substantial scatter among the Fe−N bond lengths in the N4 equatorial plane. In Fig. 2a, for both [1(X)]n+ and [2(X)]n+, the maximum variation in the bond lengths, Δdeq, is illustrated by a plot against the (essentially invariant) average Fe−N bond lengths in the N4 equatorial plane, ![[d with combining overline]](https://www.rsc.org/images/entities/i_char_0064_0305.gif) eq. Secondly, there is massive distortion from planarity within this N4 donor set only in the case of [1(MeCN)](OTf)2 (torsion amounts to 50°; Fig. S1‡). In conclusion, angular distortion and bond-length scatter are correlated with each other. Both reflect the different degrees of structural feedback within the ligands.
eq. Secondly, there is massive distortion from planarity within this N4 donor set only in the case of [1(MeCN)](OTf)2 (torsion amounts to 50°; Fig. S1‡). In conclusion, angular distortion and bond-length scatter are correlated with each other. Both reflect the different degrees of structural feedback within the ligands.
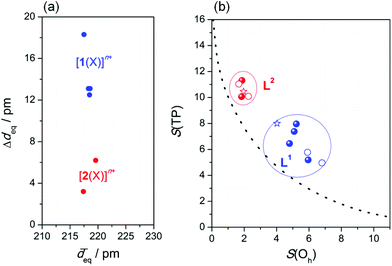 | ||
| Fig. 2 Ligand-imposed distortion of the coordination sphere: (a) Bond-length variation Δdeq within the N4 equatorial plane; (b) continuous shape map of the octahedron ↔ trigonal prism transition (see text); blue: [1(X)]n+; red: [2(X)]n+; line: ideal Bailar twist; filled: XRD-derived structures; open: DFT-optimised structures (B3LYP-D3/def2-TZVP/COSMO(MeCN)); stars: crystal structures of the Ni(II) complexes from Fig. 1. | ||
This having been said, the distorted structure of [1(X)]n+ can be analysed as a blend of octahedral and trigonal-prismatic arrangements; i.e., the trigonal Bailar twist angle θ between co-facial donor triads (see Fig. S2‡) amounts to 27.5°, intermediate between an ideal octahedron (θ = 60°) and a regular trigonal prism (θ = 0°). Thus, the spatial arrangement of donor atoms in L1 supplies the central atom with a ligand field poised between tetragonal and trigonal symmetry. This conclusion is supported by an analysis of continuous symmetry/shape measures S(Oh) and S(TP),36,37 which quantify the deviation from regular octahedral and trigonal-prismatic geometry, respectively.
In Fig. 2b, the S(Oh) and S(TP) values of the iron(II) complexes (from Table 1; DFT-derived data from Table S3‡) are given as a continuous shape map of the octahedron ↔ trigonal prism transition along the trigonal Bailar twist (line).38 Evidently, the complexes of either ligand are in distinctly separated regions of this map. The values for S(Oh), which is zero for an ideal octahedron, cluster around S(Oh) = 6 ± 1, for complexes [1(X)]n+ of the constrained ligand L1, but are substantially smaller for complexes [2(X)]n+ of the open-chain ligand L2 (S(Oh) = 2.0 ± 0.5).
Characterisation of [1(X)]n+ and [2(X)]n+ in solution
Solutions of [1(X)]n+ and [2(X)]n+ in acetonitrile and dichloromethane have been characterised by 1H- and 19F-NMR spectroscopy, AC conductometry, and UV/Vis spectroscopy. The results are summarised in Table 2.| [1(OTf)](OTf) | [2(OTf)](OTf) | |||
|---|---|---|---|---|
| Solvent | DCM | MeCN | DCM | MeCN |
| Dominant Species | [1(OTf)]+ | [1(MeCN)]2+ | [2(OTf)]+ | [2(MeCN)]2+ |
| a Measured at T = 233 K. b Concentration c = 1.3 × 10⁻³ mol L−1. | ||||
| NMR | ||||
| δ H [ppm] | [−2; 115] | [−5; 92] | [−7; 86] | [−1; 44] [1.5; 9.8]a |
| δ F [ppm]/fwhm [Hz] | −76.0/18 | −72.9/16 | −76.2/18 | −79.0/13 |
| −1.8/38 | −2.0/39 | |||
| Conductometry | ||||
| Λ [S mol−1 cm2]b | 18.5 | 228 | 15.4 | 276 |
| UV/Vis | ||||
| λ max [nm] | 372 | 370 | — | 398 |
| ε max [cm−1 L mol−1] | 1.200 | 1.100 | — | 6.700 |
Both types of experiment indicate the dissociation of coordinated triflate upon solvation in acetonitrile. 19F-NMR spectra of both compounds in (D3)-acetonitrile show a single resonance located at δ = −72.9 ppm and −79.0. ppm for [1(X)]n+ and [2(X)]n+, respectively. The peak width (fwhm; full-width at half-maximum) is ca. 15 Hz in both cases. Spectral signature, chemical shifts and peak width are as expected for free triflate ion.39,40 A molar conductivity in the range 227 S mol−1 cm2 < Λ < 277 S mol−1 cm2 indicates the (predominant) presence of a 2![[thin space (1/6-em)]](https://www.rsc.org/images/entities/char_2009.gif) :
:![[thin space (1/6-em)]](https://www.rsc.org/images/entities/char_2009.gif) 1 electrolyte, and thus the formation of di-cationic complexes upon dissolution of the triflato complexes in acetonitrile, most probably [1(CH3CN)]2+ and [2(CH3CN)]2+.
1 electrolyte, and thus the formation of di-cationic complexes upon dissolution of the triflato complexes in acetonitrile, most probably [1(CH3CN)]2+ and [2(CH3CN)]2+.
In (D2)-dichloromethane solution, the 19F-NMR spectra of [1(X)]n+ and [2(X)]n+ consist of two signals of equal area, indicating two different chemical environments for triflate in solution in both cases. A resonance at −76 ppm with a fwhm = 18 Hz is characteristic of free triflate, whereas a significantly broadened singlet, shifted strongly downfield at δ = −2 ppm, is attributable to coordinated triflate. Fully consistent with predominating mono-cationic complexes, most probably [1(OTf)]+ and [2(OTf)]+, a molar conductivity in the range 15 S mol−1 cm2 < Λ < 19 S mol−1 cm2 suggests the presence of a 1![[thin space (1/6-em)]](https://www.rsc.org/images/entities/char_2009.gif) :
:![[thin space (1/6-em)]](https://www.rsc.org/images/entities/char_2009.gif) 1 electrolyte.41 The speciation of the complexes in solution is fully corroborated by 57Fe-Mössbauer spectroscopic studies of powder samples prepared from these solutions via rapid precipitation (vide infra).
1 electrolyte.41 The speciation of the complexes in solution is fully corroborated by 57Fe-Mössbauer spectroscopic studies of powder samples prepared from these solutions via rapid precipitation (vide infra).
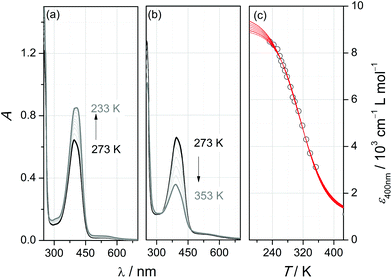
In agreement with this assignment, the intensity of the band is affected by temperature: at low temperature (Fig. 3a), a further increase to εmax = 8400 cm−1 L mol−1 accompanies a slight red-shift to λmax = 406 nm, whereas at elevated temperature (Fig. 3b), the band is successively bleached and blue-shifted (λmax = 388 nm at T = 353 K). This behaviour is typical of thermal spin-crossover (SCO) systems (eqn (1)).
| ls-[2(MeCN)]2+⇌hs-[2(MeCN)]2+ | (1) |
In order to extract the thermodynamic parameters of the SCO-induced thermochromism of [2(MeCN)]2+, UV/Vis absorption at λ = 400 nm has been analysed at temperatures between 233 K and 353 K. Because of solvent-inherent limitation of the temperature range, the absorption coefficient of the ls-form was estimated through sigmoidal fitting of the data to a Boltzmann model (Fig. 3c; the array of curves denotes fits with ε(ls) fixed to values between 9000 and 9600 cm−1 L mol−1). Van't Hoff analysis of the SCO equilibrium constants that derive from these data (Fig. S4‡) reflects the uncertainty in the absorption coefficients. Within the given range of ε(ls), the enthalpy and entropy of SCO vary between ΔSCOHm = 19.8–22.7 kJ mol−1 and ΔSCOSm = 64.8–72.8 J K−1 mol−1, respectively, with a turnover temperature T1/2 = 310(5) K.
Our interpretation of the thermochromism of [2(MeCN)]2+ in terms of an SCO equilibrium between hs and ls forms is corroborated by the temperature dependence of its 1H-NMR spectra in (D3)-acetonitrile (Fig. S5‡). The proton resonances in the room-temperature spectrum are widely spread between 44 ppm > δ > −1 ppm and substantially broadened (typically 300 Hz > fwhm > 70 Hz) with respect to the spectrum of the free ligand. These findings indicate the presence in solution of paramagnetic species. On decreasing the temperature, the spectral range of resonances becomes successively narrower, accompanied by narrowing of the individual resonance profiles. At T = 233 K, close to the freezing point of (D3)-acetonitrile, sharp lines with partially resolved JHH coupling patterns are recorded within the range of 10 ppm > δ > 1 ppm; that is, the SCO equilibrium has shifted to the diamagnetic ls form of [2(MeCN)]2+.
By contrast, both the 1H-NMR and UV/Vis spectra (λmax = 370 nm; εmax = 1100 cm−1 L mol−1 at T = 233 K and 298 K) of [1(OTf)](OTf) solutions in acetonitrile clearly indicate the resulting acetonitrile complex to be a high-spin species. This is a consequence of conformational constraints in L1 and is reproduced by computed electronic energies of the SCO (Table 3).
| L1 | L2 | |
|---|---|---|
| B3LYP-D3/def2-TZVP/COSMO(MeCN)//B3LYP-D3/def2-TZVP/COSMO(MeCN). Values in parentheses: B3LYP*/def2-TZVP/COSMO(MeCN)//B3LYP-D3/def2-TZVP/COSMO(MeCN). | ||
| X = OTf | +50.8 (+36.0) | +22.6 (+15.4) |
| X = MeCN | +23.6 (+4.0) | −2.4 (−23.9) |
Optimisations with the B3LYP hybrid functional slightly favour the singlet over the quintet state for [2(MeCN)]2+ but provide a clear preference for the quintet in case of [1(MeCN)]2+ (Table 3). As B3LYP SCO energies had been found previously to artificially favour the hs forms,42 we have also carried out single-point calculations with the modified B3LYP* functional with 15% rather than 20% Hartree-Fock exchange. This functional had been suggested previously to better describe SCO in Fe(II) complexes.42 At B3LYP* level, the singlet preference for [2(MeCN)]2+ is more pronounced, the quintet preference for [1(MeCN)]2+ much smaller (Table 3). Yet, the computed overall difference in the SCO energies of the two complexes remains almost constant around 27 kJ mol−1. The weaker ligand field of the co-ligand OTf in [1(OTf)]+ and [2(OTf)]+ translates into a clear energetic preference for the hs state in both complexes, while comparison of the absolute values signals a marked dependence on the input of the respective N5 ligand.
With the array of electronic SCO energies in hand (Table 3), it was possible to isolate the incremental contributions ascribable to the N5 ligand (δΔSCOEel(N5)) and the co-ligand (δΔSCOEel(X)). Interestingly, both factors are found to contribute similarly to the SCO energies. The incremental contribution of the co-ligand δΔSCOEel(X) (vertical difference in Table 3) amounts to ca. 25–27 kJ mol−1, whereas the distortion-related increment of the N5 ligand δΔSCOEel(N5) (horizontal difference in Table 3) amounts to ca. 26–28 kJ mol−1. The latter value is a good measure of the difference in d-orbital splitting between the ligand fields as supplied by L1 and L2, in fair agreement with energy differences derived from UV/Vis spectroscopy (vide infra).
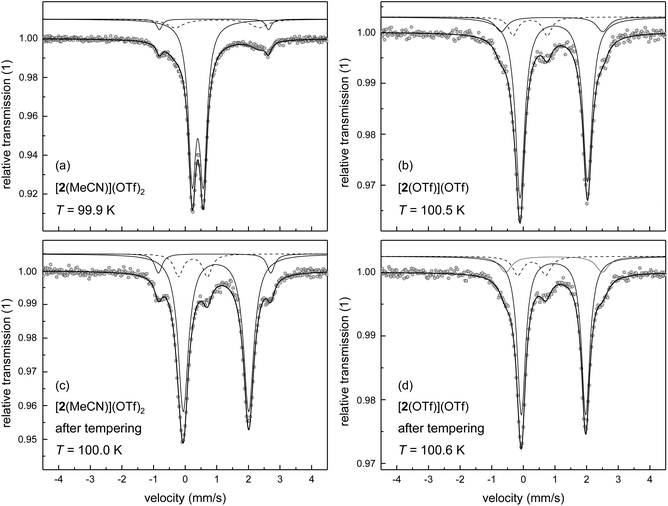
As single crystals of [2(MeCN)](OTf)2 could not be obtained, the spin state of this compound in the solid state has been studied by 57Fe-Mössbauer spectroscopy on polycrystalline (powder) samples. Powders of the triflato complex [2(OTf)](OTf) were taken as a reference system with temperature-invariant hs character. Mössbauer spectra of [2(OTf)](OTf) and [2(MeCN)](OTf)2 were recorded at T ≈ 100 K (Fig. 4a and b) and analysed by least-squares fitting with doublets of Lorentzian lines. The results with focus on the main components of the Mössbauer spectrum are summarised in Table 4. The results corroborate our spin-state assignments from the solution studies and agree with the implications of the DFT-derived SCO energies.
| Volume fraction [%] | δ [mm s−1] | ΔEQ [mm s−1] | Γ HWHM [mm s−1] | ||
|---|---|---|---|---|---|
| a The complete set of Mössbauer parameters and the results of measurements obtained at supplementary temperatures are given in Table S4. b Isomer shift δ is specified relative to metallic iron at room temperature. c Data in square brackets from DFT computation (B3LYP; see Computational Details) of the respective complex cations. d After tempering [2(MeCN)](OTf)2 at T = 350 K for three days under reduced pressure. e After tempering [2(OTf)](OTf) at T = 350 K for four days under reduced pressure. | |||||
| [1(MeCN)](OTf)2 | (1) | 16.1 | 1.220(19) | 2.909(43) | 0.224(35) |
| (2) | 79.5 | 1.066(5) | 2.112(11) | 0.254(9) | |
mer-[1(MeCN)]2+ (S = 2)![[thin space (1/6-em)]](https://www.rsc.org/images/entities/char_2009.gif) c c |
[1.00] | [3.56] | |||
fac-[1(MeCN)]2+ (S = 2)![[thin space (1/6-em)]](https://www.rsc.org/images/entities/char_2009.gif) c c |
[0.99] | [2.66] | |||
| [1(OTf)](OTf) | (1) | 58.7 | 1.098(6) | 3.110(18) | 0.199(12) |
| (2) | 23.5 | 1.138(15) | 2.335(52) | 0.215(35) | |
mer-[1(OTf)]+ (S = 2)![[thin space (1/6-em)]](https://www.rsc.org/images/entities/char_2009.gif) c c |
[1.01] | [3.36] | |||
fac-[1(OTf)]+ (S = 2)![[thin space (1/6-em)]](https://www.rsc.org/images/entities/char_2009.gif) c c |
[1.02] | [2.71] | |||
| [2(MeCN)](OTf)2 | 84.7 | 0.520(1) | 0.353(2) | 0.145(2) | |
| [2(MeCN)]2+; S = 0 c | [0.61] | [0.46] | |||
| [2(OTf)](OTf) | 82.1 | 1.088(3) | 2.123(7) | 0.176(5) | |
[2(OTf)]+ (S = 2)![[thin space (1/6-em)]](https://www.rsc.org/images/entities/char_2009.gif) c c |
[1.00] | [3.53] | |||
| [2(OTf)]+; S = 0 c | [0.77] | [1.16] | |||
| [2(MeCN)](OTf)2d | 82.6 | 1.097(2) | 2.069(4) | 0.196(3) | |
| [2(OTf)](OTf) e | 72.2 | 1.076(3) | 2.033(6) | 0.158(4) | |
The Mössbauer spectra of [2(OTf)](OTf) were analysed by use of three sub-spectra (Fig. 4b), whereby the main signal (volume fraction >80%) with an isomer shift of δ = 1.088 mm s−1 and quadrupole splitting of ΔEQ = 2.123 mm s−1 is clearly attributable to a hs iron(II) complex, which corroborates the results of the solution studies of spin state and speciation discussed above. Minor amounts of ls iron(II) (volume fraction ≈9%) with isomer shift of δ = 0.342 mm s−1 and quadrupole splitting of ΔEQ = 1.077 mm s−1 are assigned to a thermally trapped residual ls iron(II) form of [2(OTf)](OTf); a small amount of hs iron(II) (volume fraction ≈9%) is associated with an impurity, which has been introduced in the preparation process.
The material formulated as [2(MeCN)](OTf)2, as deduced from 19F-NMR spectra, thermochromism and elemental analysis, gives Mössbauer spectra typical of ls iron(II) complexes with only minor distortions from octahedral geometry (Fig. 4a). The major component of the spectrum (volume fraction >80%) provides a doublet of small isomer shift of δ = 0.520 mm s−1 and quadrupole splitting of ΔEQ = 0.353 mm s−1. The additional signals in the spectrum with larger splitting indicate minor amounts of two different residual hs iron(II) species. The signal with approx. 4% volume fraction (ΔEQ = 3.452 mm s−1) is associated with an impurity, as described for [2(OTf)](OTf). The second hs signal with ca. 11% volume fraction (ΔEQ = 2.659 mm s−1) may be assigned as either the thermally trapped hs form of [2(MeCN)](OTf)2, or as [2(OTf)](OTf) formed by thermal ligand exchange in the solid.
The latter process is undoubtedly active at elevated temperature, where it is very efficient: thermal treatment of [2(MeCN)](OTf)2 at T = 350 K for three days under reduced pressure (p ≈ 10 mbar) leads to an almost complete loss of the spectral features of the ls complex (Fig. 4c). The main component (volume fraction >80%) of the spectrum obtained at T ≈ 100 K from the thermally-treated sample shows signatures typical of hs iron(II) complexes (δ = 1.097 mm s−1; ΔEQ = 2.069 mm s−1). For comparison, a similarly obtained spectrum for the thermally treated sample of [2(OTf)](OTf) is shown in Fig. 4d. The spectral appearance and the fit parameters of both thermally treated samples are virtually indistinguishable from the data recorded for native [2(OTf)](OTf) (Fig. 4b). That is, the substitution of coordinated triflate by MeCN, operative in MeCN solutions of [2(OTf)](OTf), is reversed by thermal treatment of solid [2(MeCN)](OTf)2. We note that DFT-derived isomer shifts are in close agreement (data in square brackets in Table 4) with the experimental data.
In agreement with an irreversible spin state change attendant on ligand exchange in the lattice at elevated temperature, SQUID magnetometry between 4 K < T < 390 K (Fig. S6‡) identifies a thermally driven gradual increase of the effective magnetic moment μeff to > 5.2 μB. As is typical for high-spin 3d6 transition metal ions, the observed effective magnetic moment is slightly larger than the expected S = 2 spin-only value of μeff = 4.9 μB, due to spin–orbit interactions and contributions of low-lying orbital states.43 The turnover temperature T1/2 ≈ 320 K is in fair agreement with the value of T1/2 ≈ 310 K obtained by VT-UV/Vis spectroscopy in solution. Notably, the spin-state change of [2(MeCN)]2+, which is reversible in MeCN solution, is found to be irreversible in the solid state.
X-ray crystallography reveals, however, a different situation in the nickel(II) complex [NiL1(ClO4)](ClO4) of the constrained ligand L1 (Fig. 1; Table S2‡). Here, the ligand adopts a topology with all three pyridine donors in a facial arrangement (fac-py3). This causes the sixth coordination site to be trans to one of the pyridine donors. Obviously, ligand L1 is flexible enough to realise two distinctly different arrangements of its donor atoms in the solid state.
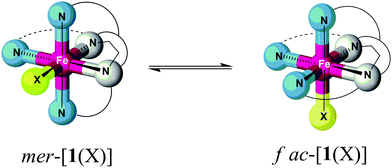
This raises the question whether the preference of the iron(II) complexes for the mer conformation in the solid state is conserved for the isolated complex ions [1(X)]n+ and [2(X)]n+ in solution (Scheme 3). Although we have no definite experimental proof of a conformational equilibrium we will, in the following, discuss results from experiment and theory indicating conformational dynamics in the case of [1(X)]n+.
Stereochemical dynamics of a compound, if compatible with the method's timescale, may be studied with NMR techniques. As discussed above, both complexes, [1(X)]n+ and [2(X)]n+, give rise to paramagnetically shifted resonances at room temperature (Table 2). The number of individual resonances, pertinent to [1(X)]n+ and [2(X)]n+, however, is strikingly different (Fig. S5‡). Eighteen individual resonances (accounting for 28 of the total 29 protons) can be unambiguously resolved in the spectrum of [2(OTf)](OTf) in dichloromethane at room temperature (similar observations apply to [2(MeCN)](OTf)2 in MeCN), indicating that an asymmetric structure of the hs complexes persists in solution. Individual resonances of all of the aromatic protons are resolved in the low-temperature spectra of [2(MeCN)](OTf)2 in MeCN and leave no doubt that asymmetry applies also to its diamagnetic ls form.
By contrast, only ten individual resonances can be detected for complexes of ligand L1. This finding is incommensurate with a (static) asymmetric structure of [1(X)]n+ in solution. We suggest that the apparent symmetry is due to fast stereochemical dynamics within the ligand L1 of [1(X)]n+, giving rise to spectral averaging of different conformers of the complex (Scheme 3).
DFT computations of relevant complex ions containing L1 and L2 were performed to gain insight into the energetics of the anticipated conformational equilibrium (Table 5; cf. Table S3‡ for structural data). In the case of ligand L2, optimisation of the structures of [2(X)]n+ (with X = OTf−, MeCN) clearly points to a preference for the mer conformation in solution. In contrast, energy differences ΔEconf between the isomers of [1(X)]n+ remain below 5 kJ mol−1, which means that, for complexes of ligand L1, a conformational equilibrium in solution must be taken into account.
| mer | fac | |
|---|---|---|
| a Fully optimised structures at B3LYP-D3/def2-TZVP level. Quintet state (S = 2). In parentheses: with COSMO solvent model (MeCN). | ||
| [1(OTf)]+ | 0 | +10.1 (+4.4) |
| [1(MeCN)]2+ | 0 | +4.5 (+4.0) |
| [2(OTf)]+ | 0 | +26.2 (+21.6) |
| [2(MeCN)]2+ | 0 | +22.6 (+22.9) |
In order to test the hypothesis of competing ligand conformations, powder samples have been prepared from solutions of [1(OTf)](OTf) in acetonitrile and dichloromethane by rapid precipitation. As shown above for the complexes of ligand L2, these samples mirror the constitution of the complex in solution; that is, precipitation occurs without significant ligand scrambling. It was thus assumed that rapid precipitation can also “freeze out” conformational dynamics, such that the solid samples will depict also the conformational equilibrium of the complexes [1(X)]n+. If this was actually the case, each conformer must contribute to the Mössbauer spectra individually; that is, two hs components will be visible.
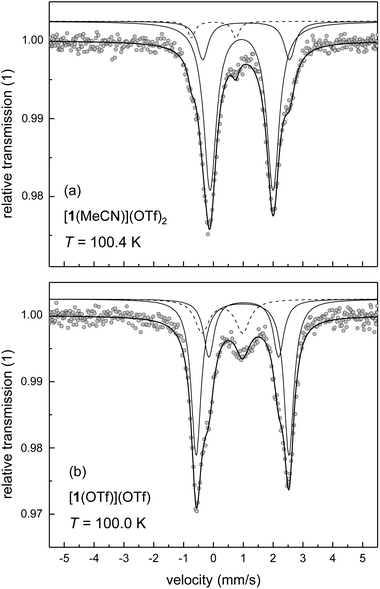
Powder samples of [1(MeCN)](OTf)2 and [1(OTf)](OTf) actually give Mössbauer spectra typical of hs iron(II) complexes (spectra at T ≈ 100 K in Fig. 5; fit parameters of the main components in Table 4). Importantly, the spectra are clearly dominated by two close-lying hs doublets at all temperatures studied (minor impurity signals are observed). We assign this pattern to conformers of the complexes; an assignment of the spectral components to specific complex conformers, i.e., mer vs. fac, is not attempted.
The nature of the co-ligand, MeCN or OTf, significantly affects the appearance of the spectra, with respect to quadrupole splitting and volume fraction. In particular, the quadrupole splitting ΔEQ of [1(OTf)](OTf) is temperature-dependent. Between T = 20 K and 200 K, the quadrupole splitting decreases by ca. 1 mm s−1 with increasing temperature, whereas the quadrupole splitting of [1(MeCN)](OTf)2 is almost invariant with temperature (cf., Table S4‡). In principle, several sources may contribute to the thermal effect on ΔEQ,44,45e.g. concerning the thermal population of the ligand-field multiplets, the presence of spin–orbit interactions, or molecule dynamics (e.g., rotation or vibration of the molecule or parts of it), which then (partially) average out the effective electric field gradient at the 57Fe nucleus site. In the latter case, hindered molecule dynamics disfavours the averaging process at lower temperature. In view of the observed significant crystallographic disorder involving position, conformation and bond distances of coordinated triflate in [1(OTf)](OTf) (see Table 1), we suggest that, at high temperature, stereodynamic mobility of the coordinated triflate ion allows thermal exchange among different rotamers; a process that is frozen out or locked at lower temperature. Consistent with this interpretation, quadrupole splitting at T ≈ 200 K of the spectral components of [1(OTf)](OTf) is indistinguishable from the splitting of [1(MeCN)](OTf)2, but deviates massively at lower temperature.
Quantitative analysis of the volume fractions of the two main components in the spectrum of [1(OTf)](OTf) reveals an apparent temperature dependence. While the main components contribute with ca. 59% and 24% at T = 100 K, these components contribute equally with ca. 42% and 49% at T = 20 K (cf. Table S4‡). We note that, at the same time, the volume fraction of an impurity phase decreases significantly from 18% at T = 100 K to 9% at T = 20 K. These spectral changes are not associated with temperature effects on speciation and/or spin state of the compound, but are artefacts of spectral fitting, due to spectral cross-talk among the components associated either with [1(OTf)](OTf) or the impurity phase. The overall phenomenology reflects the difference in Lamb-Mössbauer factors (and Debye temperatures in the framework of a simple Debye model) of complex and impurity. Between T = 20 K and 200 K, the total spectral area of the related doublets was found to vary by a factor of 5.2 in the case of [1(OTf)](OTf), but only by a factor of 1.2 in the case of the impurity phase. Thus, the Lamb-Mössbauer factor of [1(OTf)](OTf) increases significantly with decreasing temperature, whereas the Lamb-Mössbauer factor of the impurity barely varies with temperature. In consequence, only the Mössbauer data at low temperature, i.e., at T = 20 K give reliable volume fractions that may be associated with different ligand conformations.
Formation of oxoiron(IV) complexes of L1 and L2
As a consequence of ligand-imposed distortion of the coordination sphere, the structures, coordination isomers, and spin states of the iron(II) complexes [1(X)]n+ and [2(X)]n+ differ distinctly. Our preliminary work presented here addresses the question whether these differences affect the formation and reactivity of oxoiron(IV) complexes derived from these precursors. We find that formation kinetics, spectroscopic signature and reactivity of oxoiron(IV) complexes thus obtained are strongly affected by the degree of distortion in the ligand fields as supplied by ligands L1 and L2.[FeIILn(MeCN)]2+ + mCPBA → [LnFeIV![[double bond, length as m-dash]](https://www.rsc.org/images/entities/char_e001.gif) O]2+ + mCBA O]2+ + mCBA | (2) |
Oxoiron(IV) complexes of both ligands, L1 and L2, are accessible in moderate yields by reaction of their iron(II) precursors with equimolar amounts of meta-chloroperbenzoic acid (mCPBA) according to eqn (2). The assignment of the oxoiron(IV) complexes relies on in situ UV/Vis spectroscopic methods and ex situ mass spectrometric analysis, as the limited lifetimes of the metastable products interfered with their isolation and bulk chemical analysis.
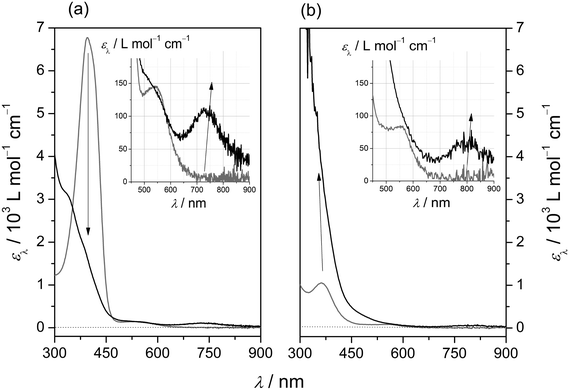
Reactions of dilute solutions (0.1 mmol L−1 < [Fe] < 5 mmol L−1) of the iron(II) precursors [1(OTf)](OTf) and [2(OTf)](OTf) in acetonitrile with equimolar amounts of mCPBA proceed with characteristic UV/Vis-spectroscopic response (Fig. 6; data in Table 6). In both cases, diagnostic absorption bands at λ = 810 nm and λ = 730 nm are recorded in the visible spectral region, for [1(O)]2+ and [2(O)]2+, respectively. It is noted that in the case of [1(O)]2+ (Fig. 6, right panel) measurements had to be performed at T = 233 K, due to the high intrinsic reactivity of the oxoiron(IV) species at room temperature. While the peak positions of these absorption bands agree with values reported for other oxoiron(IV) species, the molar absorption coefficients are somewhat smaller than the majority of published values.10 Although we cannot rule out intrinsically small values, we assume sub-stoichiometric formation of the oxoiron(IV) species.
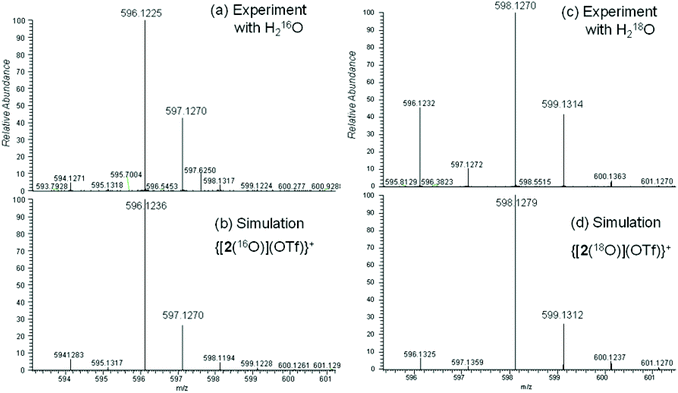
Further arguments in favour of our assignment derive from ESI mass-spectrometric (ESI-MS) analysis of acetonitrile solutions of [2(OTf)](OTf) after reaction with iodosobenzene, PhIO. Formal addition of one oxygen atom to the complex fragment [Fe(L2)] ([2]) is indicated by diagnostic signals in the mass spectra. Dominant signals (50%) at m/z = 596.1226 (calc. for [C24H29N5FeO4F3S]+: m/z = 596.1236) are assigned to {[2(O)](OTf)}+ (Fig. 7a and b). Weak signals at m/z = 223.5856 (calc. for [C23H29N5FeO]2+: m/z = 223.5855) indicate small amounts of native [2(O)]2+. Experiments in the presence of 18OH2 gave strong signals (60%) at m/z = 598.1268 (calc. for [C24H29N5Fe18O16O3F3S]+: m/z = 598.1279) (Fig. 7c and d). Weak signals at m/z = 224.5875 (calc. for [C23H29N5Fe18O]2+: m/z = 224.5877) are indicative of native [2(18O)]2+. The signals show that speciation is consistent, but they also highlight the presence of 18O in the oxidation products of interest. This suggests isotope exchange between 18OH2 and the product of the mCPBA-induced oxidation reaction, providing conclusive evidence for the formation of an oxoiron(IV) complex of ligand L2.46
Mass-spectrometric analysis failed to provide direct evidence for the formation of the corresponding oxoiron(IV) complex of ligand L1. This failure is probably due to the complex's high intrinsic reactivity: the UV/Vis spectra recorded directly after mixing the reactants at room temperature have no feature attributable to an oxoiron(IV) species; rather, they are assignable to the products of the latter's rapid intramolecular decay. Current work seeks to clarify the decay pathway.
Differences in the long-wavelength absorption maxima of both oxoiron(IV) species reflect their diverging electronic properties. In particular, the oxoiron(IV) complex of the constrained ligand L1 exhibits a ligand-field strength significantly weaker than that of its less-strained congener. The difference of ca. 100 nm in the positions of their long-wavelength d → d absorption bands translates into a difference in the excitation energy of ca. 20 kJ mol−1. We note that this ligand-imposed energy difference ties in nicely with the DFT-derived ligand-imposed differences in ligand-field splitting (Table 3).
Differences between the complexes also extend to the formation kinetics. In the case of ligand L1, the growth of the characteristic long-wavelength band at 810 nm is limited by the mixing time of the substrates (tmix ≈ 2 s). Growth is already complete by the time the first reaction spectrum is recorded. This behaviour is quite remarkable, as these experiments were performed at low temperature (T = 233 K), pointing to a very labile iron(II) precursor. These indications of a labile ligand sphere and a weakened ligand field in the case of the oxoiron(IV) species of L1 are both in line with our “distortion hypothesis”. Accordingly, the less distorted iron(II) precursor, of ligand L2, forms the oxoiron(IV) species much more slowly, completing the reaction after ca. 15 minutes at ambient temperature.
Conclusions
In the present work, we have established incremental ligand-field distortion as a tool to tune the structural, conformational and spin-state preferences of iron(II) complexes, in ligand fields set up by two pentadentate N5 ligands. Within our pair of ligands (diazepane-based L1; open chain L2), the donor-atom inherent strength of the donor set (diamine/trisimine) is fully conserved. Accordingly, solely the consequences of ligand sphere distortion are recorded in complexes of the type [FeLn(X)]Y, in isolation from effects caused by a variation of the donor set.The decisive structural distinction between the ligands is introduced as an angular constraint of the diamine unit, by forcing it into a diazepane ring in L1, thereby enhancing the trans effect of the co-ligand X. The combination of both aspects translates into massive radial disorder and renders the coordination sphere intermediate between tetragonal and trigonal symmetry. Our combined experimental and quantum-chemical findings show that ligand-field imposed differences are the root cause of the differences in properties observed for the iron(II) complexes of L1 and L2. Ligand-imposed distortion in L1 reduces the ligand-field strength by ca. 20–30 kJ mol−1 and, thus, places this factor on an equal footing with ligand-field effects due to variation in the co-ligand. Destabilisation of the ligand field translates into a marked preference of the constrained ligand L1 for high-spin complexes and into high kinetic lability of the derived iron(II) complexes.
Preliminary results, obtained after reacting the iron(II) complexes [FeLn(X)]Y with meta-chloroperbenzoic acid, indicate that the influence of ligand-imposed distortion of Ln is traceable also in the properties of the resulting oxoiron(IV) complexes. Oxoiron(IV) species of L1 and L2 are identified through their diagnostic UV/Vis absorption spectra and by mass-spectrometric results (L2). Significantly reduced ligand-field strength is accompanied by high intrinsic reactivity in the case of L1. Current work addresses the question to what extent judiciously chosen substituents on L1 and L2 allow additional modulation of oxoiron(IV) reactivity.
Experimental section
Materials and general procedure
All reagents and solvents were purchased from commercial sources (Sigma-Aldrich, Acros). Reagents were used as received, and solvents dried according to published procedures.47 The synthesis of the constrained ligand L1 and of its complexes [FeL1(Cl)](PF6) (≡ [1(Cl)](PF6)) and [FeL1(Br)](PF6) (≡ [1(Br)](PF6)) has been described previously.29UV/Vis spectroscopy
UV/Vis spectra at ambient temperature were measured with a Varian Cary 50 spectrometer through quartz cells (light path d = 1 cm). Sample concentration was in the range of 10−4 mol L−1. For variable-temperature experiments, a UV/Vis quartz immersion probe (light path d = 1 mm, Hellma) with a home-built measuring cell came to use. Sample concentration was in the range of 10−3 mol L−1 in this case. Temperature was controlled by an immersion thermometer.Mössbauer spectroscopy
57Fe-Mössbauer spectroscopic measurements have been performed on a conventional transmission spectrometer with sinusoidal velocity sweep. The activity of the Mössbauer source was about 40 mCi of 57Co in a rhodium matrix kept at room temperature. The measurements were done with a CryoVac continuous flow cryostat with N2 or Helium exchange gas. The temperature was measured with a calibrated Si diode located close to the sample container. The isomer shift δ is specified relative to metallic iron at room temperature and was not corrected for second order Doppler shift. The measurements on [1(OTf)](OTf) were carried out with a Janis closed-cycle cryostat with comparable specifications, geometry and sample environments as described above. The activity of the Mössbauer source used here was about 10 mCi of 57Co in a rhodium matrix.SQUID magnetometry
SQUID magnetometry measurements were performed on a Cryogenic Ltd. closed-cycle SQUID magnetometer. The sample was weighed in a gelatin capsule and then fixed in a polyethene sample holder. The background signal of the empty gelatin capsule and the sample holder were experimentally determined and subtracted from the experimental raw data set. The correction of the diamagnetic susceptibility of the complex was done by use of tabulated Pascal parameters.X-ray data collection and refinement details
Data were collected at 150.00(10) K using an “Oxford Diffraction Xcalibur S” diffractometer equipped with a goniometer in κ geometry, a “Sapphire 3” CCD-detector, and a graphite-monochromated “Enhance” Mo-Kα source (λ = 0.71073 Å) or an “Agilent Nova” diffractometer equipped with a goniometer in κ geometry, an “Atlas” CCD-detector, and a mirror-monochromated “SuperNova” Cu-Kα source (λ = 1.54184 Å). Diffraction images were integrated with CrysAlisPro. An empirical absorption correction using spherical harmonics implemented in the Scale3 AbsPack scaling algorithm was performed.48 Structures were solved iteratively with Superflip49 (for [1(OTf)](OTf), [2(Cl)](PF6)·¼Et2O, and [NiL2(H2O)](ClO4)2·MeOH) or with SHELXS-97 using direct methods (for [1(CH3CN)](BPh3)2, [2(OTf)](OTf), and [NiL1(ClO4)](ClO4)·MeOH) and refined with SHELXL-9750 against Fo2 data using the full-matrix least-squares algorithm. Non-hydrogen atoms were refined anisotropically; hydrogen atoms were refined isotropically with standard riding-models. Molecular graphics were produced using Mercury.51 Crystallographic details are summarised in Table S1.‡All disordered parts of the crystal structures were modelled in two discrete positions using (tight) rigid-bond and isotropy restraints. For the triflato ligand in [1(OTf)](OTf), the occupancies refined to 0.51(2)/0.49(2). In [NiL1(ClO4)](ClO4)·MeOH, the perchlorate ion containing Cl2 was modelled using additional same-distance restraints for the oxygen atoms; occupancies refined to 0.57(3)/0.43(3). In [2(OTf)](OTf), the triflato ligand is rotationally disordered about the O40–S43 axis. Using additional same-distance restraints with standard weights for the whole ligand, occupancies refined to 0.52(3)/0.48(3). The unit cell of [2(Cl)](PF6)·¼Et2O contains half a very strongly disordered diethyl-ether molecule that had to be treated as a diffuse contribution to the overall scattering without specific atom positions by Squeeze/Platon.52 In [NiL2(H2O)](ClO4)2·MeOH, the hydrogen atoms of the aqua ligand were located on a Fourier difference map and refined semi-freely. The perchlorate ion containing Cl2 exhibits rotational disorder along the O6–Cl2 axis. Occupancies refined to 0.716(9)/0.284(9). The Cl–O distances were restrained to be equal and refined to an average of 1.427(7) Å. The Flack parameter refined to x = 0.005(12), thus supporting enantiopurity of the crystal and the correct assignment of absolute structure.53
Synthesis of ligand L2
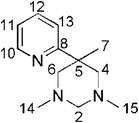
A solution of 2-methyl-2-(2-pyridyl)-propane-1,3-diamine32 (2.06 g; 12.5 mmol) in MeOH (150 ml) is stirred with para-formaldehyde (1.31 g; 39.3 mmol) for 12 h at ambient temperature. To the cooled mixture (0 °C) NaBH4 (5.65 g; 149.3 mmol) is added as a solid in portions within 1 h. The mixture is allowed to warm to ambient temperature within 16 h. After addition of a few drops of acetic acid, the volatiles are removed under reduced pressure. A solution of the solid residue in water (200 ml) was treated with NaOH and extracted with CHCl3 (3 × 200 ml). From the combined organic phases, the product is obtained as a colourless oil after removing the solvent in vacuo (yield: 2.51 g; 98%). 1H-NMR (200 MHz, CDCl3, 25 °C): δ [ppm] = 8.51 (ddd, 1H, 3JH,H = 5.5 Hz, 4JH,H = 2.0 Hz, 5JH,H = 1.0 Hz, H10), 7.56 (dt, 1H, 3JH,H = 8.0 Hz, 4JH,H = 2.0 Hz, H12), 7.36 (td, 1H, 3JH,H = 8.0 Hz, 4JH,H = 1.3 Hz, H13), 7.03 (ddd, 1H, 3JH,H = 8.0 Hz, 3JH,H = 5.5 Hz, 4JH,H = 1.5 Hz, H11), 3.39 (d, 2H, H5,7), 3.42–2.11 (brm, 6H, H2,4,6), 2.18 (s, 6H, H14,15), 1.26 (brs, 3H, H7); HR-MS (ESI): Calcd for C12H19N3: [M + H]+ 206.1652; found. [M + H]+ 206.1651.
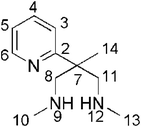
The aminal A (2.35 g; 11.42 mmol) is dissolved in technical 1,2-ethanediol (70 ml). After addition of HCl (32%; 150 ml) the mixture is stirred for 8 days at 55 °C. From 25 ml aliquots of the cooled mixture (0° C), the amine is deliberated by addition of 1,2-ethylendiamine (15 ml; exothermic reaction; temperature below 30 °C). The combined alkaline mixtures are diluted with water and extracted with three portions of CHCl3. After evaporation of all volatiles the residue is extracted with pentane (6 × 5 ml) and the volume of the combined pentane phases reduced to 10 ml. The pentane solutione is extracted with a concentrated NaHCO3 solution (3 × 10 ml). The combined aqueous phases are extracted with CHCl3 (3 × 10 ml). After evaporation of the combined organic phases under reduced pressure, the secondary amine B is obtained as a yellow oil (yield: 1.18 g; 53%). 1H-NMR (200 MHz, CDCl3, 25 °C): δ [ppm] = 8.55 (ddd, 1H, 3JH,H = 5.5 Hz, 4JH,H = 2.0 Hz, 5JH,H = 1.0 Hz, H6), 7.63 (dt, 1H, 3JH,H = 8.0 Hz, 4JH,H = 2.0 Hz, H4), 7.35 (td, 1H, 3JH,H = 8.0 Hz, 4JH,H = 1.3 Hz, H3), 7.10 (ddd, 1H, 3JH,H = 8.0 Hz, 3JH,H = 5.5 Hz, 4JH,H = 1.5 Hz, H5), 2.96 (d, 2H, 2JH,H = 12 Hz, H8,11), 2.88 (d, 2H, 2JH,H = 12 Hz, H8,11), 2.38 (s, 6H, H10,13), 1.98 (brs, 2H, H9,12), 1.39 (s, 3H, H14), HR-MS (ESI): Calcd for C23H27N5: [M + H]+ 374.2339; found. [M + H]+ 374.2336.
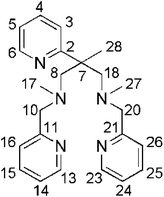
A mixture of the secondary amine B (0.55 g; 2.8 mmol) with Na2CO3 (3.03 g; 28.6 mmol) and 2-picolylchloride-hydrochloride (0.94 g; 5.7 mmol) in acetonitrile is stirred at 55 °C for two days. After cooling to ambient temperature, the solvent is removed under reduced pressure. The red oil obtained is dissolved in toluene and the resulting solution extracted with water. Toluene is removed under reduced pressure and the residue is extracted several times with pentane. From the combined pentane extracts, ligand L2 is obtained as a yellow oil after removing all volatiles in vacuo (yield: 0.67 g; 63%). 1H-NMR (200 MHz, CDCl3, 25 °C): δ [ppm] = 8.50 (ddd, 1H, 3JH,H = 5.5 Hz, 4JH,H = 2.0 Hz, 5JH,H = 1.0 Hz, H6), 8.40 (ddd, 2H, 3JH,H = 5.5 Hz, 4JH,H = 2.0 Hz, 5JH,H = 1.0 Hz, H13,23), 7.52 (dt, 3H, 3JH,H = 8.0 Hz, 4JH,H = 2.0 Hz, H4,15,25), 7.40 (td, 1H, 3JH,H = 8.0 Hz, 4JH,H = 1.3 Hz, H3), 7.26 (td, 2H, 3JH,H = 8.0 Hz, 4JH,H = 1.3 Hz, H16,26), 7.04 (ddd, 2H, 3JH,H = 8.0 Hz, 3JH,H = 5.5 Hz, 4JH,H = 1.5 Hz, H14,24), 6.98 (ddd, 1H, 3JH,H = 8.0 Hz, 3JH,H = 5.5 Hz, 4JH,H = 1.5 Hz, H5), 3.55 (s, 4H, H10,20), 3.06 (d, 2H, 2JH,H = 13 Hz, H8,18), 2.80 (d, 2H, 2JH,H = 13 Hz, H8,18), 2.01 (s, 6H, H17,27), 1.55 (s, 3H, H28). {1H}13C-NMR (50.32 MHz, CDCl3, 25 °C): δ [ppm] = 166.2 (Cq, 1C, C2), 160.6 (Cq, 2C, C11,21), 148.8 (CH, 2C, C13,23), 148.3 (CH, 1C, C6), 136.3 (CH, 2C, C15,25), 135.9 (CH, 1C, C4), 122.7 (CH, 2C, C16,26), 121.9 (CH, 1C, C3), 121.7 (CH, 2C, C14,24), 120.9 (CH, 1C, C5), 66.9 (CH2, 2C, C8,18), 66.1 (CH2, 2C, C10,20), 48.2 (Cq, C, C7), 45.0 (CH3, 3C, C17,27), 20.8 (CH3, 1C, C28). Combustion analysis: Calcd (%) for C23H29N5 (375.51): C 73.57, H 7.78, N 18.65; found.: C 73.59, H 7.72, N 18.95. HR-MS (ESI): Calcd for C23H29N5: [M + H]+ 376.2496; found [M + H]+ 376.2495.
Synthesis of metal complexes
![[triple bond, length as m-dash]](https://www.rsc.org/images/entities/b_char_e002.gif) [1(OTf)](OTf)).
(L1: 0.340 g (0.91 mmol); Fe(OTf)2: 0.31 g (0.86 mmol)). Yield: 0.53 g (84%). C25H27F6FeN5O6S2 (727.48): calcd C 41.28, H 3.74, N 9.63, S 8.82; found C 41.49, H 4.02, N 9.36, S 7.97. HR-MS (ESI): calcd for C24H27F3FeN5O3S [M]+ 578.1124; found 578.1131; calcd for C23H27FeN5 [M]2+ 214.5801; found 214.5802; 1H-NMR (200 MHz, CD2Cl2, 23 °C): δ [ppm] = 114.1, 50.9, 48.4, 39.8, 37.5, 34.8, 15.0, 10.3, 6.2, −1.7.
[1(OTf)](OTf)).
(L1: 0.340 g (0.91 mmol); Fe(OTf)2: 0.31 g (0.86 mmol)). Yield: 0.53 g (84%). C25H27F6FeN5O6S2 (727.48): calcd C 41.28, H 3.74, N 9.63, S 8.82; found C 41.49, H 4.02, N 9.36, S 7.97. HR-MS (ESI): calcd for C24H27F3FeN5O3S [M]+ 578.1124; found 578.1131; calcd for C23H27FeN5 [M]2+ 214.5801; found 214.5802; 1H-NMR (200 MHz, CD2Cl2, 23 °C): δ [ppm] = 114.1, 50.9, 48.4, 39.8, 37.5, 34.8, 15.0, 10.3, 6.2, −1.7.
![[triple bond, length as m-dash]](https://www.rsc.org/images/entities/b_char_e002.gif) [2(Cl)](PF6)).
After adding a solution of L2 (0.125 g; 0.33 mmol) in methanol to a solution of FeCl2 (0.040 g; 0.32 mmol) in methanol, the yellow mixture is stirred for 12 h at ambient temperature. Addition of solid (nBu)4NPF6 (0.243 g; 0.63 mmol) affords the crude product as a yellow solid. The solid is separated by filtration, washed with diethyl ether and dried in vacuo. Isothermal diffusion of diethyl ether into a solution of the product in dichloromethane affords yellow single crystals within several days. Yield: 0.15 g (77%). C23H29ClF6FeN5P (611.77): C 45.16, H 4.78, N 11.45; found C 45.61, H 5.08, N 11.24. HR-MS (ESI): Calcd for C23H29ClFeN5: [M]+ 466.1455; found. [M]+ 466.1449.
[2(Cl)](PF6)).
After adding a solution of L2 (0.125 g; 0.33 mmol) in methanol to a solution of FeCl2 (0.040 g; 0.32 mmol) in methanol, the yellow mixture is stirred for 12 h at ambient temperature. Addition of solid (nBu)4NPF6 (0.243 g; 0.63 mmol) affords the crude product as a yellow solid. The solid is separated by filtration, washed with diethyl ether and dried in vacuo. Isothermal diffusion of diethyl ether into a solution of the product in dichloromethane affords yellow single crystals within several days. Yield: 0.15 g (77%). C23H29ClF6FeN5P (611.77): C 45.16, H 4.78, N 11.45; found C 45.61, H 5.08, N 11.24. HR-MS (ESI): Calcd for C23H29ClFeN5: [M]+ 466.1455; found. [M]+ 466.1449.
![[triple bond, length as m-dash]](https://www.rsc.org/images/entities/b_char_e002.gif) [2(MeCN)](OTf)2).
A solution of [2(OTf)](OTf) in MeCN was stirred at ambient temperature for two hours and then treated with an excess of cold diethyl ether. The obtained powder was separated from solution via filtration, washed with cold diethyl ether and dried in vacuo.
[2(MeCN)](OTf)2).
A solution of [2(OTf)](OTf) in MeCN was stirred at ambient temperature for two hours and then treated with an excess of cold diethyl ether. The obtained powder was separated from solution via filtration, washed with cold diethyl ether and dried in vacuo.
1 H-NMR (400 MHz, CD3CN, −40 °C): δ [ppm] = 9.68 (bs, 1H), 9.34 (bs, 1H), 8.99 (bs, 1H), 8.10–7.95 (m, 4H), 7.87 (d, 1H, 3JH,H = 7.4 Hz), 7.76 (m, 1H), 7.66 (t, 1H, 3JH,H = 7.6 Hz), 7.54 (m, 1H), 7.49 (d, 1H, 3JH,H = 7.3 Hz), 5.24 (bs, 1H), 4.50 (bs, 2H), 4.10 (m, 2H), 3.37 (m, 2H), 2.81 (s, 3H), 2.19 (s, 3H), 1.50 (s, 3H); 1H-NMR (400 MHz, CD3CN, 23 °C): δ [ppm] = 44.1, 30.3, 28.5, 27.0, 23.4, 19.4, 18.7, 16.4, 15.6, 15.2, 13.8, 12.0, 8.6, 7.2, 6.7, 3.6, −0.9.
Samples of [FeLn(X)]Y for Mössbauer spectroscopy
Amorphous powder samples of the complexes were obtained by treating solutions of [FeLn(OTf)](OTf) with an excess of cold diethyl ether. (i) Acetonitrile complexes of L1 and L2 with X = MeCN/Y = (OTf)2 from MeCN solutions; (ii) Triflato complexes of L1 and L2 with X = Y = OTf− from MeCN solutions. The obtained powders were separated from solution via filtration, washed with cold diethyl ether and dried in vacuo. Correct elemental analyses have been obtained in all cases.Computational details
All DFT and TDDFT calculations were performed using TURBOMOLE6.354–59 and a locally modified version of the TURBOMOLE6.456 package. The latter allows variation of the amount of exact exchange in global hybrid functionals. def2-TZVP basis sets60 were used throughout. The B3LYP61,62 functional was used (with 20% exact exchange), but for spin-crossover (SCO) energies, B3LYP* (15% exact exchange)42 has been used, which had been reparameterised to better describe SCO in iron(II) complexes. The SCF energies were converged to 10−8 Hartree in energy and a fine m5 grid was chosen. Dispersion contributions were evaluated using Grimme's DFT-D3 atom-pairwise dispersion corrections.63 In several cases, solvent effects were taken into account at the polarisable continuum model level, using COSMO (Conductor-Like Screening Model)64 implemented in TURBOMOLE6.3, with permittivity ε = 35.688 for acetonitrile.For the calculation of Mössbauer parameters, an uncontracted def2-QZVPP basis set was used for iron and def2-TZVP for all other atoms. The structures for the Mössbauer calculations were optimised at B3LYP-D3/def2-TZVP level. The in-house MAG program65 was used to calculate the electron density ρ at the iron nucleus and the quadrupole splitting. For the isomer shifts the linear equation used is δ [mm s−1] = −0.3594 × (ρ(DFT) − 11![[thin space (1/6-em)]](https://www.rsc.org/images/entities/char_2009.gif) 800) + 10.521. This equation was fitted to the isomer-shift test of Neese's test set.66
800) + 10.521. This equation was fitted to the isomer-shift test of Neese's test set.66
Acknowledgements
Dipl.-Chem. S. Kühn (TU Berlin) is acknowledged for assistance with conductivity measurements. Dr M. Schlangen is acknowledged for mass-spectrometric measurements. We acknowledge Prof. Dr. M. Bröring (Institut für Anorganische und Analytische Chemie) and Prof. Dr. F. J. Litterst (Institut für Physik der Kondensierten Materie) at the TU Braunschweig for access to the SQUID magnetometer and 57Fe-Mössbauer equipment. The Deutsche Forschungsgemeinschaft (DFG) is thanked for financial support (grant number GR 1247/7-1 (to A. G.); Berlin excellence cluster UniCat (to M. K.)).Notes and references
- B. L. Vallee and R. J. P. Williams, Proc. Natl. Acad. Sci. U. S. A., 1968, 59, 498 CrossRef CAS.
- P. Comba, Coord. Chem. Rev., 2000, 200, 217 CrossRef.
- K. B. Lipkowitz, S. Schefrick and D. Avnir, J. Am. Chem. Soc., 2001, 123, 6710 CrossRef CAS.
- G. Chaka, J. L. Sonnenberg, H. B. Schlegel, M. J. Heeg, G. Jaeger, T. J. Nelson, L. A. Ochrymowycz and D. B. Rorabacher, J. Am. Chem. Soc., 2007, 129, 5217 CrossRef CAS PubMed.
- V. Balland, C. Hureau and J.-M. Saveant, Proc. Natl. Acad. Sci. U. S. A., 2010, 107, 17113 CrossRef CAS PubMed.
- A. Hoffmann, S. Binder, A. Jesser, R. Haase, U. Floerke, M. Guida, M. S. Stagni, W. Meyer-Klaucke, B. Lebsanft, L. E. Grünig, S. Schneider, M. Hashemi, A. Goos, A. Wetzel, M. Rubhausen and S. Herres-Pawlis, Angew. Chem., Int. Ed., 2014, 53, 299 CrossRef CAS PubMed.
- But see: U. Ryde and M. H. M. Olsson, Int. J. Quantum Chem., 2001, 81, 335 CrossRef CAS.
- W. Nam, Acc. Chem. Res., 2007, 40, 522 CrossRef CAS PubMed.
- J. Hohenberger, K. Ray and K. Meyer, Nat. Commun., 2012, 3, 720 CrossRef PubMed.
- A. R. McDonald and L. Que Jr., Coord. Chem. Rev., 2013, 257, 414 CrossRef CAS PubMed.
- E. I. Solomon, K. M. Light, L. V. Liu, M. Srnec and S. D. Wong, Acc. Chem. Res., 2013, 46, 2725 CrossRef CAS PubMed.
- W. Nam, Y.-M. Lee and S. Fukuzumi, Acc. Chem. Res., 2014, 47, 1146 CrossRef CAS PubMed.
- J. England, Y. Guo, E. R. Farquhar, V. G. Young Jr., E. Münck and L. Que Jr., J. Am. Chem. Soc., 2010, 132, 8635 CrossRef CAS PubMed.
- Y. M. Lee, S. N. Dhuri, S. C. Sawant, J. Cho, M. Kubo, T. Ogura, S. Fukuzumi and W. Nam, Angew. Chem., Int. Ed., 2009, 48, 1803 CrossRef CAS PubMed.
- M. Martinho, F. Banse, J.-F. Bartoli, T. A. Mattioli, P. Battioni, O. Horner, S. Bourcier and J.-J. Girerd, Inorg. Chem., 2005, 44, 9592 CrossRef CAS PubMed.
- J.-U. Rohde, J.-H. In, M. H. Lim, W. W. Brennessel, M. R. Bukowski, A. Stubna, E. Münck, W. Nam and L. Que Jr., Science, 2003, 299, 1037 CrossRef CAS PubMed.
- K. Ray, F. F. Pfaff, B. Wang and W. Nam, J. Am. Chem. Soc., 2014, 136, 13942 CrossRef CAS PubMed.
- A. R. McDonald, Y. Guo, V. V. Vu, E. L. Bominaar, E. Münck and L. Que Jr., Chem. Sci., 2012, 3, 1680 RSC.
- Angular overlap model (AOM): C.E. Schäffer and C. K. Jorgensen, Mol. Phys., 1965, 9, 401 CrossRef PubMed.
- P. Comba, Coord. Chem. Rev., 1999, 182, 343 CrossRef.
- E. A. Ünal, D. Wiedemann, J. Seiffert, J. P. Boyd and A. Grohmann, Tetrahedron Lett., 2012, 53, 54 CrossRef PubMed.
- A. Grohmann, Dalton Trans., 2010, 39, 1432 RSC.
- D. Wiedemann and A. Grohmann, Dalton Trans., 2014, 43, 2406 RSC.
- P. Stock, T. Pedzinski, N. Spintig, A. Grohmann and G. Hörner, Chem. – Eur. J., 2013, 19, 839 CrossRef CAS PubMed.
- M. Schlangen, J. Neugebauer, M. Reiher, D. Schröder, J. Pitarch Lopez, M. Haryono, F. W. Heinemann, A. Grohmann and H. Schwarz, J. Am. Chem. Soc., 2008, 130, 4285 CrossRef CAS PubMed.
- J. P. Boyd, E. Irran and A. Grohmann, Dalton Trans., 2012, 41, 2477 RSC.
- A. Jozwiuk, E. A. Ünal, S. Leopold, J. P. Boyd, M. Haryono, N. Kurowski, F. V. Escobar, P. Hildebrandt, J. Lach, F. W. Heinemann, D. Wiedemann, E. Irran and A. Grohmann, Eur. J. Inorg. Chem., 2012, 3000 CrossRef CAS PubMed.
- M. Schmidt, D. Wiedemann and A. Grohmann, Inorg. Chim. Acta, 2011, 374, 514 CrossRef CAS PubMed.
- M. Schmidt, D. Wiedemann, B. Moubaraki, N. F. Chilton, K. S. Murray, K. R. Vignesh, G. Rajaraman and A. Grohmann, Eur. J. Inorg. Chem., 2013, 958 CrossRef CAS PubMed.
- N. Ortega-Villar, V. M. Ugalde-Saldívar, M. C. Muñoz, L. A. Ortiz-Frade, J. G. Alvarado-Rodríguez, J. A. Real and R. Moreno-Esparza, Inorg. Chem., 2007, 46, 7285 CrossRef CAS PubMed.
- J. Kaizer, E. J. Klinker, N. Young Oh, J. U. Rohde, W. J. Song, A. Stubna, J. Kim, E. Münck, W. Nam and L. Que Jr., J. Am. Chem. Soc., 2004, 126, 472 CrossRef CAS PubMed.
- S. Friedrich, M. Schubart, L. H. Gade, I. Scowen, J. Andrew and M. McPartlin, Chem. Ber./Recl., 1997, 130, 1751 CrossRef CAS PubMed.
- P. Guionneau, C. Brigouleix, Y. Barrans, A. E. Goeta, J.-F. Létard, J. A. K. Howard, J. Gaultier and D. Chasseau, C. R. Acad. Sci., Ser. IIc: Chim., 2001, 4, 161 CrossRef CAS.
- M. Haryono, F. W. Heinemann, K. Petukhov, K. Gieb, P. Müller and A. Grohmann, Eur. J. Inorg. Chem., 2009, 2136 CrossRef CAS PubMed.
- P. Guionneau, M. Marchivie, G. Bravic, J.-F. Letard and D. Chasseau, Top. Curr. Chem., 2004, 234, 97 CrossRef CAS.
- The ‘continuous shape measures S’ quantify the minimal distance movement that the points of an object have to undergo in order to be transformed into the desired shape; see: H. Zabrodsky, S. Peleg and D. Avnir, J. Am. Chem. Soc., 1992, 114, 7843 CrossRef CAS.
- Calculations were performed by using the online service of the Hebrew University of Jerusalem, see: A. Zayit, M. Pinsky, H. Elgavi, C. Dryzun and D. Avnir, Chirality, 2011, 23, 17 CrossRef CAS PubMed.
- D. Casanova, J. Cirera, M. Llunell, P. Alemany, D. Avnir and S. Alvarez, J. Am. Chem. Soc., 2004, 126, 1755 CrossRef CAS PubMed.
- L. Benhamou, A. Thibon, L. Brelot, M. Lachkar and D. Mandon, Dalton Trans., 2012, 41, 14369 RSC.
- J. England, G. J. P. Britovsek, N. Rabadia and A. J. P. White, Inorg. Chem., 2007, 46, 3752 CrossRef CAS PubMed.
- W. J. Geary, Coord. Chem. Rev., 1971, 7, 81 CrossRef CAS.
- M. Reiher, O. Salomon and B. A. Hess, Theor. Chem. Acc., 2001, 107, 48 CrossRef CAS.
- B. I. Bleaney and B. Bleaney, Electricity and Magnetism, Oxford Classical Texts in the Physical Sciences, Oxford University Press, 3rd edn, 2013, vol. 2, p. 456 Search PubMed.
- Mössbauer spectroscopy, ed. D. P. E. Dickson and F. J. Berry, Cambridge University Press, 1986 Search PubMed.
- P. Gütlich, E. Bill and A. X. Trautwein, Mössbauer spectroscopy and transition metal chemistry, Springer, 2011 Search PubMed.
- S. Hong, Y.-M. Lee, K.-B. Cho, K. Sundaravel, J. Cho, M. J. Kim, W. Shin and W. Nam, J. Am. Chem. Soc., 2011, 133, 11876 CrossRef CAS PubMed.
- W. L. F. Armarego and C. L. L. Chai, Purification of Laboratory Chemicals, Butterworth-Heinemann, Oxford, 6th edn, 2009 Search PubMed.
- Agilent Technologies, CrysAlisPro Software System: Intelligent Data Collection and Processing Software for Small Molecule and Protein Crystallography, Agilent Technologies Ltd, Oxford, United Kingdom, 2013 Search PubMed.
- L. Palatinus and G. Chapuis, J. Appl. Crystallogr., 2007, 40, 786 CrossRef CAS.
- G. M. Sheldrick, Acta Crystallogr., Sect. A: Found. Crystallogr., 2008, 64, 112 CrossRef CAS PubMed.
- C. F. Macrae, I. J. Bruno, J. A. Chisholm, P. R. Edgington, P. McCabe, E. Pidcock, L. Rodriguez-Monge, R. Taylor, J. van de Streek and P. A. Wood, J. Appl. Crystallogr., 2008, 41, 466 CrossRef CAS.
- P. van der Sluis and A. L. Spek, Acta Crystallogr., Sect. A: Found. Crystallogr., 1990, 46, 194 CrossRef.
- H. D. Flack, Acta Crystallogr., Sect. A: Found. Crystallogr., 1983, 39, 876 CrossRef.
- R. Ahlrichs, M. Baer, M. Häser, H. Horn and C. Koelmel, Chem. Phys. Lett., 1989, 162, 165 CrossRef CAS.
- O. Treutler and R. Ahlrichs, J. Chem. Phys., 1995, 102, 346 CrossRef CAS PubMed.
- TURBOMOLE V6.3 a development of University of Karlsruhe and Forschungszentrum Karlsruhe GmbH, 1989–2007, TURBOMOLE GmbH, since 2007; available from http://www.turbomole.com.
- F. Furche and D. Rappoport, Density functional theory for excited states: equilibrium structure and electronic spectra. Ch. III of “Computational Photochemistry”, ed. M. Olivucci, vol. 16 of “Computational and Theoretical Chemistry”, Elsevier, Amsterdam, 2005 Search PubMed.
- R. Bauernschmitt and R. Ahlrichs, Chem. Phys. Lett., 1996, 256, 454 CrossRef CAS.
- R. Bauernschmitt, M. Häser, O. Treutler and R. Ahlrichs, Chem. Phys. Lett., 1997, 264, 573 CrossRef CAS.
- F. Weigend and R. Ahlrichs, Phys. Chem. Chem. Phys., 2005, 7, 3297 RSC.
- A. D. Becke, J. Chem. Phys., 1993, 98, 5648 CrossRef CAS PubMed.
- C. Lee, W. Yang and R. G. Parr, Phys. Rev. B: Condens. Matter Mater. Phys., 1988, 37, 785 CrossRef CAS.
- S. Grimme, J. Antony, S. Ehrlich and H. Krieg, J. Chem. Phys., 2010, 132, 154104 CrossRef PubMed.
- A. Klamt and G. Schüürmann, J. Chem. Soc., Perkin Trans. 2, 1993, 799 RSC.
- V. G. Malkin, O. L. Malkina, R. Reviakine, A. V. Arbuznikov, M. Kaupp, B. Schimmelpfennig, I. Malkin and K. Ruud, MAG-ReSpect, version 2.1, 2007 Search PubMed.
- F. Neese, Inorg. Chim. Acta, 2002, 337, 181 CrossRef.
Footnotes |
| † Dedicated to Professor Manfred Scheer on the occasion of his 60th birthday. |
| ‡ Electronic supplementary information (ESI) available: Crystallographic data; selected structural details (XRD/DFT); additional figures. CCDC 1008832–1008837. For ESI and crystallographic data in CIF or other electronic format see DOI: 10.1039/c5dt02502h |
| This journal is © The Royal Society of Chemistry 2015 |

