 Open Access Article
Creative Commons Attribution 3.0 Unported Licence
Chiral probe development for circularly polarised luminescence: comparative study of structural factors determining the degree of induced CPL with four heptacoordinate europium(III) complexes†
Emily R.
Neil
,
Mark A.
Fox
,
Robert
Pal
,
Lars-Olof
Pålsson
,
Benjamin A.
O'Sullivan
and
David
Parker
*
Department of Chemistry, Durham University, South Road, Durham, DH1 3LE, UK. E-mail: david.parker@dur.ac.uk
First published on 24th July 2015
Abstract
A series of bright, europium(III) complexes has been prepared based on an achiral heptadentate triazacyclononane ligand bearing two strongly absorbing, coordinated aralkynyl pyridyl moieties. The binding of chiral carboxylates, including α-hydroxy acids such as lactate and mandelate, has been monitored by emission spectroscopy and is signalled by the switching on of strong circularly polarised emission. In each case, an R-chiral carboxylate gave rise to emission typical of a Δ complex, most clearly shown in the form of the ΔJ = 4 transition manifold around 700 nm. Variations in the sign and magnitude of the CPL allow the enantiomeric purity and absolute configuration of the acid to be assessed in a sample. Analysis of the relative energies of the parent aqua complexes and their stereoisomeric adducts has been aided by lifetime measurements and density functional theory calculations.
Introduction
Amongst the family of chiroptical spectroscopy techniques, circularly polarised luminescence (CPL) spectroscopy has several unique advantages.1–3 Inherently, it is much more sensitive than electronic circular dichroism (ECD), the analogous ground-state technique that relies upon differential absorption of left and right-handed circularly polarised light. Arguably the most significant difference is that with the CPL technique, selective excitation and detection of the emissive complex can be achieved, giving rise to a unique signal that is free from background interference. In analogous systems relying on ECD detection, the background from the medium or matrix, notably in biological systems, often contributes extensively to the optical signal that is observed.The chiroptical behaviour of strongly emissive lanthanide(III) complexes has dominated CPL probe development, and time-gating techniques allow the long-lived signal from the lanthanide(III) centre to be observed selectively.4–6 The emissive lanthanide excited state can be perturbed in a variety of different ways, including changes in local solvent structure, sensitivity to energy transfer and static or dynamic charge transfer quenching processes.7 In particular, changes in the ligand field can occur arising from reversible binding to the metal or the ligand.8–10 The latter modulation is of particular use to signal the presence of chiral species in solution.
The emission spectra of LnIII complexes are sensitive to changes in the coordination environment that determine the ligand field. Such behaviour can be considered to arise from perturbation of the electric susceptibility tensor and its anisotropy that defines the optical behaviour of the lanthanide complex in solution. At the same time, the magnetic susceptibility tensor, characterising the behaviour of a given lanthanide(III) complex in a magnetic field, serves to rationalise the magnetic properties of the complex, i.e. its susceptibility; the anisotropy of this tensor is of paramount importance in rationalising NMR behaviour, primarily determining the paramagnetic shift and EPR characteristics.11–13
In europium emission spectra, the oscillator strength of the magnetic-dipole allowed ΔJ = 1 transition (ca. 590 nm) is generally considered to be independent of the ligand environment. The ΔJ = 2 and ΔJ = 4 transitions (ca. 615 and 700 nm respectively) are electric-dipole (ED)-allowed and are hypersensitive to ligand perturbation. To a first approximation, their intensities are proportional to the square of the ligand dipolar polarisabilities. A ligand polarisation model has been advocated14 to develop our understanding of lanthanide optical emission behaviour, in which electric-quadrupole-allowed transitions (e.g.5D0 to 7F2/4) gain ED strength via a quadrupole (on the Ln3+ ion)-induced dipole (ligand) coupling mechanism. The induced dipoles on the ligands are created by direct coupling to the ED components of the radiation field. Thus, 4f–4f ED strength has been directly linked to ligand dipolar polarisabilities and to the anisotropies of these polarisabilities.15
For Eu(III) complexes, perturbation of the ligand field has a particularly significant impact on the emission profile. Thus, variation of the axial donor in square antiprismatic complexes has a major effect on the relative intensity of the 7F2 ← 5D0 transition,16 and has been exploited in the signalling of reversible anion binding to the metal centre in aqueous media. Several practical examples of anion sensing have emerged, including the assay of citrate, lactate and bicarbonate in bio-fluids.17–20 More recently, reversible binding to certain acute phase proteins in serum, e.g. α1-AGP, has been reported, in which a glutamate side chain carboxylate that is close to the main hydrophobic binding pocket binds to the Eu centre.21,22 In each case, the interaction is signalled by modulation of the total emission spectrum, and can be calibrated to measure changes in the intensity ratio of two or more emission bands. However, such analyses are not normally sensitive to chiral aspects that arise from stereoselective interactions. For this issue to be addressed, chiroptical spectroscopic methods need to be employed.
A racemic mixture of LnIII complexes in an achiral environment does not exhibit CPL. However, following addition of a chiral agent a net CPL signal may be obtained. For the cases where a chiral anion or protein can bind reversibly to the metal centre of a racemic complex, the formation of diastereoisomeric complexes of differing relative stability will lead to an induced CPL signal whose relative intensity will be dependent on the selectivity of binding and the conformational rigidity of the complex on the emission timescale. The intrinsic ‘brightness’ of the observed species is also a key practical aspect, as the acquisition of the total emission (IL + IR) and the CPL (IL − IR) signals should be as rapid as possible. Owing to the relative simplicity of Eu(III) total emission spectra, arising from the absence of degeneracy of the 5D0 emissive state, these changes are best observed with europium complexes.
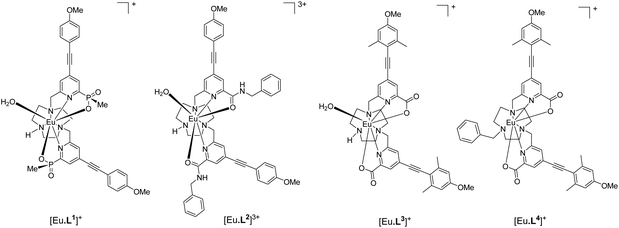
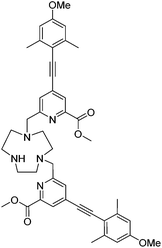
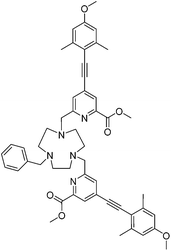
Recently, a new series of very bright Eu(III) complexes has been introduced, in which 1,4,7-triazacyclononane (9-N3) serves as the core ligand structure with various substituted pyridyl-alkynylaryl groups acting as the sensitising chromophore.23–27 In particular, complexes that are coordinatively unsaturated based on heptadentate ligands have been prepared28 and can bind reversibly to anions in aqueous media. In this work, we compare and contrast the behaviour of the Eu(III) complexes of the ligands L1–L4, and trace the key ligand structural features that distinguish their ability to serve as effective chiral probes for CPL.
Results and discussion
Ligand and complex synthesis and characterisation
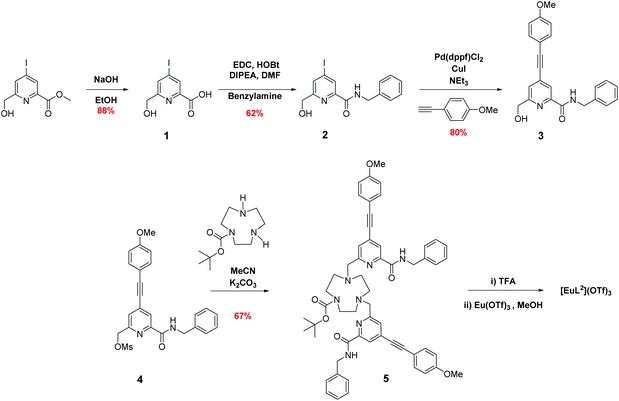
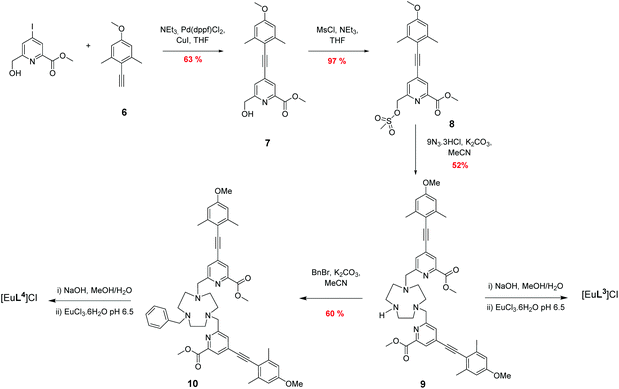
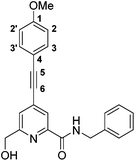
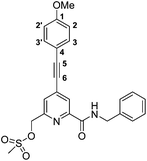
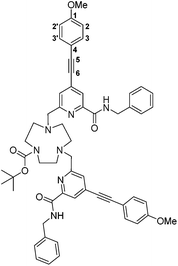
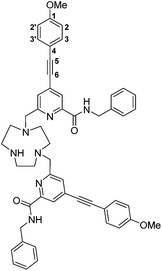
The syntheses of the achiral ligands L2–4 used established methodology, involving either a controlled alkylation strategy or the use of mono-BOC protected 1,4,7-triazacyclononane, (Schemes 1 and 2). Base hydrolysis of methyl(4-iodo-6-hydroxymethyl) picolinate,31 followed by amide coupling afforded the benzylamide, 2. A Sonogashira coupling reaction with 4-methoxyphenylalkyne, catalysed by Pd(dppf)Cl2, gave the alcohol 3, which was converted into the corresponding mesylate, 4, under standard conditions (MsCl/THF, Et3N, 0 °C). Alkylation of mono-BOC-9-N3 with two equivalents of the mesylate, 4, gave the carbamate 5, from which the Eu(III) complex was prepared following TFA de-protection and reaction with europium triflate in methanol. A similar sequence was used to prepare the carboxylate ligands L3 and L4 (Scheme 2),23 except that di-alkylation of the parent tri-amine was used, in order to obviate exposure of the electron-rich alkyne to strongly acidic conditions, as it is rather sensitive to acid-catalysed alkyne hydration.Photophysical data, summarising the behaviour of the four Eu(III) complexes in methanol (Table 1), highlights the differences between the complexes. The high absorbance of each complex in the range 332 to 352 nm arises from the strong ICT band.23,28 The amide complex, [Eu·L2]3+, possesses a modest overall emission quantum yield (2%-presumably due to less favourable intramolecular energy transfer) whereas the other complexes have quantum yields in the range 18 to 20%. These are high values, especially for systems with both a coordinated secondary amine group and a bound water molecule. The presence of a coordinated amine NH oscillator has been shown to be particularly effective at quenching the Eu(III) excited state, via efficient vibrational coupling.32,33 Such excited-state quenching explains the faster emission decay rate compared to the N-benzyl complex, [Eu·L4]+, where the observed rate of emission is nearly twice as slow in methanol. Measurements of the rate constants defining the decay rate of Eu(III) emission in water and D2O allowed solvation states to be estimated. Such data shows that the complexes of L1–3 are octadentate, with one bound water molecule. The N-benzyl complex, [Eu·L4]+, does not possess a bound water molecule, presumably because of the increased steric demand imposed by the additional benzylic substituent. It represents an unusual example of a seven-coordinate Eu(III) complex in aqueous solution, although the emission quantum yield is less than [Eu·L3]+, perhaps due to a less efficient energy transfer step.
| [Eu·L1]+ | [Eu·L2]3+ | [Eu·L3]+ | [Eu·L4]+ | |
|---|---|---|---|---|
| a Data for [Eu·L1]+ is taken from ref. 28; errors on k values are ±10% and ±20% on quantum yield values; b q values in water were determined as defined in ref. 32, using the equation q = 1.2{(k(H2O) − k(D2O) − 0.26 − 0.075n} where n is the number of NH oscillators for secondary amide groups coordinated to Eu via the amide carbonyl. | ||||
| λ/nm | 332 | 348 | 352 | 348 |
| ε/mM−1 cm−1 | 38.6 | 40.0 | 35.0 | 36.0 |
| Φ | 0.19 | 0.02 | 0.20 | 0.18 |
| k/ms−1 | 2.94 | 2.17 | 2.56 | 1.20 |
| kH2O/ms−1 | 2.97 | 3.85 | 3.70 | 2.00 |
| kD2O/ms−1 | 2.04 | 2.33 | 2.63 | 1.89 |
| q | 0.8 | 1.3 | 1.0 | 0 |
Binding affinity with added chiral anions
Incremental addition of aqueous solutions containing a given chiral anion, to each Eu complex in turn, was monitored by emission spectroscopy, examining changes in the relative intensity and form of the Eu(III) emission spectrum (Fig. 1). The relative intensity of the ΔJ = 2 and ΔJ = 1 emission bands was plotted as a function of anion concentration and the variation was fitted to a 1![[thin space (1/6-em)]](https://www.rsc.org/images/entities/char_2009.gif) :
:![[thin space (1/6-em)]](https://www.rsc.org/images/entities/char_2009.gif) 1 binding model by non-linear least-squares fitting, to give an estimate of the association constant. Direct observation of the 1
1 binding model by non-linear least-squares fitting, to give an estimate of the association constant. Direct observation of the 1![[thin space (1/6-em)]](https://www.rsc.org/images/entities/char_2009.gif) :
:![[thin space (1/6-em)]](https://www.rsc.org/images/entities/char_2009.gif) 1 adduct was obtained by electrospray mass spectrometry (ESI), for examples with added lactate, mandelate and α-hydroxycyclohexylacetate. The limited water solubility of the Eu complexes of the mono-cationic complexes meant that these systems were examined in 50% aqueous methanol. Overall, the observed emission intensity increased as anion was added; changes in spectral form were most significant with [Eu·L1]+,28 and were least marked with the complexes of L2–4. The overall changes in emission spectral form were the same for enantiopure and racemic samples of the added chiral anion (ESI, Fig. S2b†).
1 adduct was obtained by electrospray mass spectrometry (ESI), for examples with added lactate, mandelate and α-hydroxycyclohexylacetate. The limited water solubility of the Eu complexes of the mono-cationic complexes meant that these systems were examined in 50% aqueous methanol. Overall, the observed emission intensity increased as anion was added; changes in spectral form were most significant with [Eu·L1]+,28 and were least marked with the complexes of L2–4. The overall changes in emission spectral form were the same for enantiopure and racemic samples of the added chiral anion (ESI, Fig. S2b†).
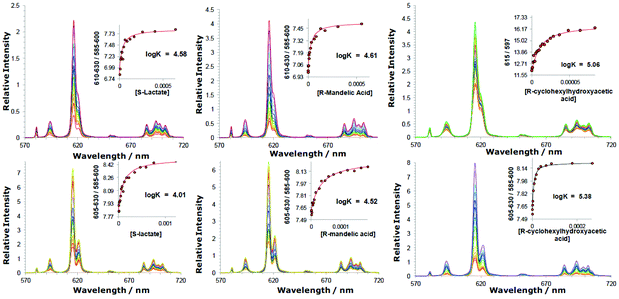 | ||
Fig. 1 Variation of the europium(III) emission profile as a function of added anion; (upper): [Eu·L2]3+ (5 μM; λexc 348 nm, H2O, pH 5.5), (left to right) lactate, mandelate and cyclohexylhydroxyacetate; (lower): [Eu·L3]+ (5 μM) (λexc = 352 nm, 50% MeOH in H2O, pH 5.5) plus added anions. Insets show fits to experimental data, following iterative non-linear least-squares fitting to a 1![[thin space (1/6-em)]](https://www.rsc.org/images/entities/char_2009.gif) : :![[thin space (1/6-em)]](https://www.rsc.org/images/entities/char_2009.gif) 1 binding model (details in the ESI†). No significant differences in measured binding constants were found with enantiomeric carboxylates. 1 binding model (details in the ESI†). No significant differences in measured binding constants were found with enantiomeric carboxylates. | ||
Binding constants (Table 2) were largest for the anions with the bulkier substituents (cyclohexyl > Ph > Me) that are intuitively more hydrophobic, consistent with a major role for anion desolvation in the overall free energy change. Thus, binding constants with cyclohexylhydroxyacetate were the highest in every case. Comparing the behaviour of [Eu·L3]+ and its N-benzyl analogue, [Eu·L4]+, affinity constants were smaller for the latter, q = 0 complex. The favourable free energy term associated with displacement of the weakly Eu-coordinated water and its return to bulk (where it enjoys full hydrogen bonding to other water molecules) presumably accounts for this difference in behaviour. In the lactate series, strongest binding occurred to the most positively charged complex, [Eu·L2]3+; the phosphinate complex, [Eu·L1]+ bound anions most weakly, notably compared to the carboxylate, [Eu·L3]+.
| R-lactate | R-mandelate | R-cyclohexylhydroxyacetate | |
|---|---|---|---|
a Measurement in water only at pH 5.5 to eliminate the possibility of interference from bicarbonate.
b Binding of R-phenylpropionic acid was weak with log![[thin space (1/6-em)]](https://www.rsc.org/images/entities/char_2009.gif) K estimated to be less than 1.5 for the complexes of L2–4.
c Errors associated with the fitting analysis of a given data set are given in parentheses; experimental errors were estimated to be ± 0.1 log unit.
d Bicarbonate forms an adduct with each of these complexes,28 and the relative affinity (and sensitivity) fell in the order: [Eu·L2]3+ > [Eu·L3]+ ≫ [Eu·L1]+ > [Eu·L4]+. K estimated to be less than 1.5 for the complexes of L2–4.
c Errors associated with the fitting analysis of a given data set are given in parentheses; experimental errors were estimated to be ± 0.1 log unit.
d Bicarbonate forms an adduct with each of these complexes,28 and the relative affinity (and sensitivity) fell in the order: [Eu·L2]3+ > [Eu·L3]+ ≫ [Eu·L1]+ > [Eu·L4]+.
|
|||
| [Eu·L1]+ | 2.76(04) [2.41]a | — | — |
| [Eu·L2]3+ | 4.57(05) [4.58]a | 4.61(06)a | 5.06(05)a |
| [Eu·L3]+ | 4.01(04) | 4.52(06) | 5.38(04) |
| [Eu·L4]+ | 3.15(04) | 3.85(04) | 4.41(05) |
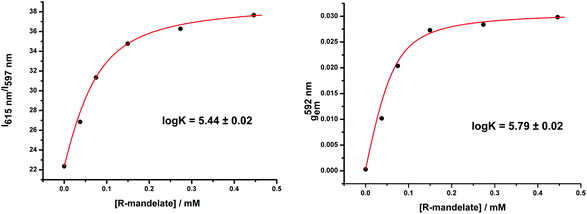
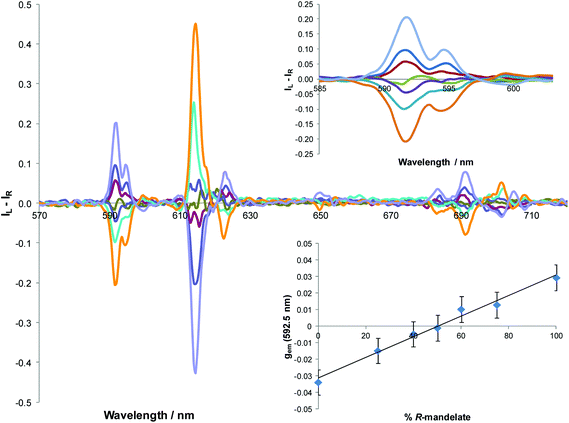
These stability data are based on total emission changes for all stereoisomeric anion adducts, irrespective of their configuration or constitution. By examining the change in gem with added anion concentration, information is gained on the stability of the major chiral species, i.e. the Δ over the Λ isomeric species. Such a comparison was undertaken for [Eu·L3]+ with R-mandelate, by measuring the variation in g with added anion compared to the total emission change. The experiment was carried out in methanol solution to optimise the CPL signal intensity (Fig. 2). In pure methanol solution, binding affinities are higher due to the smaller free energies of anion solvation. A slightly higher stability constant was found (log![[thin space (1/6-em)]](https://www.rsc.org/images/entities/char_2009.gif) K = 5.79 vs. 5.44) in this case, consistent with a slightly higher binding affinity for the favoured isomer (vide infra: this has a Δ configuration for the R-mandelate). Similar behaviour occurred for the other systems described here.
K = 5.79 vs. 5.44) in this case, consistent with a slightly higher binding affinity for the favoured isomer (vide infra: this has a Δ configuration for the R-mandelate). Similar behaviour occurred for the other systems described here.
Further information on the constitution of the anion adduct in each case can be gained by examining the emission decay rates of the anion adducts in water and D2O. A coordinated α-hydroxy-carboxylate in a 5-ring chelate, means that there is one OH oscillator in the Eu coordination environment. A quenching effect that is half of that created by a coordinated water occurs, assuming that the Ln–O distances are about the same. Earlier work substantiates this view, and X-ray studies of chelated lactate and citrate adducts show a Ln–O bond distance that is within 0.05 Å of the corresponding hydrated complexes.29,32 The rate data obtained (Table 3), shows that the lactate adduct for [Eu·L1]+ has no coordinated OH group, implying carboxylate binding only, whereas there is a bound hydroxyl group for complexes of L2 and L3.
| [Eu·L1]+ | [Eu·L1 lactate] | [Eu·L2]3+ | [Eu·L2 lactate]2+ | [Eu·L3]+ | [Eu·L3 lactate] | |
|---|---|---|---|---|---|---|
| k (H2O)/(ms−1) | 2.97 | 2.33 | 3.85 | 2.86 | 3.70 | 2.63 |
| k (D2O)/(ms−1) | 2.00 | 2.00 | 2.33 | 1.89 | 2.63 | 2.00 |
| q | 0.8 | 0.08 | 1.3 | 0.6 | 0.9 | 0.4 |
Induced CPL following binding of enantiopure acids
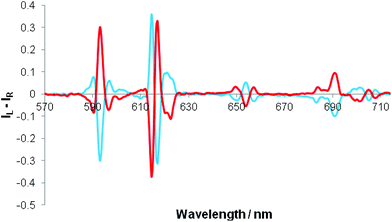
Separate addition of R and S enantiomers of a given chiral acid gave rise to mirror image induced circularly polarised luminescence (Fig. 3). The CPL spectra were very weak following addition of chiral acids lacking a coordinating α-substituent (e.g. S-ibuprofen, R-camphanic acid, R-phenylsuccinic acid), but were much stronger generally with α-hydroxy acids (e.g. lactic, mandelic, malic, cyclohexylhydroxyacetic). Furthermore, their circularly polarised luminescence spectrum were better resolved than the total emission spectrum in each case, notably in the ΔJ = 1 and ΔJ = 4 manifolds around 590 and 700 nm. The N-benzyl complex, [Eu·L4]+, gave rise to the strongest CPL spectra, amongst the systems studied, for the simple carboxylic acids. The CPL signature for the adduct of a simple chiral acid such as R-phenylpropionic acid was quite different to that with an α-hydroxy acid, e.g. for [Eu·L4]+, notably in the ΔJ = 1 and ΔJ = 2 transitions around 590 and 620 nm respectively (Fig. 4).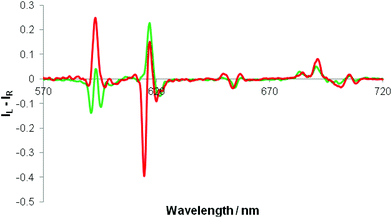 | ||
| Fig. 4 CPL spectra of [Eu·L4]+ following addition of R-phenylpropionic acid (green) and R-cyclohexylhydroxyacetic acid (red). (λexc 348 nm, 2 mM anion, 5 μM complex, MeOH, pH 5.5, 295 K). | ||
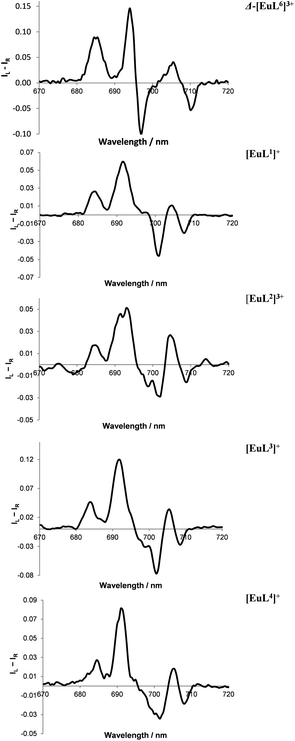 | ||
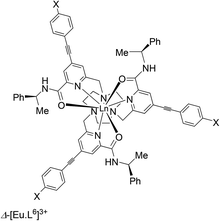
| Fig. 6 Partial CPL spectra for Eu(III) complexes of L1–4, compared to Δ-[Eu·L6]3+ (top), showing the similar ΔJ = 4 manifold in the presence of excess R-cyclohexylhydroxyacetic acid (295 K, H2O, 10 μM complex, 50 μM acid), correlating with selective formation of a Δ-complex in each case. Mirror image profiles were obtained adding S-acid (see ESI† for total emission and full CPL spectra of each system). | ||
| g em | [Eu·L1]+ | [Eu·L2]3+ | [Eu·L3]+ | [Eu·L4]+ | |
|---|---|---|---|---|---|
| R-Lactate | |||||
| ΔJ = 1 | (592 nm) | +0.01 | −0.03 | +0.02 | +0.05 |
| ΔJ = 4 | (683 nm) | +0.005 | +0.01 | +0.01 | +0.01 |
| (692 nm) | +0.02 | +0.02 | +0.01 | +0.02 | |
| (702 nm) | −0.02 | −0.01 | −0.01 | −0.02 | |
| (708 nm) | −0.04 | −0.04 | −0.03 | −0.06 | |
| R-Mandelate | |||||
| ΔJ = 1 | (592 nm) | +0.01 | −0.05 | +0.04 | +0.05 |
| ΔJ = 4 | (683 nm) | +0.01 | +0.01 | +0.01 | +0.01 |
| (692 nm) | +0.02 | +0.02 | +0.03 | +0.03 | |
| (702 nm) | −0.03 | −0.01 | −0.03 | −0.02 | |
| (708 nm) | −0.09 | −0.05 | −0.06 | −0.09 | |
| R-Cyclohexylhydroxyacetate | |||||
| ΔJ = 1 | (592 nm) | +0.02 | −0.05 | +0.07 | +0.06 |
| ΔJ = 4 | (683 nm) | +0.01 | +0.01 | +0.02 | +0.02 |
| (692 nm) | +0.02 | +0.03 | +0.04 | +0.04 | |
| (702 nm) | −0.02 | −0.01 | −0.07 | −0.03 | |
| (708 nm) | −0.09 | −0.08 | −0.09 | −0.11 | |
Stereochemistry of the anion adducts: NMR and DFT studies
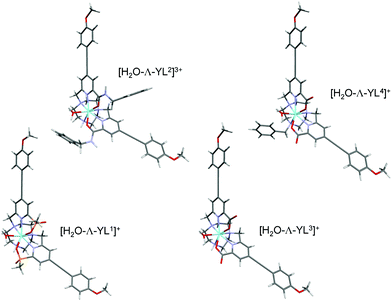
In order to gain further understanding of the structures of the isomeric complexes and lactate adducts, hybrid-DFT calculations were performed. As the paramagnetic europium(III) complexes are very difficult to model computationally, optimised geometries of the analogous diamagnetic yttrium(III) complexes have been investigated. It has been shown that they serve as suitable models for the Eu analogues;23,31,35–37 indeed, the Y(III) ion differs from the Eu(III) ion in ionic radius by only 0.05 Å. Excellent agreement was observed comparing bond lengths for the optimised geometries of yttrium(III) complexes at B3LYP/3-21G* with the reported X-ray diffraction geometries (ESI Tables S1 and S2†). This agreement indicates that the functional/basis set of B3LYP/3-21G* gives accurate model geometries of yttrium complexes with confidence and B3LYP/3-21G* is perhaps superior to alternative reported23,31,35–37 functionals and basis sets. A Y(III) model geometry from a reported34 X-ray geometry of a related europium complex optimised at B3LYP/3-21G* gave an excellent representation of the Eu(III) X-ray geometry (ESI Table S3†). The Y–O and Y–N bond lengths are shorter by 0.05 Å on average compared to the corresponding Eu–O and Eu–N bonds, as expected from the established ionic radii of the Y(III) and Eu(III) ions in coordination number 8 or 9 complexes.Investigation of the binding of one water molecule to each of the four complexes reveals binding energies of increasing strength in the order: [Y·L4]+ < [Y·L1]+ < [Y·L3]+ < [Y·L2]3+ (Fig. 7, ESI Table S4†). This sequence is consistent with the trend of observed radiative rate constants of decay of Eu(III) emission (Table 1). The relative energies of free and water bound conformers of [Y·L4]+ suggested an expected value of q = 1 rather than the observed q = 0 value derived from the emission rate constants of decay in water and D2O for [Eu·L4]. The steric demand imposed by the benzyl group does not appear to prevent water binding, on the basis of the calculated geometry using Y instead of Eu (Fig. 6). The discrepancy in the q values may be accounted for by a different argument. The metal-bound water complex may be of higher energy when the rotation of the benzyl group hinders formation of a stabilising hydrogen bond network between the coordinated water and its hydrogen-bonded (i.e. second-sphere) waters.
The binding energies of the anions R-lactate, R-mandelate and R-cyclohexyl-α-hydroxyacetate with a water molecule were calculated in order to assess the relative hydrophobicity of these anions. The order of increased binding energies (ESI, Table S6†) is cyclohexyl-α-hydroxyacetate < mandelate < lactate, corresponding to the sequence of binding affinities to the europium complexes that was observed experimentally (Table 2).
The binding energies of R-lactate with [Y·L1–4] also reveal a trend that is consistent with the association constants calculated by emission spectroscopy (Table 2), where R-lactate binds with increasing strength in the order: [Y·L1]+ < [Y·L4]+ ∼ [Y·L3]+ < [Y·L2]3+ (ESI Table S5†). Investigation of the geometries of R-lactate bound to [Y·L1]+ shows that the hydroxyl group of the coordinated lactate does not bind as strongly as in [Y·L2–4], with a longer Y–O distance of 2.7 Å compared to corresponding distances of 2.4–2.5 Å for complexes [Y·L2–4]. Close inspection of the optimised geometries of the R-lactate [Y·L1–4] adducts, reveals that the phosphinate groups in [Y·L1]+ are more sterically bulky than the corresponding amide or carboxylate donors in [Y·L2–4]. The increased steric demand results in less space being available for lactate binding via chelation (Fig. S7†). This interpretation lends support to the hypothesis that lactate coordinates to [Y·L1]+via the carboxylate group, either in a monodentate manner or via a 4-membered chelate. Such a hypothesis is corroborated by the differences in the observed radiative decay rate constants (Table 3).
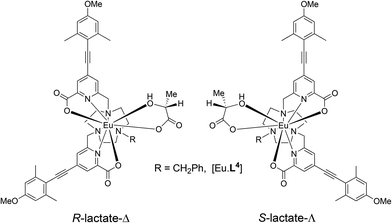
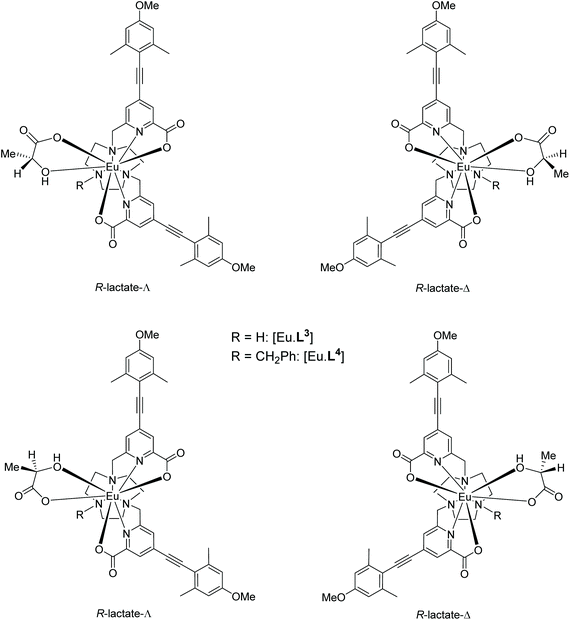
The constitution and relative stereochemistry of the isomeric adducts with a given Eu complex are difficult to determine in solution, without a crystallographic analysis. In principle, chelation of an α-hydroxy-acid for example, may give rise to four isomeric species: according to the orientation of the α-hydroxy chelate and the Δ/Λ complex configuration (Scheme 3). 1H NMR analysis (CD3OD) of the solvent and complex adducts were compromised by considerable line-broadening and the relatively small dipolar shifts that characterise these types of complex, associated with their relatively small ligand field splitting.12 Nevertheless, addition of R-lactate to [Eu·L3]+ led to a general sharpening of the observed resonances and the most shifted axial ring proton resonance (by analogy with the analysis of [Eu·L7]), was observed to shift to lower frequency (ΔδH = −1.5 ppm) compared to the solvate species; four species were observed in relative ratio 3![[thin space (1/6-em)]](https://www.rsc.org/images/entities/char_2009.gif) :
:![[thin space (1/6-em)]](https://www.rsc.org/images/entities/char_2009.gif) 1
1![[thin space (1/6-em)]](https://www.rsc.org/images/entities/char_2009.gif) :
:![[thin space (1/6-em)]](https://www.rsc.org/images/entities/char_2009.gif) 0.8
0.8![[thin space (1/6-em)]](https://www.rsc.org/images/entities/char_2009.gif) :
:![[thin space (1/6-em)]](https://www.rsc.org/images/entities/char_2009.gif) 0.7 (295 K, 11.7 T).
0.7 (295 K, 11.7 T).
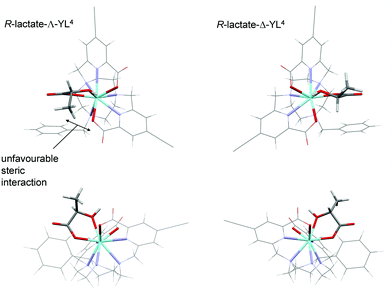
Calculations were performed to assess the relative energies of the four isomeric adducts depicted as Y(III) complexes, in an attempt to reveal whether the presence of non-bonding steric interactions could rationalise the preferred formation of a particular isomer. For each yttrium complex, the preferred constitution of the lactate chelate placed the 2-pyridyl nitrogen atoms in the same plane as the lactate carboxylate oxygen (ESI Table S7†). Thus, the lowest energy isomer (Scheme 3, bottom right) possesses a Δ configuration for the R-lactate adduct, consistent with the assignment of configuration using the CPL data. The energy difference between the two low energy isomers increases in the order [Y·L2]3+ < [Y·L3]+ < [Y·L1]+ < [Y·L4]+. Such a sequence accords with the observation that the N-benzyl complex [Eu·L4]+ has the highest gem values for 70% of the induced CPL transitions in the complexes studied here. Inspection of the calculated geometries shows that in the R-lactate adduct, the Me group points away from a coordinated carboxylate oxygen lone pair (Fig. 8); i.e. such an interaction destabilises the S-lactate-Δ adduct formation.
Summary and conclusions
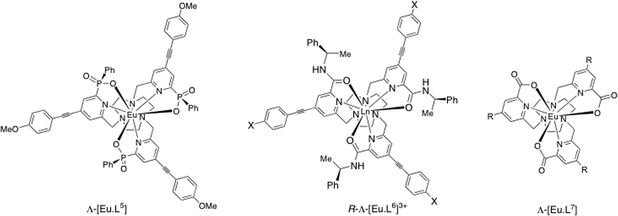
The helicity of this class of complexes based on the 9-N3 ring can be controlled by introduction of a stereogenic centre into the ligand structure. Thus, C-substitution into the 2 position of the macrocyclic 9-membered ring with an R configuration leads to formation of >98% of the Δ complex for the phosphinate and carboxylate series.3,26 The presence of an R stereocentre in the amide moiety (as in R-[Eu·L6]3+), above, gives rise to selective formation of the Λ complex (a 15![[thin space (1/6-em)]](https://www.rsc.org/images/entities/char_2009.gif) :
:![[thin space (1/6-em)]](https://www.rsc.org/images/entities/char_2009.gif) 1 ratio in this case).34 These two recent examples, describing covalent modification of the ligand structure suggest a degree of cooperativity or chiral amplification in formation of the preferred complex helicity, as defined by the sign of the three NCCNpy torsion angles.
1 ratio in this case).34 These two recent examples, describing covalent modification of the ligand structure suggest a degree of cooperativity or chiral amplification in formation of the preferred complex helicity, as defined by the sign of the three NCCNpy torsion angles.
In the new work discussed here, there are only two such NCCNpy torsion angles; non-covalent formation of a ternary complex with enantiopure anions has been examined. A common pattern emerged: an R acid configuration favours formation of a Δ complex and leads to a strong induced CPL signal. The NMR and DFT studies provide some supporting evidence for this analysis: a preferred major isomer was observed in which the anion carboxylate lies in the same plane as the pyridyl nitrogens. The induced CPL gem values are significant albeit lacking the very high stereoselectivity and larger gem values that characterise the behaviour of the more conformationally rigid, trisubstituted 9-coordinate systems.
The substitution of the third N position plays a key role. The N-benzyl complex gave the highest gem values for 70% of the induced CPL transitions, consistent with the tentative hypothesis that the N-benzyl may align helically in the same sense as the two coordinated pyridylmethyl groups to create a slightly more rigidified local chiral structure.
Finally, this work provides a starting point for developing enhanced selectivity in the association of the chiral analyte. For example, based on the N-benzyl system, introduction of charged groups or directed hydrogen bonding or chelating moieties, e.g. NH2Me+ or a boronic acid group, into the benzyl ring may allow additional stabilising interactions to occur that will enhance affinity and stereoselectivity. The outcome of such work will be reported subsequently.
Experimental
Details of the synthesis of the stated precursors, general experimental aspects and spectroscopic, analytical and computational methods are given in the ESI.†N-Benzyl-6-(hydroxymethyl)-4-iodopicolinamide, 2
HOBt·H2O (254 mg, 1.88 mmol), EDC (292 mg, 1.88 mmol), DIPEA (0.44 mL, 2.51 mmol) and benzylamine (0.15 mL, 1.38 mmol) were dissolved in anhydrous DMF (3 mL). The carboxylic acid, 1, (350 mg, 1.25 mmol in 1 mL DMF) was added slowly and dropwise to the solution and the mixture stirred at rt for 22 h under an argon atmosphere. The solvent was removed under reduced pressure, water was added to the crude residue and the mixture extracted with EtOAc (4 × 20 mL). The organic layers were combined and washed successively with water (1 × 20 mL) and brine (1 × 20 mL), dried over MgSO4 and the solvent removed under reduced pressure. The crude mixture was purified by flash column chromatography (silica, gradient elution starting from 10% EtOAc in hexane to 50% EtOAc in hexane) to give a yellow oil (284 mg, 62%). Rf 0.35 (silica, 50% EtOAc in hexane); 1H NMR (295 K, 400 MHz, CDCl3) δH 8.48 (1H, s, py–H3), 8.22 (1H, s, NH), 7.91 (1H, s, py–H5), 7.34–7.27 (5H, m, Ph–H), 4.72 (2H, s, py–CH2), 4.64 (2H, d, 3J 6, C
![[H with combining low line]](https://www.rsc.org/images/entities/char_0048_0332.gif) 2Ph); 13C NMR (295 K, 100 MHz, CDCl3) δC 162.9 (
2Ph); 13C NMR (295 K, 100 MHz, CDCl3) δC 162.9 (![[C with combining low line]](https://www.rsc.org/images/entities/char_0043_0332.gif) ONH), 159.7 (py–C6), 149.2 (py–C2), 138.0 (Ph–Ci), 132.6 (py–C5), 130.8 (py–C3), 128.9 (Ph–Cm), 128.0 (Ph–Cp), 127.8 (Ph–Co), 107.9 (py–C4), 64.3 (py–
ONH), 159.7 (py–C6), 149.2 (py–C2), 138.0 (Ph–Ci), 132.6 (py–C5), 130.8 (py–C3), 128.9 (Ph–Cm), 128.0 (Ph–Cp), 127.8 (Ph–Co), 107.9 (py–C4), 64.3 (py–![[C with combining low line]](https://www.rsc.org/images/entities/char_0043_0332.gif) H2), 43.7 (
H2), 43.7 (![[C with combining low line]](https://www.rsc.org/images/entities/char_0043_0332.gif) H2Ph); m/z (HRMS+) 390.9893 [M + Na]+ (C14H13N2O2NaI127 requires 390.9919).
H2Ph); m/z (HRMS+) 390.9893 [M + Na]+ (C14H13N2O2NaI127 requires 390.9919).
N-Benzyl-6-(hydroxymethyl)-4-((4-methoxyphenyl)ethynyl)picolinamide, 3
The alcohol, 2, (263 mg, 0.714 mmol) was dissolved in anhydrous THF (4 mL) and the solution was degassed (freeze–thaw cycle) three times. 4-Ethynyl anisole (140 μL, 1.07 mmol) and triethylamine (0.50 mL, 3.57 mmol) were added and the solution was degassed (freeze–thaw cycle) once more. [1,1-Bis(diphenylphosphino)ferrocene]dichloropalladium(II) (52 mg, 0.07 mmol) and CuI (27 mg, 0.143 mmol) were added and the resulting brown solution was stirred at 65 °C under argon for 24 h. The solvent was removed under reduced pressure and the pale brown solid was purified by column chromatography (silica, gradient elution starting from 100% CH2Cl2 to 2% CH3OH in CH2Cl2 in 0.2% increments) to give an off white solid (210 mg, 80%). Rf 0.75 (silica, 7% CH3OH in CH2Cl2); m.p. 152–153 °C; 1H NMR (295 K, 400 MHz, CDCl3) δH 8.23 (1H, br t, 3J 6, CON
![[H with combining low line]](https://www.rsc.org/images/entities/char_0048_0332.gif) ), 8.21 (1H, s, py–H3), 7.53 (1H, s, py–H5), 7.50 (2H, dt, 4J 2, 3J 8, Ar–H3/3′), 7.37–7.34 (4H, m, Ph–Ho, Ph–Hm), 7.29 (1H, m, Ph–Hp), 6.91 (2H, dt, 4J 2, 3J 8, Ar–H2/2′), 4.77 (2H, s, py–CH2), 4.68 (2H, d, 3J 6, CH2Ph), 3.85 (3H, s, OCH3); 13C NMR (295 K, 100 MHz, CDCl3) δC 163.7 (
), 8.21 (1H, s, py–H3), 7.53 (1H, s, py–H5), 7.50 (2H, dt, 4J 2, 3J 8, Ar–H3/3′), 7.37–7.34 (4H, m, Ph–Ho, Ph–Hm), 7.29 (1H, m, Ph–Hp), 6.91 (2H, dt, 4J 2, 3J 8, Ar–H2/2′), 4.77 (2H, s, py–CH2), 4.68 (2H, d, 3J 6, CH2Ph), 3.85 (3H, s, OCH3); 13C NMR (295 K, 100 MHz, CDCl3) δC 163.7 (![[C with combining low line]](https://www.rsc.org/images/entities/char_0043_0332.gif) ONH), 160.7 (Ar–C1), 158.7 (py–C6), 149.2 (py–C2), 138.2 (Ci), 134.6 (Ar–C4), 133.8 (Ar–C3,3′), 128.9 (Ph–C), 128.0 (Ph–C), 127.8 (Ph–C), 124.7 (py–C5), 123.5 (py–C3), 114.4 (Ar–C2,2′), 114.0 (py–C4), 96.1 (C5), 85.6 (C6), 64.6 (py–
ONH), 160.7 (Ar–C1), 158.7 (py–C6), 149.2 (py–C2), 138.2 (Ci), 134.6 (Ar–C4), 133.8 (Ar–C3,3′), 128.9 (Ph–C), 128.0 (Ph–C), 127.8 (Ph–C), 124.7 (py–C5), 123.5 (py–C3), 114.4 (Ar–C2,2′), 114.0 (py–C4), 96.1 (C5), 85.6 (C6), 64.6 (py–![[C with combining low line]](https://www.rsc.org/images/entities/char_0043_0332.gif) H2), 55.5 (O
H2), 55.5 (O![[C with combining low line]](https://www.rsc.org/images/entities/char_0043_0332.gif) H3), 43.7 (
H3), 43.7 (![[C with combining low line]](https://www.rsc.org/images/entities/char_0043_0332.gif) H2Ph); m/z (HRMS+) 373.1561 [M + H]+ (C23H21N2O3 requires 373.1552).
H2Ph); m/z (HRMS+) 373.1561 [M + H]+ (C23H21N2O3 requires 373.1552).
(6-(Benzylcarbamoyl)-4-((4-methoxyphenyl)ethynyl)pyridin-2-yl)methyl methanesulfonate, 4
The alcohol, 3, (201 mg, 0.54 mmol) was dissolved in anhydrous THF (4 mL) and NEt3 (0.26 mL, 1.89 mmol) was added. The mixture was stirred at 5 °C, methanesulfonyl chloride (0.06 mL, 0.81 mmol) was added and the reaction stirred at rt for 30 minutes and monitored by TLC. The solvent was removed under reduced pressure and the residue dissolved in CH2Cl2 (20 mL) and washed with NaCl solution (saturated, 20 mL). The aqueous layer was re-extracted with CH2Cl2 (3 × 20 mL) and the organic layers were combined, dried over MgSO4, filtered and the solvent removed under reduced pressure to yield a bright yellow oil (254 mg), which was used directly in the next step without further purification. Rf 0.72 (silica, 100% EtOAc); 1H NMR (295 K, 700 MHz, CDCl3) δH 8.27 (1H, d, 3J 1.5, py–H5), 8.26 (1H, t, 3J 6, CON
![[H with combining low line]](https://www.rsc.org/images/entities/char_0048_0332.gif) ), 7.63 (1H, d, 3J 1.5, py–H3), 7.51 (2H, dt, 4J 2.5, 3J 9, Ar–H3/3′), 7.37–7.29 (5H, m, Ph–H), 6.92 (2H, dt, 4J 2.5, 3J 9, Ar–H2/2′), 5.30 (2H, s, py–C
), 7.63 (1H, d, 3J 1.5, py–H3), 7.51 (2H, dt, 4J 2.5, 3J 9, Ar–H3/3′), 7.37–7.29 (5H, m, Ph–H), 6.92 (2H, dt, 4J 2.5, 3J 9, Ar–H2/2′), 5.30 (2H, s, py–C![[H with combining low line]](https://www.rsc.org/images/entities/char_0048_0332.gif) 2), 4.68 (2H, d, 3J 6, C
2), 4.68 (2H, d, 3J 6, C![[H with combining low line]](https://www.rsc.org/images/entities/char_0048_0332.gif) 2Ph), 3.85 (3H, s, OC
2Ph), 3.85 (3H, s, OC![[H with combining low line]](https://www.rsc.org/images/entities/char_0048_0332.gif) 3), 3.07 (3H, s, SO2C
3), 3.07 (3H, s, SO2C![[H with combining low line]](https://www.rsc.org/images/entities/char_0048_0332.gif) 3); m/z (HRMS+) 451.1320 [M + H]+ (C24H23N2O5S requires 451.1328).
3); m/z (HRMS+) 451.1320 [M + H]+ (C24H23N2O5S requires 451.1328).
tert-Butyl-4,7-bis((6-(benzylcarbamoyl)-4-((4-methoxyphenyl)ethynyl)pyridin-2-yl)methyl)-1,4,7-triazacyclononane-1-carboxylate, 5
tert-Butyl-1,4,7-triazacyclononane-1-carboxylate dihydrochloride (82 mg, 0.27 mmol) and the mesylate, 4, (243 mg, 0.54 mmol) were dissolved in anhydrous CH3CN (10 mL) and K2CO3 (149 mg, 1.08 mmol) was added. The mixture was stirred under argon at 78 °C. After 24 h the reaction was cooled and filtered to remove excess potassium salts. The solvent was removed under reduced pressure and the crude material purified by column chromatography (silica, gradient elution starting from 100% CH2Cl2 to 5% CH3OH in CH2Cl2 in 0.2% increments) to give a pale yellow oil (170 mg, 67%). Rf 0.39 (silica, 5% CH3OH in CH2Cl2); 1H NMR (295 K, 700 MHz, CDCl3) δH 8.44 (1H, t, 3J 6.5, CON
![[H with combining low line]](https://www.rsc.org/images/entities/char_0048_0332.gif) ), 8.39 (1H, t, 3J 6.5, CON
), 8.39 (1H, t, 3J 6.5, CON![[H with combining low line]](https://www.rsc.org/images/entities/char_0048_0332.gif) ′), 8.17 (1H, s, py–H5), 8.16 (1H, s, py–H5′), 7.64 (1H, s, py–H3), 7.57 (1H, s, py–H3′), 7.48 (4H, d, 3J 9, Ar–H3/3′), 7.35–7.24 (10H, m, Ph–H), 6.89 (4H, d, 3J 9, Ar–H2/2′), 4.65 (4H, d, 3J 6.5, C
′), 8.17 (1H, s, py–H5), 8.16 (1H, s, py–H5′), 7.64 (1H, s, py–H3), 7.57 (1H, s, py–H3′), 7.48 (4H, d, 3J 9, Ar–H3/3′), 7.35–7.24 (10H, m, Ph–H), 6.89 (4H, d, 3J 9, Ar–H2/2′), 4.65 (4H, d, 3J 6.5, C![[H with combining low line]](https://www.rsc.org/images/entities/char_0048_0332.gif) 2Ph), 3.83 (6H, s, OC
2Ph), 3.83 (6H, s, OC![[H with combining low line]](https://www.rsc.org/images/entities/char_0048_0332.gif) 3), 3.82 (4H, s, py–C
3), 3.82 (4H, s, py–C![[H with combining low line]](https://www.rsc.org/images/entities/char_0048_0332.gif) 2), 3.31–3.26 (4H, m, ring Hs), 3.05–2.96 (4H, m, ring Hs), 2.68–2.62 (4H, m, ring Hs), 1.45 (9H, s, O(C
2), 3.31–3.26 (4H, m, ring Hs), 3.05–2.96 (4H, m, ring Hs), 2.68–2.62 (4H, m, ring Hs), 1.45 (9H, s, O(C![[H with combining low line]](https://www.rsc.org/images/entities/char_0048_0332.gif) 3)3); 13C NMR (295 K, 175 MHz, CDCl3) δC 164.1 (CONH), 164.0 (CONH), 160.6 (Ar–C1), 160.5 (py–C2), 159.3 (py–C2′), 149.5 (py–C6), 149.3 (py–C6′), 138.4 (Ci), 138.3 (Ci), 138.4 (Ar–C4), 138.3 (Ar–C3/3′), 133.8 (Ph–C), 133.7 (Ph–C), 128.8 (Ph–C), 128.7 (Ph–C), 128.0 (py–C3), 127.9 (py–C3′), 122.8 (py–C5), 122.7 (py–C5′), 114.3 (Ar–C2/2′), 114.1 (py–C4), 114.0 (py–C4′), 95.4 (C5), 95.1 (C5′), 85.9 (C6), 85.8 (C6′), 62.9 (py–
3)3); 13C NMR (295 K, 175 MHz, CDCl3) δC 164.1 (CONH), 164.0 (CONH), 160.6 (Ar–C1), 160.5 (py–C2), 159.3 (py–C2′), 149.5 (py–C6), 149.3 (py–C6′), 138.4 (Ci), 138.3 (Ci), 138.4 (Ar–C4), 138.3 (Ar–C3/3′), 133.8 (Ph–C), 133.7 (Ph–C), 128.8 (Ph–C), 128.7 (Ph–C), 128.0 (py–C3), 127.9 (py–C3′), 122.8 (py–C5), 122.7 (py–C5′), 114.3 (Ar–C2/2′), 114.1 (py–C4), 114.0 (py–C4′), 95.4 (C5), 95.1 (C5′), 85.9 (C6), 85.8 (C6′), 62.9 (py–![[C with combining low line]](https://www.rsc.org/images/entities/char_0043_0332.gif) H2), 56.3 (ring C), 55.4 (O
H2), 56.3 (ring C), 55.4 (O![[C with combining low line]](https://www.rsc.org/images/entities/char_0043_0332.gif) H3), 54.9 (ring C), 54.5 (ring C), 53.9 (ring C), 50.1 (ring C), 49.6 (ring C), 43.6 (
H3), 54.9 (ring C), 54.5 (ring C), 53.9 (ring C), 50.1 (ring C), 49.6 (ring C), 43.6 (![[C with combining low line]](https://www.rsc.org/images/entities/char_0043_0332.gif) H2Ph), 43.5 (
H2Ph), 43.5 (![[C with combining low line]](https://www.rsc.org/images/entities/char_0043_0332.gif) H2Ph), 28.7 (O(
H2Ph), 28.7 (O(![[C with combining low line]](https://www.rsc.org/images/entities/char_0043_0332.gif) H3)3); m/z (HRMS+) 938.4594 [M + H]+ (C57H60N7O6 requires 938.4605).
H3)3); m/z (HRMS+) 938.4594 [M + H]+ (C57H60N7O6 requires 938.4605).
6,6′-((1,4,7-Triazacyclononane-1,4-diyl)bis(methylene))bis(N-benzyl-4-((4-methoxyphenyl)ethynyl)picolinamide), L2
The BOC protected ligand, 5, (60 mg, 0.064 mmol) was dissolved in anhydrous CH2Cl2 (3 mL) and trifluoroacetic acid (0.6 mL) was added. The solution was stirred under argon at 23 °C for 30 min. TLC (silica; 10% CH3OH in CH2Cl2, Rf (product) = 0.25, Rf (reactant) = 0.61) was used to confirm removal of the tert-butoxycarbonyl group. The solvent was removed under reduced pressure and the residue re-dissolved in CH2Cl2 (2 mL). This process was repeated 5 times to ensure removal of excess trifluoroacetic acid. The crude residue was purified by preparative RP-HPLC (gradient: 30–100% CH3OH (0.1% formic acid) in water (0.1% formic acid) over 18 min; tR 14.6 min) to afford a white solid (41 mg, 72%). Rf 0.25 (silica, 10% CH3OH in CH2Cl2); m.p. 156–158 °C; 1H NMR (295 K, 700 MHz, CDCl3) δH 7.92 (2H, s, py–H3), 7.63 (2H, s, py–H5), 7.38 (4H, d, 3J 8.5, Ar–H3/3′), 7.32–7.21 (10H, m, Ph–H), 6.91 (4H, d, 3J 8.5, Ar–H2/2′), 4.59 (4H, s, C
![[H with combining low line]](https://www.rsc.org/images/entities/char_0048_0332.gif) 2Ph), 3.95 (4H, s, py–C
2Ph), 3.95 (4H, s, py–C![[H with combining low line]](https://www.rsc.org/images/entities/char_0048_0332.gif) 2), 3.78 (6H, s, OC
2), 3.78 (6H, s, OC![[H with combining low line]](https://www.rsc.org/images/entities/char_0048_0332.gif) 3), 3.06 (4H, m, ring Hs), 2.93 (4H, m, ring Hs), 2.74 (4H, m, ring Hs); 13C NMR (295 K, 175 MHz, CDCl3) δC 116.0 (
3), 3.06 (4H, m, ring Hs), 2.93 (4H, m, ring Hs), 2.74 (4H, m, ring Hs); 13C NMR (295 K, 175 MHz, CDCl3) δC 116.0 (![[C with combining low line]](https://www.rsc.org/images/entities/char_0043_0332.gif) ONH), 162.3 (Ar–C1), 159.9 (py–C6), 151.1 (py–C2), 139.7 (Ci), 135.4 (Ar–C4), 134.6 (Ar–C3/3′), 129.7 (Ph–C), 128.7 (Ph–C), 128.5 (Ph–C), 128.0 (py–C5), 123.8 (py–C3), 115.4 (Ar–C2/2′), 114.7 (py–C4), 96.8 (C5), 86.0 (C6), 61.5 (py–
ONH), 162.3 (Ar–C1), 159.9 (py–C6), 151.1 (py–C2), 139.7 (Ci), 135.4 (Ar–C4), 134.6 (Ar–C3/3′), 129.7 (Ph–C), 128.7 (Ph–C), 128.5 (Ph–C), 128.0 (py–C5), 123.8 (py–C3), 115.4 (Ar–C2/2′), 114.7 (py–C4), 96.8 (C5), 86.0 (C6), 61.5 (py–![[C with combining low line]](https://www.rsc.org/images/entities/char_0043_0332.gif) H2), 55.9 (O
H2), 55.9 (O![[C with combining low line]](https://www.rsc.org/images/entities/char_0043_0332.gif) H3), 51.6 (ring C), 45.1 (ring C), 44.3 (
H3), 51.6 (ring C), 45.1 (ring C), 44.3 (![[C with combining low line]](https://www.rsc.org/images/entities/char_0043_0332.gif) H2Ph); m/z (HRMS+) 838.4083 [M + H]+ (C52H52N7O4 requires 838.4081).
H2Ph); m/z (HRMS+) 838.4083 [M + H]+ (C52H52N7O4 requires 838.4081).
[EuL2](OTf)3
The deprotected ligand, L2, was subjected to ion exchange chromatography to remove any formate present (from HPLC purification). The ligand (4 mg, 0.005 mmol) was dissolved in CH3OH and Eu(OTf)3 (3 mg, 0.005 mmol) was added. The solution was stirred at 60 °C for 24 h and the extent of the reaction was monitored by analytical HPLC (complex: RT = 10.57, ligand RT = 12.74; 10–100% CH3OH (0.1% formic acid)![[thin space (1/6-em)]](https://www.rsc.org/images/entities/char_2009.gif) :
:![[thin space (1/6-em)]](https://www.rsc.org/images/entities/char_2009.gif) H2O (0.1% formic acid)). The solvent was removed under reduced pressure to give a white solid that was used directly without any further purification. LRMS (ESI MeCN) m/z 1285 [M + 2(CF3SO3)]+, 569 [M + (CF3SO3)]2+. λexc (MeOH) = 348 nm; ϕ (MeOH) 0.02, ε (MeOH) 40
H2O (0.1% formic acid)). The solvent was removed under reduced pressure to give a white solid that was used directly without any further purification. LRMS (ESI MeCN) m/z 1285 [M + 2(CF3SO3)]+, 569 [M + (CF3SO3)]2+. λexc (MeOH) = 348 nm; ϕ (MeOH) 0.02, ε (MeOH) 40![[thin space (1/6-em)]](https://www.rsc.org/images/entities/char_2009.gif) 000 M−1 cm−1; τ (H2O) = 0.26 ms, τ (D2O) = 0.43 ms, q = 1.3.
000 M−1 cm−1; τ (H2O) = 0.26 ms, τ (D2O) = 0.43 ms, q = 1.3.
((4-Methoxy-2,6-dimethylphenyl)ethynyl)trimethylsilane
2-Iodo-5-methoxy-1,3-dimethylbenzene (1.34 g, 5.12 mmol) was dissolved in anhydrous THF (13 mL) and the solution was degassed (freeze–thaw cycle) three times. Ethynyl trimethylsilane (2.18 mL, 15.4 mmol) and triethylamine (3.57 mL, 25.6 mmol) were added and the solution was degassed (freeze–thaw cycle) once more. [1,1-Bis(diphenylphosphino)ferrocene]dichloropalladium(II) (374 mg, 0.511 mmol) and CuI (195 mg, 1.02 mmol) were added and the resulting brown solution was stirred at 65 °C under argon for 24 h. The solvent was removed under reduced pressure and the resulting brown oil was purified by column chromatography (silica, gradient elution starting from 100% hexane to 6% CH2Cl2 in hexane in 0.2% increments) to afford a bright yellow oil (742 mg, 62%). Rf 0.19 (silica, 10% CH2Cl2 in hexane); 1H NMR (295 K, 400 MHz, CDCl3) δH 6.57 (2H, s, Ar–H), 3.77 (3H, s, OC
![[H with combining low line]](https://www.rsc.org/images/entities/char_0048_0332.gif) 3), 2.41 (6H, s, C
3), 2.41 (6H, s, C![[H with combining low line]](https://www.rsc.org/images/entities/char_0048_0332.gif) 3), 0.25 (9H, s, Si(C
3), 0.25 (9H, s, Si(C![[H with combining low line]](https://www.rsc.org/images/entities/char_0048_0332.gif) 3)3); 13C NMR (295 K, 100 MHz, CDCl3) δC 159.2 (Ar–C1), 142.6 (Ar–C), 113.1 (Ar–C), 112.5 (Ar–C), 103.1 (alkyne C), 101.0 (alkyne C), 55.3 (O
3)3); 13C NMR (295 K, 100 MHz, CDCl3) δC 159.2 (Ar–C1), 142.6 (Ar–C), 113.1 (Ar–C), 112.5 (Ar–C), 103.1 (alkyne C), 101.0 (alkyne C), 55.3 (O![[C with combining low line]](https://www.rsc.org/images/entities/char_0043_0332.gif) H3), 21.4 (
H3), 21.4 (![[C with combining low line]](https://www.rsc.org/images/entities/char_0043_0332.gif) H3), 0.40 (Si(
H3), 0.40 (Si(![[C with combining low line]](https://www.rsc.org/images/entities/char_0043_0332.gif) H3)3); GC-EI, tR = 4.47, m/z 232 (M+), 217 (M+ − CH3).
H3)3); GC-EI, tR = 4.47, m/z 232 (M+), 217 (M+ − CH3).
2-Ethynyl-5-methoxy-1,3-dimethylbenzene, 6![[thin space (1/6-em)]](https://www.rsc.org/images/entities/h3_char_2009.gif) 23
23
The silyl-protected alkyne (400 mg, 1.72 mmol) was dissolved in dry THF (7 mL) and triethylamine trihydrofluoride (2.80 mL, 17.2 mmol) was added. The solution was stirred at 40 °C under argon for 72 h. The solvent was removed under reduced pressure and the crude residue was purified by flash column chromatography (silica, gradient elution starting from 100% hexane to 2% CH2Cl2 in hexane in 0.2% increments) to give a pale yellow oil (154 mg, 56%). Rf 0.19 (silica, 10% CH2Cl2 in hexane); 1H NMR (295 K, 400 MHz, CDCl3) δH 6.60 (2H, s, Ar–H), 3.79 (3H, s, OC
![[H with combining low line]](https://www.rsc.org/images/entities/char_0048_0332.gif) 3), 3.43 (1H, s, ArCC
3), 3.43 (1H, s, ArCC![[H with combining low line]](https://www.rsc.org/images/entities/char_0048_0332.gif) ), 2.44 (6H, s, 2C
), 2.44 (6H, s, 2C![[H with combining low line]](https://www.rsc.org/images/entities/char_0048_0332.gif) 3); 13C NMR (295 K, 100 MHz, CDCl3) δC 159.3 (Ar–C1), 142.8 (Ar–C), 144.4 (Ar–C), 112.5 (Ar–C), 83.9 (alkyne C), 81.4 (alkyne C), 55.3 (O
3); 13C NMR (295 K, 100 MHz, CDCl3) δC 159.3 (Ar–C1), 142.8 (Ar–C), 144.4 (Ar–C), 112.5 (Ar–C), 83.9 (alkyne C), 81.4 (alkyne C), 55.3 (O![[C with combining low line]](https://www.rsc.org/images/entities/char_0043_0332.gif) H3), 21.4 (2
H3), 21.4 (2![[C with combining low line]](https://www.rsc.org/images/entities/char_0043_0332.gif) H3); GC-EI t = 3.75, m/z 160 (M+), 145 (M+ − CH3).
H3); GC-EI t = 3.75, m/z 160 (M+), 145 (M+ − CH3).
Methyl 6-(hydroxymethyl)-4-((4-methoxy-2,6-dimethylphenyl)ethynyl)picolinate, 7![[thin space (1/6-em)]](https://www.rsc.org/images/entities/h3_char_2009.gif) 23
23
Methyl 6-(hydroxymethyl)-4-iodopicolinate, (243 mg, 0.829 mmol) was dissolved in anhydrous THF (5 mL) and the solution was degassed (freeze–pump–thaw cycle) three times. The alkyne, 2-ethynyl-5-methoxy-1,3-dimethylbenzene, (146 mg, 0.913 mmol) and triethylamine (0.58 mL, 4.14 mmol) were added and the solution was degassed (freeze–pump–thaw cycle) once more. [1,1-Bis(diphenylphosphino)ferrocene]dichloropalladium(II) (61 mg, 0.083 mmol) and CuI (32 mg, 0.168 mmol) were added and the resulting brown solution was stirred at 65 °C under argon for 24 h. The solvent was removed under reduced pressure and the resulting brown oil was purified by column chromatography (silica, gradient elution starting from 100% hexane to 70% EtOAc in hexane in 10% increments) to give a white solid (169 mg, 63%). Rf 0.31 (silica, 100% EtOAc); m.p. 177–179 °C; 1H NMR (295 K, 700 MHz, CDCl3) δH 8.05 (1H, s, py–H3), 7.58 (1H, s, py–H5), 6.63 (2H, s, Ar–H2,2′), 4.86 (2H, s, py–C
![[H with combining low line]](https://www.rsc.org/images/entities/char_0048_0332.gif) 2), 4.01 (3H, s, CO2C
2), 4.01 (3H, s, CO2C![[H with combining low line]](https://www.rsc.org/images/entities/char_0048_0332.gif) 3), 3.80 (3H, s, OC
3), 3.80 (3H, s, OC![[H with combining low line]](https://www.rsc.org/images/entities/char_0048_0332.gif) 3), 2.49 (6H, s, C
3), 2.49 (6H, s, C![[H with combining low line]](https://www.rsc.org/images/entities/char_0048_0332.gif) 3); 13C NMR (295 K, 175 MHz, CDCl3) δC 165.5 (
3); 13C NMR (295 K, 175 MHz, CDCl3) δC 165.5 (![[C with combining low line]](https://www.rsc.org/images/entities/char_0043_0332.gif) O2CH3), 160.6 (Ar–C1), 160.2 (py–C6), 147.3 (Ar–C4), 143.1 (py–C2), 134.4 (Ar–C3,3′), 125.5 (py–C3), 125.2 (py–C5), 114.0 (py–C4), 112.8 (Ar–C2,2′), 94.0 (alkyne C5), 93.3 (alkyne C6), 64.7 (py–
O2CH3), 160.6 (Ar–C1), 160.2 (py–C6), 147.3 (Ar–C4), 143.1 (py–C2), 134.4 (Ar–C3,3′), 125.5 (py–C3), 125.2 (py–C5), 114.0 (py–C4), 112.8 (Ar–C2,2′), 94.0 (alkyne C5), 93.3 (alkyne C6), 64.7 (py–![[C with combining low line]](https://www.rsc.org/images/entities/char_0043_0332.gif) H2), 55.3 (O
H2), 55.3 (O![[C with combining low line]](https://www.rsc.org/images/entities/char_0043_0332.gif) H3), 53.1 (CO2
H3), 53.1 (CO2![[C with combining low line]](https://www.rsc.org/images/entities/char_0043_0332.gif) H3), 21.5 (
H3), 21.5 (![[C with combining low line]](https://www.rsc.org/images/entities/char_0043_0332.gif) H3); m/z (HRMS+) 326.1378 [M + H]+ (C19H20NO4 requires 326.1392).
H3); m/z (HRMS+) 326.1378 [M + H]+ (C19H20NO4 requires 326.1392).
Methyl 4-((4-methoxy-2,6-dimethylphenyl)ethynyl)-6-(((methylsulfonyl)oxy)methyl)picolinate, 8![[thin space (1/6-em)]](https://www.rsc.org/images/entities/h3_char_2009.gif) 23
23
The alcohol, 7, (89 mg, 0.274 mmol) was dissolved in anhydrous THF (3 mL) and NEt3 (0.13 mL, 0.959 mmol) was added. The mixture was stirred at 5 °C, methanesulfonyl chloride (30 μL, 0.411 mmol) was added and the reaction stirred at rt for 30 minutes and monitored by TLC. The solvent was removed under reduced pressure and the residue dissolved in EtOAc (15 mL) and washed with NaCl solution (saturated, 15 mL). The aqueous layer was re-extracted with EtOAc (3 × 15 mL) and the organic layers were combined, dried over MgSO4, filtered and the solvent removed under reduced pressure to yield the mesylate, as a bright yellow oil (107 mg, 97%), which was used directly in the next step without further purification. Rf 0.63 (silica, 100% EtOAc); 1H NMR (295 K, 400 MHz, CDCl3) δH 8.06 (1H, s, py–H3), 7.62 (1H, s, py–H5), 6.58 (2H, s, Ar–H), 5.37 (2H, s, py–C
![[H with combining low line]](https://www.rsc.org/images/entities/char_0048_0332.gif) 2OSO2), 3.97 (3H, s, CO2C
2OSO2), 3.97 (3H, s, CO2C![[H with combining low line]](https://www.rsc.org/images/entities/char_0048_0332.gif) 3), 3.75 (3H, s, OC
3), 3.75 (3H, s, OC![[H with combining low line]](https://www.rsc.org/images/entities/char_0048_0332.gif) 3), 3.14 (3H, s, SO2C
3), 3.14 (3H, s, SO2C![[H with combining low line]](https://www.rsc.org/images/entities/char_0048_0332.gif) 3), 2.44 (6H, s, C
3), 2.44 (6H, s, C![[H with combining low line]](https://www.rsc.org/images/entities/char_0048_0332.gif) 3); m/z (HRMS+) 404.1170 [M + H]+ (C20H22NO6S requires 404.1168).
3); m/z (HRMS+) 404.1170 [M + H]+ (C20H22NO6S requires 404.1168).
Dimethyl ester of L3, 9
1,4,7-Triazacyclononane trihydrochloride (113 mg, 0.474 mmol) and the mesylate, 8, (363 mg, 0.901 mmol) were dissolved in anhydrous CH3CN (30 mL) and K2CO3 (197 mg, 1.42 mmol) was added. The mixture was stirred under argon at 60 °C and monitored by LC-MS. After 1 h the reaction was cooled and filtered to remove excess potassium salts. The solvent was removed under reduced pressure and the crude material purified by column chromatography (silica, gradient elution starting from 100% CH2Cl2 to 10% CH3OH in CH2Cl2 in 1% increments) to give a yellow glassy solid (183 mg, 52%). Rf 0.18 (silica, 10% CH3OH in CH2Cl2); 1H NMR (295 K, 700 MHz, CDCl3) δH 9.48 (1H, br s, ring NH), 7.91 (2H, s, py–H3), 7.43 (2H, s, py–H5), 6.59 (4H, s, Ar–H), 4.03 (6H, s, CO2C
![[H with combining low line]](https://www.rsc.org/images/entities/char_0048_0332.gif) 3), 4.02 (4H, s, py–C
3), 4.02 (4H, s, py–C![[H with combining low line]](https://www.rsc.org/images/entities/char_0048_0332.gif) 2), 3.74 (6H, s, OC
2), 3.74 (6H, s, OC![[H with combining low line]](https://www.rsc.org/images/entities/char_0048_0332.gif) 3), 3.48 (4H, br s, ring Hs), 3.06 (4H, br s, ring Hs), 2.81 (4H, s, ring Hs), 2.42 (12H, s, C
3), 3.48 (4H, br s, ring Hs), 3.06 (4H, br s, ring Hs), 2.81 (4H, s, ring Hs), 2.42 (12H, s, C![[H with combining low line]](https://www.rsc.org/images/entities/char_0048_0332.gif) 3); 13C NMR (295 K, 175 MHz, CDCl3) δC 165.2 (
3); 13C NMR (295 K, 175 MHz, CDCl3) δC 165.2 (![[C with combining low line]](https://www.rsc.org/images/entities/char_0043_0332.gif) O2CH3), 160.2 (Ar–C1), 159.4 (py–C6), 147.6 (Ar–C4), 134.5 (Ar–C3,3′), 126.9 (py–C5), 125.7 (py–C3), 113.8 (py–C4), 112.8 (Ar–C2,2′), 94.2 (alkyne C5), 92.8 (alkyne C6), 60.3 (py–
O2CH3), 160.2 (Ar–C1), 159.4 (py–C6), 147.6 (Ar–C4), 134.5 (Ar–C3,3′), 126.9 (py–C5), 125.7 (py–C3), 113.8 (py–C4), 112.8 (Ar–C2,2′), 94.2 (alkyne C5), 92.8 (alkyne C6), 60.3 (py–![[C with combining low line]](https://www.rsc.org/images/entities/char_0043_0332.gif) H2), 55.3 (O
H2), 55.3 (O![[C with combining low line]](https://www.rsc.org/images/entities/char_0043_0332.gif) H3), 53.9 (ring Cs), 53.6 (CO2
H3), 53.9 (ring Cs), 53.6 (CO2![[C with combining low line]](https://www.rsc.org/images/entities/char_0043_0332.gif) H3), 50.5 (ring Cs), 46.2 (ring Cs), 21.4 (
H3), 50.5 (ring Cs), 46.2 (ring Cs), 21.4 (![[C with combining low line]](https://www.rsc.org/images/entities/char_0043_0332.gif) H3); m/z (HRMS+) 744.3765 [M + H]+ (C44H50N5O6 requires 744.3761).
H3); m/z (HRMS+) 744.3765 [M + H]+ (C44H50N5O6 requires 744.3761).
[EuL3]Cl
An aqueous solution of sodium hydroxide 0.1 M (0.5 mL) was added to a solution of the ester 9, (10 mg, 13.4 μmol) in aqueous methanol (1![[thin space (1/6-em)]](https://www.rsc.org/images/entities/char_2009.gif) :
:![[thin space (1/6-em)]](https://www.rsc.org/images/entities/char_2009.gif) 1, 1 mL). The mixture was stirred at 65 °C for 4 h. The reaction was monitored by LCMS. Upon completion, aqueous hydrochloric acid (0.1 M) was added until pH 6.5 was achieved. Europium chloride hexahydrate (5.4 mg, 14.7 μmol) was added and the pH was readjusted to 6.5 by addition of aqueous sodium hydroxide (0.1 M). The reaction was stirred at 65 °C for 24 h. The solvent was removed under reduced pressure to give a white solid (5 mg, 43%); m/z (HRMS+) 864.2371 M+ (C42H43N5O6151Eu requires 864.2412); λexc (MeOH) = 352 nm; ϕ (MeOH) 0.2, ε (MeOH) 35
1, 1 mL). The mixture was stirred at 65 °C for 4 h. The reaction was monitored by LCMS. Upon completion, aqueous hydrochloric acid (0.1 M) was added until pH 6.5 was achieved. Europium chloride hexahydrate (5.4 mg, 14.7 μmol) was added and the pH was readjusted to 6.5 by addition of aqueous sodium hydroxide (0.1 M). The reaction was stirred at 65 °C for 24 h. The solvent was removed under reduced pressure to give a white solid (5 mg, 43%); m/z (HRMS+) 864.2371 M+ (C42H43N5O6151Eu requires 864.2412); λexc (MeOH) = 352 nm; ϕ (MeOH) 0.2, ε (MeOH) 35![[thin space (1/6-em)]](https://www.rsc.org/images/entities/char_2009.gif) 000 M−1 cm−1; τ (H2O) = 0.27 ms, τ (D2O) = 0.38 ms, q = 0.9.
000 M−1 cm−1; τ (H2O) = 0.27 ms, τ (D2O) = 0.38 ms, q = 0.9.
Dimethyl ester of L4, 10
The bis-alkylated ligand, 9, (25 mg, 0.034 mmol) and K2CO3 (4 mg, 0.034 mmol) were dissolved in anhydrous CH3CN (2 mL). Benzyl bromide (6 mg, 0.034 mmol) was added dropwise at room temperature over 15 minutes. The mixture was stirred under argon at 40 °C and monitored by LC-MS. After 3 h the reaction was cooled and filtered to remove excess potassium salts. The solvent was removed under reduced pressure and the crude material purified by column chromatography (alumina, 100% CH2Cl2) to give a yellow glassy solid (17 mg, 60%). TLC analysis Rf 0.52 (alumina, 2% CH3OH in CH2Cl2); 1H NMR (295 K, 700 MHz, MeOD) δH 7.95 (2H, s, py–H3), 7.58–7.43 (7H, m, Ph–H, py–H5),6.64 (4H, s, Ar–H), 3.99 (4H, s, py–C
![[H with combining low line]](https://www.rsc.org/images/entities/char_0048_0332.gif) 2), 3.92 (6H, s, CO2C
2), 3.92 (6H, s, CO2C![[H with combining low line]](https://www.rsc.org/images/entities/char_0048_0332.gif) 3), 3.78 (6H, s, OC
3), 3.78 (6H, s, OC![[H with combining low line]](https://www.rsc.org/images/entities/char_0048_0332.gif) 3), 3.66 (4H, br s, ring Hs), 3.05 (8H, br s, ring Hs), 2.91 (2H, s, C
3), 3.66 (4H, br s, ring Hs), 3.05 (8H, br s, ring Hs), 2.91 (2H, s, C![[H with combining low line]](https://www.rsc.org/images/entities/char_0048_0332.gif) 2Ph), 2.42 (12H, s, C
2Ph), 2.42 (12H, s, C![[H with combining low line]](https://www.rsc.org/images/entities/char_0048_0332.gif) 3); 13C NMR (295 K, 175 MHz, CDCl3) δC 165.7 (
3); 13C NMR (295 K, 175 MHz, CDCl3) δC 165.7 (![[C with combining low line]](https://www.rsc.org/images/entities/char_0043_0332.gif) O2CH3), 160.2 (Ar–C1), 147.6 (py–C6), 143.0 (Ar–C4), 133.9 (Ar–C3/3′), 129.1 (Ph–C), 128.4 (Ph–C), 127.8 (Ph–C), 126.9 (py–C5), 125.1 (py–C3), 114.1 (py–C4), 112.8 (Ar–C2/2′), 93.6 (alkyne C), 64.7 (py–
O2CH3), 160.2 (Ar–C1), 147.6 (py–C6), 143.0 (Ar–C4), 133.9 (Ar–C3/3′), 129.1 (Ph–C), 128.4 (Ph–C), 127.8 (Ph–C), 126.9 (py–C5), 125.1 (py–C3), 114.1 (py–C4), 112.8 (Ar–C2/2′), 93.6 (alkyne C), 64.7 (py–![[C with combining low line]](https://www.rsc.org/images/entities/char_0043_0332.gif) H2), 56.3 (Ph–
H2), 56.3 (Ph–![[C with combining low line]](https://www.rsc.org/images/entities/char_0043_0332.gif) H2), 55.4 (O
H2), 55.4 (O![[C with combining low line]](https://www.rsc.org/images/entities/char_0043_0332.gif) H3), 53.1 (CO2
H3), 53.1 (CO2![[C with combining low line]](https://www.rsc.org/images/entities/char_0043_0332.gif) H3), 51.8 (ring Cs), 29.8 (ring Cs), 21.5 (
H3), 51.8 (ring Cs), 29.8 (ring Cs), 21.5 (![[C with combining low line]](https://www.rsc.org/images/entities/char_0043_0332.gif) H3); m/z (HRMS+) 834.4246 [M + H]+ (C51H56N5O6 requires 834.4231).
H3); m/z (HRMS+) 834.4246 [M + H]+ (C51H56N5O6 requires 834.4231).
[EuL4]Cl
An aqueous solution of sodium hydroxide 0.1 M (0.5 mL) was added to a solution of 10 (11 mg, 13.2 μmol) in methanol (1![[thin space (1/6-em)]](https://www.rsc.org/images/entities/char_2009.gif) :
:![[thin space (1/6-em)]](https://www.rsc.org/images/entities/char_2009.gif) 1, 1 mL). The mixture was stirred at 65 °C for 4 h. The reaction was monitored by LCMS. Upon completion, aqueous hydrochloric acid (0.1 M) was added until pH 6.5 was achieved. Europium chloride hexahydrate (5.3 mg, 14.5 μmol) was added and the pH was readjusted to 6.5 by addition of aqueous sodium hydroxide (0.1 M). The reaction was stirred at 65 °C for 24 h. The solvent was removed under reduced pressure and the solid was purified by flash column chromatography (silica, gradient elution starting from 5% CH3OH to 15% CH3OH in CH2Cl2 in 0.5% increments) to give a white solid (10 mg, 80%). m/z (HRMS+) 954.2896 M+ (C49H49N5O6151Eu requires 954.2881); λexc (MeOH) = 352 nm; ϕ (MeOH) 0.18, ε (MeOH) 36
1, 1 mL). The mixture was stirred at 65 °C for 4 h. The reaction was monitored by LCMS. Upon completion, aqueous hydrochloric acid (0.1 M) was added until pH 6.5 was achieved. Europium chloride hexahydrate (5.3 mg, 14.5 μmol) was added and the pH was readjusted to 6.5 by addition of aqueous sodium hydroxide (0.1 M). The reaction was stirred at 65 °C for 24 h. The solvent was removed under reduced pressure and the solid was purified by flash column chromatography (silica, gradient elution starting from 5% CH3OH to 15% CH3OH in CH2Cl2 in 0.5% increments) to give a white solid (10 mg, 80%). m/z (HRMS+) 954.2896 M+ (C49H49N5O6151Eu requires 954.2881); λexc (MeOH) = 352 nm; ϕ (MeOH) 0.18, ε (MeOH) 36![[thin space (1/6-em)]](https://www.rsc.org/images/entities/char_2009.gif) 000 M−1 cm−1; τ (MeOH) = 0.83 ms; τ (H2O) = 0.53 ms, τ (D2O) = 0.50 ms, q = 0.
000 M−1 cm−1; τ (MeOH) = 0.83 ms; τ (H2O) = 0.53 ms, τ (D2O) = 0.50 ms, q = 0.
Acknowledgements
We thank EPSRC, the Royal Society (RP) and the ERC (FCC266804) for support.Notes and references
- G. Muller, Dalton Trans., 2009, 9692 RSC.
- (a) Z. Shen, T. Wang, L. Shi, Z. Tang and M. Liu, Chem. Sci., 2015, 6, 4267 RSC; (b) Y. Morisaki, M. Gon, T. Sasamori, N. Tokitoh and Y. Chujo, J. Am. Chem. Soc., 2014, 136, 3250 CrossRef PubMed.
- R. Carr, N. H. Evans and D. Parker, Chem. Soc. Rev., 2012, 41, 7673 RSC.
- F. Zinna and L. Di Bari, Chirality, 2015, 27, 1 CrossRef CAS PubMed.
- J.-C. G. Bunzli and S. V. Eliseeva, Chem. Sci., 2013, 4, 1939 RSC.
- J. M. Zwier, H. Bazin, L. Lamarque and G. Mathis, Inorg. Chem., 2014, 53, 1854 CrossRef CAS PubMed.
- F. Kielar, C. P. Montgomery, E. J. New, D. Parker, R. A. Poole, S. L. Richardson and P. A. Stenson, Org. Biomol. Chem., 2007, 5, 2975 CAS.
- (a) K. Okutani, K. Nozaki and M. Iwamura, Inorg. Chem., 2014, 53, 5527 CrossRef CAS PubMed; (b) M. Iwamura, Y. Kimura, R. Miyamoto and K. Nozaki, Inorg. Chem., 2012, 51, 4094 CrossRef CAS PubMed.
- C. M. G. dos Santos, A. J. Harte and T. Gunnlaugsson, Coord. Chem. Rev., 2008, 252, 2512 CrossRef CAS PubMed.
- (a) S. J. Butler and D. Parker, Chem. Soc. Rev., 2013, 42, 1652 RSC; (b) G.-L. Law, D. Parker, S. L. Richardson and K.-L. Wong, Dalton Trans., 2009, 8481 RSC.
- L. M. P. Lima and R. Tripier, Curr. Methods Inorg. Chem., 2011, 1, 36 CrossRef CAS.
- A. M. Funk, K.-L. N. A. Finney, P. Harvey, A. M. Kenwright, E. R. Neil, N. J. Rogers, P. K. Senanayake and D. Parker, Chem. Sci., 2015, 6, 1655 RSC.
- A. M. Funk, P. Harvey, K.-L. N. A. Finney, M. A. Fox, A. M. Kenwright, N. J. Rogers and D. Parker, Phys. Chem. Chem. Phys., 2015, 17, 16507 RSC.
- S. F. Mason, R. D. Peacock and B. Stewart, Mol. Phys., 1975, 30, 1829 CrossRef CAS PubMed.
- (a) S. F. Mason, Struct. Bonding, 1980, 39, 43 CrossRef CAS; (b) M. F. Reid and F. S. Richardson, Chem. Phys. Lett., 1983, 95, 5012 CrossRef.
- R. S. Dickins, J. I. Bruce, D. Parker and D. J. Tozer, Dalton Trans., 2003, 1264 RSC.
- R. Pal, L. C. Costello and D. Parker, Org. Biomol. Chem., 2009, 7, 1525 CAS.
- D. G. Smith, G.-L. Law, R. Pal, D. Parker and K.-L. Wong, Chem. Commun., 2011, 47, 7347 RSC.
- D. G. Smith, R. Pal and D. Parker, Chem. – Eur. J., 2012, 18, 11604 CrossRef CAS PubMed.
- R. Pal, A. Beeby and D. Parker, J. Pharmaceut. Biomed. Anal., 2011, 56, 352 CrossRef CAS PubMed.
- R. Carr, L. Di Bari, S. Lo Piano, D. Parker, R. D. Peacock and J. M. Sanderson, Dalton Trans., 2012, 41, 13154 RSC.
- R. Carr, R. S. Puckrin, R. Pal, D. Parker, B. K. McMahon and L.-O. Palsson, Methods Appl. Fluoresc., 2014, 2, 024007 CrossRef.
- M. Soulie, F. Latzko, E. Bourrier, V. Placide, S. J. Butler, R. Pal, P. L. Baldeck, B. Le Guennic, C. Andraud, J. M. Zwier, L. Lamarque, D. Parker and O. Maury, Chem. – Eur. J., 2014, 20, 8636–8646 CrossRef CAS PubMed.
- S. J. Butler, L. Lamarque, R. Pal and D. Parker, Chem. Sci., 2014, 5, 1750 RSC.
- J. W. Walton, A. Bourdolle, S. J. Butler, M. Soulie, M. Delbianco, B. K. McMahon, R. Pal, H. Puschmann, J. M. Zwier, L. Lamarque, O. Maury, C. Andraud and D. Parker, Chem. Commun., 2013, 49, 1600 RSC.
- (a) S. J. Butler, M. Delbianco, N. H. Evans, A. T. Frawley, R. Pal, D. Parker, R. S. Puckrin and D. S. Yufit, Dalton Trans., 2014, 43, 5721 RSC; (b) N. H. Evans, R. Carr, M. Delbianco, R. Pal, D. S. Yufit and D. Parker, Dalton Trans., 2013, 42, 15610 RSC.
- (a) M. Delbianco, V. Sadovnikova, E. Bourrier, L. Lamarque, J. M. Zwier and D. Parker, Angew. Chem., Int. Ed., 2014, 53, 10718 CrossRef CAS PubMed; (b) M. Delbianco, L. Lamarque and D. Parker, Org. Biomol. Chem., 2014, 12, 8061 RSC.
- S. J. Butler, R. Pal, B. K. McMahon, D. Parker and J. W. Walton, Chem. – Eur. J., 2013, 19, 9511 CrossRef CAS PubMed.
- R. S. Dickins, S. Aime, A. S. Batsanov, A. Beeby, M. Botta, J. I. Bruce, J. A. K. Howard, C. S. Love, D. Parker, R. D. Peacock and H. Puschmann, J. Am. Chem. Soc., 2002, 124, 12697 CrossRef CAS PubMed.
- R. S. Dickins, A. S. Batsanov, D. Parker, H. Puschmann, S. Salamano and J. A. K. Howard, Dalton Trans., 2004, 70 RSC.
- A. Bourdolle, M. Allali, J.-C. Mulatier, B. Le Guennic, J. M. Zwier, P. L. Baldeck, J.-C. G. Bunzli, C. Andraud, L. Lamarque and O. Maury, Inorg. Chem., 2011, 50, 4987 CrossRef CAS PubMed.
- A. Beeby, I. M. Clarkson, R. S. Dickins, S. Faulkner, D. Parker, L. Royle, A. S. de Sousa, J. A. G. Williams and M. Woods, J. Chem. Soc., Perkin Trans. 2, 1999, 493 RSC.
- P. L. Anelli, V. Balzani, L. Prodi and F. Uggeri, Gazz. Chim. Ital., 1991, 121, 359 CAS.
- E. R. Neil, A. M. Funk, D. S. Yufit and D. Parker, Dalton Trans., 2014, 43, 5490 RSC.
- T. T. da Cunha, J. Jung, M.-E. Boulon, G. Campo, F. Pointillart, C. L. M. Pereira, B. Le Guennic, O. Cador, K. Bernot, F. Pineider, S. Golhen and L. Ouahab, J. Am. Chem. Soc., 2013, 135, 16332 CrossRef CAS PubMed.
- K. Senechal-David, A. Hemeryck, N. Tancrez, L. Toupet, J. A. G. Williams, I. Ledoux, J. Zyss, A. Boucekkine, J.-P. Guegan, H. Le Bozec and O. Maury, J. Am. Chem. Soc., 2006, 128, 12243 CrossRef CAS PubMed.
- F. Pointillart, B. Le Guennic, O. Maury, S. Golhen, O. Cador and L. Ouahab, Inorg. Chem., 2013, 52, 1398 CrossRef CAS PubMed.
Footnote |
| † Electronic supplementary information (ESI) available. See DOI: 10.1039/c5dt02358k |
| This journal is © The Royal Society of Chemistry 2015 |


