 Open Access Article
Creative Commons Attribution 3.0 Unported Licence
Copper(II) complexes of macrocyclic and open-chain pseudopeptidic ligands: synthesis, characterization and interaction with dicarboxylates†
Enrico
Faggi
*a,
Raquel
Gavara
b,
Michael
Bolte
c,
Lluís
Fajarí
a,
Luís
Juliá
a,
Laura
Rodríguez
b and
Ignacio
Alfonso
*a
aDepartamento de Química Biológica y Modelización Molecular, IQAC–CSIC, Jordi Girona, 16-26, E-08034 Barcelona, Spain. E-mail: enrico.faggi@iqac.csic.es; ignacio.alfonso@iqac.csic.es
bDepartament de Química Inorgànica, Universitat de Barcelona, Martí i Franquès 1-11, 08028 Barcelona, Spain
cInstitut für Anorganische Chemie, J.-W.-Goethe-Universität, Max-von-Laue-Str.7, D-60438 Frankfurt/Main, Germany
First published on 29th May 2015
Abstract
Mono- and dinuclear Cu(II) complexes were prepared with pseudopeptidic open chain and macrocyclic ligands, respectively. They were characterized by UV-vis spectroscopy, EPR, HRMS and X-ray diffraction. The Cu(II) cation is coordinated by two amines and two deprotonated amides, in a slightly distorted square planar coordination geometry. The complexes interact with several substituted dicarboxylates, as shown by UV-vis titrations and EPR experiments. The interaction of both mono- and dinuclear complexes with very similar dicarboxylates of biological interest (malate and aspartate) resulted in strikingly different outcomes: in the first case a ternary complex [ligand⋯metal⋯dicarboxylate] was obtained almost quantitatively, while in the latter, the Cu(II) displacement to form Cu(Asp)2 was predominant.
Introduction
The Cu(II) cation plays a key role in bioinorganic chemistry as it is present in many enzymes with a variety of essential functions.1,2 Copper enzymes usually contain metal ions bound to a specific amino acid residue or directly to the amide group – carbonyl or nitrogen – in the peptide backbone, offering different coordination environments.3 For example, naturally-occurring cyclic peptides form mono- and dinuclear Cu(II) complexes, with different coordination geometries.4 The Cu(II) ion also interacts with αsynuclein (αSyn), and fragments of Park9 encoded protein from the Parkinson's disease gene.5 Additionally, Cu(II) ionophores have been studied recently as potential therapeutic agents.6 Thus, an appropriate design of small molecules with suitable structural and functional characteristics could be important for biomimetic and recognition studies. In this regard, the design and synthesis of ligands functionalized to achieve metal complexation through a biomimetic approach is a challenge of current interest. The use of oligopeptides7 and simple ligands that contain amino acid residues8 is a successful strategy to provide the Cu(II) ions with a coordination environment similar to that found in metalloproteins.In this context, (amino amide) compounds9 are promising ligands for several reasons: (i) they contain two kinds of nitrogen atoms, with different coordination capabilities, connected through a chiral backbone; (ii) their properties can be tuned by the variation of the substituents and the spacers and (iii) they can form stable metal complexes with transition metals.10 On the other hand, different bis(amino amides) have been used as building blocks for the construction of macrocyclic or macrobicyclic structures. Some of these systems display interesting features, acting as in vivo fluorescent pH probes,11 or as selective receptors for substrates of biological relevance.12
Recently, the coordination ability of some C2 symmetrical bis(amino amides) derived from valine towards Cu(II) and Zn(II) ions has been reported13 and, for the same family of ligands, the effect of changes in the amino acidic residue towards the coordination of Cu(II) was evaluated.14 Here, we present a study of the Cu(II) binding ability of two open-chain and two macrocyclic (amino amide) ligands derived from phenylalanine. This particular amino acid was selected because some phenylalanine-derived receptors have been shown to be better hosts for cations than those obtained from valine.15 In view of the multiple and important roles played by dicarboxylate anions in living systems,16 we also studied the interaction of the obtained Cu(II) complexes with a series of dicarboxylates with similar structures and of high biological interest, such as malate and aspartate.
Results and discussion
Synthesis and characterization of the ligands
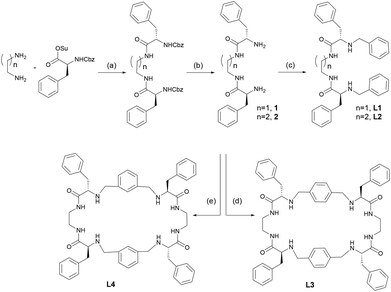
For this study we selected four ligands (L1–L4) with closely related structures. Thus, L1 and L2 are open-chain bis(amino amide) receptors that differ slightly in the length of the aliphatic spacer connecting the amide nitrogens. In principle, they are designed to coordinate Cu(II) forming mononuclear complexes. On the other hand, L3 and L4 are tetra(amino amide) macrocyclic ligands with different geometries of the aromatic spacer that connect the amine nitrogens. They are designed to coordinate Cu(II) forming dinuclear complexes. Overall, the complexes derived from these ligands allowed: (i) comparison of mononuclear and dinuclear Cu(II) complexes, determining which molecular architecture was more efficient in the further coordination of dicarboxylates and (ii) an evaluation of the possible effect of the length of the spacer.The general structure and synthetic pathways of the considered ligands are displayed in Scheme 1. Primary diamines 1 and 2, derived from phenylalanine, are easily prepared starting from the corresponding N-Cbz protected phenylalanine N-hydroxysuccinimidyl ester, coupled with either 1,2-diaminoethane or 1,3-diaminopropane and final N-deprotection following previously reported procedures.17 Diamines 1 and 2 were subjected to a reductive amination process with benzaldehyde in methanol, affording the new ligands L1 and L2 in good yields. On the other hand, macrocyclic ligands L3 and L4 were obtained by reaction of diamine 1 with either terephthaldehyde or isophthaldehyde in the presence of a suitable template agent (tetrabutylammonium terephthalate or isophthalate, respectively), in a macrocyclization reaction that has already been described.18
The new ligands L1 and L2 were characterised using standard techniques (1H-NMR, 13C-NMR, HRMS) and in the case of L1, crystals suitable for single-crystal X-ray diffraction analysis were obtained. A rather concentrated solution of L1 in methanol was left evaporating slowly at room temperature. After four days, colourless elongated crystals of good quality were obtained.
The results of the X-ray diffraction of the crystal structure are shown in Fig. 1 (top) together with the corresponding asymmetric unit (Fig. 1, bottom). The asymmetric unit contains two independent molecules that are linked by two hydrogen bonds. These H-bonds induce a global parallel disposition of the molecules (Fig. S23†). Selected bond distances and angles are summarized in Table S2.† Carbonyl groups from amides are located in the syn position, pointing to the same direction, due to the establishment of hydrogen bonds with neighbouring molecules (Fig. 1 bottom).
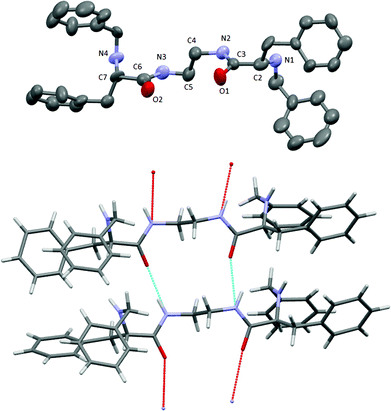 | ||
| Fig. 1 X-ray crystal structure of ligand L1. Hydrogens are omitted for clarity (top). Asymmetric unit of ligand L1 (bottom). Carbon (grey), oxygen (red), nitrogen (blue), hydrogen bond (pale blue). | ||
Synthesis and characterization of the copper(II) complexes
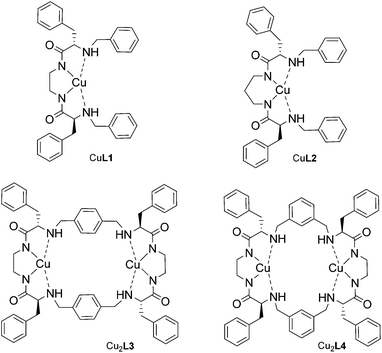
The copper(II) complexes of both open-chain and macrocyclic ligands were prepared by applying slight modifications to a previously reported procedure.14 Bis(amino amide) ligands L1 and L2 were reacted with one equivalent of CuSO4 in methanol, in the presence of two equivalents of NaOH, to ensure the complete deprotonation of the ligand amide groups. Bright purple solutions were obtained, while a white solid was discarded. Solutions were concentrated to afford the mononuclear complexes CuL1 and CuL2 as purple solids. Similarly, tetra(amino amide) ligands L3 and L4 were reacted with two equivalents of CuSO4 and four equivalents of NaOH, affording dinuclear complexes Cu2L3 and Cu2L4. The structures of the four complexes are displayed in Scheme 2.All complexes were characterized by means of high resolution mass spectrometry, affording in all cases the expected molecular peaks with the correct isotopic patterns (Fig. S9–S12†).
In the UV-vis spectra, all complexes exhibit intense ligand to metal charge transfer transitions (LMCT) in the range of 200–315 nm (Fig. S13†). A less intense absorption band, responsible for the purple-violet colour and due to d–d transitions, is present in the range 498–526 nm, suggesting Cu(II) coordination geometries ranging from square-planar to square-pyramidal.13Table 1 collects the wavelength of maximum absorbance for the d–d transitions (λmax) of all complexes together with the corresponding molar absorptivity (ε). The ε value of CuL2 is concentration-dependent, as further confirmed by a dilution study (Fig. S70†), indicating that this complex undergoes self-aggregation in methanol. This unique feature of CuL2 complicated the study of its binding properties by UV-vis spectroscopy.
Besides, upon the Cu(II) complex formation, the IR band corresponding to the stretching of the carbonyl amide of the ligands suffers a shift (54–63 cm−1) to lower wavenumbers (Fig. S18–S21†). This indicates the participation of the deprotonated amide groups in the coordination to Cu(II), in agreement with the data obtained by EPR and the X-ray diffraction of the crystal structure of CuL2 (see below).
The X-band EPR spectrum of a frozen methanol solution at 103 K of Cu(II) complexes is shown in Fig. 2. The Hamiltonian parameters obtained from the simulated spectra of these compounds are summarized in Table 2 (entries 1–4).
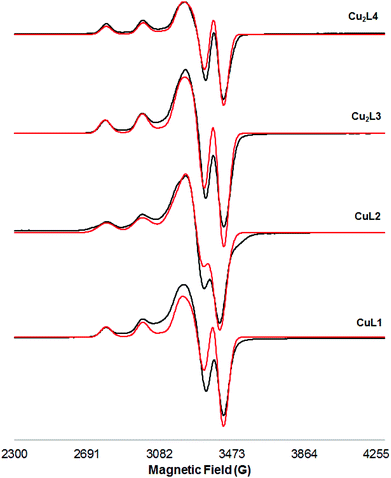 | ||
| Fig. 2 X-band EPR spectra of a frozen methanol solution (103 K) of Cu(II) complexes (black: experimental; red: simulated). | ||
| Entry | Complex | A ∥ | A ⊥ | A N | g ∥ | g ⊥ | g ∥/A∥b | Type |
|---|---|---|---|---|---|---|---|---|
| a Values of coupling constants in gauss. b Value of A∥ in cm−1. A [cm−1] = 0.46686 × 10⁻⁴ g A[G]. c A minor component is also detected (see Table S3). | ||||||||
| 1 | CuL1 | 199.5 | 23.6 | 14.7 | 2.1822 | 2.0413 | 107.4 | CuN4 |
| 2 | CuL2 | 200.8 | 21.0 | 15.7 | 2.1852 | 2.0414 | 108.8 | CuN4 |
| 3 | Cu2L3 | 190.4 | 23.2 | 14.8 | 2.1884 | 2.0436 | 112.5 | CuN4 |
| 4 | Cu2L4 | 197.5 | 24.8 | 14.7 | 2.1846 | 2.0405 | 108.5 | CuN4 |
| 5 | Cu2L3 + Suc | 191.4 | 23.2 | 14.8 | 2.1862 | 2.0486 | 111.9 | CuN4 |
| 6 | Cu2L3 + Mal | 162.8 | 25.6 | 12.8 | 2.2422 | 2.0487 | 131.6 | CuN2O2 |
| 7 | Cu2L3 + Asp | 168.2 | 17.6 | 12.3 | 2.2609 | 2.0492 | 127.4 | CuN2O2 |
| 8 | CuL1 + Asp | 167.6 | 18.9 | 12.4 | 2.2626 | 2.0475 | 127.8 | CuN2O2 |
| 9 | CuL1 + Malc | 168.6 | 24.8 | 12.8 | 2.2377 | 2.0477 | 127.0 | CuN2O2 |
| 10 | Cu(Asp)2 | 167.5 | 17.6 | 11.3 | 2.2611 | 2.0463 | 127.9 | CuN2O2 |
The simulated parameters show excellent agreement with the experimental spectra. All the spectra show a characteristic axial symmetry (g∥ > g⊥ > ge = 2.0023), and indicate that the copper ions have a square planar coordination. In all cases g∥ and A∥ parameters are typical of neutral CuN4 units according to the Peisach and Blumberg plot19 (Fig. S32†), pointing out that the metal centres are equatorially coordinated by four nitrogen atoms (two amines and two deprotonated amides). The values of the g∥/A∥ ratio can be used as a convenient empirical index of tetrahedral distortion in Cu(II) complexes;20 in the studied cases, values of g∥/A∥ fall within the 105–135 cm range, typical of Cu(II) complexes possessing a non-distorted square-planar structure with a dx2−y2 ground state. Finally, the large similarity between EPR spectra of mononuclear and dinuclear complexes, and the absence of a half-field signal at around 1600 G due to the Δms = ±2 transition in both frozen methanol (107 K) and DMF (103 K) solutions (Fig. S27 and S28†) rule out any Cu–Cu dipolar interaction; i.e., dinuclear Cu(II) complexes Cu2L3 and Cu2L4 behave as mononuclear complexes. This is also confirmed by the absence of the specific bands of the triplet state in the spectrum of the Cu2L3 complex in the solid state (103 K, field scan range: 0 to 7000 G, Fig. S29†).
Crystals suitable for single-crystal X-ray diffraction analysis were obtained in the case of CuL2. A solution of CuL2 in methanol was left evaporating slowly at room temperature; after two days, square purple crystals of good quality were obtained.
The X-ray crystal structure is presented in Fig. 3 and selected bond distances and angles are presented in Table S2.†
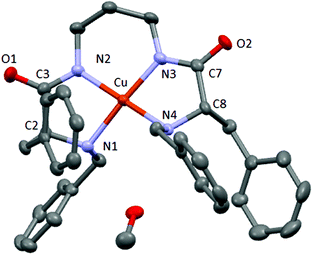 | ||
| Fig. 3 X-ray crystal structure of CuL2. Carbon (grey), oxygen (red), nitrogen (blue) and copper (orange). | ||
X-ray diffraction data confirm the formation of the copper complex with a 1![[thin space (1/6-em)]](https://www.rsc.org/images/entities/char_2009.gif) :
:![[thin space (1/6-em)]](https://www.rsc.org/images/entities/char_2009.gif) 1 stoichiometry. The complex crystallizes with one molecule of methanol that establishes hydrogen bonds with one amine group of the same molecule and with the amide carbonyl group of another molecule (Fig. S24†). The copper(II) cation is coordinated by two amine groups and two deprotonated amide groups, in a slightly distorted square planar geometry, and displays a torsion angle of 11.84° (between the plane containing N4–Cu–N3 and that containing N3–Cu–N2, see Fig. S25†).
1 stoichiometry. The complex crystallizes with one molecule of methanol that establishes hydrogen bonds with one amine group of the same molecule and with the amide carbonyl group of another molecule (Fig. S24†). The copper(II) cation is coordinated by two amine groups and two deprotonated amide groups, in a slightly distorted square planar geometry, and displays a torsion angle of 11.84° (between the plane containing N4–Cu–N3 and that containing N3–Cu–N2, see Fig. S25†).
The Cu–Namide distances are slightly shorter than the corresponding Cu–Namine being 1.919 and 2.043 Å on average, respectively. This fact was previously observed for analogous Cu–pseudopeptidic complexes and was attributed to the anionic coordination from the deprotonated Namide donors instead of the neutral donation from the Namine groups.14 The N–Cu–N angles contained in the five membered rings (N1–Cu–N2 and N3–Cu–N4) are ca. 10° smaller than the others (N2–Cu–N3 and N1–Cu–N4), as expected for a smaller ring size with a tighter environment. These values are slightly shorter than those obtained for an analogous copper complex with a three methylene chain spacer between the amide groups. The corresponding N1–Cu–N3 and N2–Cu–N4 distances are shorter than linear symmetry and also slightly shorter than in a previous analogous copper complex.14
Unfortunately, we were not able to obtain suitable crystals for X-ray diffraction with the Cu(II) complexes of the other ligands. However, the very similar UV-vis and EPR spectroscopic data support that the coordination environment of the copper ion is virtually identical for all the complexes.
Interaction of the copper complexes with dicarboxylates
Many short-chain dicarboxylates play a role in biotransformations. For example, succinate (Suc) acts as an electron donor in the citric acid cycle and plays a crucial role in adenosine triphosphate (ATP) generation in mitochondria.21 Malate (Mal) also takes part in the citric acid cycle and is a source of CO2 in the Calvin cycle.22 Aspartate (Asp) is the precursor to several amino acids, including four that are essential for humans: methionine, threonine, isoleucine, and lysine;23 it is also an important neurotransmitter.24Among others,25 a variety of receptors and sensors for dicarboxylates containing two Cu(II) centres have been reported due to the bidentate nature of these anions and the good affinity of the carboxylate group for the Cu(II) ion.26 Most of the reported systems are dicopper complexes of polyamine macrocycles27 and cryptands.28 In this study we investigate the coordination properties of Cu(II) complexes coordinated by both amine and amide nitrogens present in pseudopeptidic ligands, in an environment that resembles more closely a metalloprotein.
We started our study with Cu2L3, as we reasoned that the presence of two Cu(II) ions at a close distance in its structure would make this complex a good receptor for short-chain dicarboxylate anions. We carried out an initial screening of various dicarboxylates (aliphatic dicarboxylic acids, amino acids and hydroxy acids) as potential guests for the complex by comparing the absorbance of the CuL3 complex alone and in the presence of 2 equivalents of dicarboxylate. Interestingly, in most cases the absorption spectrum was not affected by the addition of the dicarboxylate, while in a few cases the initial purple solution turned light blue or light green. We then focused on some particular cases and studied them in depth, by accurate UV-vis titration experiments in methanol. Unfortunately, solubility issues of the metal complexes prevented us from performing this study in water. Also, all the dicarboxylate substrates were used as the corresponding bis(tetrabutylammonium) (TBA) salts for a better solubility in methanol.
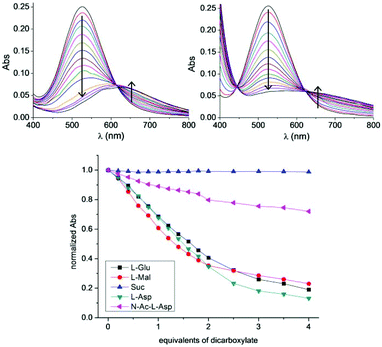
The most striking cases were those of Mal, Asp and Glu (throughout the study, the naturally occurring L isomers were always used). Titration of Cu2L3 with Mal showed a bathochromic shift in λmax from 526 to 575 nm (Fig. 4, top right) resulting in a change in colour from intense purple to light green. A similar trend from purple to pale blue was observed in the case of the of the corresponding TBA salts of Asp and Glu: the λmax shifted to 628 nm (Fig. 4, top left) and 604 nm, respectively. In contrast, addition of succinate had no effect on the absorption spectrum of the system (Fig. S34†). The case of N-acetyl-L-aspartate (N-Ac-Asp) was intermediate: the intensity of the absorption band at 526 nm decreased, but only to a low extent (≈20% of the initial value). A general trend clearly emerged from these titrations: complex Cu2L3 was able to coordinate dicarboxylates with a heteroatom in the α position to one COO− group. However, the dicarboxylates having the protected heteroatom were weakly coordinated and those lacking the heteroatom were not coordinated at all.
Following this, the titration curves of malate and aspartate were analysed more in-depth. Job plots were built by reporting ΔAbs/χanion as a function of χanion (calculated with respect to Cu). In the case of malate, the plot shows a maximum for χanion = 0.50 (Fig. S38†) thus indicating that the Cu![[thin space (1/6-em)]](https://www.rsc.org/images/entities/char_2009.gif) :
:![[thin space (1/6-em)]](https://www.rsc.org/images/entities/char_2009.gif) Mal ratio in the formed species is 1
Mal ratio in the formed species is 1![[thin space (1/6-em)]](https://www.rsc.org/images/entities/char_2009.gif) :
:![[thin space (1/6-em)]](https://www.rsc.org/images/entities/char_2009.gif) 1. Accordingly, this result implies the binding of two equivalents of Mal per Cu2L3 complex molecule. Moreover, comparison of the absorption spectrum of Cu(Mal)2 (obtained by addition of 2.0 equivalents of Mal to a solution of CuSO4), with that obtained after the addition of the deprotonated L3 ligand rendered two significantly different spectra. The first has a λmax = 691 nm (ε = 43 M−1 cm−1) while the second has a λmax = 649 nm (ε = 41 M−1 cm−1) (Fig. S39†). These combined data are consistent with the formation of a ternary complex with the formula Cu2L3Mal2.
1. Accordingly, this result implies the binding of two equivalents of Mal per Cu2L3 complex molecule. Moreover, comparison of the absorption spectrum of Cu(Mal)2 (obtained by addition of 2.0 equivalents of Mal to a solution of CuSO4), with that obtained after the addition of the deprotonated L3 ligand rendered two significantly different spectra. The first has a λmax = 691 nm (ε = 43 M−1 cm−1) while the second has a λmax = 649 nm (ε = 41 M−1 cm−1) (Fig. S39†). These combined data are consistent with the formation of a ternary complex with the formula Cu2L3Mal2.
The case of aspartate is different: the Job plot shows a maximum for χanion = 0.56 (Fig. S44†). This value is intermediate between 0.5 and 0.66, suggesting the simultaneous presence of different species, with Cu![[thin space (1/6-em)]](https://www.rsc.org/images/entities/char_2009.gif) :
:![[thin space (1/6-em)]](https://www.rsc.org/images/entities/char_2009.gif) Asp ratios of 1
Asp ratios of 1![[thin space (1/6-em)]](https://www.rsc.org/images/entities/char_2009.gif) :
:![[thin space (1/6-em)]](https://www.rsc.org/images/entities/char_2009.gif) 1 and 1
1 and 1![[thin space (1/6-em)]](https://www.rsc.org/images/entities/char_2009.gif) :
:![[thin space (1/6-em)]](https://www.rsc.org/images/entities/char_2009.gif) 2.‡ The comparison of the absorption spectrum of CuAsp2 (obtained by addition of 2.0 equivalents of Asp to a solution of CuSO4), with that obtained after the addition of the deprotonated L3 ligand returned two almost identical spectra: the first has λmax = 634 nm (ε = 47 M−1 cm−1) while the second has λmax = 635 nm (ε = 49 M−1 cm−1) (Fig. S45†). These combined data suggest the presence of both Cu2L3Asp2 and CuAsp2 species, the latter being predominant. In other words, aspartate is able to displace a high fraction of the Cu(II) ion from the macrocyclic ligand L3.
2.‡ The comparison of the absorption spectrum of CuAsp2 (obtained by addition of 2.0 equivalents of Asp to a solution of CuSO4), with that obtained after the addition of the deprotonated L3 ligand returned two almost identical spectra: the first has λmax = 634 nm (ε = 47 M−1 cm−1) while the second has λmax = 635 nm (ε = 49 M−1 cm−1) (Fig. S45†). These combined data suggest the presence of both Cu2L3Asp2 and CuAsp2 species, the latter being predominant. In other words, aspartate is able to displace a high fraction of the Cu(II) ion from the macrocyclic ligand L3.
These conclusions are supported by the EPR studies. Addition of Suc did not affect the EPR spectrum of the Cu2L3 complex, while addition of a small excess (ca. 3 eq.) of Mal and Asp altered it (Table 2, entries 3, 5–7 and Fig. 5). The value of A∥ decreased from 190.4 G to 162.8 G (Mal) and 168.2 G (Asp) while that of g∥ increased from 2.1884 to 2.2422 (Mal) and 2.2609 (Asp). These changes of the EPR parameters imply a modification of the coordination environment of the metal centre from CuN4 to CuN2O2, maintaining the overall neutral charge (Fig. S33†). Since Mal has no nitrogen atoms in its structure, this result suggests that Mal coordinates to Cu(II) through its alcohol and carboxylate groups, displacing one (amino amide) moiety of L3. On the other hand, the amino acids, Asp and Glu, can coordinate the Cu(II) ion via the carboxylate and the amine groups, thus displacing L3 almost completely.
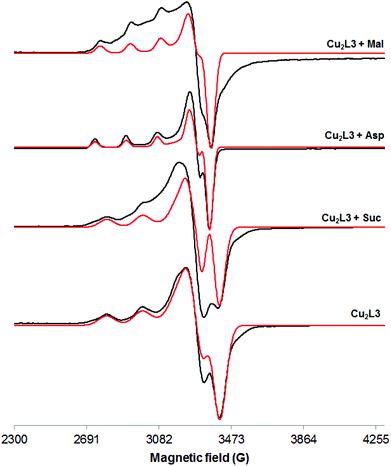 | ||
| Fig. 5 X-band EPR spectra of a frozen methanol solution (103 K) of Cu2L3 alone and in the presence of different dicarboxylate anions (black: experimental; red: simulated). | ||
Due to the paramagnetic nature of the Cu(II) ion, its complexes are usually difficult to study by means of NMR spectroscopy, as their spectra show severe broadening of the signals.29 However, we undertook a 1H-NMR study of Cu2L3 and its Asp and Mal adducts. All the signals in the 1H-NMR spectrum of Cu2L3 (Fig. S71,† bottom) were broad and poorly resolved, suggesting a close connection of the organic ligand with the Cu(II) ion. Upon the addition of 2.0 equivalents of Asp, some very broad signals of L3 sharpened (doublets at 3.60 and 3.30 ppm, doublets of doublets at 2.75 and 2.95 ppm Fig. S71,† top). Addition of 2.0 equivalents of Mal (Fig. S71,† middle) provoked a similar transformation on the signals of L3, but to a lesser extent. This different behaviour supports the observation that Mal has a minor tendency to displace Cu(II) ions from L3, as it mainly forms the ternary species Cu2L3Mal2.
Ligand L4 is a macrocyclic structure that slightly differs from L3, due to the meta instead of the para substitution of the aromatic spacer. In principle, L4 would set the Cu(II) ions at a closer distance. To find out if this small variation had an effect on the interaction with dicarboxylates, we investigated the coordination properties of the Cu2L4 complex. However, both EPR and UV-vis spectra showed no substantial differences.
Although less studied, mononuclear Cu(II) complexes have also been employed in dicarboxylate binding.30 For this reason, and to gain further insight into the binding characteristics of the complexes, the coordination abilities of the open-chain mononuclear analogue of Cu2L3, CuL1, were studied.
According to UV-vis titrations, the coordination properties of CuL1 towards Suc, Mal and Asp are very similar to those of Cu2L3, apart from the differences in the stoichiometry of the binding.
Titration of CuL1 with Mal showed a bathochromic shift in λmax from 508 to 646 nm, resulting in a change in color from intense purple to light green (Fig. S56†). In the case of Asp, it changed to light blue and the λmax shifted to 631 nm (Fig. S61†). In contrast, addition of succinate had no effect on the absorption spectrum of the system (Fig. S54†). However, the titration curves for Mal and Asp (Fig. 6) are different; the first one is much steeper and reaches a plateau for 1.25 equivalents of Mal, while the latter one shows that saturation, if reached, requires a larger number of equivalents. The difference between Mal and Asp titration curves is clearer from the respective Job plots (inset in Fig. 6). Job plots were built by reporting ΔAbs/χanion as a function of χanion. In the case of Mal, the plot shows a maximum for χanion = 0.50 thus indicating that the Cu![[thin space (1/6-em)]](https://www.rsc.org/images/entities/char_2009.gif) :
:![[thin space (1/6-em)]](https://www.rsc.org/images/entities/char_2009.gif) Mal ratio in the formed species is 1
Mal ratio in the formed species is 1![[thin space (1/6-em)]](https://www.rsc.org/images/entities/char_2009.gif) :
:![[thin space (1/6-em)]](https://www.rsc.org/images/entities/char_2009.gif) 1 (Fig. S58†). We also compared the absorption spectrum of CuMal2 obtained by addition of 2.0 equivalents of Mal to a solution of CuSO4 in methanol, with that obtained after the addition of one equivalent of the deprotonated L1 ligand. The two spectra are different: the first has λmax = 697 nm while the second has λmax = 666 nm (Fig. S59†). These combined data suggest the formation of a ternary complex with the formula CuL1Mal as the predominant species.
1 (Fig. S58†). We also compared the absorption spectrum of CuMal2 obtained by addition of 2.0 equivalents of Mal to a solution of CuSO4 in methanol, with that obtained after the addition of one equivalent of the deprotonated L1 ligand. The two spectra are different: the first has λmax = 697 nm while the second has λmax = 666 nm (Fig. S59†). These combined data suggest the formation of a ternary complex with the formula CuL1Mal as the predominant species.
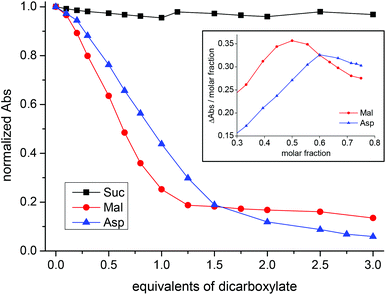 | ||
| Fig. 6 Changes in the normalized absorbance at 508 nm of CuL1 upon addition of dicarboxylates (black: Suc; blue: Asp; red: Mal). Inset: Job plots for CuL1 + Asp (blue) and CuL1 + Mal (red). | ||
The case of Asp is quite different: the Job plot shows a maximum for χanion = 0.60 and the comparison of the absorption spectrum of CuAsp2 with that obtained after the addition of one equivalent of the deprotonated L1 ligand rendered two almost identical spectra (Fig. S63–S64†). Similarly to its macrocyclic analogue, the combined UV-vis data suggest the co-existence of a ternary complex (CuL1Asp) together with the CuAsp2 complex. However, the percentage of CuAsp2 in this case should be higher (the Job plot maximum now is 0.60; for Cu2L3 it was 0.56). Not surprisingly, it would be easier for Asp to displace the Cu(II) ion from the open-chain ligand L1 than from the macrocyclic ligand L3.
The 1H-NMR study of CuL1 and its aspartate and malate adducts rendered similar results to those found for its macrocyclic counterpart Cu2L3 (Fig. S72†). The different aspect of the spectra supports the hypothesis that Mal forms mainly the ternary species CuL1Mal, while Asp has a higher tendency to displace Cu(II) ions from the pseudopeptidic ligand, leading mainly to the formation of the CuAsp2 complex, together with a small amount of CuL1Asp ternary species.
Detailed analysis of the interaction of CuL1 with Asp and Mal
In view of the intricacy of the different equilibria taking place between the studied Cu(II) complexes and dicarboxylate anions, we undertook a detailed and quantitative study of the interaction between the simple mononuclear CuL1 complex and the Asp/Mal pair. First of all, we determined the binding constants and the stoichiometry of binding of Asp and Mal anions to the Cu(II) cation under our experimental conditions. In fact, amino acids and hydroxy acids are known to form stable complexes with Cu(II),31 with a CuL2 general formula. A solution of CuSO4 in methanol was titrated with Asp or Mal. The UV-vis spectral variations regarding the titration with Asp are shown in Fig. S67.† The results are compatible with the formation of two complexes, CuAsp and CuAsp2. The absorption is blue shifted upon complexation giving a maximum around 700 nm for the 1![[thin space (1/6-em)]](https://www.rsc.org/images/entities/char_2009.gif) :
:![[thin space (1/6-em)]](https://www.rsc.org/images/entities/char_2009.gif) 1 complex and 637 nm for the 1
1 complex and 637 nm for the 1![[thin space (1/6-em)]](https://www.rsc.org/images/entities/char_2009.gif) :
:![[thin space (1/6-em)]](https://www.rsc.org/images/entities/char_2009.gif) 2 complex. The stability constants obtained by fitting the data to this equilibrium pattern are reported in Table 3 (entries 1–3).
2 complex. The stability constants obtained by fitting the data to this equilibrium pattern are reported in Table 3 (entries 1–3).
| Entry | Reactiona | Log![[thin space (1/6-em)]](https://www.rsc.org/images/entities/char_2009.gif) β β |
Log![[thin space (1/6-em)]](https://www.rsc.org/images/entities/char_2009.gif) K K |
|---|---|---|---|
| a Charges have been omitted for simplicity. | |||
| 1 | Cu + Asp → CuAsp | 6.08 (3) | |
| 2 | Cu + 2Asp → CuAsp2 | 10.75 (3) | |
| 3 | CuAsp + Asp → CuAsp2 | 4.67 | |
| 4 | Cu + Mal → CuMal | 5.77 (4) | |
| 5 | Cu + 2Mal → CuMal2 | 10.08 (4) | |
| 6 | CuMal + Mal → CuMal2 | 4.31 | |
| 7 | Cu + L1 → CuL1 | 5.40 (4) | |
| 8 | 2Cu + L1 → Cu2L1 | 9.25 (4) | |
| 9 | Cu + CuL1 → Cu2L1 | 3.85 | |
| 10 | Cu + L1 + Asp → CuL1Asp | 9.90 (1) | |
| 11 | CuL1 + Asp → CuL1Asp | 4.50 | |
| 12 | Cu + L1 + Mal → CuL1Mal | 11.01 (3) | |
| 13 | CuL1 + Mal → CuL1Mal | 5.61 | |
Similar results were obtained regarding the Cu(II) complexation with Mal (Fig. S68†). In this case the 1![[thin space (1/6-em)]](https://www.rsc.org/images/entities/char_2009.gif) :
:![[thin space (1/6-em)]](https://www.rsc.org/images/entities/char_2009.gif) 1 complex absorbs mainly in the 700–800 nm region whereas the 1
1 complex absorbs mainly in the 700–800 nm region whereas the 1![[thin space (1/6-em)]](https://www.rsc.org/images/entities/char_2009.gif) :
:![[thin space (1/6-em)]](https://www.rsc.org/images/entities/char_2009.gif) 2 complex has a maximum around 694 nm (Table 3, entries 4–6). In both cases, the stability constants are high enough to allow the formation of the 1
2 complex has a maximum around 694 nm (Table 3, entries 4–6). In both cases, the stability constants are high enough to allow the formation of the 1![[thin space (1/6-em)]](https://www.rsc.org/images/entities/char_2009.gif) :
:![[thin space (1/6-em)]](https://www.rsc.org/images/entities/char_2009.gif) 2 complexes (CuL2) under the conditions used for the UV-vis study ([Cu2+] ≈ 1 × 10⁻³ M; [dicarboxylate] up to 4 × 10⁻³ M). Besides, the stability of the complexes formed by Cu(II) with Asp was seen to be slightly higher than those formed with Mal.
2 complexes (CuL2) under the conditions used for the UV-vis study ([Cu2+] ≈ 1 × 10⁻³ M; [dicarboxylate] up to 4 × 10⁻³ M). Besides, the stability of the complexes formed by Cu(II) with Asp was seen to be slightly higher than those formed with Mal.
Following this, we determined the equilibrium constant for the formation of the CuL1 complex (entries 7–9 in Table 3). The titration revealed the formation of a transient complex with a 2![[thin space (1/6-em)]](https://www.rsc.org/images/entities/char_2009.gif) :
:![[thin space (1/6-em)]](https://www.rsc.org/images/entities/char_2009.gif) 1 stoichiometry, Cu2L1. Finally the titrations of CuL1vs. Mal and Asp were carried out, allowing the determination of the stability constants for the corresponding ternary complexes (entries 10 and 12 in Table 3). Interestingly, the ternary complex with Mal is one order of magnitude more stable than the one with Asp, which is evident when comparing the corresponding stepwise equilibrium constants (entries 11 and 13 in Table 3). Thus, the analysis of the data reported in Table 3 underscores the different behaviour of CuL1 in the presence of Mal and Asp anions. This difference is clearer by plotting the species distribution during the titration of the CuL1 complex with either Mal or Asp dicarboxylates (Fig. 7). In the case of Mal, the addition of one equivalent of dicarboxylate mainly led to the formation of the ternary species (CuL1Mal) while for Asp, a complex mixture was obtained, due to the efficient displacement of the Cu ion from CuL1, produced by the Asp ligand.
1 stoichiometry, Cu2L1. Finally the titrations of CuL1vs. Mal and Asp were carried out, allowing the determination of the stability constants for the corresponding ternary complexes (entries 10 and 12 in Table 3). Interestingly, the ternary complex with Mal is one order of magnitude more stable than the one with Asp, which is evident when comparing the corresponding stepwise equilibrium constants (entries 11 and 13 in Table 3). Thus, the analysis of the data reported in Table 3 underscores the different behaviour of CuL1 in the presence of Mal and Asp anions. This difference is clearer by plotting the species distribution during the titration of the CuL1 complex with either Mal or Asp dicarboxylates (Fig. 7). In the case of Mal, the addition of one equivalent of dicarboxylate mainly led to the formation of the ternary species (CuL1Mal) while for Asp, a complex mixture was obtained, due to the efficient displacement of the Cu ion from CuL1, produced by the Asp ligand.
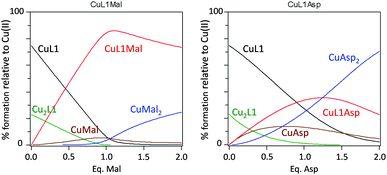 | ||
| Fig. 7 Species distribution for the titration of the CuL1 complex with Mal (left) or Asp (right). The plot was generated using the stability constants reported in Table 3 and [Cu] = [L1] = 1 × 10⁻³ M. | ||
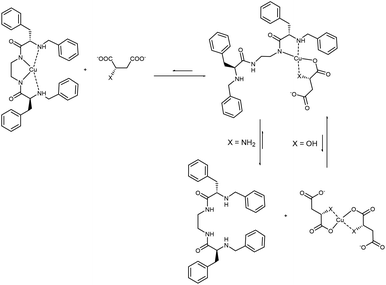
Thus, as described in Fig. 7, CuL1 can form a ternary complex with both Mal and Asp, but while in the first case this complex is relatively stable, in the latter the equilibrium is shifted towards the formation of CuAsp2 and the free L1 ligand (Scheme 3). EPR spectra of CuL1 in the presence of a slight excess (ca. 2 equivalents) of Asp and Mal supported this hypothesis, as they showed the formation, in both cases, of Cu(II) species with CuN2O2 coordination, and overall zero charge (Table 2, entries 1, 8, 9 and Fig. S26†). In particular, the EPR spectrum of the CuL1/Asp system is very similar to that of CuAsp2 (obtained by mixing CuSO4 and Asp in methanol) (Fig. S30†) with close spectral parameters (entry 10, Table 2). In the case of Mal, the EPR spectrum (Fig. S31†) shows two components of different intensities, both assignable to CuN2O2 coordination. This may be due to two different dispositions of the Mal anion in the ternary complex; in fact, the carboxylate ligand can be in a cis or trans position relative to the amino ligand in the Cu complex. The structure proposed for the ternary supramolecular complex CuL1Mal also fits well the ATR-IR spectrum (Fig. S22†), which shows for the ternary complex a broad band with two major components: 1650 and 1593 cm−1, relative to free and metal-coordinated amides, respectively. The complexity of the equilibria prevented us to undertake the same detailed study for the dinuclear Cu2L3 complex. In particular, the stability constant of the macrocyclic Cu2L3 complex was too high to be accurately determined by UV-vis titrations in the required concentration range. However, the main difference between CuL1 and Cu2L3 seems to be the lower tendency of the macrocyclic ligand to transfer the metal to Asp anions, probably due to the higher stability of the Cu2L3 complex due to the macrocyclic effect.
Experimental
Synthesis of the ligands
Primary diamines 1 and 2 were prepared as already described.17L1: To a solution of 1 (360 mg, 1.01 mmol) in methanol (15 ml) was added benzaldehyde (454 μl, 4.46 mmol) and the resulting solution was stirred at room temperature for 6 hours. Sodium borohydride (470 mg, 12.2 mmol) was added in an ice bath and the reaction mixture was stirred at room temperature for16 hours. Aqueous 4 M HCl was added, and a white solid formed. After 1 hour the solvents were evaporated at reduced pressure, affording a solid that was suspended in aqueous 4 M NaOH. The product was extracted twice with DCM and once with AcOEt. Organic layers were combined, dried over MgSO4 and concentrated at reduced pressure. The resulting thick oil was suspended in diethyl ether, triturated, filtered and washed with additional diethyl ether, affording L1 as a white solid (440 mg, 0.82 mmol, 81% yield).
1H-NMR (400 MHz, CDCl3) δ 7.29 (bs, 2H), 7.26–7.15 (m, 12H), 7.12–7.09 (m, 4H), 7.05 (dd, J = 7.5, 1.9 Hz, 4H), 3.66 (d, J = 13.4 Hz, 2H), 3.48 (d, J = 13.4 Hz, 2H), 3.37–3.21 (m, 4H), 3.29 (dd, J = 9.1, 4.8 Hz, 2H), 3.13 (dd, J = 13.8, 4.7 Hz, 2H), 2.71 (dd, J = 13.8, 9.1 Hz, 2H), 1.65 (bs, 2H). 13C-NMR (101 MHz, CDCl3) δ 174.4, 139.2, 137.5, 129.3, 128.8, 128.6, 128.0, 127.3, 127.0, 63.2, 52.7, 39.5, 39.3. HRMS (ESI-TOF) m/z [L1 − H]− Calcd for (C34H37N4O2) 535.3073, found 535.3080. IR (KBr, ν cm−1): 3345, 3282, 1652, 1522, 745, 697.
L2: Obtained following the same procedure described for L1, using 2 (400 mg, 0.82 mmol) as the starting material. L2 was obtained as a waxy solid (240 mg, 0.82 mmol, 44% yield). 1H-NMR (400 MHz, CDCl3) δ 7.52 (t, J = 6.4 Hz, 2H), 7.35–7.18 (m, 12H), 7.14 (d, J = 6.6 Hz, 4H), 7.07 (d, J = 7.4 Hz, 4H), 3.70 (d, J = 13.4 Hz, 2H), 3.53 (d, J = 13.4 Hz, 2H), 3.36 (dd, J = 9.3, 4.4 Hz, 2H), 3.20–3.09 (m, 6H), 2.73 (dd, J = 13.8, 9.3 Hz, 2H), 1.75 (bs, 2H), 1.54 (p, J = 6.4 Hz, 2H). 13C-NMR (101 MHz, CDCl3) δ 174.0, 139.2, 137.4, 129.1, 128.7, 128.5, 128.0, 127.1, 126.8, 63.2, 52.6, 39.4, 35.6, 30.0. HRMS (ESI-TOF) m/z [L2 − H]− Calcd for (C35H39N4O2) 547.3076, found 547.3073. IR (KBr, ν cm−1): 3415, 3229, 1638, 1617, 1398.
L3 and L4 were prepared as already described.18L3: IR (KBr, ν cm−1): 3415, 1653, 1521, 702. L4: IR (KBr, ν cm−1): 3417, 3232, 1643, 1520, 1397, 699.
Synthesis of the Cu(II) complexes
CuL1: To a solution of L1 (105 mg, 0.197 mmol) in MeOH (20 mL) were added CuSO4·5H2O (50 mg, 0.200 mmol) and NaOH (16 mg, 0.40 mmol). A colour change from blue to purple was observed. The reaction mixture was stirred for 30 minutes at room temperature and then centrifuged for 10 minutes. The white solid was discarded while the purple solution was concentrated at reduced pressure. CuL1 was obtained as a purple solid (94 mg, 0.157 mmol, 80% yield). UV-vis (1 × 10⁻³ M, MeOH) λmax = 510 nm; ε = 226 M−1 cm−1. HRMS (ESI-TOF) m/z [CuL1 + Cl]− Calcd for (C34H3635Cl63CuN4O2) 630.1823, found 630.1899; [CuL1 + HCOO]− Calcd for (C35H3763CuN4O4) 640.2111, found 640.2189. IR (KBr, ν cm−1): 3406, 1598, 1454, 751, 700. Elemental analysis: found: C: 64.75%, H: 5.93%; N: 8.75%; calculated for CuL1 + 2H2O; C: 64.59%, H: 6.38%, N: 8.86%.CuL2: Prepared following the same procedure described for CuL1. CuL2 was obtained as a pink solid. 76% yield. UV-vis (2.4 × 10⁻³ M, MeOH) λmax = 498 nm; ε = 94 M−1 cm−1. HRMS (ESI-TOF) m/z [CuL2 + Cl]− Calcd for (C35H3835Cl63CuN4O2) 644.1979, found 644.2072; [CuL2 + HCOO]− Calcd for (C36H3963CuN4O4) 654.2267, found 654.2340. IR (KBr, ν cm−1): 3405, 3229, 1576, 1398. Elemental analysis: found: C: 63.66%, H: 6.35%; N: 8.43%; calculated for CuL2 + 3H2O; C: 63.28%, H: 6.68%, N: 8.43%.
Cu2L3: To a solution of L3 (215 mg, 0.228 mmol) in MeOH (25 mL) were added CuSO4·5H2O (115 mg, 0.46 mmol) and NaOH (37 mg, 0.92 mmol). A colour change from blue to purple was observed. The reaction mixture was stirred for 30 minutes at room temperature and then centrifuged for 10 minutes. The white solid was discarded while the purple solution was concentrated at reduced pressure. Cu2L3 was obtained as a purple solid (175 mg, 0.164 mmol, 72% yield). UV-vis (7 × 10⁻⁴ M, MeOH) λmax = 526 nm; ε = 365 M−1 cm−1. HRMS (ESI-TOF) m/z [Cu2L3 + HCOO]− Calcd for (C57H6163Cu2N8O6) 1081.3304, found 1081.3602. IR (KBr, ν cm−1): 3404, 1599, 702. Elemental analysis: found: C: 64.15%, H: 6.21%; N: 10.43%; calculated for: Cu2L3 + 1H2O; C: 63.80%, H: 5.93%, N: 10.63%.
Cu2L4: Prepared following the same procedure described for Cu2L3. Cu2L4 was obtained as a pink solid. 81% yield. UV-vis (5 × 10⁻⁴ M, MeOH) λmax = 519 nm; ε = 319 M−1 cm−1. HRMS (ESI-TOF) m/z [Cu2L4 + HCOO]− Calcd for (C57H6163Cu2N8O6) 1081.3304, found 1081.3629. IR (KBr, ν cm−1): 3414, 3229, 1614, 1397. Elemental analysis: found: C: 63.75%, H: 5.95%; N: 10.38%; calculated for Cu2L4 + 1H2O; C: 63.80%, H: 5.93%, N: 10.63%.
EPR experiments
EPR spectra of Cu(II) complexes in methanol at 103 K were recorded on a Bruker EMX-Plus 10/12 Bruker BioSpin spectrometer with an X-band microwave bridge EMX Premium X, a 10′′ERO73 magnet and a power supply of 12 kW (ERO83). The temperature was controlled by a Bruker ER 4111 VT temperature control system. Spectrometer parameters for acquiring spectra were: magnetic field, 3300 G with a sweep width of 2000 G. A 15.170 mW microwave power at a frequency of 9.442 GHz was used with a modulation amplitude of 1.60 G and a frequency of 100 kHz. The EPR spectra were simulated with software from Bruker WIN-EPR system (v 2.22 Rev. 12) and WIN-EPR SimFonia (v 1.26 beta).UV-vis titrations
All the titrations were carried out in methanol. UV-vis spectra were recorded on a SpectraMax M5 spectrophotometer. The association constants were calculated using the HypSpec 1.1.33 software for Windows.32 Species distributions of Fig. 7 were made with the HySS software (http://www.hyperquad.co.uk/hyss.htm).Formation of CuAsp2 and CuMal2: a solution of 1.4 × 10⁻³ M CuSO4·5H2O was titrated respectively with 1.4 × 10⁻² M (TBA)2-L-aspartate and 1.4 × 10⁻² M (TBA)2-L-malate (from 0 to 3.0 equivalents). The absorption variations from 500 to 800 nm were fitted to 1![[thin space (1/6-em)]](https://www.rsc.org/images/entities/char_2009.gif) :
:![[thin space (1/6-em)]](https://www.rsc.org/images/entities/char_2009.gif) 1 and 1
1 and 1![[thin space (1/6-em)]](https://www.rsc.org/images/entities/char_2009.gif) :
:![[thin space (1/6-em)]](https://www.rsc.org/images/entities/char_2009.gif) 2 models.
2 models.
Formation of CuL1: a solution of CuSO4 7 × 10⁻⁴ M was titrated in batch with a solution of L1 7.0 × 10⁻³ M containing 2.2 equivalents of TBAOH. The next procedure was followed: several samples containing 1 mL of the Cu(II) solution and increasing amounts of the L1 solution (from 0 to 3.0 equivalents) were prepared and left to equilibrate for 24 hours prior to the measurement in the spectrophotometer.
CuL1vs. dicarboxylates: a solution of 1 × 10⁻³ M CuL1 was titrated with 2.0 × 10⁻² M (TBA)2-dicarboxylate (from 0 to 3.0 equivalents). In the case of malate and aspartate, the association constants were calculated fitting the absorption variations from 450 to 750 nm. For these fittings, the corresponding stability constants for CuL1 and the Cu-dicarboxylate complexes were introduced as constant fixed values.
Cu2L3 and Cu2L4vs. dicarboxylates: a solution of 7 × 10⁻⁴ M Cu2L3 (or Cu2L4) was titrated with 1.4 × 10⁻³ M (TBA)2-dicarboxylate (from 0 to 4.0 equivalents).
Crystal structure determination
Data for all structures were collected on a STOE IPDS II two-circle diffractometer with a Genix Microfocus tube with mirror optics using MoKα radiation (λ = 0.71073 Å) and were scaled using the frame scaling procedure in the X-AREA program system.33The structures were solved by direct methods using the program SHELXS and refined against F2 with full-matrix least-squares techniques using the program SHELXL-97.34
All H atoms in L1 were refined using a riding model. Due to the absence of anomalous scatterers, the absolute configuration could not be determined.
The H atoms bonded to N and O in CuL2 were freely refined. The absolute configuration was determined by refining the Flack-x-parameter, x = −0.025(13) (Table 4).
| Compounds | L1 | CuL2 |
|---|---|---|
| Empirical formula | C34H38N4O2 | C36H42CuN4O3 |
| Form. weight [g cm−3] | 534.68 | 642.27 |
| Crystal system | Triclinic | Orthorhombic |
| Space group | P1 (no. 1) | P212121 (no. 19) |
| a [Å] | 9.631(3) | 10.0943(8) |
| b [Å] | 10.027(3) | 15.9068(10) |
| c [Å] | 15.551(4) | 19.5472(13) |
| α [°] | 86.83(2) | 90 |
| β [°] | 87.67(2) | 90 |
| γ [°] | 78.27(2) | 90 |
| Volume [Å3] | 1467.5(7) | 3138.7(4) |
| Absorption coeff. | 0.076 | 0.739 |
| Reflections collected | 11![[thin space (1/6-em)]](https://www.rsc.org/images/entities/char_2009.gif) 889 889 |
13![[thin space (1/6-em)]](https://www.rsc.org/images/entities/char_2009.gif) 262 262 |
| Unique reflections | 8265 | 5861 |
| R(int) | 0.1832 | 0.0591 |
| Data/restraints/parm. | 8265/3/721 | 5861/0/410 |
| R 1 [I > 2σ(I)] | 0.148 | 0.0365 |
| wR2 [all data] | 0.418 | 0.0821 |
| GooF | 1.064 | 1.002 |
| Diff. peak [e Å−1] | 0.544 | 0.315 |
| Diff. hole [e Å−1] | −0.661 | −0.451 |
CCDC 1059976 (L1) and CCDC 1059975 (CuL2) contain the supplementary crystallographic data for this paper.
Conclusions
The present study reports the synthesis and the characterization of mononuclear Cu(II) complexes with bis(amino amide) ligands (L1 and L2) and dinuclear Cu(II) complexes with tetra(amino amide) ligands (L3 and L4). The metal ion always displays the square planar coordination geometry, being connected to four nitrogen atoms (two amines and two deprotonated amides).The complexes interact with hydroxy- and amino-dicarboxylate substrates, and this event provokes a strong change in the visible absorption spectra. In particular, the interaction with two biologically important dicarboxylates possessing very similar structures (malate and aspartate) has a completely different outcome. In the case of malate, a ternary complex [ligand⋯metal⋯dicarboxylate] is formed almost quantitatively; while in the case of aspartate, the anion is able to displace Cu(II) from the ligand to form, mainly, the Cu(Asp)2 complex. These complexes are model compounds that mimic the ligand exchange observed in natural systems and especially the function of metal ionophores. In fact, ionophores are specific ligands that bind a metal cation, transport it across a cellular membrane, and then release it in response to different stimuli (for example lower pH or presence of competitive ligands).
We are currently exploiting the modularity of the structure of the pseudopeptidic ligands, that allow changes in the spacer, the amino acid residue and the amine substituent, in order to improve the solubility of the Cu(II) complexes in water and tune their stability.
Acknowledgements
This work was supported by the Spanish Ministry of Economy and Competitiveness (MINECO, CTQ2012-38543-C03-03 and CTQ2012-36074) and Generalitat de Catalunya (2014 SGR 231). This research was also supported by a Marie Curie Intra European Fellowship within the 7th European Community Framework Programme (R. G.). E. F. thanks CSIC for the concession of a JAE-Doc grant, a program co-funded by the European Social Fund. We thank Daniel Heras, Mari Carmen Alcalá, Miquel Sintes and Sandra Bassas for performing some experiments.Notes and references
- (a) M. C. Linder, Biochemistry of Copper, Springer, US, 1991 Search PubMed; (b) E. D. Harris, Annu. Rev. Nutr., 2000, 20, 291 CrossRef CAS PubMed; (c) H.-B. Kraatz and N. Metzler-Nolte, Concepts and models in bioinorganic chemistry, Wiley-VCH Weinheim, Germany, 2006 Search PubMed; (d) I. Bertini, Biological inorganic chemistry: structure and reactivity, University Science Books, 2007 Search PubMed.
- (a) A. C. Rosenzweig and T. V. O'Halloran, Curr. Opin. Chem. Biol., 2000, 4, 140 CrossRef CAS PubMed; (b) E. I. Solomon, P. Chen, M. Metz, S.-K. Lee and A. E. Palmer, Angew. Chem., Int. Ed., 2001, 40, 4570 CrossRef CAS; (c) G. Henkel and B. Krebs, Chem. Rev., 2004, 104, 801 CrossRef CAS PubMed; (d) E. I. Solomon, R. K. Szilagyi, S. DeBeer George and L. Basumallick, Chem. Rev., 2004, 104, 419 CrossRef CAS PubMed; (e) P. C. Ford, B. O. Fernandez and M. D. Lim, Chem. Rev., 2005, 105, 2439 CrossRef CAS PubMed; (f) M. L. Zastrow and V. L. Pecoraro, Coord. Chem. Rev., 2013, 257, 2565 CrossRef CAS PubMed.
- (a) R. H. Holm, P. Kennepohl and E. I. Solomon, Chem. Rev., 1996, 96, 2239 CrossRef CAS PubMed; (b) J. T. Rubino and K. J. Franz, J. Inorg. Biochem., 2012, 107, 129 CrossRef CAS PubMed; (c) E. I. Solomon, D. E. Heppner, E. M. Johnston, J. W. Ginsbach, J. Cirera, M. Qayyum, M. T. Kieber-Emmons, C. H. Kjaergaard, R. G. Hadt and L. Tian, Chem. Rev., 2014, 114, 3659 CrossRef CAS PubMed.
- (a) A. L. van den Brenk, D. P. Fairlie, G. R. Hanson, L. R. Gahan, C. J. Hawkins and A. Jones, Inorg. Chem., 1994, 33, 2280 CrossRef CAS; (b) P. V. Bernhardt, P. Comba, D. P. Fairlie, L. R. Gahan, G. R. Hanson and L. Lötzbeyer, Chem. – Eur. J., 2002, 8, 1527 CrossRef CAS PubMed; (c) P. Comba, L. R. Gahan, G. Haberhauer, G. R. Hanson, C. J. Noble, B. Seibold and A. L. van den Brenk, Chem. – Eur. J., 2008, 14, 4393 CrossRef CAS PubMed; (d) P. Comba, N. Dovalil, L. R. Gahan, G. Haberhauer, G. R. Hanson, C. J. Noble, B. Seibold and P. Vadivelu, Chem. – Eur. J., 2012, 18, 2578 CrossRef CAS PubMed; (e) P. Comba, N. Dovalil, L. R. Gahan, G. R. Hanson and M. Westphal, Dalton Trans., 2014, 43, 1935 RSC.
- (a) M. Remelli, M. Peana, S. Medici, L. G. Delogu and M. A. Zoroddu, Dalton Trans., 2013, 42, 5964 RSC; (b) S. C. Drew, Chem. – Eur. J., 2015, 21, 7111 CrossRef CAS PubMed.
- (a) J. L. Hickey, P. J. Crouch, S. Mey, A. Caragounis, J. M. White, A. R. White and P. S. Donnelly, Dalton Trans., 2011, 40, 1338 RSC; (b) S. Tardito, I. Bassanetti, C. Bignardi, L. Elviri, M. Tegoni, C. Mucchino, O. Bussolati, R. Franchi-Gazzola and L. Marchiò, J. Am. Chem. Soc., 2011, 133, 6235 CrossRef CAS PubMed; (c) V. Oliveri, M. Viale, G. Caron, C. Aiello, R. Gangemi and G. Vecchio, Dalton Trans., 2013, 42, 2023 RSC.
- (a) R. Österberg, Coord. Chem. Rev., 1974, 12, 309 CrossRef; (b) V. Lillo and J. R. Galán-Mascarós, Dalton Trans., 2014, 43, 9821 RSC.
- (a) B. Gyurcsik, T. Gajda, L. Nagy and K. Burger, J. Chem. Soc., Dalton Trans., 1992, 2787 RSC; (b) T. Gajda, B. Henry, A. Aubry and J.-J. Delpuech, Inorg. Chem., 1996, 35, 586 CrossRef CAS; (c) H. Kurosaki, R. K. Sharma, S. Aoki, T. Inoue, Y. Okamoto, Y. Sugiura, M. Doi, T. Ishida, M. Otsuka and M. Goto, J. Chem. Soc., Dalton Trans., 2001, 441 RSC; (d) H. B. Albada, F. Soulimani, B. M. Weckhuysen and R. M. J. Liskamp, Chem. Commun., 2007, 4895 RSC; (e) S. Bhattacharyya, A. Sarkar, S. K. Dey, G. P. Jose, A. Mukherjee and T. K. Sengupta, Dalton Trans., 2013, 42, 11709 RSC; (f) A.-S. Felten, N. Pellegrini-Moïse, K. Selmeczi, B. Henry and Y. Chapleur, Eur. J. Org. Chem., 2013, 5645 CrossRef CAS; (g) S. Zhu, Z. Qiu, T. Ni, X. Zhao, S. Yan, F. Xing, Y. Zhao, Y. Bai and M. Li, Dalton Trans., 2013, 42, 10898 RSC.
- S. V. Luis and I. Alfonso, Acc. Chem. Res., 2014, 47, 112 CrossRef CAS PubMed.
- (a) R. Marchelli, A. Dossena, G. Casnati, G. G. Fava and M. F. Belicchi, J. Chem. Soc., Chem. Commun., 1985, 1672 RSC; (b) T. R. Wagler, Y. Fang and C. J. Burrows, J. Org. Chem., 1989, 54, 1584 CrossRef CAS; (c) B. Dangel, M. Clarke, J. Haley, D. Sames and R. Polt, J. Am. Chem. Soc., 1997, 119, 10865 CrossRef CAS; (d) C. L. Weeks, P. Turner, R. R. Fenton and P. A. Lay, J. Chem. Soc., Dalton Trans., 2002, 931 RSC; (e) M. I. Burguete, F. Galindo, S. V. Luis and L. Vigara, Dalton Trans., 2007, 4027 RSC.
- F. Galindo, M. I. Burguete, L. Vigara, S. V. Luis, N. Kabir, J. Gavrilovic and D. A. Russell, Angew. Chem., Int. Ed., 2005, 44, 6504 CrossRef CAS PubMed.
- (a) I. Alfonso, M. Bolte, M. Bru, M. I. Burguete, S. V. Luis and C. Vicent, Org. Biomol. Chem., 2010, 8, 1329 RSC; (b) E. Faggi, A. Moure, M. Bolte, C. Vicent, S. V. Luis and I. Alfonso, J. Org. Chem., 2014, 79, 4590 CrossRef CAS PubMed.
- S. Blasco, M. I. Burguete, M. P. Clares, E. García-España, J. Escorihuela and S. V. Luis, Inorg. Chem., 2010, 49, 7841 CrossRef CAS PubMed.
- I. Marti, A. Ferrer, J. Escorihuela, M. I. Burguete and S. V. Luis, Dalton Trans., 2012, 41, 6764 RSC.
- I. Alfonso, I. Burguete, S. V. Luis, J. F. Miravet, P. Seliger and E. Tomal, Org. Biomol. Chem., 2006, 4, 853 CAS.
- (a) J. Berg, J. Tymoczko and L. Stryer, Biochemistry, Freeman, 5th edn, 2002 Search PubMed; (b) D. L. Nelson, A. L. Lehninger and M. M. Cox, Lehninger principles of biochemistry, Macmillan, 2008 Search PubMed.
- J. Becerril, M. Bolte, M. I. Burguete, F. Galindo, E. García-España, S. V. Luis and J. F. Miravet, J. Am. Chem. Soc., 2003, 125, 6677 CrossRef CAS PubMed.
- I. Alfonso, M. Bolte, M. Bru, M. I. Burguete, S. V. Luis and J. Rubio, J. Am. Chem. Soc., 2008, 130, 6137 CrossRef CAS PubMed.
- J. Peisach and W. E. Blumberg, Arch. Biochem. Biophys., 1974, 165, 691 CrossRef CAS.
- U. Sakaguchi and A. W. Addison, J. Chem. Soc., Dalton Trans., 1979, 600 RSC.
- E. Mills and L. A. O'Neill, Trends Cell Biol., 2014, 24, 313 CrossRef CAS PubMed.
- M. J. West-Eberhard, J. A. C. Smith and K. Winter, Science, 2011, 332, 311 CrossRef CAS PubMed.
- B. J. Miflin and P. J. Lea, Annu. Rev. Plant Physiol., 1977, 28, 299 CrossRef CAS.
- A. Cavallero, A. Marte and E. Fedele, J. Neurochem., 2009, 110, 924 CrossRef CAS PubMed.
- D. Curiel, M. Más-Montoya and G. Sánchez, Coord. Chem. Rev., 2015, 284, 19 CrossRef CAS.
- L. Fabbrizzi and A. Poggi, Chem. Soc. Rev., 2013, 42, 1681 RSC.
- (a) Q. Lu, J. J. Reibenspies, A. E. Martell and R. J. Motekaitis, Inorg. Chem., 1996, 35, 2630 CrossRef CAS PubMed; (b) C. Bazzicalupi, A. Bencini, A. Bianchi, V. Fusi, E. Garcia-España, C. Giorgi, J. M. Llinares, J. A. Ramirez and B. Valtancoli, Inorg. Chem., 1999, 38, 620 CrossRef CAS PubMed; (c) S. Carvalho, C. Cruz, R. Delgado, M. G. B. Drew and V. Felix, Dalton Trans., 2003, 4261 RSC; (d) F. Li, R. Delgado and V. Félix, Eur. J. Inorg. Chem., 2005, 4550 CrossRef CAS; (e) M. Boiocchi, M. Bonizzoni, A. Moletti, D. Pasini and A. Taglietti, New J. Chem., 2007, 31, 352 RSC; (f) S. l. Carvalho, R. Delgado, M. G. B. Drew and V. Félix, Dalton Trans., 2007, 2431 RSC; (g) L. Tang, J. Park, H.-J. Kim, Y. Kim, S. J. Kim, J. Chin and K. M. Kim, J. Am. Chem. Soc., 2008, 130, 12606 CrossRef CAS PubMed; (h) F. Li, S. Carvalho, R. Delgado, M. G. Drew and V. Félix, Dalton Trans., 2010, 39, 9579 RSC; (i) M. Hu and G. Feng, Chem. Commun., 2012, 48, 6951 RSC.
- (a) M. Boiocchi, M. Bonizzoni, L. Fabbrizzi, G. Piovani and A. Taglietti, Angew. Chem., Int. Ed., 2004, 43, 3847 CrossRef CAS PubMed; (b) G. Y. Xie, L. Jiang and T. B. Lu, Dalton Trans., 2013, 42, 14092 RSC; (c) P. Mateus, R. Delgado, V. Andre and M. T. Duarte, Inorg. Chem., 2015, 54, 229 CrossRef CAS PubMed.
- T. Gärtner and R. M. Gschwind, in PATAI'S Chemistry of Functional Groups, John Wiley & Sons, Ltd, 2009 Search PubMed.
- (a) L.-J. Tang and M.-H. Liu, Bull. Korean Chem. Soc., 2010, 31, 3159 CrossRef CAS; (b) P. Mateus, R. Delgado, P. Brandao and V. Felix, Chem. – Eur. J., 2011, 17, 702 Search PubMed.
- (a) K. S. Rajan and A. E. Martell, J. Inorg. Nucl. Chem., 1967, 29, 463 CrossRef CAS; (b) H. Sigel, Metal Ions in Biological Systems: Amino Acids and Derivatives as Ambivalent Ligands, Marcel Dekker, 1979 Search PubMed; (c) A. Manceau and A. Matynia, Geochim. Cosmochim. Acta, 2010, 74, 2556 CrossRef CAS.
- P. Gans, A. Sabatini and A. Vacca, Talanta, 1996, 1739 CrossRef CAS.
- S. Cie, X-AREA., Diffractometer control program system, Stoe & Cie, Darmstadt, Germany, 2002 Search PubMed.
- G. Sheldrick, Acta Crystallogr., Sect. A: Fundam. Crystallogr., 2008, 64, 112 CrossRef CAS PubMed.
Footnotes |
| † Electronic supplementary information (ESI) available: 1H-NMR, 13C-NMR spectra of the new ligands, HRMS spectra of the ligands and the complexes, UV-vis and EPR spectra of the complexes and their adducts with dicarboxylates. CCDC 1059975 and 1059976. For ESI and crystallographic data in CIF or other electronic format see DOI: 10.1039/c5dt01496d |
| ‡ Analysis of the titration data with Glu rendered the same result (Job plot maximum for χanion = 0.60). |
| This journal is © The Royal Society of Chemistry 2015 |

