 Open Access Article
Creative Commons Attribution 3.0 Unported Licence
Crystal structure of A-site deficient La0.2Sr0.7−xCaxTiO3 perovskite at ambient conditions and high temperatures: a neutron powder diffraction study
Ahmed D.
Aljaberi
ab and
John T. S.
Irvine
*b
aMechanical and Materials Engineering Department, Institute Centre for Energy – iEnergy, Masdar Institute of Science and Technology, PO Box 54224, Abu Dhabi, United Arab Emirates
bSchool of Chemistry, Purdie Building, University of St Andrews, St Andrews, Fife KY16 9ST, UK. E-mail: jtsi@st-andrews.ac.uk
First published on 4th March 2015
Abstract
The crystal structures of several members of the solid solution perovskite La0.2Sr0.7−xCaxTiO3 were investigated using the Rietveld analysis of neutron powder diffraction patterns collected in ambient conditions and high temperatures. At room temperature, samples showed a tetragonal I4/mcm symmetry for compositions with 0.1 ≤ x ≤ 0.35 followed by a phase transition to the orthorhombic Pbnm symmetry for compositions with 0.4 ≤ x ≤ 0.7. Samples with the orthorhombic symmetry showed two reversible phase transitions in the temperature range 20 °C–900 °C. The first phase transition was a discontinuous Pbnm–I4/mcm around 300 °C and the second was a continuous I4/mcm–Pm![[3 with combining macron]](https://www.rsc.org/images/entities/char_0033_0304.gif) m transition around 900 °C. The lower symmetries resulted from very small distortions and changes in tilts of the BO6 octahedra of this perovskite material; which was a direct result from the A-site ionic radius mismatch.
m transition around 900 °C. The lower symmetries resulted from very small distortions and changes in tilts of the BO6 octahedra of this perovskite material; which was a direct result from the A-site ionic radius mismatch.
1. Introduction
Solid oxide fuel cells are attracting much attention offering high conversion efficiency of chemical energy to electricity with an attractive possibility of using different types of fuel besides pure hydrogen. For example, methane can be used without reforming given the high operating temperature of SOFCs.1–4 With the drawbacks of the widely used Ni-YSZ cermet anode in SOFCs,2,5 alternative anode materials are actively being studied. These include perovskite-based materials which offer good stability during operation and tolerance to sulphur poisoning and carbon build up.6Previous studies on the perovskite system La0.2Sr0.7−xCaxTiO3 showed an increase in this compound's electrical conductivity with increased calcium substitution at anodic operational conditions; which was consistent with the decrease in the unit cell volume of this perovskite.7 However, this trend was reversed at much higher calcium content; i.e. x > 0.45; which required further structural investigations of this system. Since it is widely understood that electronic conduction involves electrons on the titanium oxygen sublattices, it is anticipated that local distortions of the TiO6 octahedra8–10 can be responsible for the drop in conductivity. Due to the low scattering power of oxygen in XRD, neutron diffraction can give a better picture due to the relatively large scattering length of oxygen ions.11
Therefore, this paper outlines the results obtained using neutron powder diffraction to characterise the crystal structures of different compositions of the perovskite system La0.2Sr0.7−xCaxTiO3 at ambient conditions, as well as, at high temperatures for the two samples discussed in previous work;7 to investigate the origin of the slight drop in electrical conductivity.
2. Experimental
2.1 Sample preparation
Samples of La0.2Sr0.7−xCaxTiO3 with x = 0.1, 0.2, 0.3, 0.35, 0.4, 0.45, 0.5, 0.6 and 0.7 were synthesised using conventional solid state methods. Stoichiometric amount of high purity starting materials; i.e. La2O3 (Sigma-Aldrich 99.99%), SrCO3 (Alfa Aesar 99%), CaCO3 (Alfa Aesar 99.5%) and TiO2 (Alfa Aesar 99.5%) were dried prior to weight and mixed using a mortar and pestle. All mixtures were calcined in air at 1000 °C for a minimum of 15 hours. This was followed by ball milling the powders in a planetary ball mill in acetone for 4 hours to ensure a uniform particle size. These were then dried and pressed into ∼13 mm pellets using a uniaxial press. All pellets were sintered in air at 1500 °C for 15 hours. Pellets were crushed, ball milled for 4 hours and pressed, respectively, before sintering them for a second time at the same conditions. For La0.2Sr0.25Ca0.45TiO3 which showed the highest electrical conductivity of this series,7 a pellet was reduced in a tube furnace at 1050 °C for 72 hours under a constant flow rate of 5% H2–95% Ar gas mixture. All resulting pellets were crushed and ball milled, as above, into fine powders for neutron diffraction studies.2.2 Neutron powder diffraction
Neutron powder diffraction patterns were collected using the D2B powder diffractometer at the Institute Laue-Langevin (ILL) facility in Grenoble, France. Data were collected from powder samples within vanadium containers over an angular range of 0 < 2θ < 160°, using a 0.05° step size, with a neutron radiation of λ ≈ 1.594 Å. Data collection; i.e. counting time; varied between 2 hours for normal resolution and 5 hours for high resolution runs. High temperature runs were collected at various temperatures from room temperature up to 900 °C.All patterns were analysed and refined using the Rietveld method using the software package Fullprof (version 2.05). Diffraction peaks were refined using a pseudo-Voigt function and the background was refined with a 6-parameter polynomial. The initial unit cell parameters were set using the findings obtained from previous XRD studies and the atomic positions for the different sites were set according to the space group symmetry.11 B-site (Ti) atomic coordinates were kept fixed at the origin; while the other sites were allowed to vary. Occupancies were initially allowed to vary through the refinement process yielding insignificant variations from the initial stoichiometries, later these were kept fixed to nominal values to obtain more stable refinements. All models were refined to convergence with the best fits chosen by the agreement factors and stability of the refinement profiles.
3. Results and discussion
3.1 Room temperature studies
All patterns were successfully refined using the Rietveld method resulting in very good fits as shown in Fig. 1.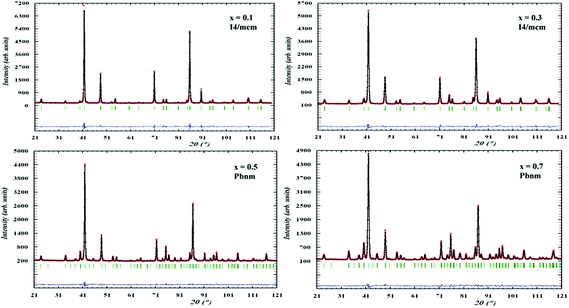 | ||
| Fig. 1 Rietveld refinement patterns for neutron diffraction data of different compositions of La0.2Sr0.7−xCaxTiO3 at ambient conditions fitted to the indicated symmetries. | ||
A significant finding of this work by using neutron diffraction was the point where the transition from the tetragonal I4/mcm to the orthorhombic Pbnm, see Table 1, which was previously reported to be at calcium content of x = 0.45.7 The new transition point now appears to take place at a calcium content of x = 0.4; i.e. La0.2Sr0.3Ca0.4TiO3. Hence, the updated phase map of this system is shown in Fig. 2.
| x in La0.2Sr0.7−xCaxTiO3 | 0.1 | 0.2 | 0.3 | 0.35 | 0.4 | 0.45 | 0.5 | 0.6 | 0.7 | |
|---|---|---|---|---|---|---|---|---|---|---|
| Space group | I4/mcm | I4/mcm | I4/mcm | I4/mcm | Pbnm | Pbnm | Pbnm | Pbnm | Pbnm | |
| a (Å) | 5.4918(1) | 5.4820(1) | 5.4715(1) | 5.4696(2) | 5.4652(1) | 5.4622(1) | 5.4505(2) | 5.4375(1) | 5.4221(2) | |
| b (Å) | 5.4918(1) | 5.4820(1) | 5.4715(1) | 5.4696(2) | 5.4669(1) | 5.4634(1) | 5.4535(2) | 5.4463(2) | 5.4410(1) | |
| c (Å) | 7.7810(2) | 7.7781(2) | 7.7544(2) | 7.7492(3) | 7.7143(1) | 7.7140(1) | 7.7013(2) | 7.6904(4) | 7.6759(3) | |
| V (Å3) | 234.683(7) | 233.75(1) | 232.15(1) | 231.83(1) | 230.49(1) | 230.20(1) | 228.92(1) | 227.75(2) | 226.45(1) | |
| La | x | 0 | 0 | 0 | 0 | −0.01(2) | −0.004(2) | 0.003(2) | 0.005(2) | 0.09(1) |
| Sr | y | 0.5 | 0.5 | 0.5 | 0.5 | 0.49(2) | 0.508(1) | 0.511(1) | 0.515(1) | 0.520(1) |
| Ca | z | 0.25 | 0.25 | 0.25 | 0.25 | 0.25 | 0.25 | 0.25 | 0.25 | 0.25 |
| B iso (Å2) | 0.34(2) | 0.52(3) | 0.42(3) | 0.33(3) | 0.16(3) | 0.46(3) | 0.51(3) | 0.42(3) | 0.49(3) | |
| Ti | x | 0 | 0 | 0 | 0 | 0 | 0 | 0 | 0 | 0 |
| y | 0 | 0 | 0 | 0 | 0 | 0 | 0 | 0 | 0 | |
| z | 0 | 0 | 0 | 0 | 0 | 0 | 0 | 0 | 0 | |
| B iso (Å2) | 1.051(5) | 0.791(5) | 0.445(4) | 0.790(6) | 1.119(5) | 0.625(4) | 0.488(4) | 0.763(5) | 0.266(4) | |
| O1 | x | 0 | 0 | 0 | 0 | −0.052(2) | −0.054(2) | −0.053(2) | −0.057(2) | −0.061(1) |
| y | 0 | 0 | 0 | 0 | 0.001(2) | −0.006(2) | −0.008(2) | −0.008(2) | −0.009(1) | |
| z | 0.25 | 0.25 | 0.25 | 0.25 | 0.25 | 0.25 | 0.25 | 0.25 | 0.25 | |
| B iso (Å2) | 0.49(5) | 0.96(6) | 1.49(5) | 1.37(6) | 1.19(6) | 0.88(5) | 0.88(5) | 0.39(6) | 0.64(8) | |
| O2 | x | 0.2313(1) | 0.2261(2) | 0.2206(2) | 0.2185(1) | 0.2381(1) | 0.2329(8) | 0.2291(7) | 0.2230(5) | 0.2184(4) |
| y | 0.7313(1) | 0.7261(2) | 0.7206(2) | 0.7185(1) | 0.2626(1) | 0.2691(7) | 0.2725(6) | 0.2781(5) | 0.2818(4) | |
| z | 0 | 0 | 0 | 0 | 0.0227(1) | 0.0239(2) | 0.0268(3) | 0.0296(3) | 0.0317(2) | |
| B iso (Å2) | 0.981(3) | 1.056(3) | 1.073(3) | 0.872(4) | 1.070(4) | 1.149(3) | 1.157(4) | 1.246(5) | 0.988(5) | |
| R-Factors | R p | 3.48 | 3.68 | 3.63 | 3.75 | 3.68 | 3.35 | 2.77 | 3.42 | 3.13 |
| R wp | 4.76 | 4.98 | 5.01 | 5.09 | 4.96 | 4.44 | 3.59 | 4.52 | 4.13 | |
| R exp | 1.95 | 1.96 | 2.02 | 1.93 | 1.86 | 1.77 | 2.01 | 1.77 | 1.92 | |
| χ 2 | 5.98 | 6.42 | 6.17 | 6.95 | 7.07 | 6.33 | 3.19 | 6.48 | 4.64 | |
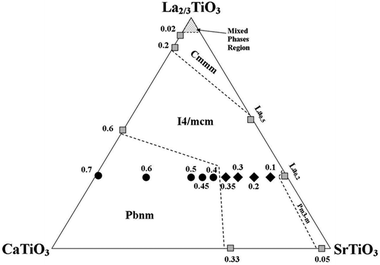 | ||
| Fig. 2 Phase diagram of the ternary system CaTiO3–La2/3TiO3–SrTiO3. All numbers represent calcium content. Solid symbols represent the samples studied in this work and analysed using NPD data; where shaded ones represent compositions obtained from literature.17–21 ◆ refers to the tetragonal samples and ● refers to the orthorhombic samples. | ||
With neutron diffraction, there was not a strong evidence of the existence of other intermediate phases like the ones reported for the system Ca1−xSrxTiO3; e.g. Cmmm or Imma. Since the structure of the perovskite unit cell is highly affected by the A-site ionic radius mismatch, we believe that since our system incorporates a fixed stoichiometry of lanthanum; the variation of Sr/Ca ratio does not induce a severe disruption to the A-site lattice points. Thus, as it was evident from the absence of superlattice reflections in our neutron diffraction patterns that are indicative of the mentioned space groups, the system La0.2Sr0.7−xCaxTiO3 undergoes a single first order phase transition with increasing calcium content; i.e. from I4/mcm to Pbnm symmetries.
Changes in symmetry in perovskites are manifested in changes to the tilt system of the BO6 octahedra, which was apparent in this study. These tilt systems were analysed by having the O2 atomic coordinates as  , hence, the anti-phase tilt angle along the [001] direction in the I4/mcm phase is equal to φ = tan−14u. The out-of-phase tilt angles along the [100] and [010] directions in the Pbnm phase were calculated using the relation
  .11–13 These tilts have the Glazer notation a0a0c− and a−a−c+ in the I4/mcm and Pbnm space groups, respectively.14 The calculated tilt angles from the refined atomic positions for the system studied here are plotted against composition in Fig. 3.
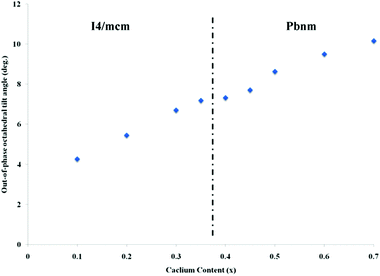 | ||
| Fig. 3 The out-of-phase tilt angle values for the different compositions of La0.2Sr0.7−xCaxTiO3 at room temperature. | ||
This result shows that our system distortions are less severe than the parent perovskite CaTiO3;12 which can be attributed to a lower A-site ionic radius mismatch, due to the fixed stoichiometry of lanthanum throughout the range of the studied compositions. This is more apparent from the almost linear change of the anti-phase tilt angle with calcium content; indicating a more stable system and re-confirms that intermediate phases are non-existing in the compositions studied here.
Calcium introduction into SrCrO3 resulted in a similar behaviour to that of the system La0.2Sr0.7−xCaxTiO3, in terms of structural transitions. With more calcium it was found that transitions occurred from Pm![[3 with combining macron]](https://www.rsc.org/images/entities/char_0033_0304.gif) m to I4/mcm to Pbnm.15
m to I4/mcm to Pbnm.15
3.2 High temperature studies
Two compositions; i.e. La0.2Sr0.25Ca0.45TiO3 and La0.2Sr0.2Ca0.5TiO3; were studied at high temperatures with the results of Rietveld refinement listed in Tables 2 and 3, respectively.| Temperature | 20 °C | 100 °C | 200 °C | 300 °C | 500 °C | 600 °C | 700 °C | 800 °C | 900 °C | |
|---|---|---|---|---|---|---|---|---|---|---|
| Space group | Pbnm | Pbnm | Pbnm | I4/mcm | I4/mcm | I4/mcm | I4/mcm | I4/mcm |
Pm![[3 with combining macron]](https://www.rsc.org/images/entities/char_0033_0304.gif) m m |
|
| a (Å) | 5.4656(1) | 5.4720(4) | 5.4826(2) | 5.4752(1) | 5.4848(1) | 5.4960(1) | 5.5033(2) | 5.5149(8) | 3.90616(4) | |
| b (Å) | 5.4664(1) | 5.4743(4) | 5.4830(2) | 5.4752(1) | 5.4848(1) | 5.4960(1) | 5.5033(2) | 5.5149(8) | 3.90616(4) | |
| c (Å) | 7.7203(3) | 7.7263(3) | 7.7411(5) | 7.7591(4) | 7.7788(4) | 7.7934(3) | 7.8001(4) | 7.8021(2) | 3.90616(4) | |
| V (Å3) | 230.656(1) | 231.444(3) | 232.705(2) | 232.601(2) | 234.007(1) | 235.408(1) | 236.239(2) | 237.293(8) | 59.6007(9) | |
| La | x | −0.007(3) | −0.005(2) | −0.007(2) | 0 | 0 | 0 | 0 | 0 | 0.5 |
| Sr | y | 0.507(1) | 0.506(1) | 0.501(2) | 0.5 | 0.5 | 0.5 | 0.5 | 0.5 | 0.5 |
| Ca | z | 0.25 | 0.25 | 0.25 | 0.25 | 0.25 | 0.25 | 0.25 | 0.25 | 0.5 |
| B iso (Å2) | 0.56(3) | 0.74(3) | 0.92(4) | 0.99(4) | 1.37(4) | 1.61(6) | 1.87(6) | 2.09(7) | 2.25(4) | |
| Ti | x | 0 | 0 | 0 | 0 | 0 | 0 | 0 | 0 | 0 |
| y | 0 | 0 | 0 | 0 | 0 | 0 | 0 | 0 | 0 | |
| z | 0 | 0 | 0 | 0 | 0 | 0 | 0 | 0 | 0 | |
| B iso (Å2) | 0.60(4) | 0.75(5) | 0.68(5) | 1.04(6) | 1.20(6) | 1.40(7) | 1.71(8) | 1.79(9) | 1.48(5) | |
| O1 | x | −0.0523(7) | −0.0547(7) | −0.046(1) | 0 | 0 | 0 | 0 | 0 | 0.5 |
| y | −0.008(1) | −0.011(1) | 0.003(3) | 0 | 0 | 0 | 0 | 0 | 0 | |
| z | 0.25 | 0.25 | 0.25 | 0.25 | 0.25 | 0.25 | 0.25 | 0.25 | 0 | |
| B iso (Å2) | 1.38(8) | 1.43(8) | 1.99(9) | 2.27(7) | 1.97(7) | 1.65(9) | 1.48(9) | 1.45(8) | 3.42(2) | |
| O2 | x | 0.2305(8) | 0.2322(1) | 0.2323(2) | 0.2174(2) | 0.2221(2) | 0.2251(2) | 0.2290(3) | 0.2353(4) | — |
| y | 0.2701(8) | 0.2705(1) | 0.2617(1) | 0.7174(2) | 0.7221(2) | 0.7215(2) | 0.7290(3) | 0.7353(4) | — | |
| z | 0.0259(3) | 0.0238(3) | 0.0237(4) | 0 | 0 | 0 | 0 | 0 | — | |
| B iso (Å2) | 0.95(5) | 1.06(5) | 1.37(6) | 1.74(4) | 2.46 (5) | 2.84(7) | 3.35(8) | 3.88(9) | ||
| R-Factors | R p | 2.90 | 3.68 | 4.16 | 3.91 | 3.85 | 3.68 | 3.44 | 3.93 | 3.37 |
| R wp | 3.70 | 4.67 | 5.38 | 4.97 | 4.97 | 4.71 | 4.39 | 5.05 | 4.65 | |
| R exp | 1.98 | 3.54 | 3.67 | 3.57 | 3.66 | 3.46 | 3.42 | 3.40 | 2.04 | |
| χ 2 | 3.48 | 1.74 | 2.14 | 1.94 | 1.84 | 1.86 | 1.65 | 2.20 | 5.18 | |
| Temperature | 20 °C | 300 °C | 500 °C | 600 °C | 700 °C | 900 °C | |
|---|---|---|---|---|---|---|---|
| Space group | Pbnm | I4/mcm | I4/mcm | I4/mcm | I4/mcm |
Pm![[3 with combining macron]](https://www.rsc.org/images/entities/char_0033_0304.gif) m m |
|
| a (Å) | 5.4505(2) | 5.4674(2) | 5.4793(2) | 5.4874(1) | 5.4942(1) | 3.8975(1) | |
| b (Å) | 5.4535(2) | 5.4674(2) | 5.4793(2) | 5.4874(1) | 5.4942(1) | 3.8975(1) | |
| c (Å) | 7.7013(3) | 7.7447(4) | 7.7675(4) | 7.7771(3) | 7.7835(4) | 3.8975(1) | |
| V (Å3) | 228.918(4) | 231.513(9) | 233.196(8) | 234.182(9) | 234.955(9) | 59.205(1) | |
| La | x | 0.003(2) | 0 | 0 | 0 | 0 | 0.5 |
| Sr | y | 0.5107(7) | 0.5 | 0.5 | 0.5 | 0.5 | 0.5 |
| Ca | z | 0.25 | 0.25 | 0.25 | 0.25 | 0.25 | 0.5 |
| B iso (Å2) | 0.51(3) | 1.29(6) | 1.62(6) | 1.72 (6) | 1.94(6) | 2.27(8) | |
| Ti | x | 0 | 0 | 0 | 0 | 0 | 0 |
| y | 0 | 0 | 0 | 0 | 0 | 0 | |
| z | 0 | 0 | 0 | 0 | 0 | 0 | |
| B iso (Å2) | 0.49(4) | 1.27(8) | 1.48(7) | 1.51(8) | 1.71(8) | 1.70(9) | |
| O1 | x | −0.0528(7) | 0 | 0 | 0 | 0 | 0.5 |
| y | −0.0079(9) | 0 | 0 | 0 | 0 | 0 | |
| z | 0.25 | 0.25 | 0.25 | 0.25 | 0.25 | 0 | |
| B iso (Å2) | 0.88(6) | 2.3(2) | 1.7(1) | 1.6(1) | 1.6(1) | 3.38(5) | |
| O2 | x | 0.2291(7) | 0.2173(2) | 0.2216(2) | 0.2236(2) | 0.2270(3) | — |
| y | 0.2725(6) | 0.7173(2) | 0.7216(2) | 0.7236(2) | 0.7270(3) | — | |
| z | 0.0268(3) | 0 | 0 | 0 | 0 | — | |
| B iso (Å2) | 1.16(4) | 1.63(6) | 2.52(6) | 2.81(7) | 3.24(8) | — | |
| R-Factors | R p | 2.77 | 3.63 | 3.66 | 3.61 | 3.39 | 3.22 |
| R wp | 3.59 | 4.72 | 4.64 | 4.67 | 4.39 | 4.50 | |
| R exp | 2.01 | 3.48 | 3.46 | 3.45 | 3.44 | 1.92 | |
| χ 2 | 3.19 | 1.84 | 1.80 | 1.83 | 1.62 | 5.48 | |
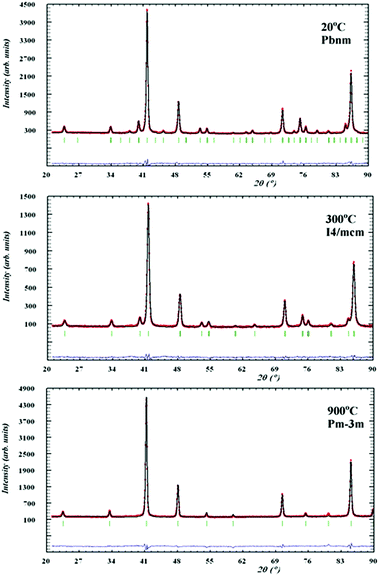
Symmetry changes were evident from the diffraction patterns as shown in Fig. 4, where both compositions showed a similar behaviour as they were orthorhombic Pbnm at room temperature and evolved to the ideal cubic Pm![[3 with combining macron]](https://www.rsc.org/images/entities/char_0033_0304.gif) m symmetry around 900 °C through an intermediate tetragonal I4/mcm phase.
m symmetry around 900 °C through an intermediate tetragonal I4/mcm phase.
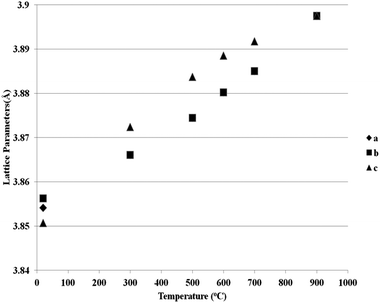
Fig. 5 and 6 show the behaviour of the lattice parameters at high temperatures of La0.2Sr0.25Ca0.45TiO3 and La0.2Sr0.2Ca0.5TiO3, respectively. These lattice parameters can be seen to discontinuously change at the Pbnm–I4/mcm transition point, where at the I4/mcm–Pm![[3 with combining macron]](https://www.rsc.org/images/entities/char_0033_0304.gif) m transition point, the lattice parameters are changing in a continuous fashion as the samples were heated. This suggests that the first transition is a first order one while the latter can be a second order or a higher phase transition. Another aspect which was observed is that this system shows the high symmetry space group Pm
m transition point, the lattice parameters are changing in a continuous fashion as the samples were heated. This suggests that the first transition is a first order one while the latter can be a second order or a higher phase transition. Another aspect which was observed is that this system shows the high symmetry space group Pm![[3 with combining macron]](https://www.rsc.org/images/entities/char_0033_0304.gif) m at a much lower temperature compared to that of the parent compound CaTiO3, which according to Ali and Yashima16 was found at temperatures over 1647 K. This shows that the degree of the distortion existing in La0.2Sr0.7−xCaxTiO3 are much lower than those in CaTiO3; which also explains the less severe distortions compared to Sr1−xCaxTiO3 as was discussed in previous publication,7 where the A-site ionic radius mismatch is greatly affected by increasing calcium content.
m at a much lower temperature compared to that of the parent compound CaTiO3, which according to Ali and Yashima16 was found at temperatures over 1647 K. This shows that the degree of the distortion existing in La0.2Sr0.7−xCaxTiO3 are much lower than those in CaTiO3; which also explains the less severe distortions compared to Sr1−xCaxTiO3 as was discussed in previous publication,7 where the A-site ionic radius mismatch is greatly affected by increasing calcium content.
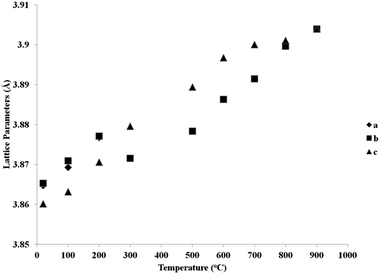 | ||
| Fig. 5 Reduced lattice parameters of a reduced sample of La0.2Sr0.25Ca0.45TiO3 plotted against temperature. | ||
Comparing between the two compositions behaviour at high temperatures, not much differences can be seen structurally. As mentioned earlier, a slight drop in electrical conductivity was seen between the two compositions at 900 °C in reducing conditions. The results here have shown a significant difference in the isotropic atomic displacement parameters between the two samples as shown in Tables 2 and 3. La0.2Sr0.2Ca0.5TiO3 showed slightly higher values at 900 °C compared to that of La0.2Sr0.25Ca0.45TiO3 especially on the titanium site. This indicates that at this temperature, the titanium atoms are less stable; i.e. there is mort short range disorder; on their respective atomic site within the perovskite lattice. This must translates to the extent which the conducting d-orbitals overlap; which lowers the overall electrical conductivity of this oxide. Hence, La0.2Sr0.25Ca0.45TiO3 was chosen as the optimal candidate of this series for a new type of perovskite based anodes. As an anode backbone, this material is showing very encouraging performances upon further improvements.22
4. Conclusions
The perovskite La0.2Sr0.7−xCaxTiO3 showed structural changes with composition and with temperature. Phase pure samples showed a drop in symmetry from the ideal cubic Pm![[3 with combining macron]](https://www.rsc.org/images/entities/char_0033_0304.gif) m of La0.2Sr0.7TiO3 to the tetragonal I4/mcm phase for 0.1 ≤ x ≤ 0.35 and the orthorhombic Pbnm phase for samples with 0.4 ≤ x ≤ 0.7. Orthorhombic samples showed transition to higher symmetries with increasing temperature. These transitions were a discontinuous Orthorhombic Pbnm–Tetragonal I4/mcm transitions and a continuous Tetragonal I4/mcm–Cubic Pm
m of La0.2Sr0.7TiO3 to the tetragonal I4/mcm phase for 0.1 ≤ x ≤ 0.35 and the orthorhombic Pbnm phase for samples with 0.4 ≤ x ≤ 0.7. Orthorhombic samples showed transition to higher symmetries with increasing temperature. These transitions were a discontinuous Orthorhombic Pbnm–Tetragonal I4/mcm transitions and a continuous Tetragonal I4/mcm–Cubic Pm![[3 with combining macron]](https://www.rsc.org/images/entities/char_0033_0304.gif) m phase transition. These studies have helped greatly in understanding some earlier findings regarding the performance of this material as an anode material for SOFCs.
m phase transition. These studies have helped greatly in understanding some earlier findings regarding the performance of this material as an anode material for SOFCs.
Acknowledgements
We first thank the Government of the United Arab Emirates for sponsoring this project, the EPSRC for Platform grant support and the Royal Society for a Wolfson Research Merit Award. We also wish to thank Dr Emmanuelle Suard, ILL for her much appreciated help in collecting the neutron diffraction patterns used in this work.Notes and references
- E. Lay, G. Gauthier, S. Rosini, C. Savaniu and J. T. S. Irvine, Solid State Ionics, 2008, 179, 1562–1566 CrossRef CAS PubMed.
- A. Atkinson, S. Barnett, R. J. Gorte, J. T. S. Irvine, A. J. McEvoy, M. Mogensen, S. C. Singhal and J. Vohs, Nat. Mater., 2004, 3, 17–27 CrossRef CAS PubMed.
- B. C. H. Steele, Nature, 1999, 400, 619–621 CrossRef CAS PubMed.
- A. Ghosh, A. K. Azad and J. T. S. Irvine, ECS Trans., 2011, 35(1), 1337–1343 CAS.
- A. L. Sauvet and J. T. S. Irvine, Solid State Ionics, 2004, 167, 1–8 CrossRef CAS PubMed.
- A. Ovalle, J. C. Ruiz-Morales, J. Canales-Vázquez, D. Marrero-López and J. T. S. Irvvine, Solid State Ionics, 2006, 177, 1997–2003 CrossRef CAS PubMed.
- A. D. Aljaberi and J. T. S. Irvine, J. Mater. Chem. A, 2013, 1, 5868–5874 CAS.
- J. Zhao, N. L. Ross, D. Wang and R. J. Angel, J. Phys.: Condens. Matter, 2011, 23, 455401 CrossRef PubMed.
- M. Avdeev, E. N. Caspi and S. Yakovlev, Acta Crystallogr., Sect. B: Struct. Sci., 2007, 63, 363–372 CrossRef CAS PubMed.
- B. Magyari-Köpe, L. Vitos, B. Johansson and J. Kollár, Comput. Mater. Sci., 2002, 25, 615–621 CrossRef.
- R. Ali and M. Yashima, J. Solid State Chem., 2005, 178, 2867–2872 CrossRef CAS PubMed.
- S. Qin, X. Wu, F. Seifert and A. I. Becerro, J. Chem. Soc., Dalton Trans., 2002, 19, 3751–3755 RSC.
- M. A. Carpenter, C. J. Howard, K. S. Knight and Z. Zhang, J. Phys.: Condens. Matter, 2006, 18, 10725–10749 CrossRef CAS.
- S. K. Mishra, R. Ranjan, D. Pandey and H. T. Stokes, J. Phys.: Condens. Matter, 2006, 18, 1885–1898 CrossRef CAS PubMed.
- E. Castillo-Matinez, A. Duran and M. A. Alario-Franco, J. Solid State Chem., 2008, 181, 895–904 CrossRef PubMed.
- M. Yashima and R. Ali, Solid State Ionics, 2009, 180, 120–126 CrossRef CAS PubMed.
- V. Vashook, L. Vasylechko, N. Trofimenko, M. Kuznecov, P. Otchik, J. Zosel and U. Guth, J. Alloys Compd., 2006, 419, 271–280 CrossRef CAS PubMed.
- Z. Zhang, G. R. Lumpkin, C. J. Howard, K. S. Knight, K. R. Whittle and K. Osaka, J. Solid State Chem., 2007, 180, 1083–1092 CrossRef CAS PubMed.
- S. Qin, X. Wu, F. Seifert and A. I. Becerro, J. Chem. Soc., Dalton Trans., 2002, 3751–3755 RSC.
- C. J. Howard, G. R. Lumpkin, R. I. Smith and Z. Zhang, J. Solid State Chem., 2004, 177, 2726–2732 CrossRef CAS PubMed.
- T. Yamanaka, N. Hirai and Y. Komatsu, Am. Mineral., 2002, 87, 1183–1189 CAS.
- M. C. Verbraeken, B. Iwanschitz, A. Mai and J. T. S. Irvine, J. Electrochem. Soc., 2012, 159, F757–F762 CrossRef CAS PubMed.
| This journal is © The Royal Society of Chemistry 2015 |

