DOI:
10.1039/C4DT03936J
(Paper)
Dalton Trans., 2015,
44, 10738-10745
Effect of local A-site strain on dipole stability in A6GaNb9O30 (A = Ba, Sr, Ca) tetragonal tungsten bronze relaxor dielectrics†
Received
19th December 2014
, Accepted 9th February 2015
First published on 9th February 2015
Abstract
A series of isovalently A-site substituted relaxor dielectric tetragonal tungsten bronzes of general formula Ba6−x−ySrxCayGaNb9O30 were investigated. The long-range (average) crystal structure as determined by conventional diffraction techniques varies monotonically according to Vegard's law. The dielectric properties, however, do not display a similar, simple “average size” dependence and instead show a dependence on the statistical size variance, i.e. size mismatch, of the A-cation. The difficulties in Vogel–Fulcher analysis of relative permittivity and the complementary approach of using dielectric loss data fitted to Jonscher's empirical universal dielectric relaxation model is discussed.
Introduction
The tetragonal tungsten bronze (TTB) structure, general formula A12A24B12B28C4X30, is closely related to perovskite ABX3 in that it consists of a 3-dimensional corner sharing network of BX6 octahedra.1,2 An alternative description is that TTBs consist of “columns” of perovskite (formed by A1B2X3 units) running along the short c-axis and which are interconnected by additional B1X6 octahedra. The result is the formation of an additional, large 15 coordinate A2-site and a smaller 9 coordinate C-site. The TTB aristotype structure (space group P4/mbm, no. 127) is shown in Fig. 1(a). In general, the same elements occupy the A, B and X sites in both perovskite and TTBs, although the A2 site is slightly more limited to larger cations; the C-site is generally only occupied by Li+. TTBs offer a wider compositional flexibility than perovskites not only due to the presence of more crystallographically distinct cation sites, but also due to their ability to have highly variable stoichiometry: so-called “stuffed” TTBs have all 5 cation sites fully occupied; filled TTBs have full occupancy of the A- and B-sites while the C-sites are vacant; unfilled TTBs typically have only 5/6 occupancy of the A-sites, while the B- and C-sites are full and empty, respectively. As a result, TTBs display a wide range of properties, but they have been most widely studied in the context of dielectric and ferroelectric oxides such as Ba2NaNb5O15 (BNN),3,4 (Sr,Ba)Nb2O6 (SBN),5 and the family Ba2RTi2Nb3O15 (RE = La, Nd, Sm, Gd, Dy and Bi).6,7
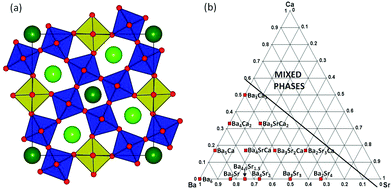 |
| | Fig. 1 (Colour online). (a) Polyhedral representation of the aristotype P4/mbm tetragonal tungsten bronze (TTB) structure viewed down the c-axis (B1 octahedra are shown in light green, B2 octahedra in dark blue, with A1 and A2 cations represented by dark red and light green spheres, respectively); (b) pseudo-ternary phase diagram showing region of single phase TTB compositions in Ba6−x−ySrxCayGaNb9O30. | |
Recently we reported on a family of filled TTBs of general formula Ba6MNb9O30 (M3+ = Fe, Ga, Sc, In and Y)8–10 which display relaxor behaviour in their dielectric response, i.e., a frequency dispersion in both the real and imaginary components of the complex permittivity. We observed that in these materials the dipole stability (characterised by the temperature of the peak in the permittivity) increases as the size of the M3+ cation increases and this results from an increase in the tetragonality (c/a) which allows increased dipolar displacements of the B-cations along the c-axis.9 We also showed that this correlation of dielectric response and tetragonality could be extended to other filled TTBs, and could also be used as a simplified approximation in more complex unfilled TTB compositional series.11 However, specifically for the Ba6MNb9O30 (M3+ = Ga, Sc, In) series we used a combination of temperature dependent, high resolution powder neutron diffraction and in-depth electrical characterisation to show that these materials more closely resemble dipole glass relaxors rather than relaxor ferroelectrics in nature and that the dipolar response predominantly originates from B1 displacements along the c-axis; a simple mechanism whereby the c-axis is extended by inclusion of larger B-cations allowing larger and more stable displacements explains the observed change in dielectric properties – a simple B-cation size effect.9
In this article we describe some aspects of our investigation into the effect of varying A-cation size in this structural family by systematically replacing Ba2+ in Ba6GaNb9O30 by the smaller Sr2+ and Ca2+ cations at the A-site. We show that a simple “average size” effect cannot be extended to this family and that instead local strain variations due to the cation size mismatch (quantified by statistical size variance) is more successful. In this respect, “average” crystal structure data obtained from traditional powder diffraction methods is not sensitive to such local variations and we show how in-depth analysis of dielectric data can be a useful tool, and also highlight some of the pit-falls and problems associated with such analysis.
Experimental
Materials with the general formula Ba6−x−ySrxCayGaNb9O30 were prepared from BaCO3, SrCO3, CaCO3, Ga2O3 and Nb2O5 (all Aldrich, 99+%) using standard solid-state methods as described elsewhere.8 Stoichiometric ratios of the starting materials were ball milled and subjected to the following heating regime; 4 hours at 1000 °C, 10 hours at 1250 °C and 6 hours at 1300 °C. Phase formation was confirmed by powder X-ray diffraction (XRD) collected in transmission mode using a STOE diffractometer equipped with Cu Kα1 radiation (40 kV and 30 mA, λ = 1.54413 Å) over a range of 20 ≤ 2θ ≤ 60. Powder neutron diffraction (PND) measurements were conducted at a constant wavelength (λ = 1.5943201 Å) on the D2b beamline at the Institut Laue-Langevin (ILL). Neutron data were collected at room temperature with the materials loaded into 8 mm cylindrical vanadium cans. Pellets were prepared for electrical characterisation at 1300 °C and all exhibited >90% theoretical density. Pt electrodes were applied using Pt paste (Gwent Electronic Materials Ltd) and cured at 900 °C for approximately 20 minutes. Dielectric measurements were made using a Agilent 4294A impedance analyser over a frequency range of 10 Hz–13 MHz and a temperature range of approximately 20–340 K in a Sumitomo closed-cycle He cryocooler.
Results
Effect of average A-cation size: Ba6−x−ySrxCayGaNb9O30
XRD confirmed a significant phase field for formation of the TTB phase, extending to x = 4.5 in the case of Sr-substitution and y = 3 for Ca and x = 1, y = 2 and x = 3, y = 2 for co-doped compositions, Fig. 1(b). Room temperature lattice parameters were obtained by Rietveld refinement of PND data in the centrosymmetric space group P4/mbm. Full details of the refinements and refinement data are presented in the ESI.† All compounds followed Vegard's law with a systematic decrease in both the ab and c directions, and hence volume, with decreasing average A-cation size, 〈rA〉, Fig. 2 (calculations were based on 12 co-ordinate data obtained from Shannon12: rBa = 1.61 Å, rSr = 1.44 Å and rCa = 1.36 Å).
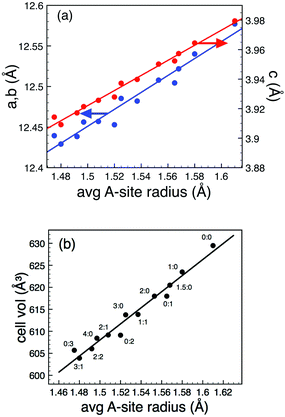 |
| | Fig. 2 (Colour online). Lattice parameters (a) and unit cell volume (b) as a function of average A-cation size. Compositions are denoted as x![[thin space (1/6-em)]](https://www.rsc.org/images/entities/char_2009.gif) :y for Ba6−x−ySrxCayGaNb9O30. Data obtained from Rietveld refinement of PND data (see ESI† for details). Note: error bars are smaller than the symbol size. :y for Ba6−x−ySrxCayGaNb9O30. Data obtained from Rietveld refinement of PND data (see ESI† for details). Note: error bars are smaller than the symbol size. | |
Dielectric data showed that all compositions exhibited relaxor-like behaviour with a similar degree of frequency dispersion in the permittivity-temperature profile. Both Sr-, Ca- and Sr + Ca co-doping resulted in a displacement of the temperature of the peak maximum (Tm) in the permittivity from that observed for the Ba6GaNb9O30 parent compound. The loss peaks were also similarly displaced. However the change in Tm does not correlate systematically with the observed changes in the unit cell parameters, i.e., 〈rA〉, Fig. 3(a), and hence the expected change in tetragonality as observed for the B-site substituted compounds (the isotropic contraction with decreasing average A-cation size means that the tetragonality also decreases monotonically with decreasing 〈rA〉). Instead Tm appears to vary systematically with the statistical A-cation size variance, σ2 where:
where
rA is the ionic radius of the cation at the A-site. Here
σ2 simply describes the relative size distribution of cations occupying the A-site.
13 Whereas diffraction averages out any A-cation size differences giving a time and spatially averaged picture of the unit cell dimensions, the variance gives a quantitative measure of the degree of local disruption to be expected and hence magnitude of the “local strain” experienced by the lattice around the dopant cation point defects. First introduced by Attfield
et al.13 the size variance has been successfully used to explain the temperature dependence of magnetic phase transitions in perovskite manganites and subsequently the unusual change in the ferroelectric Curie temperature in Ca-doped BaTiO
3.
14 It is clear that there is also a correlation with local effects (quantified by
σ2) and dipole stability in these materials,
Fig. 3(b). If the PND data gives the “average change” in crystal structure and
σ2 allows some metric of local change then for the data in
Fig. 3(b), both the “local” (variance) and “average” (unit cell) structure is changing – the key experiment was therefore to decouple the two.
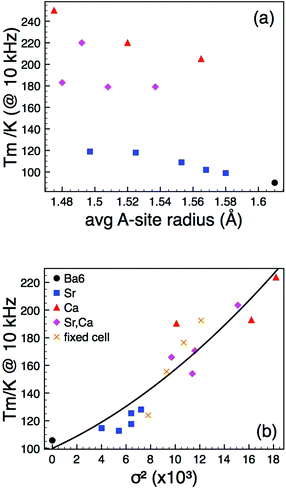 |
| | Fig. 3 (Colour online). Temperature of permittivity maxima, Tm, (measured at 10 kHz) as a function of (a) average A-cation size, and (b) A-cation size variance, σ2. The solid line in (b) is a guide to the eye. | |
Varying “local” vs. constant “average” structure
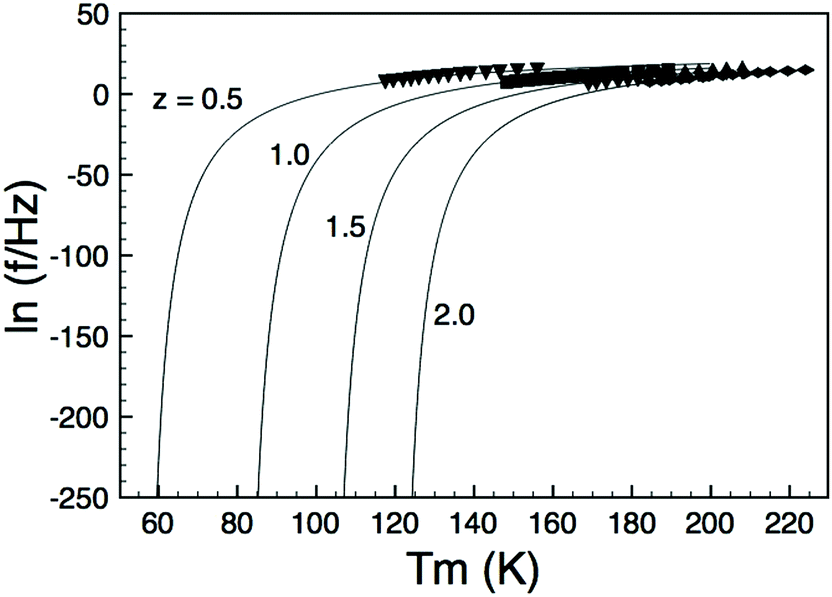
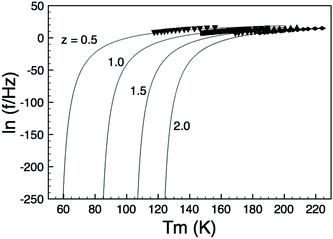
In order to decouple the two effects we adopted the approach used by Sinclair and Attfield:14 starting from the Sr-doped composition Ba4Sr2GaNb9O30 we systematically replaced the Sr with the appropriate ratio of larger Ba2+ and smaller Ca2+ ions such that their average size is equivalent to the Sr being replaced: rSr = 0.37rBa + 0.63rCa = 1.44 Å. This doping mechanism can be described by the general formula Ba4Sr2−z(Ba0.37Ca0.63)zGaNb9O30 and allows a series of compositions to be prepared with a constant overall 〈rA〉 = 1.55 Å, but with varying size variance, σ2. Four TTB compositions with z = 0.5, 1.0, 1.5 and 2.0 were prepared and their XRD patterns are shown in Fig. 4. All adopt the P4/mbm TTB structure and basic Rietveld refinements (including only background, zero point and unit cell) were carried out to obtain lattice parameters. The data showed that, as expected, the long-range, average structure (and tetragonality) is essentially unchanged but the variance varies significantly with z, Table 1. Dielectric data indicated that all compositions exhibit relaxor behaviour, Fig. 5, and the dielectric curves displaced to higher temperature with increasing z (see ESI†). In order to more closely quantify the changes in dielectric response we used the most common approach of fitting the frequency dependence of the temperature of the permittivity maximum, Tm according to the Vogel–Fulcher (VF) expression15:| |  | (2) |
where f is the frequency of applied field, f0 is the fundamental dipole (attempt) frequency for polarisation perturbation, EA is the activation energy associated with dipole realignment and Tf is the dipole freezing temperature. While Tm can arguably be used as a first approximation of dipole stability, and can be used for comparison among materials with similar degrees of frequency dispersion, Tf provides an “intrinsic” frequency independent parameter. Initially data were fitted with all three fitting parameters (f0, EA and Tf) unconstrained and the results presented in Table 2. The goodness-of-fit parameters suggest the VF model is a good representation of the dielectric response, with the fits shown in Fig. 6, however, there was no systematic trend in Tf or EA with z; the values of f0 vary far more widely than would be expected for such a structurally similar series and, more importantly, in some cases are physically unrealistic for the process they describe (dipolar relaxation frequencies should be of the order 109–1012 Hz).
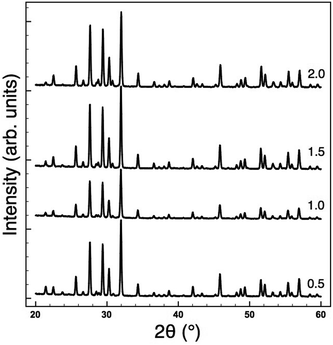 |
| | Fig. 4 XRD patterns for Ba4Sr2−z(Ba0.37Ca0.63)zGaNb9O30 compositions, with z = 0.5, 1.0, 1.5 and 2.0, showing invariant lattice parameters (see Table 1). | |
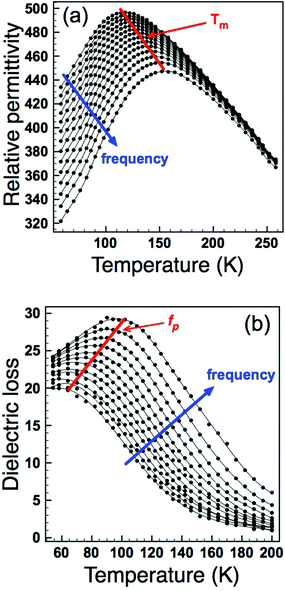 |
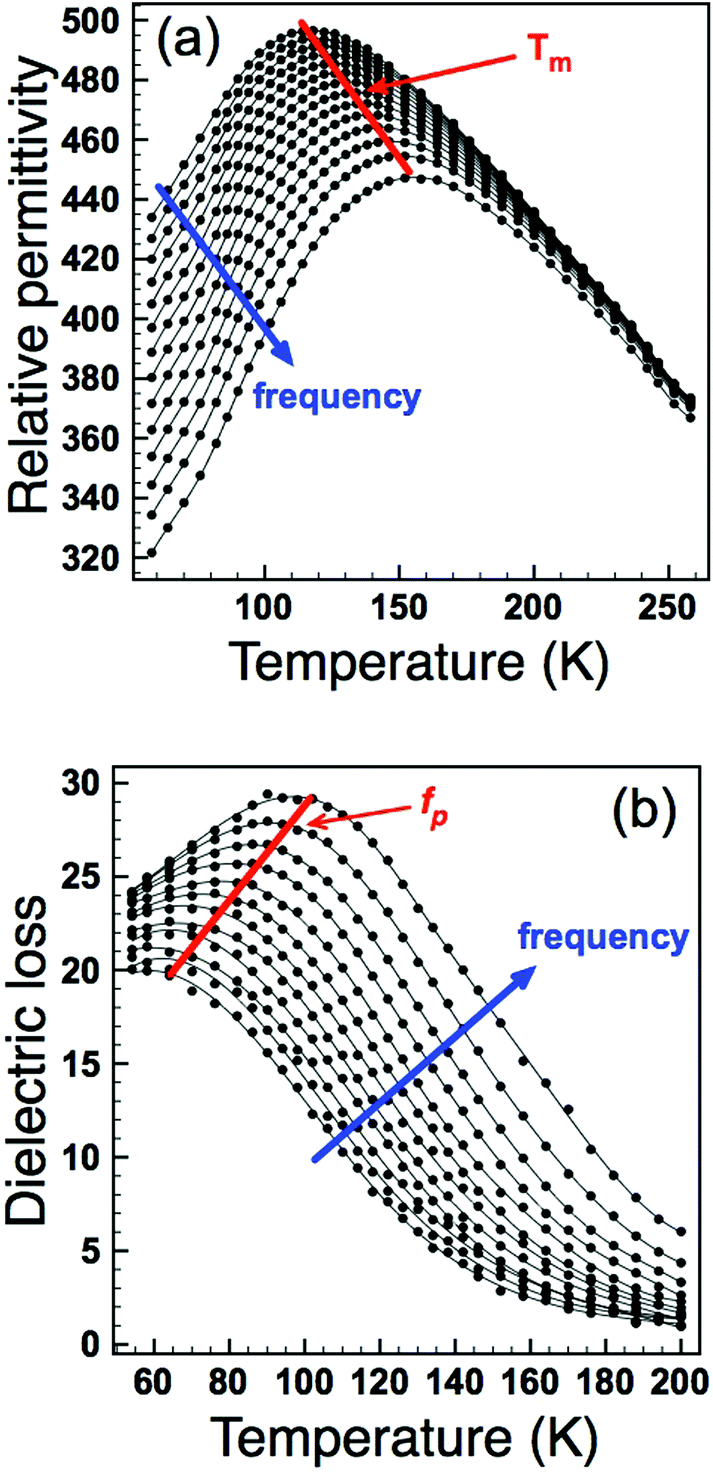
| | Fig. 5 Relative permittivity (a) and dielectric loss (b) as a function of frequency and temperature for z = 0.5. Temperature (Tm) and frequency (fp) maxima used for dielectric analysis are indicated. | |
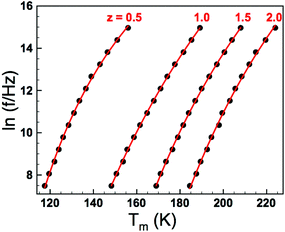 |
| | Fig. 6 (Colour online) Vogel–Fulcher fits to Tm(f) data obtained from relative permittivity profiles as shown in Fig. 5(a). | |
Table 1 Unit cell parameters and variance for “fixed cell” compositions with formula Ba4Sr2−z(Ba0.37Ca0.63)zGaNb9O30
|
z
|
a (Å) |
c (Å) |
c/a |
σ
2 × 10³ (Å2) |
| 0.5 |
12.531 |
3.958 |
0.316 |
7.48 |
| 1.0 |
12.533 |
3.958 |
0.316 |
9.26 |
| 1.5 |
12.528 |
3.956 |
0.316 |
10.68 |
| 2.0 |
12.516 |
3.952 |
0.316 |
12.09 |
Table 2 Calculated values for f0, EA and Tf from the four different Vogel–Fulcher fitting methods employed for Ba4Sr2−z(Ba0.37Ca0.63)zGaNb9O30 samples
| Method |
z
|
f
0 (Hz) |
E
A (eV) |
T
f (K) |
RMSD |
χ
2
|
| Unconstrained |
0.5 |
8.42 × 10¹¹ |
0.108 |
55.1 |
0.064 |
0.058 |
| 1.0 |
4.84 × 10¹⁷ |
0.404 |
7.16 |
0.039 |
0.021 |
| 1.5 |
2.41 × 10¹⁶ |
0.309 |
50.2 |
0.040 |
0.023 |
| 2.0 |
1.55 × 10¹⁶ |
0.293 |
71.0 |
0.091 |
0.116 |
| Constrained f0 |
0.5 |
8.42 × 10¹¹ |
0.108 |
55.1 |
0.064 |
0.058 |
| 1.0 |
8.42 × 10¹¹ |
0.122 |
77.9 |
0.136 |
0.261 |
| 1.5 |
8.42 × 10¹¹ |
0.116 |
102 |
0.122 |
0.207 |
| 2.0 |
8.42 × 10¹¹ |
0.114 |
120 |
0.150 |
0.315 |
| Constrained Tf |
0.5 |
7.03 × 10¹¹ |
0.105 |
56.0 |
0.064 |
0.058 |
| 1.0 |
4.93 × 10¹¹ |
0.114 |
81.4 |
0.147 |
0.302 |
| 1.5 |
3.17 × 10¹² |
0.135 |
96.0 |
0.102 |
0.145 |
| 2.0 |
2.65 × 10¹¹ |
0.097 |
126 |
0.171 |
0.408 |
| Constrained EA |
0.5 |
7.20 × 10¹⁰ |
0.077 |
66.8 |
0.086 |
0.103 |
| 1.0 |
2.46 × 10¹² |
0.139 |
72.6 |
0.120 |
0.200 |
| 1.5 |
1.36 × 10¹³ |
0.159 |
88.4 |
0.082 |
0.095 |
| 2.0 |
2.50 × 10¹⁵ |
0.253 |
80.2 |
0.092 |
0.119 |
The uncertainty over the reliability of the values calculated from the unconstrained VF fits suggested that it might be desirable to re-fit the curves using a restricted, and physically realistic, value for f0. The unconstrained fit to the data for the x = 0.5 sample gave a physically realistic value for f0 of 8.42 × 10¹¹ Hz and this was constrained as the value in subsequent fits for the other three compositions. Visually there was no apparent deterioration of these ‘constrained’ fits but predictably they did not have such low error analyses (Table 2) as the unconstrained fits. However, they did give physically realistic values for both EA and Tf for all samples: the values for EA were within those expected for dipolar processes (of the order of 0.1 eV) and the values of Tf increased systematically with increasing x – as was the expectation from visual inspection of the VF curves, Fig. 6. We have previously discussed the inherent sensitivity of VF fits to minor scatter in data points16 and given that the chosen f0 value was rather arbitrary (being merely the first realistic value obtained by the unconstrained fit method) this outcome was rather unsatisfying.
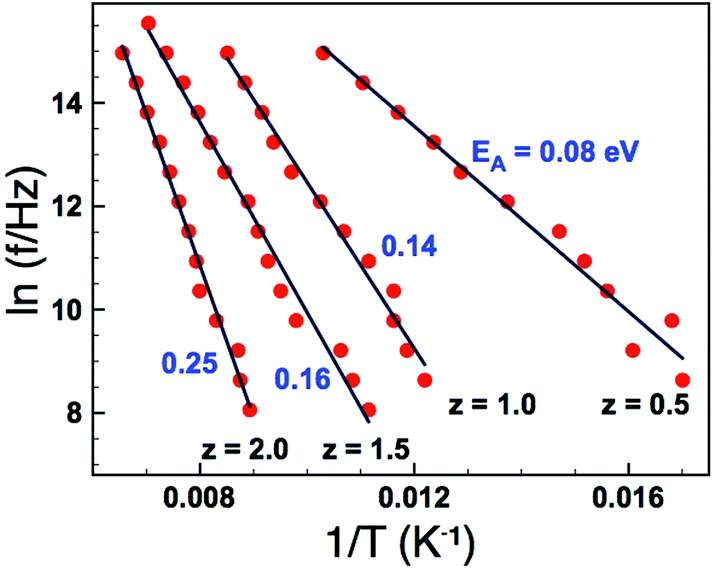
As an alternative we analysed the dielectric loss data according to Jonscher's universal dielectric relaxation (UDR) model17 to determine EA and Tf. We have already shown this to be an effective methodology for modelling dielectric relaxation in these materials9 – the parameters obtained can then be fed back into the VF analysis in order to further investigate the suitability of the VF fitting process. According to the UDR model the temperature dependence of the peak frequency, fp in the dielectric loss, Fig. 5(b), should follow an Arrhenius expression:
| | 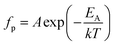 | (3) |
and allows an alternative method to obtain
EA. Arrhenius plots of the loss data for all four samples are given in
Fig. 7. In each case the data give a straight line, and activation energies calculated from a line of best fit give
EA values of 0.077, 0.139, 0.159 and 0.253 eV for
z = 0.5, 1.0, 1.5, and 2.0, respectively (
Table 2). These values are all of the expected magnitude for a dipole relaxation process (as for the VF analysis), however, they show a systematic increase with increasing
z. The dipole freezing temperature,
Tf, can also be determined by analysis of the dielectric loss (
ε′′) data in the time (frequency) domain. The empirical UDR model allows fitting of a dielectric loss peak as a function of frequency according to:
| | 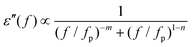 | (4) |
where
f is the frequency of applied field,
fp is the frequency of the peak maximum and the exponents −
m and 1 −
n describe the gradient of the
ε′′(
f) data below and above
fp, respectively (with the condition that 0 ≤
m,
n ≤ 1). The UDR theory states the
ε′′(
f) peak associated with a dipole relaxation should become infinitely broad at dipole freezing,
i.e., the exponent m should tend to zero at
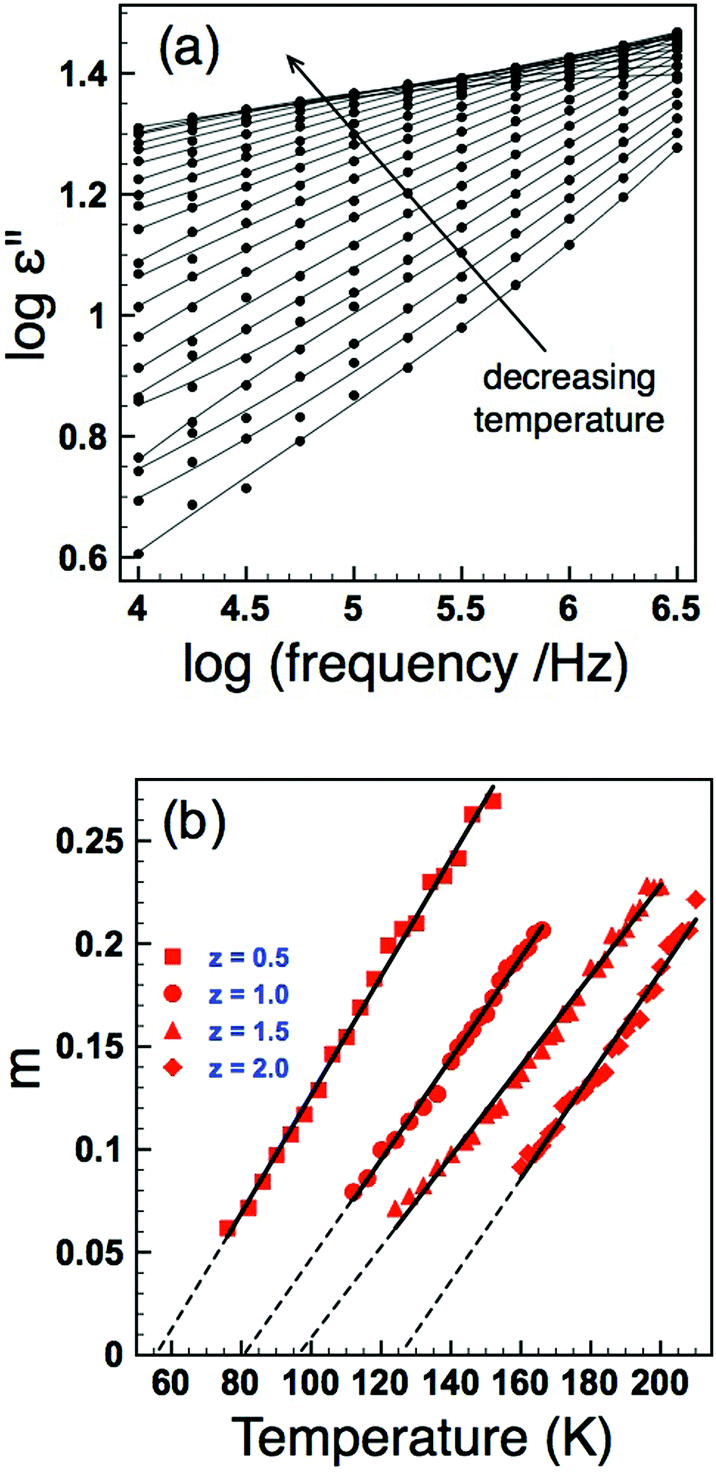
Tf. Dielectric loss data as a function of frequency for the
z = 0.5 sample is shown in
Fig. 8(a) and indicates that the gradient (
m) decreases with decreasing temperature. Extracting the exponent
m from this data and extrapolating to
m = 0 allows an estimation of
Tf. The results of such analysis are shown in
Fig. 8(b) and summarized in
Table 2. The data clearly show a systematic increase in
Tf with increasing
z (increasing
σ2), and furthermore the values obtained are reassuringly in reasonable agreement with those obtained for the VF fits of the real part of the permittivity when values for the fundamental frequency,
f0, were constrained to a physically sensible magnitude,
Table 2.
 |
| | Fig. 7 (Colour online) Arrhenius plots of peak frequency (fp) data obtained from dielectric loss data (as shown in Fig. 5(b)). | |
 |
| | Fig. 8 (Colour online) Dielectric loss as a function of frequency showing a decrease in the frequency exponent, m, with decreasing temperature (a); determination of Tf by extrapolation of m to zero (b). | |
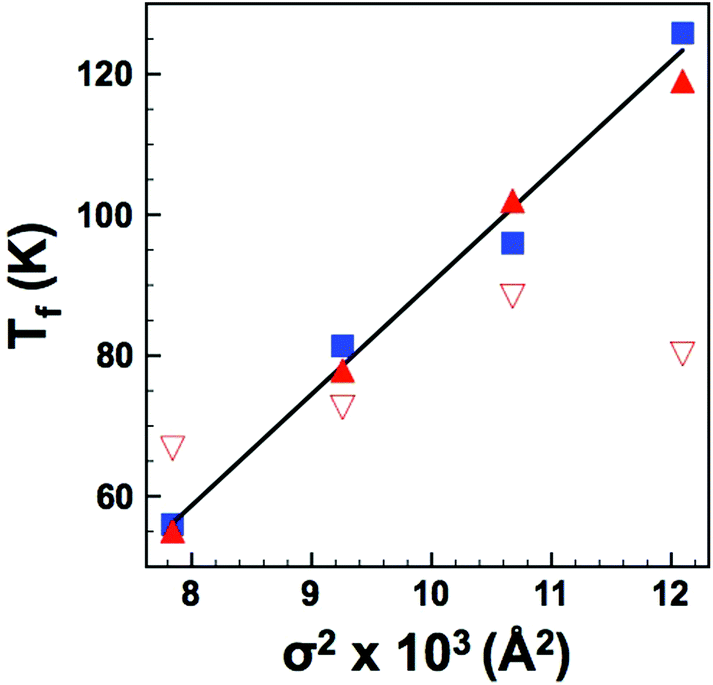
In order to look at the self consistency of the results obtained and to highlight the variability in results obtained via unconstrained fitting alone, the EA and Tf values obtained from UDR analysis of the loss data were fed back into the VF model as constrained parameters and the permittivity data fitted once more – the results are collated in Table 2. The most striking result is the consistency in results obtained via VF fitting where either f0 was constrained to a physically sensible limit, or where Tf had been determined from the UDR analysis of the loss data (which has demonstrated to be a robust methodology9,16); these data show a clear increase in dipole stability (quantified by Tf) with increasing local strain (quantified by variance, σ2), Fig. 9(a). Both the unconstrained VF fits and those with EA values obtained from UDR give no consistent trends in Tf but noticeably both also have f0 values which cover several orders of magnitude, a result which cannot easily be explained by such minor compositional and structural changes and which in some cases give such high frequencies as to be not physically plausible.18,19 The reasons for these variations are discussed in the next section, however, considering the other results it is apparent that in the so called “fixed cell” samples with invariant average structure but increasing local variations, there is a clear and systematic change in the dielectric response as most simply evident in the displacement of the permittivity-temperature profiles (see ESI†). In depth analysis allows this relationship to be quantified in more detail as shown in Fig. 9, but it is important to link back to the original (Ba,Sr,Ca) samples which have both varying local and average structures and Tm data for the “fixed cell” samples are included for comparison in Fig. 3(b). This shows a clear relationship between dipole stability and local structural variations in these materials.
 |
| | Fig. 9 (Colour online) Dipole freezing temperature, Tf, as a function of variance, σ2 as determined by: UDR analysis (squares); VF fits with constrained f0 (filled triangles) and constrained EA (open triangles). Solid line is a linear fit to UDR data. | |
Discussion
It is clear that VF fitting of permittivity data should treated with caution as the parameters obtained are highly sensitive, and often give results which do not vary systematically, or which have a significant spread which cannot easily be explained by minor variations in composition and/or crystal structure. The reasons for these variations are clearly demonstrated by considering how the three fitting parameters (Tf, f0, and EA) relate to the data fits in Fig. 6(a): Tf and f0 are obtained at the limits when f → 0 and f → ∞, i.e., where the extrapolated fit tends to vertical and horizontal, respectively; the curvature of the fit is determined by EA. Due to the combination of the degree of frequency and temperature dispersion displayed by relaxor materials and also the limited frequency range of most experimental apparatus, the Tm(f) data available for VF fitting are limited to a rather narrow range and the fit is extrapolated over many orders of magnitude as shown by replotting the fits shown in Fig. 6(a) on an extended scale in Fig. 10. It becomes obvious therefore that even small variations in Tm(f) data (due e.g., to ceramic microstructure effects) can dramatically effect the parameters obtained. In order to mitigate against this, it is expedient to either place some physically sensible restrictions on one or more parameters (e.g., f0 – Table 2), or to corroborate them by alternative methods such as fitting the loss data to the UDR model. The latter approach is preferable and allows some self-consistency in the VF parameters to be evaluated. A more robust, and consistent alternative is UDR analysis of the loss data and determination of Tf by extrapolation of the m exponent of the loss peak in the frequency domain which has been shown to be consistent and relatively insensitive to ceramic microstructure.
 |
| | Fig. 10 Extended VF fits (with constrained f0) showing extrapolation for estimation of Tf as f → 0. | |
The dielectric data show that Sr and/or Ca substitution at the A-site displaces the dielectric curves to higher temperature. The magnitude of this displacement however is not easily reconciled by a simple size effect argument. Instead the temperature dependence of the dipole stability in these relaxor materials appears to be better described by the A-cation size variance, i.e., the degree of size mis-match and combined UDR analysis and restricted VF fits show that the dipole freezing temperature (Tf) varies linearly with size variance (σ2). The effect of size variance in dipolar oxides was first studied by Sinclair and Attfield14 in Sr- and Ca-doped BaTiO3. They demonstrated that while the effect of Ca-doping on the Curie temperature, TC (which represents the dipole stability) could not be readily explained by a simple size (tolerance factor) argument, there was a clear relationship with size variance. They also reported a linear dependence with dTC/dσ2 of 14500–16000 K Å−2 compared to values of ca. 50000 K Å−2 for the structural transition in A2CuO4 compounds and ca. 20000 K Å−2 for the magnetic transition in AMnO3 perovskites. They attributed these differences to the differing mechanisms and suggested that ca. 15000 K Å−2 was the signature of a displacive (dipolar) transition. A linear fit of Tf (determined from the UDR analysis) vs. σ2, shown in Fig. 9 gives dTf/dσ2 = 15800 K Å−2, in excellent agreement with dipolar Ti displacements in ferroelectric Ca-BaTiO3. This result is perhaps not unsurprising given that the dipolar nature of both systems arises due to B-cation displacements within the oxygen octahedra.
Sinclair and Attfield14 did not describe the atomistic mechanism of dipole stabilisation, merely surmising that it was likely due to lattice strain. In a later study, Levin et al.20 used XAFS to study the local structure in both Ca- and Sr-doped BaTiO3. Their study showed that while Sr remains centric in the A-site, Ca is displaced and this couples with the neighbouring B-site Ti displacements, stabilising it and sustaining TC. This work has since been corroborated by the computational work of Dawson et al.21 In simple crystallo-chemical terms this is rather easily understood: Ca is too small for the large 12-coordinate A-site of a cubic perovskite oxide and hence CaTiO3 undergoes a distortion to orthorhombic Pbnm symmetry (the GdFeO3 structure) which involves octahedral tilting to reduce the A-site volume and concomitant “anti-polar” A-site displacements in order to reduce the Ca coordination from 12 to the preferred 8. In our recent work on REScO3 (RE = La, Nd, Gd) doped BaTiO3 we argued that in a Ba-rich lattice the octahedral tilts are frustrated due to surrounding Ba-containing A-sites resisting this volumetric contraction, and as a result only the A-site displacement mode remains to optimise the preferred bonding environment of the smaller A-site dopant cation.22 This A-site displacement couples with the B-site and stabilises TC.
It is not immediately clear, however, why it is the statistical size variance rather than absolute size dependence (i.e. TC or Tf has a root rather than reciprocal relationship with size). The work by Dawson et al.21 suggests a delicate balance of A-site and B-site (octahedral) volume contraction and it may be coincidence that variance reflects this balance. In any case it appears that the statistical size variance allows a metric of “local structure” to be determined and which clearly has an effect on the dielectric properties. Such local information is not readily available by traditional diffraction methods and techniques which provide local structural information (such as XAFS or PDF) are required.
Conclusions
The effect of isovalent A-site doping on the dielectric response of a family of relaxor TTBs was investigated using neutron and X-ray diffraction and in-depth analysis of dielectric data. The dielectric analysis showed that fitting of permittivity data to the widely used Vogel–Fulcher model should be treated with caution and that fitting of dielectric loss data according to the Universal Dielectric response model is a more reliable and robust method for determining the dipole freezing temperature, Tf (which is a measure of dipole stability) in these materials.
The crystallography, as determined by neutron and X-ray diffraction, indicated that all compositions obeyed Vegard's law with unit cell metrics decreasing monotonically with decreasing average A-cation size. In contrast the dipole stability did not vary in a similarly systematic way with A-cation size but instead Tf is directly proportional to the statistical A-cation size variance. The variance provides a measure of local structure and so it is clear that local structure plays a significant role in the dielectric response. Such information is not available via conventional Rietveld analysis of diffraction data and probes of local structure are required. Nevertheless, it appears that variance may be a useful metric to guide the tuning of properties in TTBs and could be extended to other structure types which contain perovskite units such as Ruddlesen-Popper and Dion-Jacobsen phases.
Acknowledgements
The authors would like to acknowledge EaStCHEM and EPSRC (grant no. EP/F004133/1) for financial support, and Dr Clemens Ritter of the ILL for assistance in collection of neutron diffraction data.
References
- P. G. Dickens and M. S. Whittingham, Q. Rev., Chem. Soc., 1968, 22, 30 RSC.
- A. Simon and J. Ravez, C. R. Chim., 2006, 9, 1268–1276 CrossRef CAS PubMed.
- P. B. Jamieson, S. C. Abrahams and J. L. Bernstein, J. Chem. Phys., 1969, 50, 4352 CrossRef CAS PubMed.
- P. Labbe, H. Leligny, B. Raveau, J. Schneck and J. C. Toledano, J. Phys.: Condens. Matter, 1990, 2, 25–43 CrossRef CAS.
- P. B. Jamieson, S. C. Abrahams and J. L. Bernstein, J. Chem. Phys., 1968, 48, 5048 CrossRef CAS PubMed.
- I. Levin, M. C. Stennett, G. C. Miles, D. I. Woodward, A. R. West and I. M. Reaney, Appl. Phys. Lett., 2006, 89, 122908 CrossRef PubMed.
- M. C. Stennett, I. M. Reaney, G. C. Miles, A. R. West, C. A. Kirk and I. Levin, J. Appl. Phys., 2007, 101, 104114 CrossRef PubMed.
- D. C. Arnold and F. D. Morrison, J. Mater. Chem., 2009, 19, 6485–6488 RSC.
- A. Rotaru, D. C. Arnold, A. Daoud-Aladine and F. D. Morrison, Phys. Rev. B: Condens. Matter, 2011, 83, 184302 CrossRef.
- A. Rotaru, A. J. Miller, D. C. Arnold and F. D. Morrison, Philos. Trans.: Math., Phys. Eng. Sci., 2014, 372, 20120451 CrossRef PubMed.
- J. Gardner and F. D. Morrison, Dalton Trans., 2014, 43, 11687–11695 RSC.
- R. D. Shannon, Acta Crystallogr., Sect. A: Found. Crystallogr., 1976, 32, 751–767 CrossRef.
- J. P. Attfield, Chem. Mater., 1998, 10, 3239–3248 CrossRef CAS.
- D. C. Sinclair and J. P. Attfield, Chem. Commun., 1999, 1497–1498 RSC.
- D. Viehland, S. J. Jang, L. E. Cross and M. Wuttig, J. Appl. Phys., 1990, 68, 2916 CrossRef CAS PubMed.
- A. Rotaru and F. D. Morrison, J. Therm. Anal. Calorim., 2015 DOI:10.1007/s10973-014-4355-5.
-
A. K. Jonscher, Dielectric Relaxation in solids, Chelsea Dielectrics Press, London, 1983 Search PubMed.
- F. Bahri, H. Khemakhem, M. Gargouri, A. Simon, R. Von der Mühll and J. Ravez, Solid State Sci., 2003, 5, 1445–1450 CrossRef CAS.
- H. Du, W. Zhou, F. Luo, D. Zhu, S. Qu and Z. Pei, J. Appl. Phys., 2009, 105, 124104 CrossRef PubMed.
- I. Levin, V. Krayzman and J. C. Woicik, Appl. Phys. Lett., 2013, 102, 162906 CrossRef PubMed.
- J. A. Dawson, D. C. Sinclair, J. H. Harding and C. L. Freeman, Chem. Mater., 2014, 26, 6104–6112 CrossRef CAS.
-
S. A. Turp, PhD thesis, Chemical control of the polymorphic phase boundaries in doped barium titanate, University of St Andrews, 2013 Search PubMed.
Footnote |
| † Electronic supplementary information (ESI) available. See DOI: 10.1039/c4dt03936j |
|
| This journal is © The Royal Society of Chemistry 2015 |
Click here to see how this site uses Cookies. View our privacy policy here. 
 Open Access Article
 This Open Access Article is licensed under a