 Open Access Article
Creative Commons Attribution 3.0 Unported Licence
Valence properties of Cu and Ru in titanium-substituted LnCu3Ru4O12+δ (Ln = La, Pr, Nd) investigated by XANES and TGA†
Stefan
Riegg
*a,
Armin
Reller
b,
Alois
Loidl
a and
Stefan G.
Ebbinghaus
c
aExperimental Physics V, Center for Electronic Correlations and Magnetism, University of Augsburg, D-86159 Augsburg, Germany. E-mail: stefan.riegg@physik.uni-augsburg.de; Fax: +49 821 598 3649; Tel: +49 821 598 3751
bResource Strategy, University of Augsburg, D-86159 Augsburg, Germany
cSolid State Chemistry, Martin Luther University Halle-Wittenberg, D-06099 Halle, Germany. E-mail: stefan.ebbinghaus@chemie.uni-halle.de
First published on 17th March 2015
Abstract
In the solid-solution series LayCu3RuxTi4−xO12+δ (0 ≤ x ≤ 4) the Cu and Ru electronic states are highly correlated. With increasing Ru content x the system properties change from a paramagnetic insulator with colossal dielectric constant to a heavy-fermion metal. To further elucidate the occurring phase transitions, the valences of Cu and Ru have been investigated utilizing XANES measurements at the Cu-K and the Ru-K absorption edges. It was found that the Ru oxidation number is close to +4 in all samples, while the Cu valence linearly decreases from +2 for the titanate (x = 0) to +1.6 for the ruthenate (x = 4). Additional thermogravimetric measurements have been used to determine the oxygen content and rather high oxygen excesses up to δ ≈ 0.7 (for x = 0.5) were obtained. The additional oxygen for x < 2 is required to compensate the constant Ru +4 valence. Our findings are in accordance with the reported phase transitions of the magnetic and transport properties. Both the valence shift and the shapes of the absorption edges suggest a change from localized to itinerant character of the Cu electronic states with increasing x, while the Ru electrons remain localized. Analogous results concerning the valences were found for the PryCu3RuxTi4−xO12+δ and NdyCu3RuxTi4−xO12+δ solid-solution series.
1 Introduction
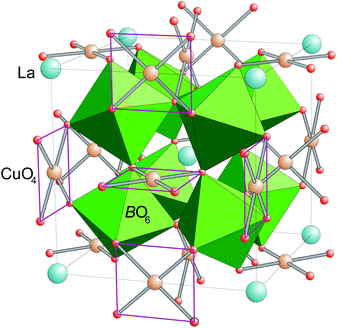
Perovskites with sum formula ABO3 are one prototypical subject for studies of structure–property relationships in transition-metal oxides. This is due to the fact that a plethora of different compositions can easily be obtained. By this the physical properties can be tailored via the electronic configuration of A- and/or B-type cation as well as via changes in bond lengths and bond angles, which are the result of the size mismatch of A- and B-site cations.The family of cubic AA′3B4O12 compounds (Space group Im![[3 with combining macron]](https://www.rsc.org/images/entities/char_0033_0304.gif) , no. 204) can be derived from the perovskite structure by a collective rotation of the BO6 octahedra around <111> (according to a threefold tilting a+a+a+ in Glazer's notation).1,2 This rotation leads to a strong deformation of 3/4 of the A-sites resulting in a square-planar coordination for the cations occupying this site, which is therefore denoted as A′. This coordination geometry is favored by Jahn–Teller active ions like Cu2+ and Mn3+.3 The crystal structure of the AA′3B4O12 perovskites is depicted in Fig. 1.
, no. 204) can be derived from the perovskite structure by a collective rotation of the BO6 octahedra around <111> (according to a threefold tilting a+a+a+ in Glazer's notation).1,2 This rotation leads to a strong deformation of 3/4 of the A-sites resulting in a square-planar coordination for the cations occupying this site, which is therefore denoted as A′. This coordination geometry is favored by Jahn–Teller active ions like Cu2+ and Mn3+.3 The crystal structure of the AA′3B4O12 perovskites is depicted in Fig. 1.
The solid-solution series LayCu3RuxTi4−xO12 is a member of this AA′3B4O12 family and exhibits a rich phase diagram of physical properties depending on the B-site composition x.4–6 The pure titanate (x = 0) is insulating with a colossal dielectric constant similar to CaCu3Ti4O12.7–9 Below TN ≈ 25 K an antiferromagnetic long-range order of the localized Cu2+ (S = 1/2) spin moments occurs. Until x = 0.5 the Néel temperature decreases linearly and a spin-glass state was identified by ac-susceptibility measurements for 0.5 < x < 2.5.10 On the other hand, for x ≥ 2.5 the ruthenium-rich phases are metallic and due to electronic correlation effects exhibit heavy-fermion behavior.5 This behavior is usually observed in materials containing 4f or 5f elements due to hybridization of localized f-electrons and typically s- or p-derived conduction electrons. Very rarely, transition-metal oxides without f-elements can also exhibit heavy-fermion properties due to strong correlation effects of localized and itinerant d-electrons. Examples of such d derived heavy-fermion materials are LiV2O4 and CaCu3Ru4O12.11–15 CaCu3Ru4O12 in addition provides non-Fermi liquid behavior below 2 K as well as an intermediate-valence behavior caused by d electron fluctuations.16 This compound is closely related to the LnyCu3RuxTi4−xO12 series investigated in this work.
The transition from the Mott-insulating spin-glass state to the heavy-fermion metal in LayCu3RuxTi4−xO12 was observed at approximately x = 2.25 and ascribed to a quantum-critical point at this composition.5,17,18 The appearance of various phase transitions within a rather small substitution range is highly attractive for more detailed investigations. The complete solid-solution series was therefore synthesized with La, Pr, and Nd occupying the A-site according to the sum formula LnyCu3RuxTi4−xO12. Up to now, the discussion of Kondo-like behavior in the ruthenium rich phases based on magnetic susceptibility, specific heat, resistivity, and magnetic resonance experiments was performed without valence analysis of Ru or Cu. A detailed study of the oxygen content in these materials has not been carried out either. There already have been considerations about the changing valence state of copper in LayCu3RuxTi4−xO12 in ref. 4. However, distinct charge-transfer properties similar to CaCu3Ru4O12 were neither observed in the magnetic susceptibility nor in temperature-dependent crystal-structure data of LnCu3Ru4O12.5,6
It is apparent that physical properties such as electrical conductivity and magnetism react very sensitively on the oxygen content as well as on the cationic valences. By variation of the oxygen content, the concentration of free charge carriers can be controlled and a direct influence on the transport properties of the material is possible. To better understand the above described variations of the investigated magnetic properties and the metal-to-insulator transition in LayCu3RuxTi4−xO12, valences and oxygen stoichiometry have to be determined. The accurate description of Ru and Cu valence was performed using X-ray absorption near edge structure (XANES) studies. In addition, the oxygen content for the La series was obtained from thermogravimetric (TG) measurements under reducing atmosphere. A possible deviation from the nominal oxygen stoichiometry is denoted as δ in the sum formula LayCu3RuxTi4−xO12+δ.
2 Experimental
Polycrystalline samples of LnyCu3RuxTi4−xO12+δ were synthesized by a conventional solid-state reaction using binary oxides as starting products. La2O3 (Chempur, 99.9%), Pr2O3 (MaTecK, 99.9%), Nd2O3 (Chempur, 99.9%), and RuO2 (Chempur, 99.9%) were dried at 900 °C for 6 hours to remove water and carbonates. During this pre-drying step Pr2O3 reacted to form the non-hygroscopic Pr6O11. Appropriate amounts of these oxides were mixed with TiO2 (Aldrich, ≥99%) and CuO (HelmAG, 99.5%) to achieve 2 g of the final product. An excess of CuO of roughly 0.3 g per g sample is used as self-flux and was dissolved after the reaction with diluted hydrochloric acid.19 The mixed powders were ground using agate mortar and pestle and pelletized to avoid reaction with the crucible material (highly densified aluminium oxide). The pellets were heated in air at 1040 °C for 96 hours with one intermediate grinding and pelletizing step after 48 hours. Phase purity was checked by X-ray diffraction. Details of the excellent purity of the LayCu3RuxTi4−xO12+δ samples have already been reported in ref. 18. The samples of the other two series PryCu3RuxTi4−xO12+δ and NdyCu3RuxTi4−xO12+δ are of equivalent quality (see Fig. 1, 2 in the ESI†).X-ray diffraction patterns of the powder samples were recorded at room temperature in the angular range 10° ≤ 2θ ≤ 150° using a Seifert 3003 TT θ–θ powder diffractometer (Cu-Kα1,2 radiation) equipped with a one-dimensional single-line semiconductor detector (METEOR-1D). A step width of 0.01° 2θ and an integration time of 300 s per data point were chosen. The Rietveld structure analysis was carried out with the FullProf program suite.20
For the thermogravimetric (TG) measurements a TA-Instruments Q500 thermobalance was used. Approximately 30 mg of sample powders were heated in platinum crucibles at a constant rate of 10 K min−1 from room temperature to 950 °C under forming gas flow of 75 ml min−1 (5% H2 in N2) and held at this maximum temperature for 15 min. For buoyancy correction a baseline was recorded using roughly 40 mg of dry Al2O3 and subtracted from the sample measurements.
XANES investigations at the Cu-K (8.979 keV) and the Ru-K (22.117 keV) absorption edges were carried out in the transmission mode at the beamline X at HASYLAB (DESY, Hamburg).21 For the measurement appropriate amounts of sample or reference material were mixed with 20 mg cellulose and pressed into pellets of 13 mm diameter. For measurements at the Cu-K edge approximately 10 mg of the binary oxides were used, while for the ACu3B4O12 samples with significantly lower Cu content only 30 mg could be taken to keep the absorption within a reasonable range. For the Ru-K edge measurements (at significantly higher energies) the sample weight varied between 60 mg and 120 mg according to 0.25 mmol ruthenium. The absorption spectra of CuO and Cu2O were recorded as references for Cu2+ and Cu1+, respectively. Additional Cu2+ references (isostructural to the investigated samples) were CaCu3Ti4O12 and SrCu3Ti4O12. Different ruthenates were used as Ru4+ and Ru5+ references,6,22 while Ru-acetylacetonate and Ru-nitrosylacetonate served as trivalent ruthenium references. All spectra were energy calibrated using a Cu metal foil or Ru metal powder as simultaneously measured references. The pre-edge region was used for a linear fit, which was subtracted from the spectra over the whole energy range. These background-corrected spectra were normalized with respect to a common region above the edge energy.
3 Crystal structure and oxygen stoichiometry
All samples crystallize in the space group Im![[3 with combining macron]](https://www.rsc.org/images/entities/char_0033_0304.gif) with statistically distributed Ti and Ru on the B-site (Wyckoff position 8c:
with statistically distributed Ti and Ru on the B-site (Wyckoff position 8c:  ). The A′- (6b:
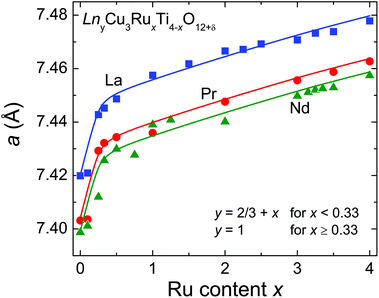
  ) and the O-sites (24 g: xy0, x ≈ 0.18, y ≈ 0.31) are fully occupied with Cu and oxygen, respectively. On the other hand, the A-site (2a: 000) shows only a 2/3rd occupation for the pure titanates due to the charge balance. With increasing ruthenium concentration this site becomes increasingly filled, which is expressed by the parameter y in LnyCu3RuxTi4−xO12+δ. The relation y = 2/3 + x holds for x ≤ 0.33, while for x ≥ 0.33 the A-site is fully occupied and, hence, y = 1.
Both the increasing filling of the A-site and the slightly larger ionic radius of Ru4+ compared to Ti4+ have a strong impact on the evolution of the cell parameter a as shown in Fig. 2. A steep increase is observed for x ≤ 0.33 dominated by the increasing A-site filling. In contrast, a much smaller slope is found for x ≥ 0.33 reflecting the increasing ruthenium substitution level (ionic radii with coordination number (CN) 6: Ru4+: 0.620 Å; Ti4+: 0.605 Å).23 For the Pr- and Nd-series systematically smaller values for a were obtained in agreement with smaller ionic radii for the Pr3+ and Nd3+ ions (ionic radii with CN 12: La3+: 1.36 Å; Nd3+: 1.27 Å; Pr3+: 1.179 Å for CN 9 and scaled to CN 12 with factor 1.1 obtained from intrapolation of the corresponding values for La and Nd, resulting in 1.30 Å),23 which is indicated by parallel solid lines in Fig. 2. The cell-parameter values for the Nd series are in very good agreement with data reported by Muller et al. in ref. 24. Details of the structural data such as refinement parameters, bond lengths and angles as well as the measured XRD patterns are given in the ESI.†
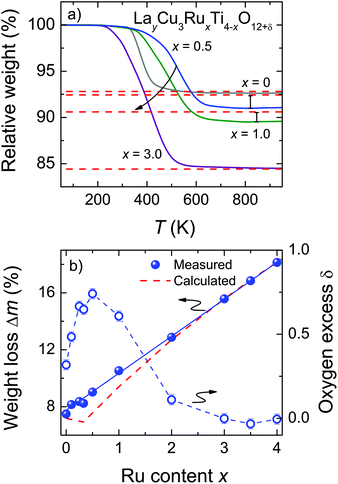
The oxygen stoichiometry of LayCu3RuxTi4−xO12+δ was obtained by TG measurements under reducing conditions. The late (noble) transition-metal cations of Cu and Ru are completely reduced to the respective metals leading to comparatively large weight losses between roughly 7% and 18% (see Fig. 3b). In contrast, La3+ and Ti4+ are stable up to the maximum temperature of 950 °C. Control experiments in synthetic air led to insignificant weight losses (<1.5‰), proving that the samples do not contain any carbonates or hydroxides. Thus, after the TG measurements La2O3, TiO2, Cu, and Ru are obtained as confirmed by powder XRD measurements.
The observed weight losses during the TG measurement occur at different temperatures depending on x (Fig. 3a). Above roughly 700 °C the reaction is completed for all samples as evidenced by the constant weight values up to the maximum temperature. For La2/3Cu3Ti4O12 a sudden weight decrease is observed at roughly 375 °C and the reaction is completed already at approximately 600 °C. Upon Ru substitution the reduction step becomes much broader and for x ≤ 0.5 its inflection point is shifted to higher temperatures by roughly 150 °C. By further increasing the Ru content the weight reduction increases correspondingly and the temperature of the reduction step is monotonously shifted to lower temperatures (300 °C). This behavior reflects a decreasing shielding effect as reported for e.g. SrTi1−xRuxO3 and Sr2Ti1−xRuxO4.25 Under the chosen conditions no clearly separated reaction steps were observed, indicating an almost simultaneous reduction of Cu and Ru.
The obtained weight-loss values are depicted as blue spheres in Fig. 3b as a function of the ruthenium content. The reproducibility of approximately 10 μg for the measurements and the baseline correction correspond to an error of less than ±0.06%. The experimental data are increasing linearly with x as marked by a blue solid line resulting from a linear fit. The value for Δm was determined as the difference between 50 °C and 900 °C. For comparison, the theoretical weight loss was calculated presuming δ = 0 according to the following equation:
 | (1) |
The fraction of volatile oxygen thus amounts to z = 4 + 2x−1.5y. Using the molar masses of oxygen M(O) and of the samples before reduction Mi the expected weight losses Δmcalc can be calculated according to:
 | (2) |
These values are drawn as a red dashed line in Fig. 3b. The deviation between the experimental and the calculated data reveals the presence of excess oxygen for low Ru substitution levels. In addition, the strongly varying shape of the two curves is noteworthy, because the kink in the calculated curve caused by the changing occupation of the Ln-site for x ≤ 0.33 does not appear for the measured weight-loss values. From the experimental weight losses oxygen excesses up to δ = 0.74 per f.u. were obtained for x = 0.5 (Fig. 3b, right scales). The value of δ is calculated according to:
 | (3) |
4 Cation valence determination using X-ray absorption spectroscopy
The Ru and Cu valences were determined using XANES spectroscopy. Assuming a constant 2+ oxidation state for the Cu ions and δ = 0, a Ru valence of nominal +3.75 would result for LnCu3Ru4O12. In fact, a constant Ru valence close to +4 was reported for LaCu3RuxTi4−xO12 and NdCu3RuxTi4−xO12 in ref. 6 by XANES measurements at the Ru-LIII absorption edge. This is in agreement with δ = 0 obtained by thermogravimetry for the pure ruthenates LaCu3Ru4O12 and NdCu3Ru4O12.19 The effect of the excess oxygen observed in LnyCu3RuxTi4−xO12+δ on the valences of Cu and Ru is examined in the following.4.1 Ru-K edge studies
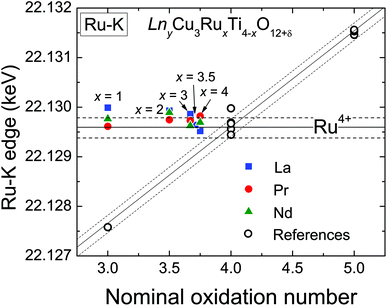
XANES measurements were performed at the Ru-K absorption edge for all three A-site cation series (La, Pr, and Nd), which allows a direct comparison of the Ru-valence properties. The normalized spectra of the Ru-K edge of selected LnyCu3RuxTi4−xO12+δ samples are shown in Fig. 4 in the ESI.† The edge-shape is very similar for all samples showing two distinct peaks which result from the transition from the 1s into the 5p like orbitals. A pre-edge feature caused by the quadrupole allowed transitions into 4d states is not observed, which is in agreement with the highly symmetrical octahedral coordination of the B-site.At the K-edges the inflection point of the absorption edge (determined as the first maximum in the first derivative) is typically used to calculate the valence.27–29 In Fig. 4 the obtained edge energies are shown as a function of the nominal ruthenium oxidation state assuming a constant Cu2+ valence. The open symbols correspond to the edge energies of the reference materials. The observed valence shift for the references is clearly linear and amounts to ≈ 1.9 eV per oxidation state (similar to ref. 28) as marked by the diagonal solid line according to the linear relation
| ERu−K(keV) = 22.1219 + 0.0019 (nominal Ru valence). | (4) |
The additionally shown dashed lines indicate an error range of approximately ±0.2 eV. As can easily be seen, the edge energies of the LnyCu3RuxTi4−xO12+δ samples do not vary with the ruthenium content but remain almost constant at a value typical for oxides containing Ru4+. The energy value for x = 0.5 of the La series is not shown for graphical reasons, but also amounts to 22.1297 keV, i.e. close to Ru4+. It can be concluded that the ruthenium oxidation state is constantly +4 (4d4 configuration) in all samples in agreement with investigations at the Ru-LIII edge.6
4.2 Cu-K edge studies
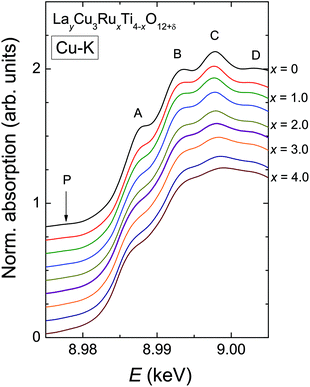
In contrast to the Ru-K edge, the Cu-K spectra depicted in Fig. 5 show a clear dependence on the substitution level. For La2/3Cu3Ti4O12 (top) a well-pronounced and sharp structure of the absorption edge is visible, which remains almost unchanged up to x = 2.0. A small pre-edge feature denoted as P is detectable as well as four distinct peak-like structures denoted A to D. Starting with the spectrum of LaCu3Ru2.5Ti1.5O12 these peaks become broader and the shape of the absorption edge of the pure ruthenate (bottom) becomes visibly smoother.The derivatives of the Cu-K edge spectra are shown in Fig. 6. The small pre-edge feature of the excitation in the 3d10![[L with combining low line]](https://www.rsc.org/images/entities/char_004c_0332.gif) hole state gradually becomes smaller with increasing x. This indicates a decreasing number of holes due to a reduced average valence. The four distinct peaks A–D correspond to transitions to 4p type orbitals.29–34 However, in peak A a rather strong contribution of the quadrupole allowed transitions of 4s states to the 4p transitions might be present due to the square-planar coordination of the copper ions. In agreement with the increasing softening of the absorption-edge shape seen in Fig. 6 the peaks broaden and their heights decrease upon increasing Ru substitution.
hole state gradually becomes smaller with increasing x. This indicates a decreasing number of holes due to a reduced average valence. The four distinct peaks A–D correspond to transitions to 4p type orbitals.29–34 However, in peak A a rather strong contribution of the quadrupole allowed transitions of 4s states to the 4p transitions might be present due to the square-planar coordination of the copper ions. In agreement with the increasing softening of the absorption-edge shape seen in Fig. 6 the peaks broaden and their heights decrease upon increasing Ru substitution.
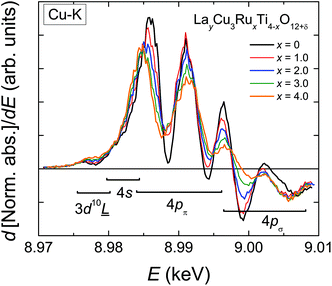 | ||
| Fig. 6 (color online) First derivative of the normalized Cu-K edge XANES spectra of LayCu3RuxTi4−xO12+δ for selected substitution levels x. | ||
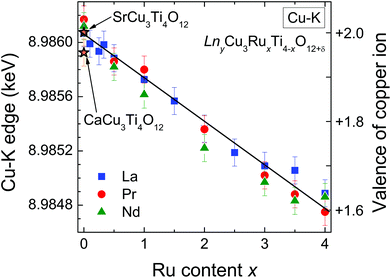
The edge energies determined from the maxima of the first derivatives of peak A (see Fig. 6) for the complete series LnyCu3RuxTi4−xO12+δ are depicted as a function of the Ru-substitution level in Fig. 7. The edge energies linearly decrease with increasing x from the pure titanates to the pure ruthenates, which is marked by the solid line. CaCu3Ti4O12 and SrCu3Ti4O12 were used as Cu2+ references (marked by orange stars in Fig. 7). For these compounds, the presence of divalent copper has earlier been confirmed from charge neutrality, specific heat, magnetic susceptibility, and electron-paramagnetic-resonance (EPR) spectroscopy.35 The edge energies of these two references and the pure titanates Ln2/3Cu3Ti4O12 (Ln = La, Pr, Nd) are almost equal (±0.2 eV), which proves the presence of Cu2+ ions in pure titanates. These XANES results are in agreement with EPR measurements reported in ref. 36.
Absolute values for the copper oxidation states can be obtained using the difference of the absorption edge energies between Cu2O and CuO as references for Cu1+ and Cu2+. This difference amounts to 3.1 eV from our own measurements, which is in good agreement with the average difference of 3.3(2) eV reported in literature.30,37–39 From the linear fit shown in Fig. 7 a decrease of the edge energy by ΔE ≈ 1.3 eV between x = 0 and x = 4 is obtained. Using this value, a Cu valence of approximately +1.6 for the pure ruthenates can be calculated according to ΔE/[E(CuO) − E(Cu2O)] = 1.3/3.1 ≈ 0.42. In other words, the nominal copper oxidation state decreases linearly by 0.1 per integer value of x upon substitution as illustrated by the right scales in Fig. 7. The value of +1.6 for LnCu3Ru4O12 is in good agreement with the calculated valence of +1.67 assuming Ru4+ and δ = 0.
The non-integer oxidation state could be a hint for the existence of mono- and divalent Cu ions. However, the absorption-edge spectra do not provide any shoulders or additional steps indicating a coexistence of Cu1+ and Cu2+ as found e.g. for rapidly cooled samples of the closely related system Cu2+xTa4O12+δ.6 This result reveals that all Cu ions possess the same average valence supporting arguments of increasing itinerancy of electrons for increasing Ru content reported for this system.4,6
The XANES results for the LnyCu3RuxTi4−xO12+δ series are remarkably different from the results of the valence evolution observed for the perovskite-related Ruddlesden–Popper system La2−xSrxCu1−yRuyO4−δ with mixed Ru/Cu-site. These compounds contain divalent copper and provide a change of the Ru valence between +4 and +5 depending on the substitution levels.22,40,41
4.3 Comparison of TG and XANES results
The Cu oxidation state obtained by XANES spectroscopy can be compared with the one from the TG weight loss assuming fixed tetravalent Ru. The obtained valence of copper is depicted in Fig. 8. The solid line marks the oxidation state resulting from the energy shift of the Cu-K absorption edge. The TG data and XANES results are generally in good agreement within the estimated experimental uncertainties except for the samples with low Ru substitution levels x = 0.5 and x = 1.0, which according to the TG results would show a higher valence than expected. This may be explained by a small off-stoichiometric amount of Cu in the samples, which is most likely incorporated on the A-sites due to the sample preparation using a CuO flux. It should be kept in mind that for δ = 0 a constant Cu valence of +1.67 would result for x ≥ 0.1, a behavior, which is clearly not observed.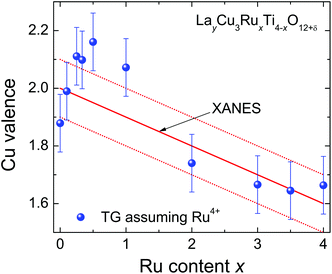 | ||
| Fig. 8 (color online) Nominal Cu valence of LayCu3RuxTi4−xO12+δ determined from XANES (solid line) and TG analysis (symbols) assuming tetravalent Ru. | ||
5 Conclusions
The combination of TG and XAS investigations provides important information on the mixed valence states of copper and ruthenium containing oxides.42 It was found that in LnyCu3RuxTi4−xO12+δ (Ln = La, Pr, Nd) considerable amounts of excess oxygen up to δ ≈ 0.7 can be incorporated. This finding is in accordance with earlier reports on Cu2+xTa4O12+δ.26XANES investigations at the Ru-K edge confirm a constant oxidation state of +4 for ruthenium, independent of the La/Ru/Ti-composition. On the other hand, the oxidation state of copper was found to vary between +2 for the pure titanates Ln2/3Cu3Ti4O12 and +1.6 for the ruthenates LnCu3Ru4O12. Lower Cu valences for the Ti-rich compounds are avoided by the excess oxygen content δ. Small deviations between copper oxidation numbers obtained from thermogravimetry and X-ray absorption spectroscopy at low x values may derive from additional Cu ions on the A-site.
Our results are of high importance for the interpretation of the electronic and magnetic properties of the LayCu3RuxTi4−xO12+δ samples. The observed metal-to-insulator transition as well as the variation of magnetic properties depending on the ruthenium content are in accordance with constant Ru and changing non-integer Cu valences.4,5,18 Due to the decreasing Cu oxidation state the itinerancy of the 3d electrons increases with the increasing Ru substitution level until the transition to the metallic heavy-fermion behavior is observed at x ≈ 2.25.17 Even in this heavy-fermion phase a change of the Kondo physics can be observed, which is closely related to the varying electronic properties in the correlated Cu and Ru systems.18 In contrast, the copper valence in the related CaCu3Ru4O12 was determined to be +2,43 which evidences varying electronic correlations driving the heavy-fermion properties in the ACu3Ru4O12 compounds depending on the element occupying the A-site. This was also reported by Mizumaki et al.44 where an increasing number of O 2p holes and decreasing charge-transfer energy for LaCu3Ru4O12, CaCu3Ru4O12, and NaCu3Ru4O12 were found. Furthermore, in agreement with the changing number of hole states a duality of localized and itinerant character of the Cu 3d electrons was concluded as it is evidenced by this work as well. Also, since the Pr and Nd series provide similar electronic, magnetic, and valence properties like LayCu3RuxTi4−xO12+δ, analog oxygen stoichiometries and heavy-fermion physics can be assumed and deserves more detailed investigation.
Acknowledgements
The authors gratefully acknowledge HASYLAB (DESY) for allocating beamtime and E. Welter for technical support. This work was supported by the Bavarian graduate school (Resource strategy concepts for sustainable energy systems) of the Institute of Materials Resource Management (MRM) of the University of Augsburg and partly by the DFG within the collaborative research unit TRR 80 (Augsburg, Munich, and Stuttgart).References
- A. M. Glazer, Acta Crystallogr., Sect. B: Struct. Crystallogr. Cryst. Chem., 1972, 28, 3384–3392 CrossRef CAS.
- P. M. Woodward, Acta Crystallogr., Sect. B: Struct. Sci., 1997, 53, 32–43 CrossRef.
- A. N. Vasil'ev and O. S. Volkova, Low Temp. Phys., 2007, 33, 895–914 CrossRef PubMed.
- A. P. Ramirez, G. Lawes, D. Li and M. A. Subramanian, Solid State Commun., 2004, 131, 251–255 CrossRef CAS PubMed.
- N. Büttgen, H.-A. K. von Nidda, W. Kraetschmer, A. Günther, S. Widmann, S. Riegg, A. Krimmel and A. Loidl, J. Low Temp. Phys., 2010, 161, 148–166 CrossRef PubMed.
- S. G. Ebbinghaus, S. Riegg, T. Götzfried and A. Reller, Eur. Phys. J. Spec. Top., 2010, 180, 91–116 CrossRef.
- M. A. Subramanian, D. Li, N. Duan, B. A. Reisner and A. W. Sleight, J. Solid State Chem., 2000, 151, 323–325 CrossRef CAS.
- M. A. Subramanian and A. W. Sleight, Solid State Sci., 2002, 4, 347–351 CrossRef CAS.
- J. Sebald, S. Krohns, P. Lunkenheimer, S. G. Ebbinghaus, S. Riegg, A. Reller and A. Loidl, Solid State Commun., 2010, 150, 857–860 CrossRef CAS PubMed.
- I. Tsukada, R. Kammuri, T. Kida, S. Yoshii, T. Takeuchi, M. Hagiwara, M. Iwakawa, W. Kobayashi and I. Terasaki, Phys. Rev. B: Condens. Matter, 2009, 79, 054430 CrossRef.
- S. Kondo, D. C. Johnston, C. A. Swenson, F. Borsa, A. V. Mahajan, L. L. Miller, T. Gu, A. I. Goldman, M. B. Maple, D. A. Gajewski, E. J. Freeman, N. R. Dilley, R. P. Dickey, J. Merrin, K. Kojima, G. M. Luke, Y. J. Uemura, O. Chmaissem and J. D. Jorgensen, Phys. Rev. Lett., 1997, 78, 3729 CrossRef CAS.
- A. Krimmel, A. Loidl, M. Klemm, S. Horn and H. Schober, Phys. Rev. Lett., 1999, 82, 2919 CrossRef CAS.
- W. Kobayashi, I. Terasaki, J. Takeya, I. Tsukada and Y. Ando, J. Phys. Soc. Jpn., 2004, 73, 2373 CrossRef CAS.
- A. Krimmel, A. Günther, W. Kraetschmer, H. Dekinger, N. Büttgen and A. Loidl, Phys. Rev. B: Condens. Matter, 2008, 78, 165126 CrossRef.
- S. Tanaka, N. Shimazui, H. Takatsu, S. Yonezawa and Y. Maeno, J. Phys. Soc. Jpn., 2009, 78, 024706 CrossRef.
- A. Krimmel, A. Günther, W. Kraetschmer, H. Dekinger, N. Büttgen, V. Eyert, A. Loidl, D. Sheptyakow, E.-W. Scheidt and W. Scherer, Phys. Rev. B: Condens. Matter, 2009, 80, 121101 CrossRef.
- B. Schmidt, H.-A. K. von Nidda, S. Riegg, S. G. Ebbinghaus, A. Reller and A. Loidl, Magn. Reson. Solids, 2014, 16, 14210 Search PubMed.
- S. Riegg, S. Widmann, A. Günther, S. Wehrmeister, S. Sterz, W. Kraetschmer, S. G. Ebbinghaus, A. Reller, N. Büttgen, H.-A. K. von Nidda and A. Loidl, Eur. Phys. J. Spec. Top., 2015 Search PubMed , accepted.
- S. G. Ebbinghaus, A. Weidenkaff and R. J. Cava, J. Solid State Chem., 2002, 167, 126–136 CrossRef CAS.
- J. Rodriguez-Carvajal, Physica B, 1993, 192, 55–69 CrossRef CAS.
- J. A. Bearden and A. F. Burr, Rev. Mod. Phys., 1967, 39, 125–142 CrossRef CAS.
- S. G. Ebbinghaus, Z. Hu and A. Reller, J. Solid State Chem., 2001, 156, 194–202 CrossRef CAS.
- R. D. Shannon, Acta Crystallogr., Sect. A: Cryst. Phys., Diffr., Theor. Gen. Cryst., 1976, 32, 751–767 CrossRef.
- J. Muller, A. Haouzi, C. Laviron, M. Labeau and J. C. Joubert, Mater. Res. Bull., 1986, 21, 1131–1136 CrossRef CAS.
- H. R. Oswald, S. Felder-Cassagrande and A. Reller, Solid State Ionics, 1993, 63–65, 565–569 CrossRef CAS.
- S. G. Ebbinghaus, Prog. Solid State Chem., 2007, 35, 421–431 CrossRef CAS PubMed.
- X-Ray Absorption, ed. D. C. Koningsberger and S. Prins, John Wiley and Sons, New York, 1988 Search PubMed.
- J.-H. Choy, J.-Y. Kim, S.-H. Hwang, S.-J. Kim and G. Demazeau, Int. J. Inorg. Mater., 2000, 2, 61–70 CrossRef CAS.
- C. L. Chen, S. M. Rao, K. J. Wang, F. C. Hsu, Y. C. Lee, C. L. Dong, T. S. Chan, J. F. Lee, M. C. Ling, H. L. Liu and M. K. Wu, New J. Phys., 2009, 11, 073024 CrossRef.
- E. E. Alp, G. K. Shenoy, D. G. Hinks, D. W. C. II, L. Soderholm, H. B. Schuttler, J. Guo, D. E. Ellis, P. A. Montano and M. Ramanathan, Phys. Rev. B: Condens. Matter, 1987, 35, 7199 CrossRef CAS.
- N. Kosugi, H. Kondoh, H. Tajima and H. Kuroda, Chem. Phys., 1989, 135, 149–160 CrossRef.
- S. K. Pandey, A. R. Chetal and P. R. Sarode, Physica B, 1991, 172, 324–328 CrossRef CAS.
- J.-H. Choy, D.-K. Kim, S.-H. Hwang and G. Demazeau, Phys. Rev. B: Condens. Matter, 1994, 50, 16631 CrossRef CAS.
- Z. Wu, M. Benfatto and C. R. Natoli, Phys. Rev. B: Condens. Matter, 1996, 54, 13409 CrossRef CAS.
- M. A. Pires, C. Israel, W. Iwamoto, R. R. Urbano, O. Agüero, I. Torriani, C. Rettori, P. G. Pagliuso, L. Walmsley, Z. Le, J. L. Cohn and S. B. Oseroff, Phys. Rev. B: Condens. Matter, 2006, 73, 224404 CrossRef.
- A. Dittl, S. Krohns, J. Sebald, F. Schrettle, M. Hemmida, H.-A. K. von Nidda, S. Riegg, A. Reller, S. G. Ebbinghaus and A. Loidl, Eur. Phys. J. B, 2011, 79, 391–400 CrossRef CAS.
- Y. Y. Hsu, B. N. Lin, J. F. Lee, L. Y. Jang and H. C. Ku, J. Low Temp. Phys., 2003, 131, 343–347 CrossRef CAS.
- X. Wang, J. A. Rodriguez, J. C. Hanson, D. Gamarra, A. Martinez-Arias and M. Fernandez-Garcia, J. Phys. Chem. B, 2005, 109, 19595–19603 CrossRef CAS PubMed.
- S. Bijani, M. Gabas, G. Subias, J. Garcia, L. Sanchez, J. Morales, L. Martinez and J.-R. Ramos-Barrado, J. Mater. Chem., 2011, 21, 5368–5377 RSC.
- S. Ebbinghaus, M. Fröba and A. Reller, J. Phys. Chem. B, 1997, 101, 9909–9915 CrossRef CAS.
- S. Ebbinghaus and A. Reller, Solid State Ionics, 1997, 101–103, 1369–1377 CrossRef CAS.
- S. Riegg, T. Müller and S. G. Ebbinghaus, Solid State Sci., 2013, 20, 97–102 CrossRef CAS PubMed.
- N. Hollmann, Z. Hu, A. Maignan, A. Günther, L.-Y. Jang, A. Tanaka, H.-J. Lin, C. T. Chen, P. Thalmeier and L. H. Tjeng, Phys. Rev. B: Condens. Matter, 2013, 87, 155122 CrossRef.
- M. Mizumaki, T. Mizokawa, A. Agui, S. Tanaka, H. Takatsu, S. Yonezawa and Y. Maeno, J. Phys. Soc. Jpn., 2013, 82, 024709 CrossRef.
Footnote |
| † Electronic supplementary information (ESI) available. See DOI: 10.1039/c4dt03876b |
| This journal is © The Royal Society of Chemistry 2015 |

