 Open Access Article
Creative Commons Attribution 3.0 Unported Licence
Synthesis, X-ray structure and in vitro cytotoxicity studies of Cu(I/II) complexes of thiosemicarbazone: special emphasis on their interactions with DNA†
Saswati
a,
Ayon
Chakraborty
b,
Subhashree P.
Dash
a,
Alok K.
Panda
b,
Rama
Acharyya
*a,
Ashis
Biswas
b,
Subhadip
Mukhopadhyay
c,
Sujit K.
Bhutia
c,
Aurélien
Crochet
d,
Yogesh P.
Patil
e,
M.
Nethaji
e and
Rupam
Dinda
*a
aDepartment of Chemistry, National Institute of Technology, Rourkela 769008, Odisha, India. E-mail: r_acharyya@yahoo.co.in; rupamdinda@nitrkl.ac.in; Fax: +(91) 661 246 2022, +(91) 661 246 2022; Tel: +(91) 661 246 3657, +(91) 661 246 2657
bSchool of Basic Sciences, Indian Institute of Technology Bhubaneswar, Bhubaneswar 751013, Odisha, India
cDepartment of Life Science, National Institute of Technology, Rourkela 769008, Odisha, India
dFribourg Center for Nanomaterials, Department of Chemistry, University of Fribourg, CH-1700 Fribourg, Switzerland
eDepartment of Inorganic and Physical Chemistry, Indian Institute of Science, Bangalore 560012, India
First published on 18th February 2015
Abstract
4-(p-X-phenyl)thiosemicarbazone of napthaldehyde {where X = Cl (HL1) and X = Br (HL2)}, thiosemicarbazone of quinoline-2-carbaldehyde (HL3) and 4-(p-fluorophenyl)thiosemicarbazone of salicylaldehyde (H2L4) and their copper(I) {[Cu(HL1)(PPh3)2Br]·CH3CN (1) and [Cu(HL2)(PPh3)2Cl]·DMSO (2)} and copper(II) {[(Cu2L32Cl)2(μ-Cl)2]·2H2O (3) and [Cu(L4)(Py)] (4)} complexes are reported herein. The synthesized ligands and their copper complexes were successfully characterized by elemental analysis, cyclic voltammetry, NMR, ESI-MS, IR and UV-Vis spectroscopy. Molecular structures of all the Cu(I) and Cu(II) complexes have been determined by X-ray crystallography. All the complexes (1–4) were tested for their ability to exhibit DNA-binding and -cleavage activity. The complexes effectively interact with CT-DNA possibly by groove binding mode, with binding constants ranging from 104 to 105 M−1. Among the complexes, 3 shows the highest chemical (60%) as well as photo-induced (80%) DNA cleavage activity against pUC19 DNA. Finally, the in vitro antiproliferative activity of all the complexes was assayed against the HeLa cell line. Some of the complexes have proved to be as active as the clinical referred drugs, and the greater potency of 3 may be correlated with its aqueous solubility and the presence of the quinonoidal group in the thiosemicarbazone ligand coordinated to the metal.
Introduction
Cisplatin (cis-diamminedichloroplatinum(II)) is a well-known metal based drug for cancer; despite its wide application as a chemotherapeutic agent, cisplatin exhibits severe side effects, such as nausea, kidney and liver failure, typical of heavy metal toxicity.1–5 Therefore attempts are constantly made to replace it with suitable alternatives; hence various transition metal complexes have been synthesized and tried for their anticancer properties.Metal complexes which efficiently bind and cleave DNA under physiological conditions are considered to have the potential to be used as therapeutic agents for medicinal applications and for genomic research.6–9 Depending on the exact nature of the metal and the ligand, the complexes can bind with nucleic acid covalently or non-covalently.10,11 Non-covalent interactions between transition-metal complexes and DNA can occur by intercalation, groove binding, or external electrostatic binding. Therefore, the study of the interaction of transition metal complexes with DNA is of great significance for the design of new drugs and their applications.
Among the transition metals, the coordination chemistry of copper has attracted increasing interest because of the use of many copper complexes as models for biological functions, for example, amine oxidases,12 catechol oxidase,13 nitrite reductase,14 superoxide dismutase,15 and tyrosinase.16 Copper complexes have been extensively utilized in metal ion mediated DNA cleavage through hydrogen ion abstraction by activated oxygen species.17 In recent years, a large number of biocompatible Cu(II) complexes have been investigated for their anticancer properties.18
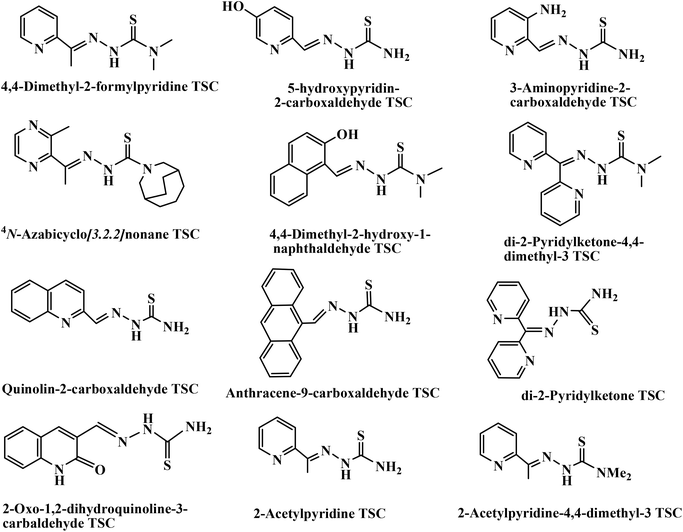
Additionally, thiosemicarbazones (TSCs) are a class of Schiff bases which are considered to be one of the most important scaffolds and are embedded in many biologically active compounds.19 Brockman et al. first reported that 2-formylpyridine TSC possesses antileukemic activity in mice.20 Following this report, various aliphatic, aromatic, and heteroaromatic carbaldehyde TSCs were synthesized and evaluated for their antitumor activity against a wide range of transplanted murine neoplasms.21–25 The list of TSC derivatives that have been found to exhibit intense anticancer activities is shown in Chart 1.18b,26 Again, transition metal complexes with TSCs as ligands have kindled interest amongst many researchers, and continue to be the subject of many studies, especially as anticancer chemotherapeutic agents27–29 and as DNA-binding and -cleaving agents.18b,30 TSC complexes have also demonstrated significant activity as antitumor, antiviral, antimicrobial, anti-amoebic and anti-inflammatory agents.31–33 Many Cu complexes of TSCs have demonstrated efficient antitumor potential.18b,c,26a,b,34–38 Although the chemistry of Cu(II) TSC complexes is well developed,30g,39–41 relatively less information is available for Cu(I) complexes,42–46 particularly about their pharmacological properties.
Again, while many TSC complexes exhibit good biological activities, their water solubility is still unsatisfactory, which may restrict their application. Hence, it seemed of interest to synthesize some new water-soluble transition metal complexes of TSCs which may have significant pharmacological effects.
Considering these facts and as a continuation of our ongoing research on the study of pharmacological properties47 of transition metal complexes, in this report, two new Cu(I) complexes {[Cu(HL1)(PPh3)2Br]·CH3CN (1) and [Cu(HL2)(PPh3)2Cl]·DMSO (2)}, a novel tetranuclear copper(II) complex [(Cu2L32Cl)2(μ-Cl)2]·2H2O (3) and a new Cu(II) monomeric complex [Cu(L4)(Py)] (4) were synthesized and fully characterized. The interactions of these complexes with calf-thymus DNA (CT-DNA) utilizing UV-Vis absorption titration, competitive DNA binding fluorescence experiments, circular dichroism and thermal denaturation studies were performed. Their chemical as well as photo-induced cleavage activities with pUC19 supercoiled plasmid DNA were investigated. Furthermore, the cytotoxicity of the complexes against the HeLa cell line was surveyed by the MTT assay.
Experimental
Materials and methods
All chemicals were purchased from commercial sources and were used without further purification. Reagent grade solvents were dried and distilled prior to use. The thiosemicarbazides were prepared from distilled substituted aniline by a known method reported earlier.48 The ligands 4-(p-X-phenyl)thiosemicarbazone of napthaldehyde {where X = Cl (HL1) and X = Br (HL2)}, thiosemicarbazone of quinoline-2-carbaldehyde (HL3) and 4-(p-fluorophenyl) thiosemicarbazone of salicylaldehyde (H2L4) were prepared by reported methods.47c,49 MTT (3-[4,5-dimethylthiazol-2-yl]-2,5-diphenyl tetrazolium) and DAPI (4′,6-diamidino-2-phenylindole dihydrochloride) were purchased from Sigma Aldrich (USA). Minimal essential medium (MEM) was purchased from Gibco, India. The supercoiled (SC) pUC19 DNA was purified from E. coli cells with the aid of a GeneJET Plasmid Isolation kit (Thermo Scientific, USA). Calf thymus (CT) DNA was purchased from SRL (India) (biochemistry grade). Elemental analyses were performed on a Vario ELcube CHNS elemental analyzer. IR spectra were recorded on a Perkin-Elmer Spectrum RXI spectrometer. 1H, 13C and 31P NMR spectra were recorded with a Bruker Ultrashield 400 MHz spectrometer using SiMe4 as an internal standard. Electronic spectra were recorded on a Perkin-Elmer Lambda25 spectrophotometer. Mass spectra were recorded on a SQ-300 MS instrument operating in ESI mode. Electrochemical data were collected using a PAR electrochemical analyzer and a PC-controlled potentiostat/galvanostat (PAR 273A) at 298 K under a dry nitrogen atmosphere. Cyclic voltammetry experiments were carried out with Pt working and auxiliary electrodes and Ag/AgCl as the reference electrode and TEAP as the supporting electrolyte. Commercially available TEAP (tetra ethyl ammonium perchlorate) was properly dried and used as a supporting electrolyte for recording cyclic voltammograms of the complexes.Synthesis of complexes {[Cu(HL1)(PPh3)2Br]·CH3CN (1) and [Cu(HL2)(PPh3)2Cl]·DMSO (2)}
Cu(I)X (X = Br/Cl) (1.0 mmol) was added to a solution of the ligand HL1–2 (1.0 mmol) in 20 mL of CH3CN, and the contents were refluxed for 1 h, followed by the addition of PPh3 (1.0 mmol) and continued refluxing for another 1 h. The resulting yellow solution was filtered, and slow evaporation of the filtrate over 4–5 days produced a yellow crystalline product. Crystals suitable for X-ray analysis were isolated for complex 1. X-ray quality crystals of complex 2 were obtained by recrystallizing in DMSO.![[double bond, length as m-dash]](https://www.rsc.org/images/entities/char_e001.gif) C), 1547 s ν(–C(8)
C), 1547 s ν(–C(8)![[double bond, length as m-dash]](https://www.rsc.org/images/entities/char_e001.gif) N(3)), 1096 s ν(P–CPh), 770 s ν(C(7)
N(3)), 1096 s ν(P–CPh), 770 s ν(C(7)![[double bond, length as m-dash]](https://www.rsc.org/images/entities/char_e001.gif) S). 1H NMR (DMSO-d6, 400 MHz) δ: 12.03 (s, 1H, –C(7)–N(1)H), 10.25 (s, 1H, –C(7)–N(2)H), 9.094 (s, 1H, –N(3)
S). 1H NMR (DMSO-d6, 400 MHz) δ: 12.03 (s, 1H, –C(7)–N(1)H), 10.25 (s, 1H, –C(7)–N(2)H), 9.094 (s, 1H, –N(3)![[double bond, length as m-dash]](https://www.rsc.org/images/entities/char_e001.gif) C(8)H), 8.42–7.27 (m, 26H, Ph + PPh3). 13C NMR (DMSO-d6, 100 MHz) δ: 175.39 (C(7), C–S), 138.6 (C(8), N
C(8)H), 8.42–7.27 (m, 26H, Ph + PPh3). 13C NMR (DMSO-d6, 100 MHz) δ: 175.39 (C(7), C–S), 138.6 (C(8), N![[double bond, length as m-dash]](https://www.rsc.org/images/entities/char_e001.gif) CH), 136.72, 136.32, 135.87, 135.23, 134.85, 134.43, 133.81, 133.12, 132.83, 132.25, 131.91, 131.33, 130.78, 130.26, 130.02, 129.83 (16C, C6H6), 128.96, 128.47, 127.80 (PPh3). 31P NMR (DMSO-d6, 162 MHz) δ: 46.26 and 44.79 (2 s, 2PPh3). ESI MS (CH3OH): m/z 1047.74 (100%, [M − H]+); m/z 1071.95 (30%, [M + Na]+); m/z 1087.69 (65%, [M + K]+).
CH), 136.72, 136.32, 135.87, 135.23, 134.85, 134.43, 133.81, 133.12, 132.83, 132.25, 131.91, 131.33, 130.78, 130.26, 130.02, 129.83 (16C, C6H6), 128.96, 128.47, 127.80 (PPh3). 31P NMR (DMSO-d6, 162 MHz) δ: 46.26 and 44.79 (2 s, 2PPh3). ESI MS (CH3OH): m/z 1047.74 (100%, [M − H]+); m/z 1071.95 (30%, [M + Na]+); m/z 1087.69 (65%, [M + K]+).
![[double bond, length as m-dash]](https://www.rsc.org/images/entities/char_e001.gif) C), 1551 s ν(–C(8)
C), 1551 s ν(–C(8)![[double bond, length as m-dash]](https://www.rsc.org/images/entities/char_e001.gif) N(3)), 1090 s ν(P–CPh), 768 s ν(C(7)
N(3)), 1090 s ν(P–CPh), 768 s ν(C(7)![[double bond, length as m-dash]](https://www.rsc.org/images/entities/char_e001.gif) S). 1H NMR (DMSO-d6, 400 MHz) δ: 12.47 (s, 1H, –C(7)–N(1)H), 10.29 (s, 1H, –C(7)–N(2)H), 9.09 (s, 1H, –N(3)
S). 1H NMR (DMSO-d6, 400 MHz) δ: 12.47 (s, 1H, –C(7)–N(1)H), 10.29 (s, 1H, –C(7)–N(2)H), 9.09 (s, 1H, –N(3)![[double bond, length as m-dash]](https://www.rsc.org/images/entities/char_e001.gif) C(8)H), 8.07–7.25 (m, 26H, Ph + PPh3), 2.53 (s, 6H, DMSO). 13C NMR (DMSO-d6, 100 MHz) δ:178.18 (C(7), C–S), 140.51 (C(8), N
C(8)H), 8.07–7.25 (m, 26H, Ph + PPh3), 2.53 (s, 6H, DMSO). 13C NMR (DMSO-d6, 100 MHz) δ:178.18 (C(7), C–S), 140.51 (C(8), N![[double bond, length as m-dash]](https://www.rsc.org/images/entities/char_e001.gif) CH), 137.82, 137.12, 136.87, 135.73, 134.95, 134.41, 133.85, 133.19, 132.79, 132.41, 131.86, 131.23, 130.96, 130.26, 130.12, 129.92 (16C, C6H6), 129.12, 128.87, 128.17 (PPh3). 31P NMR (DMSO-d6, 162 MHz) δ: 46.85 and 44.72 (2 s, 2PPh3). ESI MS (CH3OH): m/z 1086.70 (12%, [M + H]+); m/z 1051.92 (20%, [M − Cl]).
CH), 137.82, 137.12, 136.87, 135.73, 134.95, 134.41, 133.85, 133.19, 132.79, 132.41, 131.86, 131.23, 130.96, 130.26, 130.12, 129.92 (16C, C6H6), 129.12, 128.87, 128.17 (PPh3). 31P NMR (DMSO-d6, 162 MHz) δ: 46.85 and 44.72 (2 s, 2PPh3). ESI MS (CH3OH): m/z 1086.70 (12%, [M + H]+); m/z 1051.92 (20%, [M − Cl]).
Synthesis of the complex [(Cu2L32Cl)2(μ-Cl)2]·2H2O (3)
CuCl2·2H2O (1.0 mmol) was added to a solution of the ligand HL3 (1.0 mmol) in 20 mL of hot methanol and the mixture was refluxed for 2 h. The resulting dark green solution was filtered and slow evaporation of the filtrate over 4–5 days produced deep green crystals suitable for X-ray analysis.![[double bond, length as m-dash]](https://www.rsc.org/images/entities/char_e001.gif) C), 1557 s, ν(–C(2)
C), 1557 s, ν(–C(2)![[double bond, length as m-dash]](https://www.rsc.org/images/entities/char_e001.gif) N(3)), 752 s ν(C(1)–S). ESI MS (CH3OH): m/z 1318.80 (68%, [(M − 2H2O) + 5H]+); m/z 1352.55 (100% [(M + 3H]+).
N(3)), 752 s ν(C(1)–S). ESI MS (CH3OH): m/z 1318.80 (68%, [(M − 2H2O) + 5H]+); m/z 1352.55 (100% [(M + 3H]+).
Synthesis of the complex [Cu(L4)(Py)] (4)
CuCl2·2H2O (1.0 mmol) was added to a solution of H2L4 (1.0 mmol) in 20 ml of hot methanol followed by the addition of pyridine (1.0 mmol). The mixture was refluxed for 3 h and a clear bluish green solution was obtained, which was filtered, and slow evaporation of the filtrate over 3–4 days produced bluish green crystals suitable for X-ray analysis.![[double bond, length as m-dash]](https://www.rsc.org/images/entities/char_e001.gif) C), 1531 s ν(–C(8)
C), 1531 s ν(–C(8)![[double bond, length as m-dash]](https://www.rsc.org/images/entities/char_e001.gif) N(3)), 748 s ν(C(7)–S(1)). ESI MS (CH3OH): m/z 430.07 (100%, [M]+); m/z 431.72 (50%, [M + H]+); m/z 351.14 (46%, [M − Py]+).
N(3)), 748 s ν(C(7)–S(1)). ESI MS (CH3OH): m/z 430.07 (100%, [M]+); m/z 431.72 (50%, [M + H]+); m/z 351.14 (46%, [M − Py]+).
Crystallography
Single crystals of complexes were mounted on a Stoe IPDS 2 diffractometer equipped with an Oxford Cryosystem open flow cryostat (1 and 2) and on a Bruker Smart Apex CCD diffractometer (3 and 4) equipped with a graphite monochromator and a Mo Kα radiator (λ) 0.71073 Å. Crystallographic data and details of refinement of 1–4 are given in Table 1. The unit cell dimensions and intensity data were measured at 200(2) K for 1 and 2, 273(2) K for 3 and 296(2) for 4. Absorption correction was partially integrated into the data reduction procedure for crystals of 1 and 2.50 The intensity data were corrected for Lorentz, polarization and absorption effects. Absorption corrections were applied using SADABS51 and the structures were solved by direct methods using the program SHELXS-9752 and refined using least squares with the SHELXL-9752 software program. Hydrogens were either found or placed in calculated positions and isotropically refined using a riding model. The non-hydrogen atoms were refined anisotropically.| Compound | 1 | 2 | 3 | 4 |
|---|---|---|---|---|
| Formula | C56H47BrClCuN4P2S | C56H50BrClCuN3OP2S2 | C44H40Cl4Cu4N16S4O2 | C19H15CuFN4OS |
| M | 1048.88 | 1085.95 | 1349.12 | 429.95 |
| Crystal system | Triclinic | Triclinic | Triclinic | Monoclinic |
| Space group |
P![[1 with combining macron]](https://www.rsc.org/images/entities/char_0031_0304.gif) |
P![[1 with combining macron]](https://www.rsc.org/images/entities/char_0031_0304.gif) |
P![[1 with combining macron]](https://www.rsc.org/images/entities/char_0031_0304.gif) |
P21/c |
| a (Å) | 9.4984(4) | 9.6604(5) | 8.9472(15) | 13.3041(5) |
| b (Å) | 13.1221(5) | 13.1537(6) | 9.8129(16) | 5.8394(2) |
| c (Å) | 20.6583(9) | 20.3412(10) | 14.928(2) | 23.1869(9) |
| α (°) | 100.185(3) | 99.305(4) | 85.086(3) | 90 |
| β (°) | 95.359(3) | 94.696(4) | 72.973(3) | 102.115(2) |
| γ (°) | 96.502(3) | 93.570(4) | 80.782(3) | 90 |
| V (Å3) | 2500.96(18) | 2534.7(2) | 1236.0(4) | 1761.22(11) |
| Z | 2 | 2 | 1 | 4 |
| D calc (Mg cm−3) | 1.393 | 1.423 | 1.813 | 1.621 |
| F(000) | 1076 | 1116 | 680 | 876 |
| μ(Mo-Kα) (mm−1) | 1.436 | 1.460 | 2.142 | 1.386 |
| max./min. trans. | 0.9460 and 0.8576 | 0.8921 and 0.7026 | 0.9873 and 0.8343 | 0.9728 and 0.7787 |
| 2θ(max.) (°) | 25.00 | 25.00 | 21.99 | 30.5 |
| Reflections collected/unique | 48![[thin space (1/6-em)]](https://www.rsc.org/images/entities/char_2009.gif) 158/8790 [R(int) = 0.0383] 158/8790 [R(int) = 0.0383] |
48![[thin space (1/6-em)]](https://www.rsc.org/images/entities/char_2009.gif) 925/8938 [R(int) = 0.0576] 925/8938 [R(int) = 0.0576] |
8969/4328 [R(int) = 0.0406] | 33![[thin space (1/6-em)]](https://www.rsc.org/images/entities/char_2009.gif) 365/5407 [R(int) = 0.0410] 365/5407 [R(int) = 0.0410] |
| R 1[I > 2σ(I)] | R 1 = 0.0301, wR2 = 0.0788 | R 1 = 0.0477, wR2 = 0.1269 | R 1 = 0.0743, wR2 = 0.1738 | R 1 = 0.0345, wR2 = 0.0796 |
| wR2[all data] | R 1 = 0.0353, wR2 = 0.0814 | R 1 = 0.0754, wR2 = 0.1400 | R 1 = 0.1261, wR2 = 0.1963 | R 1 = 0.0581, wR2 = 0.0885 |
| S[goodness of fit] | 1.040 | 1.034 | 1.018 | 1.015 |
| min./max. res. (e Å−3) | 0.788 and −0.755 | 0.824 and −0.867 | 2.059 and −0.897 | 0.315 and −0.295 |
DNA binding experiments
 | (1) |
 | (2) |
| KEB × [EB] = Kapp × [complex]50 | (3) |
DNA cleavage experiments
DNA cleavage was carried out as previously reported.47e The chemical-induced and photo-induced DNA cleavage experiments were done with 300 ng supercoiled (SC) pUC19 DNA in 50 mM Tris–HCl buffer (pH 8.0) containing 1% DMF. | (4) |
The subscripts “s” and “c” refers to the sample and the control respectively.54 Appropriate DNA controls were taken to calculate the net DNA cleavage percent. The observed error in measuring the band intensities ranged between 3%–6%.
For mechanistic investigations of both hydrolytic and photolytic DNA cleavage, experiments were carried out with singlet oxygen quenchers such as sodium azide (NaN3) and L-histidine, while for hydroxyl radical scavengers, potassium iodide (KI) and D-mannitol were used. Each of the additives was used at a concentration of 0.5 mM.
Anticancer activity
Results and discussion
Synthesis
Reaction of Cu(I)X (X = Cl, Br) with 4-(p-X-phenyl) thiosemicarbazone of napthaldehyde {X = Cl (HL1); X = Br (HL2)} in the molar ratio of 1![[thin space (1/6-em)]](https://www.rsc.org/images/entities/char_2009.gif) :
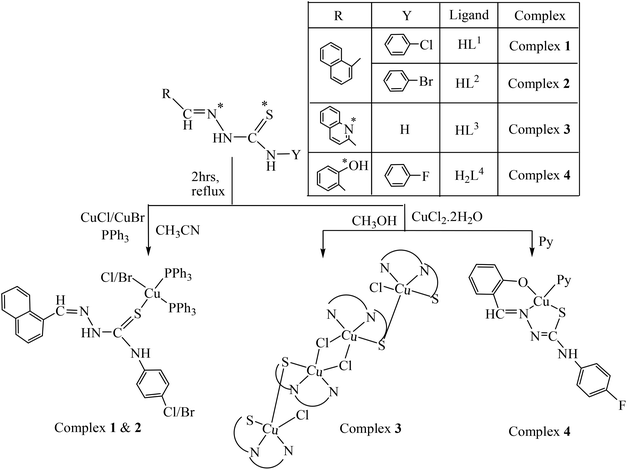
:![[thin space (1/6-em)]](https://www.rsc.org/images/entities/char_2009.gif) 1 in CH3CN formed an insoluble product of stoichiometry [CuX(HL1–2)], which after addition of two moles of PPh3 yielded light yellow colored monomeric complexes [CuX(HL1–2)(PPh3)2]·Solvent (X = Br, 1; Cl, 2). Reaction of copper(II) chloride with quinoline-2-carbaldehyde thiosemicarbazone (HL3) in a molar ratio of 1
1 in CH3CN formed an insoluble product of stoichiometry [CuX(HL1–2)], which after addition of two moles of PPh3 yielded light yellow colored monomeric complexes [CuX(HL1–2)(PPh3)2]·Solvent (X = Br, 1; Cl, 2). Reaction of copper(II) chloride with quinoline-2-carbaldehyde thiosemicarbazone (HL3) in a molar ratio of 1![[thin space (1/6-em)]](https://www.rsc.org/images/entities/char_2009.gif) :
:![[thin space (1/6-em)]](https://www.rsc.org/images/entities/char_2009.gif) 1 in CH3OH yielded a dark green colored tetrameric complex [(Cu2L32Cl)2(μ-Cl)2]·2H2O (3), whereas that with 4-(p-F-phenyl) thiosemicarbazone of salicylaldehyde (H2L4) in the presence of pyridine as a coligand yielded a dark green monomeric complex [Cu(L4)(Py)] (4). The electrospray mass spectra (ESI MS) and NMR spectra were consistent with the X-ray structures. The purity of these compounds was further confirmed by elemental analyses. The synthetic methods of all the complexes are illustrated in Scheme 1. All complexes were soluble in MeOH, MeCN, DMF and DMSO. Complex 3 was completely and the other three complexes (1, 38%; 2, 35%; and 4, 45%, H2O–DMSO solution) were partially soluble in H2O. All the complexes were stable in both solid and solution phases. The solution phase stability of the complexes was confirmed by electronic absorption, NMR and ESI-MS spectral studies. The representative spectra are given in ESI† Fig. S1, Fig. S2 and Fig. S3.
1 in CH3OH yielded a dark green colored tetrameric complex [(Cu2L32Cl)2(μ-Cl)2]·2H2O (3), whereas that with 4-(p-F-phenyl) thiosemicarbazone of salicylaldehyde (H2L4) in the presence of pyridine as a coligand yielded a dark green monomeric complex [Cu(L4)(Py)] (4). The electrospray mass spectra (ESI MS) and NMR spectra were consistent with the X-ray structures. The purity of these compounds was further confirmed by elemental analyses. The synthetic methods of all the complexes are illustrated in Scheme 1. All complexes were soluble in MeOH, MeCN, DMF and DMSO. Complex 3 was completely and the other three complexes (1, 38%; 2, 35%; and 4, 45%, H2O–DMSO solution) were partially soluble in H2O. All the complexes were stable in both solid and solution phases. The solution phase stability of the complexes was confirmed by electronic absorption, NMR and ESI-MS spectral studies. The representative spectra are given in ESI† Fig. S1, Fig. S2 and Fig. S3.
Structure
The observed elemental (C, H, N) analytical data of all the complexes (1–4) are in consistent with their composition. It appears from the formulation of 1 and 2 that the TSC is serving as a monodentate ligand, whereas in 3 and 4 it is serving as a tridentate ligand. In order to authenticate the coordination mode of the TSC in the complexes, the structures have been determined by X-ray crystallography.Description of X-ray structures of [Cu(HL1)(PPh3)2Br]·CH3CN (1) and [Cu(HL2)(PPh3)2Cl]·DMSO (2)
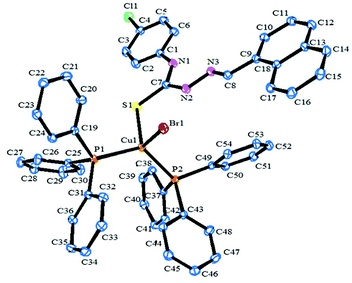
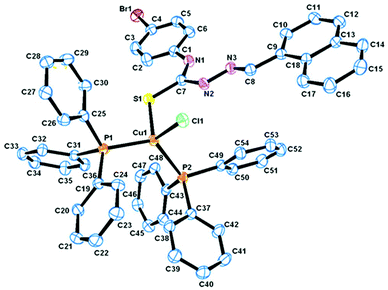
The molecular structure and the atom numbering scheme for the complexes [Cu(HL1)(PPh3)2Br]·CH3CN (1) and [Cu(HL2)(PPh3)2Cl]·DMSO (2) are shown in Fig. 1 and 2 respectively; the relevant bond distances and angles are collected in Table 2. Compounds 1 and 2 contain CH3CN and DMSO as a solvent of crystallization respectively. The coordination geometry around the Cu(I) atom in 1 and 2 reveals a distorted tetrahedral environment with an SXP2 [X = Br (1) and Cl (2)] coordination sphere as the bond angles around the copper atom vary from ca. 100 to 124° in 1 and 2, with P–Cu–P being the largest angle.49,57 The ligand HL1–2 acts as a monodentate ligand coordinating through the S atom. The other positions of the tetrahedron are occupied by one halogen atom and two triphenylphosphine ligands. In the compound, the Cu–S bond lengths are 2.401(7) Å for 1 and 2.387(1) Å for 2, while the Cu–halogen bond distances lie in the range 2.374(1)–2.517(4) Å as is usually found for tetrahedrally coordinated copper(I) and S atom donors.44,49 The Cu–P distances [2.276(6), 2.290(7) Å for 1, 2.274(1), 2.295(1) Å for 2] are comparable to those found in similar complexes.44,49| Complex (1) | Complex (2) | |
|---|---|---|
| Bond distance | ||
| Cu(1)–S(1) | 2.401(7) | 2.387(1) |
| Cu(1)–P(1) | 2.277(6) | 2.274(1) |
| Cu(1)–P(2) | 2.290(7) | 2.295(1) |
| Br(1)–Cu(1) | 2.517(4) | — |
| Cl(1)–Cu(1) | — | 2.374(1) |
| Bond angles | ||
| P(2)–Cu(1)–P(1) | 124.51(2) | 122.72(4) |
| P(2)–Cu(1)–S(1) | 109.26(2) | 107.07(4) |
| P(1)–Cu(1)–S(1) | 104.48(2) | 105.19(4) |
| P(2)–Cu(1)–Br(1) | 108.41 (2) | — |
| P(2)–Cu(1)–Cl(1) | — | 108.07(4) |
| P(1)–Cu(1)–Br(1) | 100.29(2) | — |
| P(1)–Cu(1)–Cl(1) | — | 104.81(4) |
| S(1)–Cu(1)–Br(1) | 108.97(2) | — |
| Cl(1)–Cu(1)–S(1) | — | 108.35(4) |
Description of X-ray structure of [(Cu2L32Cl)2(μ-Cl)2]·2H2O (3)
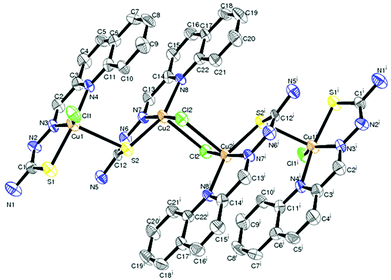
The structure of the tetranuclear Cu(II) complex [(Cu2L32 Cl)2(μ-Cl)2]·2H2O is illustrated in Fig. 3 and selected bond parameters are collected in Table 3. Compound 3 contains two H2O molecules as a solvent of crystallization. The structure contains four units composed of two identical Cu(1)LCl outer units and two identical Cu(2)LCl inner units. In other words, the tetranuclear Cu(II) species is formed by the dimerisation of two binuclear Cu2L2Cl2 units bridged by two reciprocal coordinated chlorine atoms of individual Cu2L2Cl2 units. Each copper atom in the outer unit is coordinated by a quinoline nitrogen, azomethine nitrogen and thiolate sulfur of the thiosemicarbazone moiety and a chlorine group. The Cu–Nquinoline bonds are ∼0.131 Å farther away than Cu–Nimine bonds, indicating the strength of the azomethine nitrogen coordination. The length of the other metal coordinated bonds (Cu–S and Cu–Cl) is usual like similar systems reported earlier.58,59 The bond angles are also in conformity with a distorted square pyramidal structure around the copper centers. Each copper atom in the inner subunit is pentacoordinate with the bonds Cu(2)–S(2), Cu(2)–Cl(2), Cu(2)–N(8), Cu(2)–N(7) and Cu(2)–Cl(2)# adapting a distorted square pyramidal geometry with bridging Cl(2)# of the other inner moiety at the apical site. The quinoline nitrogen N(8), the imino nitrogen N(7), and the thiolate sulfur S(2) atom, together with Cl(2), constitute the basal plane. The bond lengths in the basal plane agree with those found in copper(II) complexes containing thiosemicarbazones which act as uninegative tridentate ligands.58,59 The bond lengths and bond angles reveal a distorted square pyramidal geometry around Cu(2).| Complex (3) | Complex (4) | |
|---|---|---|
| Bond distance | ||
| Cu(1)–Cl(1) | 2.253(3) | — |
| Cu(1)–O(1) | — | 1.906 (2) |
| Cu(1)–S(1) | 2.304(3) | 2.247(6) |
| Cu(1)–S(2) | 2.715(2) | — |
| Cu(1)–N(3) | 1.975(7) | 1.932(1) |
| Cu(1)–N(4) | 2.107(7) | 2.013(1) |
| Cu(2)–Cl(2) | 2.290(2) | — |
| Cu(2)–S(2) | 2.303(2) | — |
| Cu(2)–N(7) | 1.973(6) | — |
| Cu(2)–N(8) | 2.146(6) | — |
| Cu(2)–Cl(2)1 | 2.691(2) | — |
| Bond angles | ||
| Cl(1)–Cu(1)–S(1) | 92.60(1) | — |
| O(1)–Cu(1)–N(3) | — | 94.04(7) |
| Cl(1)–Cu(1)–S(2) | 101.30(1) | — |
| O(1)–Cu(1)–N(4) | — | 86.40(7) |
| Cl(1)–Cu(1)–N(3) | 150.60(2) | — |
| O(1)–Cu(1)–S(1) | — | 177.41(5) |
| Cl(1)–Cu(1)–N(4) | 104.10(2) | — |
| S(1)–Cu(1)–S(2) | 94.15(8) | — |
| S(1)–Cu(1)–N(3) | 82.30(2) | 85.92(5) |
| S(1)–Cu(1)–N(4) | 161.90(2) | 93.72(5) |
| S(2)–Cu(1)–N(3) | 107.90(2) | — |
| S(2)–Cu(1)–N(4) | 89.40(2) | — |
| N(3)–Cu(1)–N(4) | 79.70(3) | 178.10(7) |
| Cl(2)–Cu(2)–S(2) | 89.88(8) | — |
| Cl(2)–Cu(2)–N(7) | 171.20(2) | — |
| Cl(2)–Cu(2)–N(8) | 108.60(2) | — |
| Cl(2)–Cu(2)–Cl(2)1 | 87.25(7) | — |
| S(2)–Cu(2)–N(7) | 81.60(2) | — |
| S(2)–Cu(2)–N(8) | 155.20(2) | — |
| Cl(2)1–Cu(2)–S(2) | 102.01(9) | — |
| N(7)–Cu(2)–N(8) | 79.20(3) | — |
| Cl(2)1–Cu(2)–N(7) | 96.30(2) | — |
| Cl(2)1–Cu(2)–N(8) | 95.50(2) | — |
| Cu(2)–Cl(2)–Cu(2)1 | 92.80(9) | — |
Description of X-ray structure of [Cu(L4)(Py)] (4)
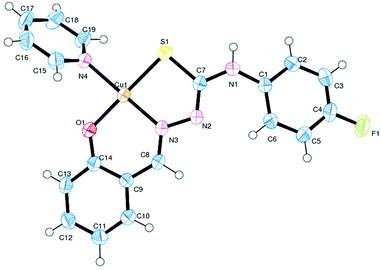
The atom numbering scheme for complex 4 is given in Fig. 4 with the relevant bond distances and angles collected in Table 3. The structure shows that the thiosemicarbazone ligand (L2−) is coordinated to copper in the expected tridentate fashion (Scheme 1), forming a six- and a five-membered chelate ring with O(1)–Cu(1)–N(3) and S(1)–Cu(1)–N(3) bite angles of 94.04(7)° and 85.92(5)° respectively. The coligand pyridine is coordinated to the metal center and is trans to the nitrogen atom N(3). The rather large Cu(1)–N(4) distance of 2.013(1) Å revealed that the pyridine moiety is weakly coordinated to the Cu-center.60 Copper is thus nested in a NOSN core, which is slightly distorted from an ideal square-planar geometry, as reflected in the bond parameters around the metal center. The Cu–N(3), Cu–O(1), Cu–N(4) (coligand) and Cu–S(1) distances are normal, as observed in other structurally characterized complexes of Cu containing these bonds.60,61Spectral characteristics
The IR spectra of 1 and 2 showed the presence of ν(N–H) bands in the ranges 3284–3285 cm−1 for –N(1)–H and 3047–3049 cm−1 for –N(2)–H stretching, which suggests that the thiosemicarbazone ligand is coordinated to the Cu(I) centre in the neutral form. In all the complexes (1–4), ν(C![[double bond, length as m-dash]](https://www.rsc.org/images/entities/char_e001.gif) N) and ν(C
N) and ν(C![[double bond, length as m-dash]](https://www.rsc.org/images/entities/char_e001.gif) C) vibrational modes appeared in the range 1635–1531 cm−1, while the thioamide bands ν(C–S (1 and 2) and C
C) vibrational modes appeared in the range 1635–1531 cm−1, while the thioamide bands ν(C–S (1 and 2) and C![[double bond, length as m-dash]](https://www.rsc.org/images/entities/char_e001.gif) S (3 and 4)) appeared in the range 770–748 cm−1 (compared to free ligands, 854–785 cm−1).47c The characteristic ν(P–CPh) bands at 1096–1090 cm−1 indicate the presence of Ph3P in 1 and 2.
S (3 and 4)) appeared in the range 770–748 cm−1 (compared to free ligands, 854–785 cm−1).47c The characteristic ν(P–CPh) bands at 1096–1090 cm−1 indicate the presence of Ph3P in 1 and 2.
The electronic spectra of all the complexes (Table 4) were recorded in methanol solutions. In the spectra of 1–4 three strong absorptions are observed in the wavelength range 448–220 nm. The lower energy absorptions at around 448–349 nm are ascribable to metal to ligand (1 and 2) and ligand to metal (3 and 4) charge transfer transitions whereas the higher energy absorptions are likely to be due to ligand centered transitions.46,47c Weak absorptions in the range 676–668 nm are also observed for 3 and 4 (Cu(II) complexes), which are assigned to d–d transitions.62
| Complex | λ max/nm (ε/dm3 mol−1 cm−1) |
|---|---|
| [Cu(HL1)(PPh3)2Br]·CH3CN (1) | 239 (51![[thin space (1/6-em)]](https://www.rsc.org/images/entities/char_2009.gif) 814), 349 (26 814), 349 (26![[thin space (1/6-em)]](https://www.rsc.org/images/entities/char_2009.gif) 982) 982) |
| [Cu(HL2)(PPh3)2Cl]·DMSO (2) | 227 (45![[thin space (1/6-em)]](https://www.rsc.org/images/entities/char_2009.gif) 121), 385 (27 121), 385 (27![[thin space (1/6-em)]](https://www.rsc.org/images/entities/char_2009.gif) 637) 637) |
| [(Cu2L32Cl)2(μ-Cl)2]·2H2O (3) | 230 (29![[thin space (1/6-em)]](https://www.rsc.org/images/entities/char_2009.gif) 790), 306 (23 790), 306 (23![[thin space (1/6-em)]](https://www.rsc.org/images/entities/char_2009.gif) 258), 364 (12 258), 364 (12![[thin space (1/6-em)]](https://www.rsc.org/images/entities/char_2009.gif) 917), 448 (11 917), 448 (11![[thin space (1/6-em)]](https://www.rsc.org/images/entities/char_2009.gif) 768), 676 (17 768), 676 (17![[thin space (1/6-em)]](https://www.rsc.org/images/entities/char_2009.gif) 788) 788) |
| [Cu(L4)(Py)] (4) | 220 (5132), 256 (8526), 332 (3310), 395 (2574), 668 (4353) |
The NMR spectra (1H, 13C and 31P) of 1 and 2 were recorded using DMSO-d6. The 1H NMR spectrum exhibits three singlets in the range 12.47–9.09 ppm due to NH (–C(7)–N(1)H), NH (–C(7)–N(2)H) and CH (–N(3)![[double bond, length as m-dash]](https://www.rsc.org/images/entities/char_e001.gif) C(8)H) groups respectively. Signals for aromatic protons found as multiplets in the 8.42–7.25 ppm range.47c The 13C NMR spectra of complexes (1 and 2) showed a sharp singlet appearing at 178.18–175.39 ppm due to C–S carbon. The peak for the azomethine (–CH
C(8)H) groups respectively. Signals for aromatic protons found as multiplets in the 8.42–7.25 ppm range.47c The 13C NMR spectra of complexes (1 and 2) showed a sharp singlet appearing at 178.18–175.39 ppm due to C–S carbon. The peak for the azomethine (–CH![[double bond, length as m-dash]](https://www.rsc.org/images/entities/char_e001.gif) N) carbon exhibited a peak in the region 140.51–138.6 ppm. The peaks observed in the 137.82–129.83 ppm region have been assigned to aromatic carbons. The PPh3 peaks are assigned in the range 129.12–127.80 ppm.6331P NMR spectra were recorded in order to confirm the presence of a triphenyl phosphine group. The two signals appeared at 46.85–44.72 ppm and indicated that the two triphenyl phosphine ligands were cis to each other in these complexes.63 The detailed NMR data have been included in the Experimental section.
N) carbon exhibited a peak in the region 140.51–138.6 ppm. The peaks observed in the 137.82–129.83 ppm region have been assigned to aromatic carbons. The PPh3 peaks are assigned in the range 129.12–127.80 ppm.6331P NMR spectra were recorded in order to confirm the presence of a triphenyl phosphine group. The two signals appeared at 46.85–44.72 ppm and indicated that the two triphenyl phosphine ligands were cis to each other in these complexes.63 The detailed NMR data have been included in the Experimental section.
ESI mass spectra of 1–4 have been recorded in a methanol solution. Mass spectral analysis for 1 and 2 shows peaks at m/z 1047.34 [(M + H)+] and 1086.70 [(M + H)+] respectively, whereas 3 shows the molecular ion peak [(M + 3H)+] at m/z 1352.55. The ESI-MS peak for 4 shows the characteristic molecular ion peak (M+) at m/z 430.07. ESI† Fig. S4 shows a representative ESI mass spectrum of 4.
Electrochemical properties
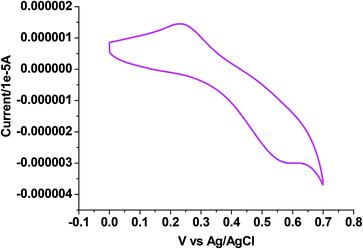
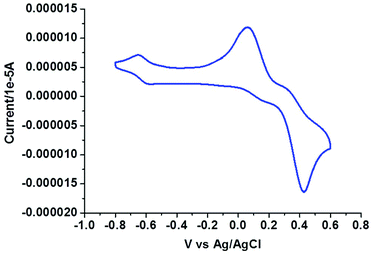
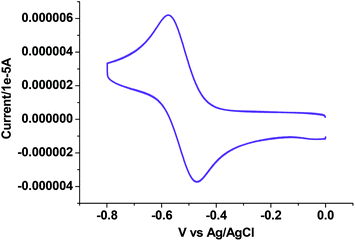
The electrochemical properties of 1–4 were examined in CH3CN solution (0.1 M TEAP) by cyclic voltammetry using a platinum working electrode, a platinum auxiliary electrode and an Ag/AgCl reference electrode. The potential data are listed in Table 5. Fig. 5–7 show the representative voltammograms of 1 {Cu(I)}, 3 {Cu(II)} and 4 {Cu(II)} respectively. The voltammograms of all four complexes include both oxidation and reduction processes. The voltammogram pattern is similar for 1 and 2, which includes a quasireversible (Fig. 5) process at E1/2 values in the range 0.37–0.40 V, corresponding to the Cu(I)/Cu(II) redox couple,46 whereas in the cathodic region (ESI† Fig. S5), Cu(I) is reduced to Cu(0) showing an irreversible single electron wave at Epc values within the potential window −0.70 to −0.72 V.64| Complex | Cu(I)/Cu(II) Ea1/2(ΔEaP) | Cu(I)/Cu(0) Epc | Potentials (V) versus Ag/AgCl | ||
|---|---|---|---|---|---|
| Ligand-centered oxidation Ea1/2(ΔEaP) | Ligand-centered reduction Epc | Cu(II)/Cu(I) Ec/a1/2(ΔEc/aP) | |||
| a In CH3CN at a scan rate of 100 mV s−1. E1/2 = (Epa + Epc)/2, where Epa and Epc are anodic and cathodic peak potentials vs. Ag/AgCl, respectively. ΔEP = Epa − Epc. | |||||
| [Cu(HL1)(PPh3)2Br]·CH3CN (1) | 0.40 (320) | −0.72 | 0.89 (240) | −1.41, −1.63 | — |
| [Cu(HL2)(PPh3)2Cl]·DMSO (2) | 0.37 (326) | −0.70 | 0.87 (156) | −1.45, −1.65 | — |
| [(Cu2L32Cl)2(μ-Cl)2]·2H2O (3) | — | — | 0.88 (190) | −1.39, −1.63 | −0.62 (50), 0.10 (77), 0.36 (113), |
| [Cu(L4)(Py)] (4) | — | — | 0.91 (264) | −1.37, −1.61 | −0.52 (100) |
In the voltammogram of tetrameric Cu(II) complex (3), there are three quasireversible/reversible (Fig. 6) processes at Ec/a1/2 values of −0.62, 0.10 and 0.36 V corresponding to Cu(II)/Cu(I) redox couples65 of four different Cu(II) centers, whereas for the monomeric Cu(II) complex (4) a quasireversible (Fig. 7) process for the above couple appears at an Ec1/2 value of −0.52 V.
For all four complexes (1–4) an oxidation peak (ESI† Fig. S6) in the range 0.87–0.91 V![[thin space (1/6-em)]](https://www.rsc.org/images/entities/char_2009.gif) 66 and two reduction peaks (ESI† Fig. S5) in the range −1.37 to −1.45 and −1.61 to −1.65 V
66 and two reduction peaks (ESI† Fig. S5) in the range −1.37 to −1.45 and −1.61 to −1.65 V![[thin space (1/6-em)]](https://www.rsc.org/images/entities/char_2009.gif) 31,47c belong to ligand centered processes respectively. A representative oxidative voltammogram of a free ligand HL3 is given in ESI† Fig. S7.
31,47c belong to ligand centered processes respectively. A representative oxidative voltammogram of a free ligand HL3 is given in ESI† Fig. S7.
DNA binding studies
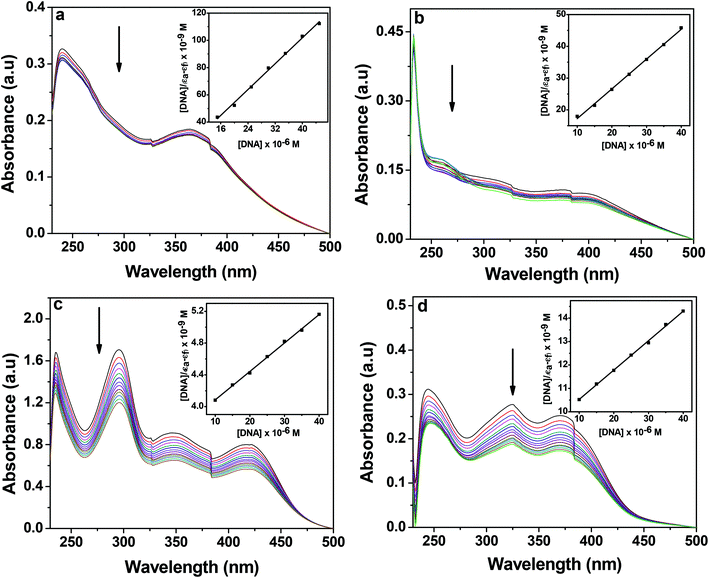 | ||
| Fig. 8 Electronic absorption spectra of 1 (a), 2 (b), 3 (c) and 4 (d) (25 μM each) upon the titration of CT-DNA (0–70 μM) in 10 mM Tris–HCl buffer (pH 8.0) containing 1% DMF. The arrow shows the changes in absorbance with respect to an increase in the CT-DNA concentration. The inset shows the linear fit of [DNA]/(εa − εf) vs. [DNA] and the binding constant (Kb) was calculated using eqn (1). | ||
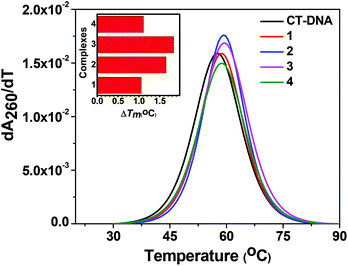
| Complex | Binding constant (Kb)a (M−1) | ΔTm![[thin space (1/6-em)]](https://www.rsc.org/images/entities/char_2009.gif) b (°C) b (°C) |
Stern–Volmer quenching constant (KSV)c (M−1) |
K
app![[thin space (1/6-em)]](https://www.rsc.org/images/entities/char_2009.gif) d (M−1) d (M−1) |
|---|---|---|---|---|
| a DNA binding constant by the UV-vis spectral method. b Change in the melting temperature of CT-DNA. c Stern–Volmer quenching constant for the CT-DNA–EB complex. d The apparent DNA binding constant. | ||||
| 1 | 3.40 × 10⁵ | +1.05 | 3.06 × 10³ | 6.87 × 10⁵ |
| 2 | 1.20 × 10⁵ | +1.65 | 2.22 × 10³ | 6.70 × 10⁵ |
| 3 | 9.60 × 10⁵ | +1.83 | 5.36 × 10⁴ | 7.34 × 10⁵ |
| 4 | 1.30 × 10⁴ | +1.11 | 1.32 × 10³ | 5.79 × 10⁵ |
In order to quantify the binding affinity of the interaction between CT-DNA and each of 1–4, the binding constant (Kb) was calculated using eqn (1) (Experimental section). The binding constant (Kb) of the complexes was in the range of 1.30 × 10⁴ to 9.60 × 10⁵ M−1. Copper(I) complexes 1 and 2 exhibited higher binding affinity than copper(II) complexes 3 and 4. The binding propensities of ligands to CT-DNA were also estimated. All the ligands showed lower DNA binding affinity than their respective complexes, yielding Kb values of the order of 103 M−1 (ESI† Fig. S8 and Table S1).
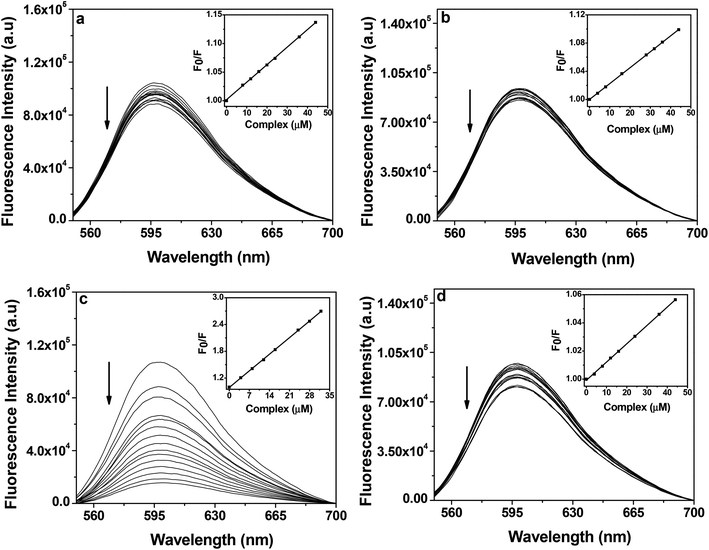 | ||
| Fig. 9 Fluorescence emission spectra of ethidium bromide (2 μM) bound to CT-DNA (50 μM) in the presence of complex 1 (a), 2 (b), 3 (c) and 4 (d) (0–60 μM) in 10 mM Tris–HCl buffer (pH 8.0) containing 1% DMF. The arrow indicates the effect of increasing the concentration of the complex on the fluorescence emission of ethidium bromide bound CT-DNA. The inset shows the linear fit of F0/F vs. [complex] and the Stern–Volmer quenching constant (KSV) was calculated using eqn (2). | ||
The Kapp of the complexes were of the order of ∼102 lower than the classical intercalator EB (i.e. 1.00 × 10⁷ M−1), which suggests that the interactions between the complexes and CT-DNA were possibly groove binding in nature. The trend in Kapp values are in line with the trend in the Kb values which were obtained from the UV-Vis absorption spectral studies (Table 6). Control competitive DNA binding experiments with ligands showed that ligands have lower KSV and Kapp values than their corresponding complexes (ESI† Fig. S9 and Table S1).
DNA cleavage studies
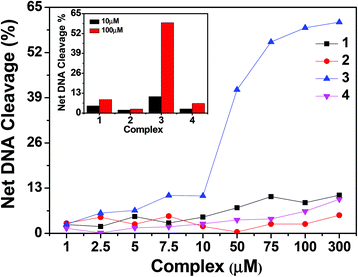 | ||
| Fig. 13 Concentration dependent chemical nuclease activity by 1–4; 300 ng of SC pUC19 DNA at different concentrations of the complexes [1–300 μM in 50 mM Tris–HCl buffer (pH 8.0) containing 1% DMF] was treated with hydrogen peroxide (0.5 mM) in the dark for 1 h at 37 °C. The net DNA cleavage percent was calculated using eqn (4). The inset shows a bar diagram representation of the net DNA cleavage of different complexes at 10 and 100 μM. | ||
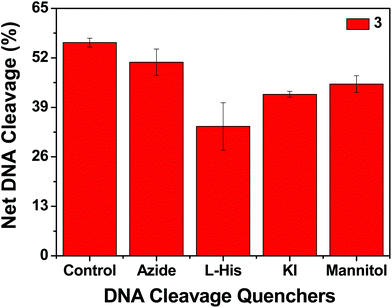
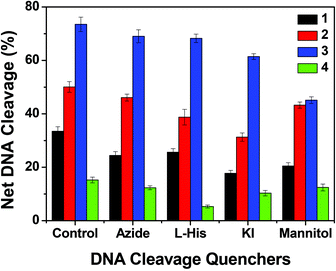
In order to elucidate the probable mechanistic aspects of the chemical-induced DNA cleavage activity by these complexes various inhibitors were used. The chemical-induced DNA cleavage reactions may involve reactive oxygen species (ROS) such as singlet oxygen (1O2) and hydroxyl radicals (˙OH). Therefore, NaN3 and L-histidine were used as singlet oxygen quenchers, while KI and D-mannitol were employed as hydroxyl radical quenchers. Complexes 1, 2 and 4 did not show any appreciable inhibition in the chemical-induced DNA cleavage activity in the presence of the various additives, which may be due to the diminished chemical nuclease activity of these complexes (ESI† Fig. S11). On the other hand, addition of singlet oxygen quenchers like NaN3 and L-histidine inhibited the DNA cleavage activity of complex 3 by ∼6% and ∼22% respectively. Similarly, in the presence of the hydroxyl radical scavengers KI and D-mannitol, the chemical nuclease activity of complex 3 was reduced by ∼14% and ∼11% respectively (Fig. 14). These results suggest that among all the copper complexes, 3 exhibits chemical-induced DNA cleavage activity probably via both singlet oxygen and hydroxyl radical pathways.
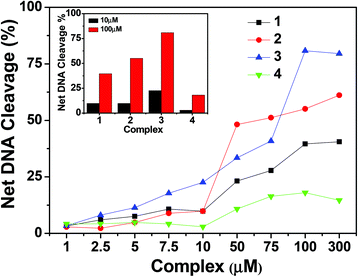 | ||
| Fig. 16 Concentration dependent DNA cleavage by 1–4; 300 ng of SC pUC19 DNA at different concentrations of the complexes [1–300 μM in 50 mM Tris–HCl buffer (pH 8.0) containing 1% DMF] was photo-irradiated with UVA at 350 nm for 1 h. The net DNA cleavage percent was calculated using eqn (4). The inset shows a bar diagram representation of the net DNA cleavage of different complexes at 10 and 100 μM. | ||
To understand the mechanistic aspects of the photonuclease activity of these complexes, we used the same additives as those used in exploring the mechanism of chemical nuclease activity. The DNA cleavage reaction involving molecular oxygen can proceed by two mechanistic pathways, namely, by a type-II process involving singlet oxygen species (1O2) or by a photo-redox pathway involving reactive hydroxyl radicals (˙OH).72 In the case of copper(I) complexes, the singlet oxygen quenchers, such as NaN3 and L-histidine, showed a reduced photonuclease activity of complex 1 by ∼9% and ∼8% and of complex 2 by ∼4% and ∼12% respectively. Similarly the hydroxyl radical scavengers, KI and D-mannitol, exhibited a significant inhibition of photo-induced DNA cleavage activity of complex 1 by ∼26% and ∼13% and of complex 2 by ∼19% and ∼7% respectively (Fig. 17 and ESI† Fig. S13), while in the case of copper(II) complexes, the presence of singlet oxygen quenchers, NaN3 and L-histidine, decreased the photonuclease activity of complex 3 by ∼4% and ∼5% and complex 4 by ∼3% and ∼10% respectively. Similarly, KI and D-mannitol (hydroxyl radical quenchers) showed an inhibition of DNA cleavage activity by ∼12% and ∼28% for complex 3 and ∼5% and ∼3% for complex 4 (Fig. 17 and ESI† Fig. S12). These results suggest that 1 and 2 exhibit photo-induced DNA cleavage activity possibly via both singlet oxygen and hydroxyl radical pathways while the mechanistic pathway for 3 and 4 cannot be stated with a degree of certainty. Of the two pathways, the hydroxyl radical dominates over the singlet oxygen pathway as the hydroxyl radical scavengers showed higher inhibitory effect than the singlet oxygen quenchers.
Anticancer activity
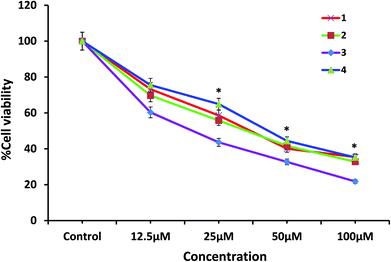
Comparing the activity of four complexes, the cytotoxic activity follows the order 3 > 2 > 1 > 4, which is reflected by the IC50 values with the dose dependence illustrated in Table 7 and Fig. 18. It is remarkable that 3, having a quinonoidal group in the thiosemicarbazone ligand coordinated to the metal, is most active. This is in correlation with the fact that the derivatives of quinoline are found to show good biological activities such as antioxidation, antiproliferation, and anti-inflammation.74,75
| Compounds | IC50 (μM) |
|---|---|
| 1 | 33.5 ± 4.67 |
| 2 | 31.5 ± 5.72 |
| 3 | 19.8 ± 3.54 |
| 4 | 36 ± 6.74 |
A possible single shot drug for cancer cure has been elusive so far, due to their multiple occurrences in more than a hundred forms, and several cases of recurrence of cancer post chemotherapy and surgery are well known. Interestingly, equating the efficacy of our synthesized novel copper compounds against the presently available common chemodrugs sold to patients, we found that Cisplatin, Gefitinib, Gemcitabine, 5-Florouracil, and Vinorelbine had an IC50 of 13 μM, 20 μM, 35 μM, 40 μM and 48 μM respectively on HeLa cells under conditions similar to our experiment.76 These findings give a positive revelation about the potential of our copper compounds as future neoplastic precursor drug candidates.
Conclusion
The following are the salient observations and findings of this work:(a) Two Cu(I) complexes 1 [Cu(HL1)(PPh3)2Br]·CH3CN and 2 [Cu(HL2)(PPh3)2Cl]·DMSO and two Cu(II) complexes 3 [(Cu2L32Cl)2(μ-Cl)2]·2H2O and 4 [Cu(L4)(Py)] of thiosemicarbazone ligands were synthesized and characterized by structural, analytical, and spectral methods.
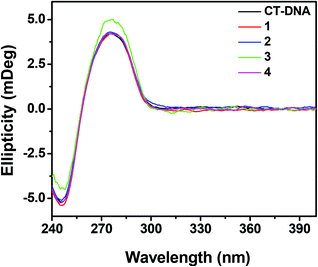
(b) The copper complexes 1–4 showed good DNA binding propensity. Their DNA binding activities were determined using UV-Vis absorption titration, competitive DNA binding fluorescence experiments, thermal denaturation studies and circular dichroism spectroscopy. The experimental results show that the complexes interact with CT-DNA probably by groove binding mode, with binding constants ranging from 104 to 105 M−1. The competitive DNA binding fluorescence experiments suggest that among all the complexes, 3 showed the highest quenching constant (KSV) and Kapp values.
(c) Among all the complexes, 3 displayed a significant chemical nuclease activity in the presence of hydrogen peroxide of ∼60%. All the complexes showed good photo-induced cleavage of pUC19 supercoiled plasmid DNA with complex 3 showing the highest photo-induced DNA cleavage activity of ∼80%.
(d) The results from the mechanistic study suggested that the chemical nuclease activity of complex 3 and the photonuclease activity of complexes 1–2 proceed probably by both singlet oxygen and hydroxyl radical pathways.
(e) In addition, the in vitro antiproliferative activity of complexes 1–4 against the HeLa cell line was assayed. The cytotoxicity of the complexes is affected by various functional groups attached to the thiosemicarbazone derivative whereby 3 was particularly potent against the cells tested.
(f) The results on pharmacological activity of the copper complexes reported in this paper reveal that compound 3 shows the highest activity, which may be due to its solubility in aqueous medium and the presence of a quinonoidal group in the thiosemicarbazone ligand coordinated to the metal.
(g) The results obtained from the present copper complexes are of importance for the development of metal-based agents for anti-cancer applications. Further work is in progress to better identify the mechanism of action and to prepare more potent related compounds for the treatment of cancer.
Acknowledgements
The authors thank the reviewers for their comments and suggestions, which were helpful in preparing the revised version of the manuscript. Funding for this research was provided by the Department of Science and Technology, Govt. of India [grant no. SR/FT/CS-016/2008 (R.D.) and grant no. SR/FT/CS-010/2009 (R.A.)] and the Council of Scientific and Industrial Research, India [grant 37(1535)/12/EMR-II) (A.B.)]. R.D. thanks Prof. S.K. Chattopadhyay, Indian Institute of Engineering Science and Technology, Shibpur, for electrochemical studies and fruitful discussions. S.B. gratefully acknowledges the Council of Scientific and Industrial Research, New Delhi, India, for the award of a senior research fellowship [grant 9/983(0012)2k13-EMR-I]. A.K.P. acknowledges the ICMR, India (grant 45/25/2012-Bio/BMS) for providing a fellowship.Notes and references
- T. Boulikas and M. Vougiouka, Oncol. Rep., 2003, 10, 1663 CAS.
- E. Wong and C. M. Giandomenico, Chem. Rev., 1999, 99, 2451 CrossRef CAS PubMed.
- M. Galanski, V. B. Arion, M. A. Jakupec and B. K. Keppler, Curr. Pharm. Des., 2003, 9, 2078 CrossRef CAS.
- D. Wang and S. J. Lippard, Nat. Rev. Drug Discovery, 2005, 4, 307 CrossRef CAS PubMed.
- A. M. Angeles-Boza, P. M. Bradley, P. K. L. Fu, S. E. Wicke, J. Bacsa, K. M. Dunbar and C. Turro, Inorg. Chem., 2004, 43, 8510 CrossRef CAS PubMed.
- B. Rosenberg, L. VamCamp, J. E. Trosko and V. H. Mansour, Nature, 1969, 222, 385 CrossRef CAS.
- Z. Wu, Q. Liu, X. Liang, X. Yang, N. Wang, X. Wang, H. Sun, Y. Lu and Z. Guo, J. Biol. Inorg. Chem., 2009, 14, 1313 CrossRef CAS PubMed.
- D. S. Raja, N. S. P. Bhuvanesh and K. Natarajan, Dalton Trans., 2012, 41, 4365 RSC.
- P. J. Bednarski, F. S. Mackay and P. J. Sadler, Anti-Cancer Agents Med. Chem., 2007, 7, 75 CrossRef CAS.
- S. Sharma, S. K. Singh, M. Chandra and D. S. Pandey, J. Inorg. Biochem., 2005, 99, 458 CrossRef CAS PubMed.
- C. Metcalfe and J. A. Thomas, Chem. Soc. Rev., 2003, 32, 215 RSC.
- C. M. Chang, V. J. Klema, B. J. Johnson, M. Mure, J. P. Klinman and C. M. Wilmot, Biochemistry, 2010, 49, 2540 CrossRef CAS PubMed.
- E. I. Solomon, P. Chen, M. Metz, S.-K. Lee and A. E. Palmer, Angew. Chem., Int. Ed., 2001, 40, 4570 CrossRef CAS.
- P. Wojciech and M. D. J. D. Nicholas, BBA-Protein Struct. Mol. Enzymol., 1985, 828, 130 CrossRef.
- J. A. Tainer, E. D. Getzoff, J. S. Richardson and D. C. Richardson, Nature, 1983, 306, 284 CrossRef CAS.
- Y. Matoba, T. Kumagai, A. Yamamoto, H. Yoshitsu and M. Sugiyama, J. Biol. Chem., 2006, 281, 8981 CrossRef CAS PubMed.
- J. K. Barton, in Bioinorganic Chemistry, ed. I. Bertini, H. B. Grey, S. J. Lippard and J. S. Valentine, University Science Book, Mill Valley, 1994, p. 455 Search PubMed.
- (a) C. Santini, M. Pellei, V. Gandin, M. Porchia, F. Tisato and C. Marzano, Chem. Rev., 2014, 114, 815 CrossRef CAS PubMed; (b) A. N. Kate, A. A. Kumbhar, A. A. Khan, P. V. Joshi and V. G. Puranik, Bioconjugate Chem., 2014, 25, 102 CrossRef CAS PubMed; (c) D. S. Raja, N. S. P. Bhuvanesh and K. Natarajan, Inorg. Chem., 2011, 50, 12852 CrossRef CAS PubMed; (d) M. A. Cater, H. B. Pearson, K. Wolyniec, P. Klaver, M. Bilandzic, B. M. Paterson, A. I. Bush, P. O. Humbert, S. L. Fontaine, P. S. Donnelly and Y. Haupt, ACS Chem. Biol., 2013, 8, 1621 CrossRef CAS PubMed.
- (a) J. Easmon, G. Purstinger, G. Heinisch, T. Roth, H. H. Fiebig, W. Holzer, W. Jager, M. Jenny and J. Hofmann, J. Med. Chem., 2001, 44, 2164 CrossRef CAS PubMed; (b) P. Jutten, W. Schumann, A. Hartl, H. M. Dahse and U. Grafe, J. Med. Chem., 2007, 50, 3661 CrossRef PubMed; (c) D. C. Greenbaum, Z. Mackey, E. Hansell, P. Doyle, J. Gut, C. R. Caffrey, J. Lehrman, P. J. Rosenthal, J. H. McKerrow and K. Chibale, J. Med. Chem., 2004, 47, 3212 CrossRef CAS PubMed.
- R. W. Brockman, J. R. Thomson, M. J. Bell and H. E. Skipper, Cancer Res., 1956, 16, 167 CAS.
- M. B. Ferrari, F. Bisceglie, C. Casoli, S. Durot, I. M. Badarau, G. Pelosi, E. Pilotti, S. Pinelli and P. Tarasconi, J. Med. Chem., 2005, 48, 1671 CrossRef PubMed.
- D. R. Richardson, P. C. Sharpe, D. B. Lovejoy, D. Senaratne, D. S. Kalinowski, M. Islam and P. V. Bernhardt, J. Med. Chem., 2006, 49, 6510 CrossRef CAS PubMed.
- J. A. Ludwig, G. Szakacs, S. E. Martin, B. F. Chu, C. Cardarelli, Z. E. Sauna, N. J. Caplen, H. M. Fales, S. V. Ambudkar, J. N. Weinstein and M. M. Gottesman, Cancer Res., 2006, 66, 4808 CrossRef CAS PubMed.
- D. S. Kalinowski, Y. Yu, P. C. Sharpe, M. Islam, Y. T. Liao, D. B. Lovejoy, N. Kumar, P. V. Bernhardt and D. R. Richardson, J. Med. Chem., 2007, 50, 3716 CrossRef CAS PubMed.
- J. Chen, Y. W. Huang, G. Liu, Z. Afrasiabi, E. Sinn, S. Padhye and Y. Ma, Toxicol. Appl. Pharmacol., 2004, 197, 40 CrossRef CAS PubMed.
- (a) D. S. Raja, G. Paramaguru, N. S. P. Bhuvanesh, J. H. Reibenspies, R. Renganathan and K. Natarajan, Dalton Trans., 2011, 40, 4548 RSC; (b) P. J. Jansson, P. C. Sharpe, P. V. Bernhardt and D. R. Richardson, J. Med. Chem., 2010, 53, 5759 CrossRef CAS PubMed; (c) S. Adsule, V. Barve, D. Chen, F. Ahmed, Q. P. Dou, S. Padhye and F. H. Sarkar, J. Med. Chem., 2006, 49, 7242 CrossRef CAS PubMed; (d) H. Huang, Q. Chen, X. Ku, L. Meng, L. Lin, X. Wang, C. Zhu, Y. Wang, Z. Chen, M. Li, H. Jiang, K. Chen, J. Ding and H. Liu, J. Med. Chem., 2010, 53, 3048 CrossRef CAS PubMed.
- D. X. West, I. H. Hall, K. G. Rajendran and A. E. Liberta, Anti-Cancer Drugs, 1993, 4, 231 CrossRef PubMed.
- A. I. Matesanz, C. Joie and P. Souza, Dalton Trans., 2010, 39, 7059 RSC.
- (a) S. Padhye, Z. Afrasiabi, E. Sinn, J. Fok, K. Mehta and N. Rath, Inorg. Chem., 2005, 44, 1154 CrossRef CAS PubMed; (b) Z. Afrasiabi, E. Sinn, W. Lin, Y. Ma, C. Campana and S. Padhye, J. Inorg. Biochem., 2005, 99, 1526 CrossRef CAS PubMed.
- (a) P. Kalaivani, R. Prabhakaran, P. Poornima, F. Dallemer, K. Vijayalakshmi, V. V. Padma and K. Natarajan, Organometallics, 2012, 31, 8323 CrossRef CAS; (b) L. Otero, M. Vieites, L. Boiani, A. Denicola, C. Rigol, L. Opazo, C. Olea-Azar, J. D. Maya, A. Morello, R. L. K. Siegel, O. E. Piro, E. Castellano, M. González, D. Gambino and H. Cerecetto, J. Med. Chem., 2006, 49, 3322 CrossRef CAS PubMed; (c) M. Baldini, M. B. Ferrari, F. Bisceglie, P. P. Dall'Aglio, G. Pelosi, S. Pinelli and P. Tarasconi, Inorg. Chem., 2004, 43, 7170 CrossRef CAS PubMed; (d) M. Baldini, M. B. Ferrari, F. Bisceglie, G. Pelosi, S. Pinelli and P. Tarasconi, Inorg. Chem., 2003, 42, 2049 CrossRef CAS PubMed; (e) P. Kalaivani, R. Prabhakaran, E. Ramachandran, F. Dallemer, G. Paramaguru, R. Renganathan, P. Poornima, V. V. Padma and K. Natarajan, Dalton Trans., 2012, 41, 2486 RSC; (f) K. Sampath, S. Sathiyaraj and C. Jayabalakrishnan, Med. Chem. Res., 2014, 23, 958 CrossRef CAS; (g) J. G. D. Silva, A. A. R. Despaigne, S. R. W. Louro, C. C. Bandeira, E. M. Souza-Fagundes and H. Beraldo, Eur. J. Med. Chem., 2013, 65, 415 CrossRef PubMed; (h) E. Ramachandran, S. P. Thomas, P. Poornima, P. Kalaivani, R. Prabhakaran, V. V. Padma and K. Natarajan, Eur. J. Med. Chem., 2012, 50, 405 CrossRef CAS PubMed; (i) J. Lu, H. Guo, X. Zeng, Y. Zhang, P. Zhao, J. Jiang and L. Zang, J. Inorg. Biochem., 2012, 112, 39 CrossRef CAS PubMed.
- Z. Afrasiabi, E. Sinn, S. Padhye, S. Dutta, S. Padhye, C. Newton, C. E. Anson and A. K. Powell, J. Inorg. Biochem., 2003, 95, 306 CrossRef CAS.
- E. M. Jouad, G. Larcher, M. Allain, A. Riou, G. M. Bouet, M. A. Khan and X. D. Thanh, J. Inorg. Biochem., 2001, 86, 565 CrossRef CAS.
- S. Sharma, F. Athar, M. R. Maurya, F. Naqvi and A. Azam, Eur. J. Med. Chem., 2005, 40, 557 CrossRef CAS PubMed.
- T. Wang and Z. Guo, Curr. Med. Chem., 2006, 13, 525 CrossRef CAS.
- A. Gaál, G. Orgován, Z. Polgári, A. Réti, V. G. Mihucz, S. Bősze, N. Szoboszlai and C. Streli, J. Inorg. Biochem., 2014, 130, 52 CrossRef PubMed.
- T. Rosu, E. Pahontu, S. Pasculescu, R. Georgescu, N. Stanica, A. Curaj, A. Popescu and M. Leabu, Eur. J. Med. Chem., 2010, 45, 1627 CrossRef CAS PubMed.
- D. Palanimuthu, S. V. Shinde, K. Somasundaram and A. G. Samuelson, J. Med. Chem., 2013, 56, 722 CrossRef CAS PubMed.
- D. S. Raja, N. S. P. Bhuvanesh and K. Natarajan, Eur. J. Med. Chem., 2011, 46, 4584 CrossRef CAS PubMed.
- F. Bisceglie, M. Baldini, M. B. Ferrari, E. Buluggiu, M. Careri, G. Pelosi, S. Pinelli and P. Tarasconi, Eur. J. Med. Chem., 2007, 42, 627 CrossRef CAS PubMed.
- Z. C. Liu, B. D. Wang, Z. Y. Yang, Y. Li, D. D. Qin and T. R. Li, Eur. J. Med. Chem., 2009, 44, 4477 CrossRef CAS PubMed.
- Z. Afrasiabi, E. Sinn, P. P. Kulkarni, V. Ambike, S. Padhye, D. Deobagakar, M. Heron, C. Gabbutt, C. E. Anson and A. K. Powell, Inorg. Chim. Acta, 2005, 358, 2023 CrossRef CAS PubMed.
- A. R. Cowley, J. R. Dilworth, P. S. Donnelly and J. M. White, Inorg. Chem., 2006, 45, 496 CrossRef CAS PubMed.
- M. C. Rodriguez-Arguelles, L.-S. Ee, J. Sanmartin, P. Pelagatti and F. Zami, J. Inorg. Biochem., 2005, 99, 2231 CrossRef PubMed.
- L. J. Ashfield, A. R. Cowley, J. R. Dilworth and P. S. Donnelly, Inorg. Chem., 2004, 43, 4121 CrossRef CAS PubMed.
- T. S. Lobana, S. Khanna, R. J. Butcher, A. D. Hunter and M. Zeller, Polyhedron, 2006, 25, 2755 CrossRef CAS PubMed.
- P. M. Krishna and K. H. Reddy, Inorg. Chim. Acta, 2009, 362, 4185 CrossRef CAS PubMed.
- (a) S. P. Dash, S. Pasayat, Saswati, H. R. Dash, S. Das, R. J. Butcher and R. Dinda, Polyhedron, 2012, 31, 524 CrossRef CAS PubMed; (b) S. Pasayat, S. P. Dash, Saswati, P. K. Majhi, Y. P. Patil, M. Nethaji, H. R. Dash, S. Das and R. Dinda, Polyhedron, 2012, 38, 198 CrossRef CAS PubMed; (c) Saswati, R. Dinda, C. S. Schmiesing, E. Sinn, Y. P. Patil, M. Nethaji, H. Stoeckli-Evans and R. Acharyya, Polyhedron, 2013, 50, 354 CrossRef CAS PubMed; (d) S. P. Dash, S. Pasayat, S. Bhakat, S. Roy, R. Dinda, E. R. T. Tiekink, S. Mukhopadhyay, S. K. Bhutia, M. R. Hardikar, B. N. Joshi, Y. P. Patil and M. Nethaji, Inorg. Chem., 2013, 52, 14096 CrossRef CAS PubMed; (e) S. P. Dash, A. K. Panda, S. Pasayat, R. Dinda, A. Biswas, E. R. T. Tiekink, Y. P. Patil, M. Nethaji, W. Kaminsky, S. Mukhopadhyay and S. K. Bhutia, Dalton Trans., 2014, 43, 10139 RSC.
- Part 1: S. Ghosh and S. Purohit, Indian J. Chem., Sect. A: Inorg., Bio-inorg., Phys., Theor. Anal. Chem., 1987, 26A, 131 CAS.
- T. S. Lobana, Rekha, R. J. Butcher, A. Castineiras, E. Bermejo and P. V. Bharatam, Inorg. Chem., 2006, 45, 1535 CrossRef CAS PubMed.
- E. Blanc, D. Schwarzenbach and H. D. Flack, J. Appl. Crystallogr., 1991, 24, 1035 CrossRef CAS.
- Bruker, SADABS, SAINT, SHELXTL and SMART, Bruker AXS Inc., Madison, Wisconsin, SA, 2003 Search PubMed.
- G. M. Sheldrick, Acta Crystallogr., Sect. A: Found. Crystallogr., 2008, 64, 112 CrossRef CAS PubMed.
- P. Krishnamoorthy, P. Sathyadevi, A. H. Cowley, R. R. Butorac and N. Dharmaraj, Eur. J. Med. Chem., 2011, 46, 3376 CrossRef CAS PubMed.
- W. M. Dai, K. W. Lai, A. Wu, W. Hamaguchi, M. Y. Lee, L. Zhou, A. Ishii and S. Nishimoto, J. Med. Chem., 2002, 45, 758 CrossRef CAS PubMed.
- S. Mukhopadhyay, P. K. Panda, B. Behera, C. K. Das, M. K. Hassan, D. N. Das, N. Sinha, A. Bissoyi, K. Pramanik, T. K. Maiti and S. K. Bhutia, Food Chem. Toxicol., 2014, 64, 369 CrossRef CAS PubMed.
- S. Mukhopadhyay, P. K. Panda, D. N. Das, N. Sinha, B. Behera, T. K. Maiti and S. K. Bhutia, Acta Pharmacol. Sin., 2014, 35, 814 CrossRef CAS PubMed.
- T. S. Lobana, P. K. Bhatia and E. R. T. Tiekink, J. Chem. Soc., Dalton Trans., 1989, 749 RSC.
- V. Philip, V. Suni, M. R. P. Kurup and M. Nethaji, Polyhedron, 2006, 25, 1931 CrossRef CAS PubMed.
- A. Sreekanth and M. R. P. Kurup, Polyhedron, 2003, 22, 3321 CrossRef CAS PubMed.
- T. S. Lobana, P. Kumari, G. Hundal and R. J. Butcher, Polyhedron, 2010, 29, 1130 CrossRef CAS PubMed.
- S. Datta, D. K. Seth, R. J. Butcher and S. Bhattacharya, Inorg. Chim. Acta, 2011, 377, 120 CrossRef CAS PubMed.
- V. M. Leovac, G. A. Bogdanović, S. Jovanović, L. Joksović, V. Marković, M. D. Joksović, S. M. Denčić, A. Isaković, I. Marković, F. W. Heinemann, S. Trifunović and I. Đalović, J. Inorg. Biochem., 2011, 105, 1413 CrossRef CAS PubMed.
- M. Nirmala, R. Manikandan, G. Prakash and P. Viswanathamurthi, Appl. Organomet. Chem., 2014, 28, 18 CrossRef CAS.
- P. Chakraborty, J. Adhikary, B. Ghosh, R. Sanyal, S. K. Chattopadhyay, A. Bauzá, A. Frontera, E. Zangrando and D. Das, Inorg. Chem., 2014, 53, 8257 CrossRef CAS PubMed.
- (a) C. R. Kowol, P. Heffeter, W. Miklos, L. Gille, R. Trondl, L. Cappellacci, W. Berger and B. K. Keppler, J. Biol. Inorg. Chem., 2012, 17, 409 CrossRef CAS PubMed; (b) Y. H. Zhou, J. Tao, D. L. Sun, L. Q. Chen, W. G. Jia and Y. Cheng, Polyhedron, 2015, 85, 849–856 CrossRef CAS PubMed; (c) S. Naskar, S. Naskar, H. M. Figge, W. S. Sheldrick, M. Corbella, J. Tercero and S. K. Chattopadhyay, Polyhedron, 2012, 35, 77–86 CrossRef CAS PubMed.
- (a) D. Mishra, S. Naskar, M. G. B. Drew and S. K. Chattopadhyay, Inorg. Chim. Acta, 2006, 359, 585 CrossRef CAS PubMed; (b) P. Paul, D. K. Seth, M. G. Richmond and S. Bhattacharya, RSC Adv., 2014, 4, 1432 RSC.
- P. Kumar, S. Gorai, M. K. Santra, B. Mondal and D. Manna, Dalton Trans., 2012, 41, 7573 RSC.
- A. K. Patra, T. Bhowmick, S. Ramakumar, M. Nethaji and A. R. Chakravarty, Dalton Trans., 2008, 6966 RSC.
- Y. An, S. D. Liu, S. Y. Deng, L. N. Ji and Z. W. Mao, J. Inorg. Biochem., 2006, 100, 1586 CrossRef CAS PubMed.
- S. Banerjee, A. Hussain, P. Prasad, I. Khan, B. Banik, P. Kondaiah and A. R. Chakravarty, Eur. J. Inorg. Chem., 2012, 3899 CrossRef CAS.
- L. Li, Q. Guo, J. Dong, T. Xu and J. Li, J. Photochem. Photobiol., B, 2013, 125, 56 CrossRef CAS PubMed.
- P. K. Sasmal, S. Saha, R. Majumdar, S. De, R. R. Dighe and A. R. Chakravarty, Dalton Trans., 2010, 39, 2147 RSC.
- P. G. Avaji, C. H. V. Kumar, S. A. Patil, K. N. Shivananda and C. Nagaraju, Eur. J. Med. Chem., 2009, 44, 3552 CrossRef CAS PubMed.
- I. R. Canelón and P. J. Sadler, Inorg. Chem., 2013, 52, 12276 CrossRef PubMed.
- J. S. Casas, M. S. G. Tasende and J. Sordo, Coord. Chem. Rev., 2000, 209, 197 CrossRef CAS.
- M. Ahmed and K. Jamil, Biol. Med., 2011, 3, 60 CAS.
Footnote |
| † Electronic supplementary information (ESI) available: Table S1 and Fig. S1–S13. CCDC 1002348–1002351 for 1–4. For ESI and crystallographic data in CIF or other electronic format see DOI: 10.1039/c4dt03764b |
| This journal is © The Royal Society of Chemistry 2015 |

