DOI:
10.1039/C4DT03307H
(Paper)
Dalton Trans., 2015,
44, 10621-10627
Antisite-disorder, magnetic and thermoelectric properties of Mo-rich Sr2Fe1−yMo1+yO6 (0 ≤ y ≤ 0.2) double perovskites
Received
27th October 2014
, Accepted 5th December 2014
First published on 5th December 2014
Abstract
Structure analysis using X-ray and neutron powder diffraction and elemental mapping has been used to demonstrate that nominal A-site deficient Sr2−xFeMoO6−δ (0 ≤ x ≤ 0.5) compositions form as Mo-rich Sr2Fe1−yMo1+yO6 (0 ≤ y ≤ 0.2) perovskites at high temperatures and under reducing atmospheres. These materials show a gradual transition from the Fe and Mo rock salt ordered double perovskite structure to a B-site disordered arrangement. Analysis of the fractions of B–O–B’ linkages revealed a gradual increase in the number of Mo–O–Mo linkages at the expense of the ferrimagnetic (FIM) Fe–O–Mo linkages that dominate the y = 0 material. All samples contain about 10–15% antiferromagnetic (AF) Fe–O–Fe linkages, independent of the degree of B-site ordering. The magnetic susceptibility of the y = 0.2 sample is characteristic of a small domain ferrimagnet (Tc ∼ 250 K), while room temperature neutron powder diffraction demonstrated the presence of G-type AF ordering linked to the Fe–O–Fe linkages (mFe = 1.25(7)μB). The high temperature thermoelectric properties are characteristic of a metal with a linear temperature dependence of the Seebeck coefficient, S (for all y) and electrical resistivity ρ (y ≥ 0.1). The largest thermoelectric power factor S2/ρ = 0.12 mW m−1 K−1 is observed for Sr2FeMoO6 at 1000 K.
Introduction
Thermoelectric modules are widely considered as an important component for a sustainable energy future.1,2 Traditionally these devices use p- and n-type semiconductors such as Bi2Te3, PbTe and Si1−xGex to convert heat into electricity. The efficiency of a thermoelectric material is given by its figure of merit: ZT = (S2/ρκ)T, where S is the Seebeck coefficient, ρ is the electrical resistivity, κ (κel + κlat) is the thermal conductivity (sum of the electronic and lattice thermal conductivities) and T is the absolute temperature. For good thermoelectric performance, materials with a large power factors (S2/ρ) and low κ are needed. Transition metal oxides have only relatively recently been appreciated as promising thermoelectric materials. Their advantageous properties include high-temperature stability, non-toxicity, in many cases low cost, and compatibility with CMOS fabrication techniques.3,4 The main disadvantage is that most oxides have poor power factors. This perception changed after the discovery of high S2/ρ in metallic p-type NaxCoO2.5 Thereafter, several other oxide based materials have been explored such as ZnO,6,7 SrTiO3,8,9 (misfit) cobaltates,10–13 and CaMnO3.14,15 Despite this considerable research effort, the performance of most of the oxides investigated remains poor compared to the traditional semiconductor materials, and the search for novel efficient oxide materials is ongoing.
The double perovskite Sr2FeMoO6 (A2BB'O6) has been extensively investigated due to its large low field magnetoresistances and spin-polarised conduction.16 The polarised conduction arises from a double exchange type mechanism where itinerant down-spin Mo5+ (t2g1; S = 1/2) electrons align non-conducting up-spin Fe3+ (t2g3eg2; S = 5/2) electrons, resulting in a FIM spin structure with a magnetisation of 2(5/2 − 1/2) = 4μB per formula unit.16,17 From a chemical perspective, Sr2FeMoO6 can be considered to be in a Fe2+ + Mo6+ ↔ Fe3+ + Mo5+ mixed valence state. The spin-polarisation and magnetoresistance are highly sensitive to Fe and Mo cation inversion,18–21 which introduces AF Fe–O–Fe and non-magnetic Mo–O–Mo linkages.17 Recently, Sr2FeMoO6 has also attracted some interest for use as a fuel cell cathode.22 In terms of thermoelectric performance, Sr2FeMoO6 is characterised by a low S = −50 μV K−1 at 1073 K. However, this can be increased by partial replacement of Sr by Ba (S1073 K = −125 μV K−1), leading to S2/ρ values of 0.08 mW m−1 K−2 (ref. 23). Measurements of the thermal conductivity showed a 1/T dependence characteristic of a crystalline solid but with a very low κ = 0.2 W m−1 K−1 at 1073 K, which resulted in ZT = 0.3 at 1073 K. This compares to κ = 6 W m−1 K−1 at high temperatures for SrTiO3 with only Ti4+ as a B-site cation.24 A note of caution is that the thermal conductivity measurements may have been affected by sample porosity, which is known to lead to significant underestimates of κ. Indeed, follow up studies on the Sr2−xCaxFeMoO6 and hole doped Sr2−xKxFeMoO6 series (sample density 90–95%) gave high-temperature thermal conductivities between 2–4 W m−1 K−1.25,26 Nevertheless, it is interesting to explore the thermoelectric properties of Sr2FeMoO6 based systems further. Recent work from our group and others on A-site deficient SrTiO3 led to the observation of two main effects: glass-like thermal conductivities (linear in T) for large concentrations of vacancies (27%) but also improved electrical conductivities for samples with a relatively low concentration of vacancies (7%).24,27–29 For these reasons, we undertook an investigation of nominally A-site deficient Sr2−xFeMoO6−δ compositions (0 ≤ x ≤ 0.5), where some oxygen deficiency is required to maintain electrically conducting samples (e.g. for x = 0.5 Fe3+ and Mo6+ are expected for δ = 0). Our structure analysis demonstrates that the nominal A-site deficiency does not carry over into the final product of the reactions and instead a series of Mo-rich Sr2Fe1−yMo1+yO6 double perovskites form.
Experimental
Polycrystalline Sr2−xFeMoO6 (x = 0, 0.15, 0.25, 0.35 and 0.5) samples were prepared using standard solid-state chemistry reactions. Stoichiometric amounts of SrCO3, Fe2O3 and MoO3 were mixed using a mortar and pestle, pressed into pellets and heated at 1350 °C in 5% H2 in N2 for 12 h. The samples were then ground, re-pressed and sintered at 1400 °C in the same atmosphere for 4 h. The heating and cooling rates were kept at 10 K min−1. After the final reaction step, Fe flakes were observed on the surface of the pellets for the samples with x > 0.15. These were scraped off and the pellets were lightly sanded. Laboratory X-ray powder diffraction (XRD) data were collected on a Bruker D8 Advance diffractometer with Cu Kα1 radiation. Room temperature time-of-flight neutron powder diffraction (NPD) data were collected on a 2 gram sample of the x = 0.5 composition on the GEM medium resolution diffractometer at the ISIS pulsed spallation neutron source, Rutherford Appleton Laboratory, UK. A multi-histogram (GEM detector banks 3–6) Rietveld fit to the NPD data was done using the GSAS and EXPGUI suite of programmes.30,31 The microstructure was analysed using a Quanta 650 FEG ESEM equipped with an Oxford Instruments X-max 150N detector for elemental mapping. The working distance, beam spot size and collecting time were 10 mm, 4.5 mm and 120 sec respectively. The temperature dependence of the electrical resistivity and Seebeck coefficient were measured using Linseis LSR-3 instrument. The DC magnetic susceptibility (H = 10 kOe) was measured using a Quantum Design MPMS vibrating sample magnetometer in the 2 ≤ T ≤ 400 K interval.
Results
Composition and structure
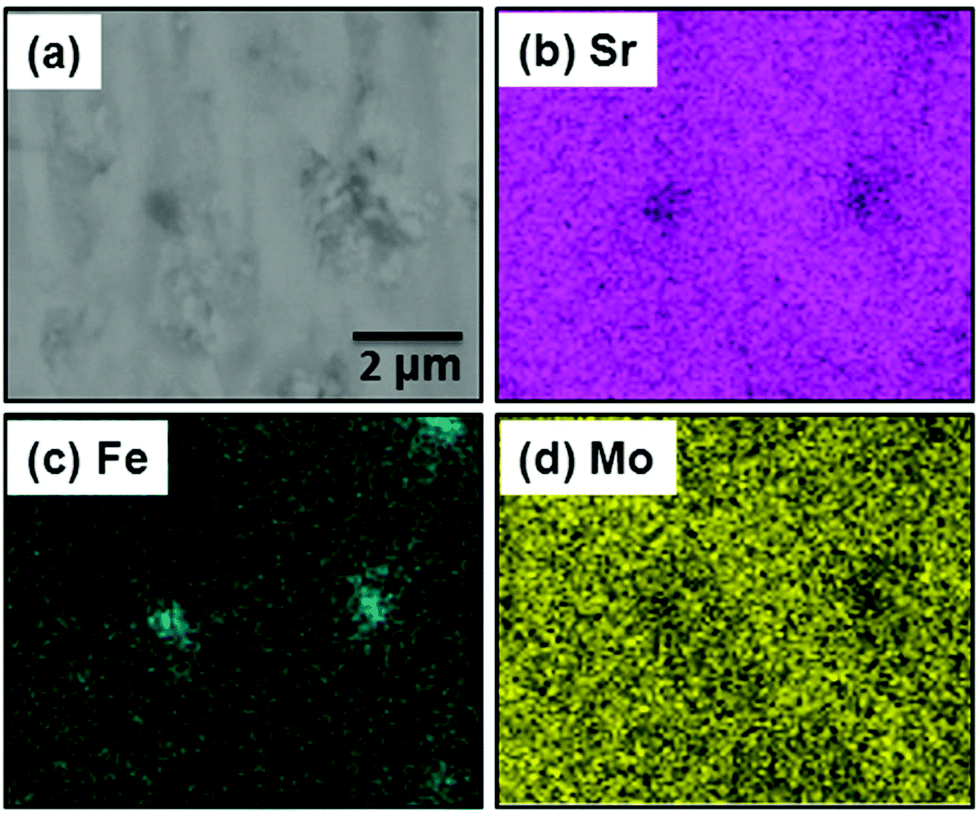
The observation of Fe-flakes on the surface of some of the pellets and in the diffraction patterns (see below) strongly suggested that the composition of our perovskite samples had changed during high-temperature reaction under 5% H2/N2 atmosphere. This prompted further investigations using scanning electron microscopy (SEM), energy dispersive X-ray (EDX) elemental analysis and Rietveld analysis of X-ray and neutron powder diffraction data. The EDX measurements were performed on three random spots of ca. 8 × 9 μm for each sample, and the average values of the atomic ratios were used in the composition calculations. These results are summarized in Table 1 and reveal that a non-A-site deficient and Mo-rich Sr2Fe1−yMo1+yO6 series has formed. The experimental compositions are as follows y = 0 (x = 0), 0.04 (x = 0.15), 0.08 (x = 0.25), 0.13 (x = 0.35) and 0.20 (x = 0.5). In order to investigate the sample homogeneity in more detail, large area elemental maps (Sr, Fe and Mo) were collected for the y = 0.2 composition. The results are shown in Fig. 1. This demonstrates that all elements exhibit a homogeneous distribution and that the product is free from macroscopic phase segregation. Some Fe-rich regions corresponding to iron particles are observed in the Fe map.
 |
| | Fig. 1 (a) SEM micrograph and (b–d) EDX elemental distributions for the y = 0.2 sample from the Sr2Fe1−yMo1+yO6 series. | |
Table 1 SEM-EDX compositions, space group, lattice parameters, tetragonal distortion, Fe/Mo site occupancies, wt% iron impurities, Rietveld goodness of fit, carrier concentration (n) and percentage densities for the Sr2Fe1−yMo1+yO6 (0 ≤ y ≤ 0.20) seriesa
| Sr2−xFe1−yMo1+yO6 |
|
I4/m: Sr: 4d (1/2, 0, 1/4); Fe/Mo: 2a (0, 0, 0); Mo/Fe: 2b (0, 0, 1/2); O1: 4e (0, 0, 0.252); O2: 8 h (0.255, 0.249, 0). I4/mcm: Sr: 4d (1/2, 0,1/4); Fe/Mo: 4c (0,0,0); O1: 4a (0, 0, 0.25); O2: 8 h (0.26, 0.76, 0).
|
| Nominal |
x = 0/y = 0 |
x = 0.15/y = 0 |
x = 0.25/y = 0 |
x = 0.35/y = 0 |
x = 0.5/y = 0 |
| EDX |
x = 0/y = 0 |
x = 0/y = 0.038(3) |
x = 0/y = 0.079(2) |
x = 0/y = 0.126(4) |
x = 0/y = 0.198(3) |
| S.G |
I4/m |
I4/m |
I4/m |
I4/m |
I4/mcm |
|
a (Å) |
5.5718(5) |
5.5765(1) |
5.5795(1) |
5.5839(1) |
5.5922(3) |
|
c (Å) |
7.9022(1) |
7.9049(3) |
7.9078(3) |
7.9087(2) |
7.9114(4) |
| 1 − c/√2a (×10−3) |
3.0 |
2.5 |
2.3 |
1.7 |
0.52 |
|
V (Å3) |
245.32(1) |
245.82(1) |
246.18(2) |
246.59(1) |
247.41(1) |
| Fe/Mo |
0.90(1)/0.10(1) |
0.84(1)/0.16(1) |
0.78(3)/0.22(3) |
0.72(3)/0.28(3) |
0.39(2)/0.61(4) |
| Mo/Fe |
0.90(1)/0.10(1) |
0.88(1)/0.12(1) |
0.86(3)/0.14(3) |
0.85(3)/0.15(3) |
| Wt% Fe |
— |
— |
0.54(1) |
1.82(7) |
2.39(9) |
| Reduced χ2 |
1.1 |
1.2 |
1.3 |
1.7 |
1.9 |
|
n (1020 cm−3) |
1.5 |
2.1 |
2.5 |
3.5 |
6.5 |
| % density |
75 |
89 |
90 |
90 |
85 |
The room temperature XRD patterns for the Sr2Fe1−yMo1+yO6 samples are shown in Fig. 2. The patterns for 0 ≤ y ≤ 0.13 can be indexed using the tetragonal I4/m superstructure reported for Sr2FeMoO6, which allows for Fe/Mo rocksalt ordering,32 while the I4/mcm structure with a disordered B-cation arrangement was appropriate for y = 0.2. Both space groups correspond to the a0a0c− Glazer tilt system.33,34 A monotonic shift of the diffraction peaks to lower angles is observed and indicates a systematic expansion in the unit cell parameters as y-increases. The insets highlight the evolution of the (101) reflection that is a measure of the degree of Fe and Mo ordering, and the cluster of the (420), (332) and (116) reflections that can be seen to merge for larger y. The reduced (101) intensity signals a gradual loss of B-cation ordering, while the merging of the higher angle reflections shows a reducing tetragonal distortion. In addition to the major phase, there is also evidence for a minor iron impurity phase for y ≥ 0.08.
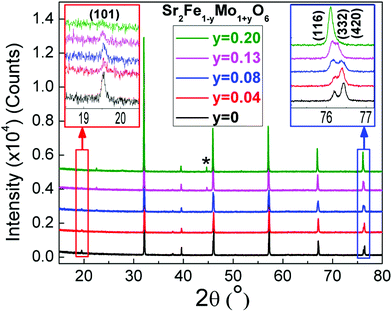 |
| | Fig. 2 Room temperature X-ray powder diffraction patterns for the Sr2Fe1−yMo1+yO6 series. The insets highlight the decreasing intensity of the (101) superstructure reflection indicative of Fe/Mo rocksalt ordering, and the decreasing tetragonal distortion, respectively. The asterisk indicates a small Fe impurity. | |
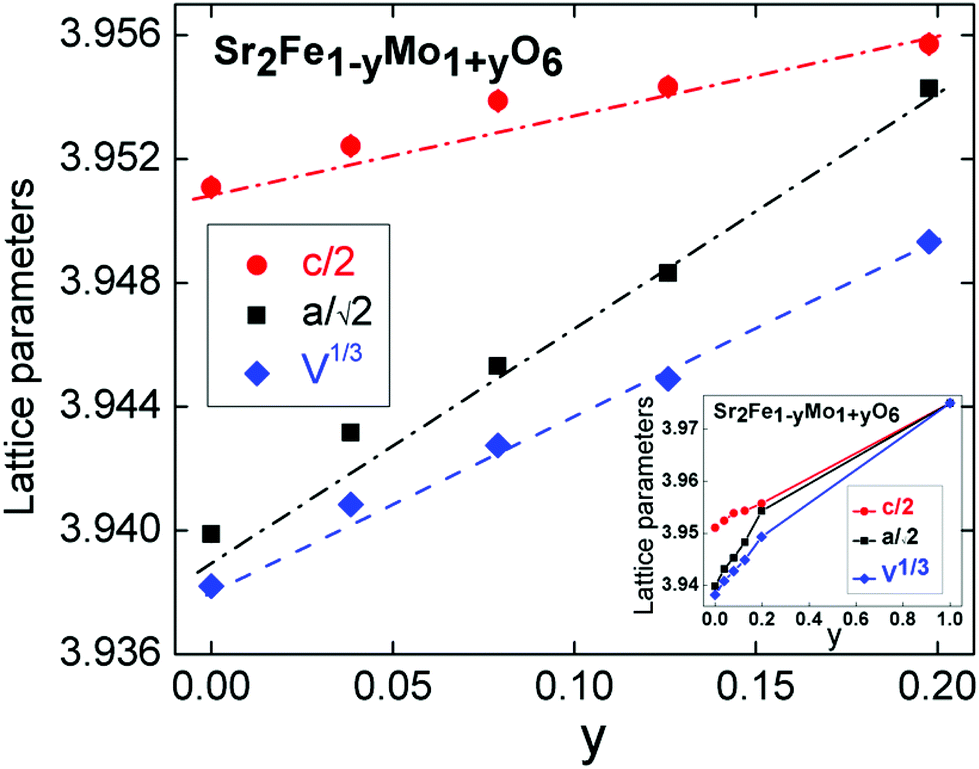
Rietveld analysis of the XRD data was used to determine the distribution of the B-cations. These results are summarized in Table 1. Good fits were obtained using the compositions obtained from the elemental analysis with a gradual decrease in B-site ordering observed as the Mo content increases. In these refinements a full occupancy of the oxygen sites was assumed, and the oxygen positions were kept fixed at values reported for Sr2FeMoO6 (ref. 35), and as determined from our neutron powder diffraction analysis on the y = 0.2 sample (see below). The fitted weight fractions of the Fe impurity are 0.54(1), 1.82(7) and 2.39(9) % for y = 0.08, 0.13 and 0.20. The evolution of the lattice parameters is given in Fig. 3. The linear changes in the unit cell parameters with composition were noted in an earlier study and our values are in excellent agreement with those published before.36,37 For example, for the c-axis a slope of 0.043 Å/y was reported, while our slope is 0.045 Å/y. In order to gain insight into the oxygen stoichiometry a 2 gram sample of the y = 0.2 sample was studied using neutron powder diffraction. The final Rietveld fit is shown in Fig. 4 and the refined unit cell and atomic parameters as well as selected bond distances and angles are summarised in Table 2. The Rietveld fitting confirmed the assignment of the I4/mcm superstructure that was initially made based on X-ray diffraction. The refined composition is Sr2Fe0.784(2)Mo1.216(2)O5.996(1) signalling a stoichiometric oxygen content, and an overall composition which is in excellent agreement with the EDX and XRD based compositions (Table 1). The observation of weak intensity in the (101) reflection at d ∼ 4.55 Å in the neutron diffraction data (GEM Bank 3, Fig. 4) absent in the XRD patterns, indicated the presence of AF order at room temperature. The intensity was successfully fitted assuming a G-type ordering of a simple cubic Fe perovskite sublattice (e.g. as in LaFeO3). The refined magnetic moment was 1.25(7)μB and is aligned along the crystallographic c-direction. Similar magnetic order has been observed previously in Fe-rich Sr2Fe1.33Mo0.67O6 (TN ∼ 250 K) that contains a 1![[thin space (1/6-em)]](https://www.rsc.org/images/entities/char_2009.gif) :1 ordering of Fe and (Mo0.67Fe0.33),38 and in highly disordered Sr2FeMoO6 (TN ∼ 750 K) with only 18% cation order.39 Low temperature ordered magnetic moments of 1.4 and 2.2μB/Fe atom were reported for these two compositions, respectively.38,39
:1 ordering of Fe and (Mo0.67Fe0.33),38 and in highly disordered Sr2FeMoO6 (TN ∼ 750 K) with only 18% cation order.39 Low temperature ordered magnetic moments of 1.4 and 2.2μB/Fe atom were reported for these two compositions, respectively.38,39
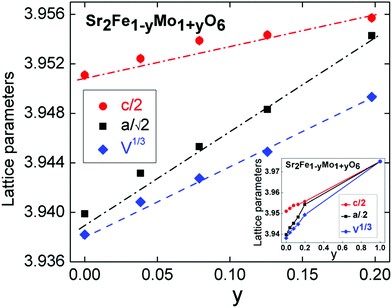 |
| | Fig. 3 Composition dependence of the lattice parameters for the Sr2Fe1−yMo1+yO6 series. The inset shows the interpolation of the lattice parameters up to y = 1, the SrMoO3 lattice parameter was taken from ref. 45. | |
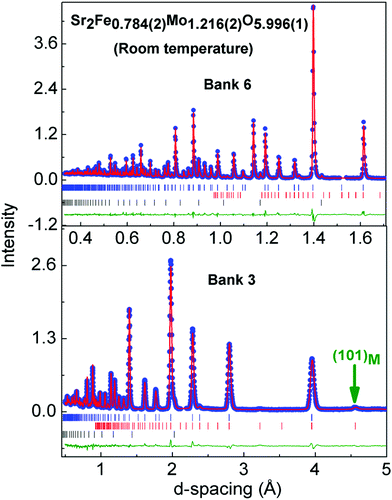 |
| | Fig. 4 Observed (solid blue circles), calculated (red line) and difference (green line) Rietveld profiles for room temperature neutron powder diffraction data collected on Sr2Fe0.8Mo1.2O6. Bragg reflection markers correspond to the main phase, nuclear and magnetic contributions, and a 1.5 wt% Fe impurity (top to bottom). The prominent (101) magnetic reflection is indicated by the green arrow. | |
Table 2 Refined crystallographic parameters and selected bond distances and angles for Sr2Fe0.784(1)Mo1.216(2)O5.996(1) from Rietveld fits against GEM neutron powder diffraction dataa
| |
Wyckoff position |
x
|
y
|
z
|
U
iso (Å2) |
Occupancy |
| Sr |
4d |
0 |
0.5 |
0.25 |
0.00892(9) |
1 |
| Fe |
2a |
0 |
0 |
0 |
0.00257(7) |
0.392(6) |
| Mo |
2b |
0 |
0 |
0 |
0.00257(7) |
0.608(6) |
| O1 |
4e |
0 |
0 |
0.25 |
0.00856(7) |
1.002(1) |
| O2 |
8h |
0.2607(1) |
0.7607(2) |
0 |
0.00856(7) |
0.998(1) |
| |
Bond distance (Å) |
|
Bond angle (°) |
|
Space group: I4/mcm; a = 5.5845(3) Å; c = 7.9063(7) Å; V = 246.57(2) Å3 Fe magnetic moment: mx = my = 0, mz = 1.25(7)μB.
|
| Sr–O1 (×4) |
2.854(2) |
Mo/Fe–O1–Mo/Fe (×2) |
180 |
| Sr–O1 (×4) |
2.734(1) |
Mo/Fe–O2–Mo/Fe (×4) |
175.07(5) |
| Sr–O2 (×4) |
2.792(3) |
|
|
| Fe/Mo–O2 (×2) |
1.976(1) |
|
|
| Fe/Mo–O1 (×4) |
1.976(4) |
|
|
Magnetic susceptibility
The temperature and field dependences of the magnetisation (M) of the y = 0.2 sample are shown in Fig. 5. The field dependence M(H) (inset to Fig. 5) features a small hysteresis (Hc = 11 Oe; Mr = 0.2 emu g−1) and is typical of a soft ferromagnet or a superparamagnet (small domain ferromagnet). This is in keeping with the presence of disrupted FIM Fe–O–Mo patches in this B-site disordered composition. The temperature dependence of the magnetisation M(T) is compared to a sample of similar composition from the literature.37 A transition is evident at 250 K, in agreement with the literature data. The M(T) data also reveal a substantial ferromagnetic background due to the presence of metallic Fe. A saturation magnetisation of 2μB/f.u (Msat = 25.9 emu per gram) is reported for Sr2Fe0.8Mo1.2O6 whereas we observed a magnetization value of 37.3 emu per gram. Assuming that the difference is accounted for by elemental Fe (Msat = 221.7 emu per gram),40 leads to an estimated 5.1 wt% of Fe in our sample. This is in good agreement with the values obtained from Rietveld analysis (Tables 1 and 2).
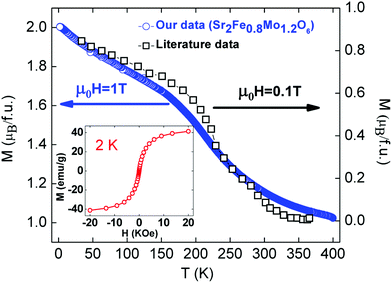 |
| | Fig. 5 Temperature dependence of the magnetization for Sr2Fe0.8Mo1.2O6. Data on a sample of similar composition from ref. 37 is included for comparison. The inset shows the M(H) hysteresis loop at 2 K. | |
Thermoelectric properties
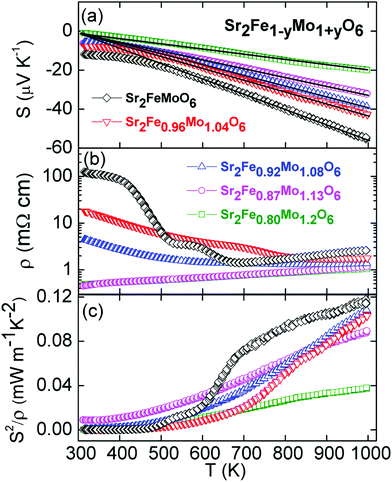
The temperature dependence of S, ρ and S2/ρ for the Sr2Fe1−yMo1+yO6 samples are shown in Fig. 6. The S(T) curves have linear temperature dependences and vary smoothly with composition (Fig. 6a). The linear S(T) is characteristic of a metal and the observed S1000 K = −55 μV K−1 for Sr2FeMoO6 is consistent with earlier reports.23,25,26 The slope of the S(T) curves was used to estimate the carrier concentration using S = (8πkB2/3eh2)m*(π/3n)2/3T, where kB is Boltzmann's constant, e is the electronic charge, h is Planck's constant, m* is the effective mass and n is the carrier concentration.41 An effective mass of 3.3me was used in these calculations and the results are summarized in Table 1 and discussed below.42,43 The magnitude of S is reduced with increasing Mo content which is consistent with a transition to a metallic system that is also evident from the ρ(T) data. The electrical resistivity for y = 0 decreases from ∼100 mΩ cm at 300 K to 3 mΩ cm at 1000 K and shows two transitions at ∼475 K and ∼625 K (Fig. 6b). Similar transitions were observed in the earlier report on the Sr2−xBaxFeMoO6 series.23 The origin of these anomalies is not clear but it is worth noting the absence of any transitions in S(T), suggesting that these may be due to extrinsic factors. The y = 0.04 and 0.08 samples contain signatures of these anomalies but for y = 0.13 and 0.20 smoothly varying metallic varying ρ(T) were observed. The latter samples have ρ300 K ∼ 0.5 mΩ cm increasing to ρ1000 K ∼ 1 mΩ cm. It is possible that the semiconducting behaviour observed for the lower y values is due to grain boundary effects that are suppressed at higher temperatures and with increased Mo content. The thermoelectric power factors are too small for these materials to be useful thermoelectrics with largest values of 0.11 and 0.04 mW m−1 K−2 at 1000 K for y = 0 and y = 0.2, respectively (Fig. 6c).
 |
| | Fig. 6 Temperature dependence of (a) the Seebeck coefficient (S), (b) the electrical resistivity (ρ) and (c) the thermoelectric power factor (S2/ρ) for the Sr2Fe1−yMo1+yO6 series. | |
Discussion
Elemental and structure analysis demonstrates that the nominal A-site deficient Sr2−xFeMoO6−δ compositions form a series of Mo-rich non-A-site deficient Sr2Fe1−yMo1+yO6 perovskites under high-temperature (1350–1400 °C) and reducing conditions (5% H2 in N2). This suggests that these mixed Fe and Mo perovskites do not tolerate A-site and/or oxygen vacancies, at least under the employed synthetic conditions. It may be possible to stabilise the hypothetical Sr0.5FeMoO6 compound with Fe3+ and Mo6+ using soft chemistry methods and under oxidising atmospheres. This would, however, involve losing the favourable electronic properties based on the Fe2+/3+ and Mo5+6+ redox couple,16 leading to poor semiconducting or electrically insulating behaviour.
The Sr2Fe1−yMo1+yO6 materials show a gradual transition from the largely B-site ordered y = 0 composition to the fully disordered y = 0.2 composition. One insightful way to think about these materials is not in terms of Fe/Mo ordering but in terms of the fractions of B–O–B’ linkages.44 This enables a comparison between samples with varying degrees of Fe/Mo ordering. The B–O–B’ fractions can be calculated from the refined B-site occupancies (Table 1). For example the largely B-site ordered y = 0 composition has 0.92 + 0.12 = 0.82 Fe–O–Mo linkages, 0.1 × 0.9 = 0.09 Fe–O–Fe and 0.1 × 0.9 = 0.09 Mo–O–Mo linkages, whereas the B-site disordered y = 0.2 sample has 2 × 0.39 × 0.61 = 0.48 Fe–O–Mo linkages, 0.392 = 0.15 Fe–O–Fe and 0.612 = 0.37 Mo–O–Mo linkages. The composition dependence of the fractions of B–O–B’ linkages are shown in Fig. 7. This reveals a gradual increase in the fraction of Mo–O–Mo linkages, demonstrating that the samples become more like SrMoO3. Linear extrapolation of the c-axis which is not affected by Glazer tilting (shown in the inset to Fig. 3) leads to a good agreement with the value reported for cubic SrMoO3.45 This suggests a gradual change in average B-cation oxidation state as y is increased. Extrapolation of the unit cell volume or a-axis which are affected by changes in the octahedral tilt system leads to an overestimate for SrMoO3. As intuitively expected, the increase in Mo–O–Mo linkages occurs at the expense of the Fe–O–Mo linkages; while an almost constant fraction of Fe–O–Fe linkages (0.1–0.15) are observed. This is somewhat unexpected as a-priori both Fe–O–Mo and Fe–O–Fe linkages could have been broken upon introduction of excess Mo, and suggests there may be an energetic or entropic stabilisation for the Fe–O–Fe linkages. The bottom panel of Fig. 7 summarizes the 1000 K thermoelectric property data. This reveals a linear decrease of S, coupled to a decrease in ρ as y is increased, and is consistent with the observed transition to metallic behaviour as the Mo–O–Mo fraction is increased. The calculated charge carrier concentrations increase from 1.5 × 1020 cm−3 for y = 0 to 6.5 × 1020 cm−3 for y = 0.2 (Table 1). These are almost certainly an underestimate as the Hall carrier concentrations of single crystalline Sr2FeMoO6 are reported to be 1.1 × 1022 cm−3.43 Nevertheless, the trend of an increasing amount of charge carriers with y is clear. The metallic carrier concentrations also preclude the small iron impurities from having a significant impact on the thermoelectric properties, unlike in semiconductors where impurities can lead to substantial changes in carrier concentrations. Computational studies show that the introduction of excess Mo results in the presence of a Mo t2g band at the Fermi level, which leads to the loss of the half-metallic conduction for y > 0.125.36 In other words, the Sr2Fe1−yMo1+yO6 samples start to resemble non-magnetic SrMoO3. The maximum power factors are ∼0.1 mW m−1 K−1 which leads to an estimated upper limit ZT = 0.05 at 1000 K, using literature data for the thermal conductivity.25,26 The magnetic susceptibility and hysteresis for the y = 0.2 sample are in good agreement with the literature, and are typical of a ferrimagnet with small magnetic domains (a superparamagnet). The neutron data indicate G-type AF ordering at room temperature involving the Fe–O–Fe linkages of which there are about 15% in this composition. There is no evidence for long range FIM order coinciding with the AF order but further experiments below 250 K are needed to confirm the short range nature suggested by the susceptibility data. The observation of AF order at room temperature despite the small fraction of Fe–O–Fe linkages (below the percolation limit of 20–25%) suggests that this may be stabilised through Fe–O–Mo–O–Fe interactions,39 which could be ferromagnetic for Mo5+ or AF for non-magnetic Mo6+ cations.46 Evidence for the importance of Mo5+ comes from a comparison of the Neel temperatures of the Sr2Fe(Fe0.33Mo0.67)O6 (33% Fe–O–Fe) and disordered Sr2FeMoO6 (24% Fe–O–Fe) samples mentioned in the results section. The lowest TN ∼ 250 K is observed for Sr2Fe(Fe0.33Mo0.67)O6 which contains Fe3+/Mo6+ while the mixed valence Sr2FeMoO6 sample has TN ∼ 750 K, suggesting that the presence of Mo5+ is key to observe high Neel temperatures.
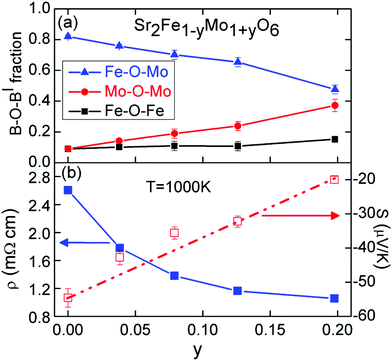 |
| | Fig. 7 Comparison of (a) the changes in structure quantified using the fraction of B–O–B’ linkages and (b) the thermoelectric properties for the Sr2Fe1−yMo1+yO6 (0 ≤ y ≤ 0.20) series. | |
The results presented here suggest that these samples combine AF long range order (linked to Fe–O–Fe domains), short range FIM ordering (Fe–O–Mo domains) and itinerant electrons (Fe–O–Mo and Mo–O–Mo domains) all in one material. This may offer possibilities for the tuning and coupling of these properties in a single phase material.
Acknowledgements
We acknowledge the Leverhulme Trust, the UK Engineering and Physical Sciences Research Council (EPSRC) (EP/J000884/1 and EP/K036408/1) and the UK Science and Technology Facilities Council (STFC) for provision of GEM Xpress Access beamtime at ISIS. We would also like to acknowledge Jim Buckman, Institute of Petroleum Engineering, Heriot-Watt University, for his help during collection of the SEM-EDX data.
References
- G. J. Snyder and E. S. Toberer, Nat. Mater., 2008, 7, 105–114 CrossRef CAS PubMed.
-
D. M. Rowe, Thermoelectrics Handbook: Macro to Nano, CRC Press, Boca Raton, 2006 Search PubMed.
- J. W. Fergus, J. Eur. Ceram. Soc., 2012, 32, 525–540 CrossRef CAS PubMed.
- J. He, Y. F. Liu and R. Funahashi, J. Mater. Res., 2011, 26, 1762–1772 CrossRef CAS.
- I. Terasaki, Y. Sasago and K. Uchinokura, Phys. Rev. B: Condens. Matter, 1997, 56, 12685–12687 CrossRef.
- M. Ohtaki, T. Tsubota, K. Eguchi and H. Arai, J. Appl. Phys., 1996, 79, 1816–1818 CrossRef CAS PubMed.
- T. Tsubota, M. Ohtaki, K. Eguchi and H. Arai, J. Mater. Chem., 1997, 7, 85–90 RSC.
- S. Ohta, T. Nomura, H. Ohta and K. Koumoto, J. Appl. Phys., 2005, 97, 034106 CrossRef PubMed.
- T. Okuda, K. Nakanishi, S. Miyasaka and Y. Tokura, Phys. Rev. B: Condens. Matter, 2001, 63, 113104 CrossRef.
- S. W. Li, R. Funahashi, I. Matsubara, K. Ueno, S. Sodeoka and H. Yamada, Chem. Mater., 2000, 12, 2424–2427 CrossRef CAS.
- Y. Miyazaki, K. Kudo, M. Akoshima, Y. Ono, Y. Koike and T. Kajitani, Jpn. J. Appl. Phys. Part 2, 2000, 39, L531–L533 CAS.
- M. Shikano and R. Funahashi, Appl. Phys. Lett., 2003, 82, 1851–1853 CrossRef CAS PubMed.
- J. W. G. Bos, J. T. Hertz, E. Morosan and R. J. Cava, J. Solid State Chem., 2007, 180, 3211–3217 CrossRef CAS PubMed.
- D. Flahaut, T. Mihara, R. Funahashi, N. Nabeshima, K. Lee, H. Ohta and K. Koumoto, J. Appl. Phys., 2006, 100, 084911 CrossRef PubMed.
- M. Ohtaki, H. Koga, T. Tokunaga, K. Eguchi and H. Arai, J. Solid State Chem., 1995, 120, 105–111 CrossRef CAS.
- K. L. Kobayashi, T. Kimura, H. Sawada, K. Terakura and Y. Tokura, Nature, 1998, 395, 677–680 CrossRef CAS PubMed.
- D. Serrate, J. M. De Teresa and M. R. Ibarra, J. Phys.: Condens. Matter, 2007, 19, 023201 CrossRef.
- A. S. Ogale, S. B. Ogale, R. Ramesh and T. Venkatesan, Appl. Phys. Lett., 1999, 75, 537–539 CrossRef CAS PubMed.
- L. Balcells, J. Navarro, M. Bibes, A. Roig, B. Martinez and J. Fontcuberta, Appl. Phys. Lett., 2001, 78, 781–783 CrossRef CAS PubMed.
- M. Garcia-Hernandez, J. L. Martinez, M. J. Martinez-Lope, M. T. Casais and J. A. Alonso, Phys. Rev. Lett., 2001, 86, 2443–2446 CrossRef CAS.
- J. Navarro, J. Nogues, J. S. Munoz and J. Fontcuberta, Phys. Rev. B: Condens. Matter, 2003, 67, 174416 CrossRef.
- A. B. Munoz-Garcia, M. Pavone and E. A. Carter, Chem. Mater., 2011, 23, 4525–4536 CrossRef CAS.
- T. Sugahara, M. Ohtaki and T. Souma, J. Ceram. Soc. Jpn., 2008, 116, 1278–1282 CrossRef CAS.
- S. R. Popuri, A. J. M. Scott, R. A. Downie, M. A. Hall, E. Suard, R. Decourt, M. Pollet and J. W. G. Bos, RSC Adv., 2014, 4, 33720–33723 RSC.
- T. Sugahara, T. Araki, M. Ohtaki and K. Suganuma, J. Ceram. Soc. Jpn., 2012, 120, 211–216 CrossRef.
- T. Sugahara, N. V. Nong and M. Ohtakic, Mater. Chem. Phys., 2012, 133, 630–634 CrossRef CAS PubMed.
- A. V. Kovalevsky, A. A. Yaremchenko, S. Populoh, A. Weidenkaff and J. R. Frade, J. Phys. Chem. C, 2014, 118, 4596–4606 CAS.
- M. T. Buscaglia, F. Maglia, U. Anselmi-Tamburini, D. Marre, I. Pallecchi, A. Ianculescu, G. Canu, M. Viviani, M. Fabrizio and V. Buscaglia, J. Eur. Ceram. Soc., 2014, 34, 307–316 CrossRef CAS PubMed.
- S. S. Jackson, F. Azough and R. Freer, J. Electron. Mater., 2014, 43, 2331–2336 CrossRef CAS PubMed.
-
A. C. Larson and R. B. Von Dreele, Los Alamos National Laboratory Report LAUR 86-748, 2000.
- B. H. Toby, J. Appl. Crystallogr., 2001, 34, 210–213 CrossRef CAS.
- M. T. Anderson, K. B. Greenwood, G. A. Taylor and K. R. Poeppelmeier, Prog. Solid State Chem., 1993, 22, 197–233 CrossRef CAS.
- C. J. Howard, B. J. Kennedy and P. M. Woodward, Acta Crystallogr., Sec B: Struct. Sci., 2003, 59, 463–471 CrossRef PubMed.
- P. M. Woodward, Acta Crystallogr., Sec. B: Struct. Sci., 1997, 53, 32–43 CrossRef.
- O. Chmaissem, R. Kruk, B. Dabrowski, D. E. Brown, X. Xiong, S. Kolesnik, J. D. Jorgensen and C. W. Kimball, Phys. Rev. B: Condens. Matter, 2000, 62, 14197–14206 CrossRef CAS.
- R. Mishra, O. D. Restrepo, P. M. Woodward and W. Windl, Chem. Mater., 2010, 22, 6092–6102 CrossRef CAS.
- D. Topwal, D. D. Sarma, H. Kato, Y. Tokura and M. Avignon, Phys. Rev. B: Condens. Matter, 2006, 73, 094419 CrossRef.
- M. C. Viola, J. A. Alonso, J. C. Pedregosa and R. E. Carbonio, Eur. J. Inorg. Chem., 2005, 1559–1564 CrossRef CAS.
- D. Sanchez, J. A. Alonso, M. G. Hernandez, M. J. Martinez-Lope, J. L. Martinez and A. Mellergard, Phys. Rev. B: Condens. Matter, 2002, 65, 104426 CrossRef.
- J. Crangle and G. M. Goodman, Proc. R. Soc. London, Ser. A, 1971, 321, 477 CrossRef CAS.
- M. Cutler, J. F. Leavy and R. L. Fitzpatrick, Phys. Rev., 1964, 133, 1143 CrossRef CAS.
- H. Yanagihara, W. Cheong, M. B. Salamon, S. Xu and Y. Moritomo, Phys. Rev. B: Condens. Matter, 2002, 65, 092411 CrossRef.
- Y. Tomioka, T. Okuda, Y. Okimoto, R. Kumai, K. I. Kobayashi and Y. Tokura, Phys. Rev. B: Condens. Matter, 2000, 61, 422–427 CrossRef CAS.
- J. A. Rodgers, A. J. Williams, A. J. Martinez-Lope, J. A. Alonso and J. P. Attfield, Chem. Mater., 2008, 20, 4797–4799 CrossRef CAS.
- R. B. Macquart, B. J. Kennedy and M. Avdeev, J. Solid State Chem., 2010, 183, 250–255 CrossRef CAS PubMed.
- J. W. G. Bos and J. P. Attfield, Phys. Rev. B: Condens. Matter, 2004, 70, 174434 CrossRef.
|
| This journal is © The Royal Society of Chemistry 2015 |
Click here to see how this site uses Cookies. View our privacy policy here. 
 Open Access Article
 This Open Access Article is licensed under a