 Open Access Article
Tuning the surface properties of novel ternary iron(III) fluoride-based catalysts using the template effect of the matrix†
Ying
Guo
a,
Andreas
Lippitz
b,
Paul
Saftien
a,
Wolfgang E. S.
Unger
b and
Erhard
Kemnitz
*a
aHumboldt-Universität zu Berlin, Institut für Chemie, Brook-Taylor-Straße 2, D-12489, Berlin, Germany. E-mail: erhard.kemnitz@chemie.hu-berlin.de; Fax: +49 (0)30 2093 7277; Tel: +49 (0)30 2093 7555
bBundesanstalt für Materialforschung und –prüfung, Unter den Eichen 44-46, D-12203, Berlin, Germany
First published on 16th January 2015
Abstract
Sol–gel prepared ternary FeF3–MgF2 materials have become promising heterogeneous catalysts due to their porosity and surface Lewis/Brønsted acidity (bi-acidity). Despite the good catalytic performance, nanoscopic characterisations of this type of material are still missing and the key factors controlling the surface properties have not yet been identified, impeding both a better understanding and further development of ternary fluoride catalysts. In this study, we characterised the interaction between the bi-acidic component (FeF3) and the matrix (MgF2) on the nano-scale. For the first time, the formation pathway of FeF3–MgF2 was profiled and the template effect of MgF2 during the synthesis process was discovered. Based on these new insights two novel materials, FeF3–CaF2 and FeF3–SrF2, were established, revealing that with decreasing the atomic numbers (from Sr to Mg), the ternary fluorides exhibited increasing surface acidity and surface area but decreasing pore size. These systematic changes gave rise to a panel of catalysts with tuneable surface and bulk properties either by changing the matrix alkaline earth metal fluoride or by adjusting their ratios to Fe or both. The template effect of the alkaline earth metal fluoride matrix was identified as the most probable key factor determining the surface properties and further influencing the catalytic performance in ternary fluoride based catalysts, and paves the way to targeted design of next-generation catalysts with tunable properties.
1. Introduction
Nanoscopic bi-acidic metal fluorides have been shown to play an active role in heterogeneous catalysis in recent years.1–6 In this context, bi-acidic refers to the co-existence of Lewis and Brønsted acidity in the catalyst. Heterogeneous bi-acidic catalysts are easy to handle and environmentally friendly, and thus are frequently applied in industrial processes like alkylation, isomerisation, cracking, and esterification.7,8 Commonly used heterogeneous bi-acidic catalysts are usually based on zeolites, silica, alumina, zirconia, and their combinations. Since metal fluorides are known to exhibit much more pronounced Lewis acidity compared with metal oxides,9 we wondered whether it is possible to prepare metal fluorides with bi-acidic properties. Indeed, partially hydroxylated MgF2 and AlF3 have already been successfully synthesised via a fluorolytic sol–gel process10 and were highly active as heterogeneous bi-acidic catalysts in the Friedel–Crafts alkylation (e.g. synthesis of vitamin E and vitamin K1)4 and the carbonyl–ene reaction (isomerisation of citronellal to isopulegol).2 Further functionalisation of partially hydroxylated fluorides resulted in extended applications: fluorosulfonate grafted hydroxylated MgF2 can catalyse the dehydration of xylose to furfural;6,11 Au doped hydroxylated MgF2 and Pd (or Pt) doped hydroxylated AlF3 were active in the one-pot synthesis of menthol from citral due to their bi-acidity and hydrogenation ability;12,13 Sn doped hydroxylated MgF2 was reported as an efficient catalyst in the degradation of cellulose, offering a feedstock in bio-ethanol production.14The previously reported bi-acidic fluoride catalysts focused on a narrow range of main group metal fluorides, i.e. AlF3 or MgF2. Naturally, questions arose as to whether it was possible to develop partially hydroxylated transition metal fluorides and whether these could provide comparable or even better catalytic performances than AlF3 or MgF2. In 2013 we reported a ternary FeF3–MgF2 catalyst that combined the advantages of the bi-acidic FeF3 and the porous MgF2 matrix and was highly active in the isomerisation of citronellal to isopulegol.5 The ternary FeF3–MgF2 catalyst was prepared via a one-step sol–gel route and the bi-acidity was introduced by a dehydration treatment of the Fe-precursor.5 In spite of the progress in the development of FeF3–MgF2, several issues needed to be clarified. First of all, the interaction between nanoscopic FeF3 and MgF2 required a detailed analysis since it would help understand the catalyst's structure and catalytic activity. More importantly, we devoted to investigate the formation pathway of the ternary FeF3–MgF2 catalyst with emphasis on revealing the function of the matrix material, MgF2, during the synthesis process. Hence a template effect of MgF2 was reported for the first time and was considered a key factor controlling the surface properties of FeF3–MgF2 catalysts. Inspired by the template effect of MgF2, we established two novel ternary fluoride catalysts using other alkaline earth metal fluorides as matrices and discussed the role of the template effect in tuning the surface properties of this type of material.
Then the present work focuses on solving the following points. The interaction between nanoscopic FeF3 and MgF2 in the FeF3–MgF2 catalysts was characterised by scanning transmittance electron microscopy (STEM) coupled with energy-dispersive X-ray spectroscopy (EDX) and X-ray photoelectron spectroscopy (XPS). The formation pathway of the ternary FeF3–MgF2 was investigated by varying synthesis parameters in combination with characterisation methods such as elemental analysis (C, H, N, and F analysis) and powder X-ray diffraction (XRD). Finally, we synthesised FeF3–CaF2 and FeF3–SrF2 catalysts via the fluorolytic sol–gel process and characterised their physico-chemical properties with thermal analysis methods, STEM, N2 physisorption, and chemisorption-IR. The isomerisation of citronellal to isopulegol was used as a model reaction to evaluate all the ternary fluoride catalysts studied in this work. We believe that our novel approach reveals the potential of ternary iron(III) fluoride-based catalysts and will promote their applications in heterogeneous catalysis. Moreover, such systems also offer potential applications as materials for making electrodes in fuel cell technology.
2. Results and discussion
2.1. Interaction between FeF3 and MgF2 in the ternary FeF3–MgF2 catalysts
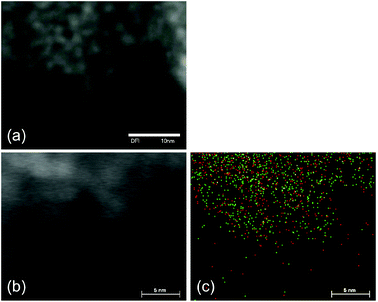
In this work, we used STEM and XPS to characterise the morphology of FeF3–MgF2 catalysts and the nanoscopic interaction between FeF3 and MgF2 particles.The STEM images (Fig. 1(a) and (b)) suggest that the particles in FeF3–MgF2 are spherical and are roughly homogeneous in size. The elemental mapping of Fe and Mg was generated by EDX in order to visualise the Mg and Fe elemental distribution in the material. The Fe and Mg distribution in a selected area that corresponds to the STEM image in Fig. 1(b) is shown in Fig. 1(c). The 2D hypermap reveals a homogeneous distribution of Fe and Mg. Two different topological situations may cause this distribution: (1) FeF3–MgF2 may consist of a layered structure, and the projection of Fe-rich layers and Mg-rich layers implies the pseudo-homogeneous Fe–Mg-distribution; (2) FeF3–MgF2 consists of a granular structure, and Fe and Mg are homogeneously distributed over the 3D space. Since the STEM images suggest a granular structure rather than a layered structure, we assume fully dispersed FeF3 in MgF2, and therefore, no isolated FeF3-domains can be found embedded in MgF2.
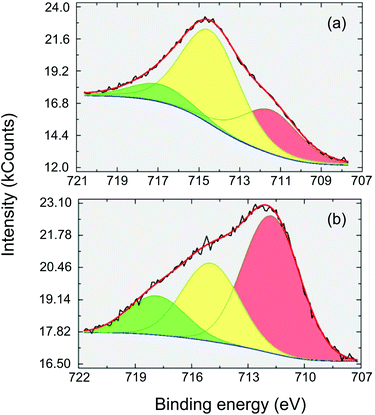
XPS is a very useful technique for studying the electronic structure and chemical species in solid materials.15 In this work, XPS was applied to FeF3–MgF2 in order to clarify the effect of dispersing FeF3 into the MgF2 matrix based on the binding energy (BE) of Fe 2p3/2 photoelectrons. The detailed Fe (2p3/2) spectrum of a sol–gel prepared FeF3 (synthesised as described by Y. Guo et al.5) is presented for comparison (Fig. 2(a)). The BE at 718 eV is assigned to the satellite peak to Fe 2p3/2 (iron(III) fluoride), and the BE of the major component peak at about 715 eV corresponds to the Fe(III)–F bonds.16 The BE at 712 eV may refer to either minor Fe(III)–O or Fe(II)–F species. However, a previous study indicated that all the Fe atoms are in their +3 oxidation state.5 Thus the peak at the BE of 712 eV should be assigned to Fe(III)–O. The intensities of Fe (2p3/2) components measured with FeF3–MgF2 (see Fig. 2(b)) are substantially different from the FeF3 case. The major component here is at BE ∼712 eV which suggests a larger proportion of Fe–O bound species. Looking at the NIST XPS database17 reveals that Fe(III)OOH is to be expected at this BE18,19 rather than Fe2O3 which is usually measured at a somewhat lower BE.20 Since XPS is a surface sensitive technique,15 this result suggests that FeF3–MgF2 exhibits more surface –OH species compared with FeF3. Because the surface –OH moieties are potential Brønsted acid sites,5 we expected FeF3–MgF2 to show more pronounced surface Brønsted acidity. Indeed, a previous study on FeF3–MgF2 confirmed its medium strong Brønsted acidity by chemisorption-IR and a catalysis test.5
2.2. Formation pathway of ternary FeF3–MgF2 catalysts
The ternary FeF3–MgF2 catalysts were prepared by a sol–gel route in which a mixed Fe(OH)x(NO3)3−x·yH2O and Mg(CH3COO)2 suspension was fluorinated by HF and gave rise to a FeF3–MgF2 sol.5 To study the formation pathway of the ternary FeF3–MgF2 catalyst, we first examined whether there is any competition between Fe- and Mg-precursors during the fluorination process. It is known that the Mg(CH3COO)2 suspension, MgF2 sol, and FeF3 sol are white or colourless, whereas the Fe(OH)x(NO3)3−x·yH2O solution exhibits a reddish brown colour.5 Moreover, a significant colour change was observed during the synthesis of FeF3–MgF2 (the mixed precursor suspension was yellow; the FeF3–MgF2 sol was colourless).5 In light of this background, we designed two experiments to investigate the formation pathway of FeF3–MgF2 by using the colour change as an index.In one attempt, a FeF3 sol was prepared first, and a Mg(CH3COO)2 suspension was added afterwards to the FeF3 sol.
In a second attempt, a mixed Fe(OH)x(NO3)3−x·yH2O and Mg(CH3COO)2 suspension was fluorinated in a single step by employing an under-stoichiometric amount of HF (two equivalents to Mg).
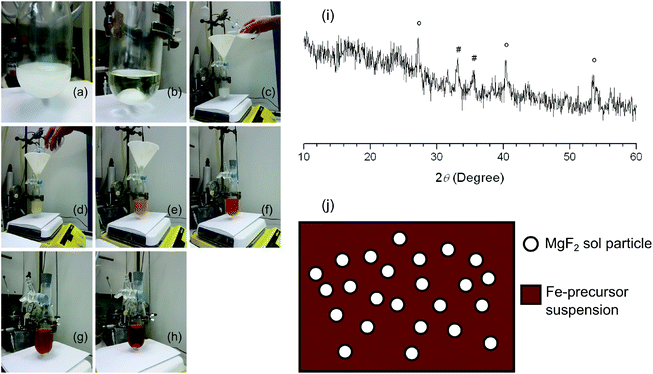
In the first attempt, addition of a stoichiometric amount of anhydrous HF to the Fe(OH)x(NO3)3−x·yH2O solution led to the formation of a colourless FeF3 sol. Addition of the white Mg(CH3COO)2 suspension to this sol resulted first in the formation of an orange-red suspension that turned into a reddish brown clear sol (Fig. 3). This observation suggests that FeF3 sol particles are highly active species that are able to react with Mg(CH3COO)2. It can be further deduced that Mg(CH3OO)2 should very probably be first fluorinated in the mixed Mg2+/Fe3+ precursor suspension, but fluorination of the iron precursor should proceed afterwards. The reddish brown sol shown in Fig. 3(h) was carefully dried at 30 °C to avoid any decomposition of the iron complex. The C, H, N and F elemental analysis results of the obtained brick-red powder as an intermediate substance suggested the co-existence of fluoride, nitrate, and acetate. The nitrate may result from the iron nitrate precursor in the synthesis of the FeF3 sol. Thus the reaction between FeF3 sol particles and Mg(CH3COO)2 probably gave rise to MgF2 and an intermediate iron nitrate acetate complex.
In the second attempt, addition of under-stoichiometric HF to the Fe(OH)x(NO3)3−x·yH2O and Mg(CH3COO)2 suspension gave immediately a reddish brown sol that appeared to be similar to the one in Fig. 3(h). This sol was dried and the obtained powder was calcined at 600 °C before studying it by XRD (Fig. 3(i)). The reflexes can be assigned to an Fe2O3 phase and an MgF2 phase, respectively. No evidence for FeF3 or MgO was found. The XRD result confirmed the deduction that Mg becomes fluorinated first in the sol–gel synthesis, and the intermediate product is probably composed of MgF2 and an iron nitrate acetate complex. It can be further speculated that the MgF2 sol particles probably work as templates and induce the nucleation and govern the follow-up formation of FeF3 (Fig. 3(j)). This template effect of MgF2 would explain the uniform particle size in FeF3–MgF2 catalysts as revealed by STEM images. Moreover, the enhanced surface Brønsted acidity of FeF3–MgF2 as indicated by XPS results is probably introduced via the interaction between sol particles under in situ sol–gel synthesis conditions as the reaction pathway shows. Thus using MgF2 as a matrix does not only template the textural structure but also tunes the surface acidity of FeF3. Keeping in mind that both properties have a strong influence on the performances of a heterogeneous catalyst, we are convinced that the template effect of MgF2 plays an important role in tuning the catalytic activities of FeF3–MgF2 catalysts. Consequently we were interested in whether other materials will also show this template effect. Hence we started the study on the template effects of heavier alkaline earth metal fluorides.
2.3. The template effects of heavier alkaline earth metal fluorides
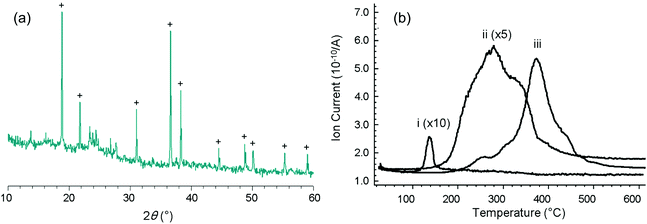
To study the template effect of heavier alkaline earth metal fluorides, we prepared ternary FeF3–CaF2 and FeF3–SrF2 materials following the same route as that applied to FeF3–MgF2.5 Preparation of a ternary FeF3–BaF2 material was also considered. However, instead of the expected BaF2, a Ba(NO3)2 phase was identified from the XRD pattern of the xerogel (Fig. 4(a)). The existence of Ba(NO3)2 indicated ion exchange between the precursors, iron nitrate and the barium acetate. In other FeF3–alkaline earth metal fluoride systems, a similar ion exchange was evidenced by thermal analysis results (Fig. 4(b)). Release of NO+ (m/z = 30), a decomposition product of the nitrate, happens at different temperatures in different systems (FeF3–MgF2: ∼140 °C; FeF3–CaF2: ∼280 °C; FeF3–SrF2: ∼380 °C). The different decomposition temperatures clearly refer to different intermediate nitrate species. It is known that the thermal stability of alkaline earth metal nitrates increases with the atomic number.21 Thus these species can be assigned to Mg(NO3)2, Ca(NO3)2, and Sr(NO3)2, respectively. The ion exchange between iron nitrate and alkaline earth metal acetate probably results in these intermediate nitrate species. The general reaction pathway of this type of ternary fluorides is therefore summarised as follows: the mixed precursors undergo fast ion exchange followed by the two-step fluorination in which the alkaline earth metal fluoride works as a template, and finally give rise to the ternary fluorides (Fig. 5).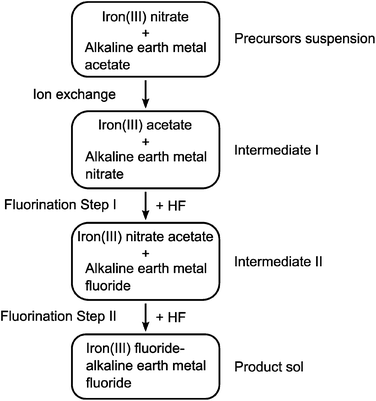 | ||
| Fig. 5 Schematic illustration of the general formation pathway of ternary iron(III) fluoride–alkaline earth metal fluoride. | ||
The discovery of the ion exchange step not only provides important information on the formation pathway of this ternary fluoride system but also allows to predict the template effect of alkaline earth metal fluorides. Calculating the Gibbs free energy of the fluorination of alkaline earth metal nitrates with HF (Table 1) indicates that the formation of alkaline earth metal fluorides becomes less favoured with increasing the atomic number. As a consequence, the alkaline earth metal fluorides may lose their priority in the fluorination Step I (Fig. 5). Thus it can be predicted that the template effect may become less significant with increasing the atomic number of the alkaline earth metals in the ternary fluoride catalysts. To evaluate the template effect, we characterised the textural structure and surface acidity of FeF3–CaF2 and FeF3–SrF2 catalysts since these features are largely affected by the template effect.
| ΔrG (kJ mol−1) | |
|---|---|
| Mg(NO3)2 | −92.3 |
| Ca(NO3)2 | −43.4 |
| Sr(NO3)2 | 4.6 |
| Ba(NO3)2 | 25.2 |
The textural structures of FeF3–CaF2 and FeF3–SrF2 catalysts were determined by STEM and N2 adsorption–desorption measurements. One can roughly estimate the average particle size of different catalysts from the STEM images: FeF3–SrF2 > FeF3–CaF2 (Fig. 6). The differences in particle size may result in differences in the porous structure of the ternary fluoride materials, since the voids between particles contribute to the pore volume. Indeed, the average pore size of FeF3–SrF2 catalysts is almost two times as large as that of FeF3–CaF2 catalysts (Table 2, Column 3). Comparing all three ternary fluoride catalysts, their surface area and pore size decrease with the atomic number of the alkaline earth metal (Table 2, Columns 2 and 3). Taking the data of the corresponding alkaline earth metal fluorides as references, MgF2 and CaF2 showed a stronger influence in tuning the pore size of the ternary fluoride catalysts while SrF2 hardly affects the pore size of FeF3–SrF2. The results confirmed that the template effect of alkaline earth metal fluorides in the aspect of controlling the porosity of the ternary catalysts declines from MgF2 to SrF2.
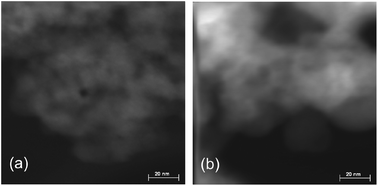 | ||
| Fig. 6 STEM images (scale bar: 20 nm) of (a) FeF3–CaF2 and (b) FeF3–SrF2. The contrast ratios of the images were adjusted for better viewing. | ||
| Sample | B.E.T. surface area (m2 g−1) | Average pore diameter (nm) | Surface Lewis acidity | Surface Brønsted acidity |
|---|---|---|---|---|
| FeF3–MgF2 (ref. 5) | 400–500 | 2–5 | Strong | Medium strong |
| FeF3–CaF2 | ca. 200 | 5–15 | Strong sites ≈ weak sites | Weak/medium strong |
| FeF3–SrF2 | ca. 100 | 10–30 | Strong sites ≪ weak sites | Weak/medium strong |
| FeF3 | 40–70 | ca. 30 | ||
| MgF2 | 240–260 | 2–3 | ||
| CaF2 | ca. 250 | 2–3 | ||
| SrF2 | ca. 130 | 2–3 |
Surface acidity of the FeF3–CaF2 and FeF3–SrF2 catalysts was studied by IR spectroscopy equipped with chemisorption devices. Different probe molecules (NH3, pyridine, and CD3CN) were used to determine the type and strength of surface acid sites (Lewis or Brønsted). Fig. 7 shows the chemisorption-IR spectra of samples after saturation with NH3. Since the spectra are the subtractions of spectra after/before chemisorption, the negative bands at 1258–1260 cm−1 are probably due to the decline of residual acetate band after NH3 adsorption. The 1410 cm−1 band in Fig. 7(a) can be assigned to protonated NH4+ species which indicate Brønsted acidity.22 This band shifts towards the lower wavenumber range (Δδ = 26 cm−1) compared with that in the spectra of FeF3–MgF2;5 it suggests that the Brønsted acidity of FeF3–CaF2 is probably weaker than that of FeF3–MgF2. The vibration band at 1222 cm−1 and the shoulder at 1183 cm−1 can be assigned to NH3 species that coordinates to the surface Lewis acid sites.22 The broad peak at a lower wavenumber range (1134–1124 cm−1) corresponds to H-bonding –OH⋯NH3 species which typically refer to weak Brønsted acid sites.22
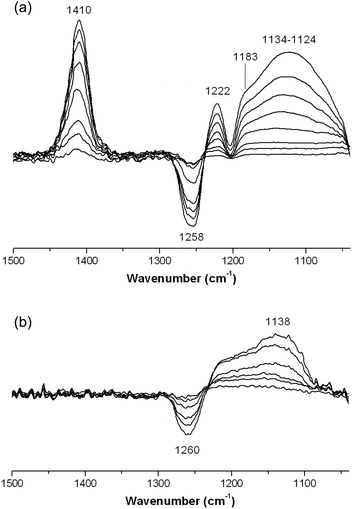 | ||
| Fig. 7 Chemisorption-IR spectra of (a) FeF3–CaF2 and (b) FeF3–SrF2 after saturating stepwise with NH3. | ||
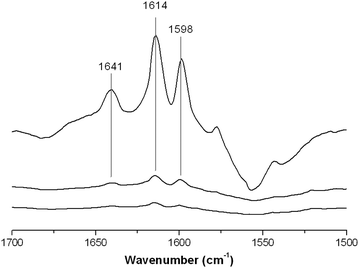
With NH3 as a probe molecule, both Lewis and Brønsted acid sites were determined on the surface of FeF3–CaF2. However, the differential spectra of FeF3–SrF2 show only one positive band at 1138 cm−1 indicating the H-bonding species that correspond to weak Brønsted sites (Fig. 7(b)).22 No vibration bands corresponding to protonated NH4+ were recorded in the spectra. This is an indication that the Brønsted sites of FeF3–SrF2 are not strong enough to protonate NH3. It cannot be ruled out that the protonated NH4+ species require adjacent –OH for stabilisation,23 although there is only a low coverage of hydroxyls (potential Brønsted sites) on the FeF3–SrF2 surface. Because pyridine is a stronger base than NH3 in the gas phase (proton affinity in the gas phase: pyridine 922.2 kJ mol−1; NH3 857.7 kJ mol−1),24 pyridine was used as a probe molecule to investigate FeF3–SrF2. The two bands at 1641 and 1614 cm−1 in the differential spectra of FeF3–SrF2 can be assigned to protonated (PyH+) and coordinated (PyrL) species, respectively (Fig. 8).25 These bands arise from the vibration mode 8a of pyridine.26 The band at 1598 cm−1 refers to H-bonding species on both Lewis and Brønsted sites.25 Thus FeF3–SrF2 was confirmed to carry both Brønsted and Lewis acid sites on the surface, but its Brønsted acidity is weaker than that of FeF3–CaF2 and FeF3–MgF2.
CD3CN was used as a probe molecule to distinguish the strengths of Lewis acid sites on the surface of FeF3–CaF2 and FeF3–SrF2. The vibration band at 2313–2318 cm−1 refers to strong Lewis acid sites, while the band in the lower wavenumber range (about 2260–2290 cm−1) indicates weak Lewis sites.25,27 Interestingly, a decreasing tendency in Lewis acidity can be seen in the order of Mg, Ca, and Sr. Strong Lewis acid sites are predominant on the surface of FeF3–MgF2.5 On the surface of FeF3–CaF2, the strong and weak Lewis sites co-exist and the intensities of the corresponding bands are comparable (Fig. 9(a)). In contrast, weak Lewis acid sites are the main species (major characteristic) of the surface of FeF3–SrF2 (Fig. 9(b)). The bands at 2114–2118 cm−1 correspond to the symmetric CD3 stretching,27 and the weak bands at about 2220–2260 cm−1 can be assigned to physisorbed species.27 The so-called trio bands (three bands at 2890, 2400, and 1700 cm−1)25 that correspond to very strong Brønsted acidity are not observed in these spectra, probably because the surface Brønsted acid sites of FeF3–CaF2 or FeF3–SrF2 are not strong enough to protonate CD3CN.
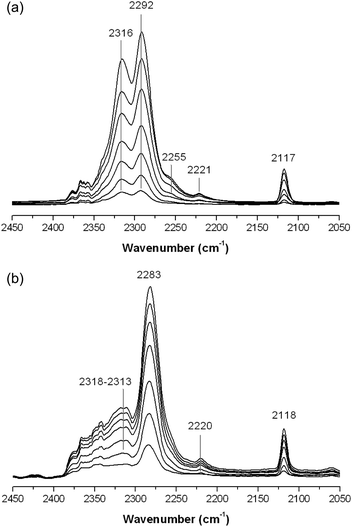 | ||
| Fig. 9 Chemisorption-IR spectra of (a) FeF3–CaF2 and (b) FeF3–SrF2 after saturating stepwise with CD3CN. | ||
In short, with the help of chemisorption-IR, medium strong Brønsted acid sites were determined on the surface of all three ternary fluoride catalysts with the Brønsted acidity decreasing with the atomic number of alkaline earth metal. Since the template effect of the alkaline earth metal fluoride is believed to contribute to the Brønsted acidity, the results support the hypothesis that the template effect declines from Mg to Sr. Moreover, the Lewis acidity shows a similar trend: strong Lewis acid sites are predominant on the FeF3–MgF2 surface, while weak Lewis sites are the main species on the surface of FeF3–SrF2, the surface acidity of FeF3–CaF2 lies in between with both strong and weak Lewis acidity. Thus the strengths of Lewis/Brønsted sites can be easily tuned using different alkaline earth metal fluorides as matrices, which allows us to fine-tune catalysts with the desired surface acidity.
2.4. Catalytic tests
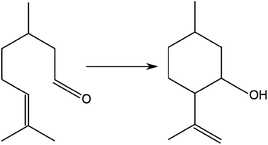
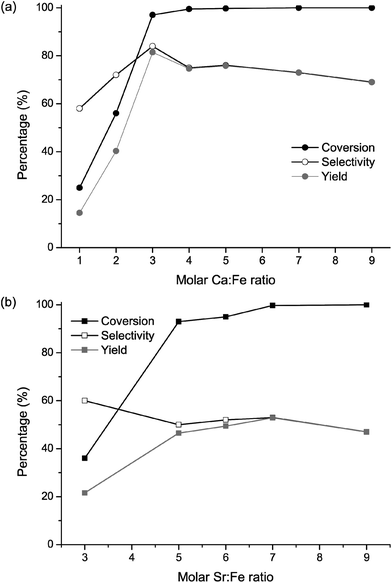
The isomerisation of citronellal to isopulegol was used as a model reaction to evaluate the catalytic performance of FeF3–CaF2 and FeF3–SrF2 samples. This reaction is one of the key steps in synthesising menthol,22,28 which is widely used in drugs, cosmetics, and food additives.29 It represents an intramolecular carbonyl–ene reaction, in which an allylic hydrogen (an “ene”) reacts with a carbonyl (an “enophile”) to form a new bond with the migration of the ene double bond and 1,5-hydrogen shift (Fig. 10).30–32 Early studies of the reaction mechanism suggested that it is catalysed by Lewis acids, and later studies revealed that it actually requires the participation of both Lewis and Brønsted acid sites to achieve high yields towards isopulegol.33,34 Thus the isomerisation reaction of citronellal can be used as an excellent model reaction to examine the surface acidity of especially bi-acidic catalysts.A panel of FeF3–CaF2 and FeF3–SrF2 catalysts with varying Ca (or Sr)-to-Fe ratios was prepared. The catalytic results of FeF3–CaF2 samples are presented in Fig. 11(a). Both conversion and selectivity increased drastically for the Ca-to-Fe ratio between 1 and 4. At higher ratios, the conversion reached nearly 100% and hence no further increase can be expected. The FeF3–CaF2 sample with a Ca-to-Fe ratio of 3 shows the highest yield towards isopulegol with a conversion of 97% and a selectivity of 84%, which is comparable to that of FeF3–MgF2 samples (conversion ca. 100% and selectivity ca. 85%).5 Evidently, the Ca-to-Fe ratio has a strong influence on the performance of FeF3–CaF2 catalysts. This can be rationalized by considering the template effect of CaF2: adjusting the Ca-to-Fe ratio may affect the template effect of CaF2 which further influences the surface properties of FeF3–CaF2; and the surface properties are crucial for the heterogeneous catalysis process.
In comparison with FeF3–MgF2 and FeF3–CaF2, the FeF3–SrF2 samples are less selective in this reaction. The conversion of citronellal reached its maximum of nearly 100% at the Sr-to Fe ratio of 7 (Fig. 11(b)). The selectivity to isopulegol, however, was noticeably lower than that of the FeF3–MgF2 or FeF3–CaF2 catalysts. One possible reason is that FeF3–SrF2 exhibits weaker surface Brønsted acidity and therefore is less selective to isopulegol. Moreover, Chuah et al. studied the correlation between pore size and selectivity to isopulegol and found that micropores or small mesopores are favourable for higher selectivity, because they may exclude large by-products such as dimers or trimers of isopulegol.34 Our previous work on FeF3–MgF2 confirmed this conclusion.5 Thus the larger average pore diameter of FeF3–SrF2 (10–30 nm) may make it less competitive for the formation of isopulegol.
3. Experimental
3.1. Preparation of FeF3–MgF2, FeF3–CaF2, and FeF3–SrF2 catalysts
The detailed synthesis route of FeF3–MgF2 has been described in our previous work.5The syntheses of FeF3–CaF2 and FeF3–SrF2 catalysts followed a similar route to that of FeF3–MgF2. The alkaline earth metal acetate (Ca(CH3COO)2·H2O or Sr(CH3COO)2·0.5H2O, Sigma-Aldrich, 97%) was used as received. It was added to the pre-dehydrated iron nitrate precursor (Fe(NO3)3·9H2O, Sigma-Aldrich, 98%; the pre-dehydration process has been described by Guo et al.5) at different Ca (or Sr)-to-Fe ratios. The mixed precursors were suspended in methanol (total concentration of metals: 0.2 mol L−1) and fluorinated with stoichiometric amounts of HF in a methanolic solution. The obtained sol or suspension was aged for 14–16 h at room temperature, and then dried and calcined at 100 °C in vacuo for 2 h.
Caution: HF solution is highly hazardous and special protective wear is required!
CaF2 and SrF2 were also prepared via the sol–gel process. The syntheses followed the same route as that applied for FeF3–CaF2 or FeF3–SrF2 catalysts but without an Fe-precursor.
3.2. Elemental analysis (C, H, N, and F analyses)
The C, H, and N concentrations were determined with a Leco CHNS-932 analyser. The F concentration was determined with a fluoride-sensitive electrode after digesting the sample by fusion with soda-potash.3.3. Powder X-ray diffraction (XRD)
The XRD patterns were obtained from an XRD-7 Seifert-FPM diffractometer using a CuKα beam.3.4. Thermal analysis
Thermal analysis was performed by using Netzsch-STA-409C/CD coupled with Balzers-QMG-422-Quadrupole-Mass spectrometry. Both TG curves and the m/z ratio of the fragments were recorded during measurements.3.5. Scanning transmittance electron microscope (STEM)
The ternary FeF3–MgF2 sample was re-suspended in methanol (2–3 mg mL−1). A Lacey carbon film (Cu-networks, 300 meshes) was dipped in the sample suspension and dried in air. The STEM images were recorded with a Joel JEM-2200FS Transmission Electron Microscope using a 200 kV field emission gun (FEG) and a high angle annular dark field detector (HAADF).3.6. X-ray photoelectron spectroscopy (XPS)
The XPS measurements were carried out with an ESCALab 200X photoelectron spectrometer (VG Scientific, U.K.) for all samples. XP survey spectra were recorded at an angle of emission of 0° using non-monochromatised Al Kα excitation (15 kV, 20 mA) using the analyser in the constant retard ratio mode with CRR = 10 for survey scans and in the constant analyzer energy mode with CAE = 20 eV for highly resolved spectra. The samples were analysed under high vacuum (<10−8 mbar). The binding energy scale of the instrument was calibrated following ISO 15472. The binding energy scale was corrected for static charging using BE = 285.0 eV for the C 1s component of aliphatic carbon originating from absorbed hydrocarbons. Quantification was performed using a routine implemented in the Thermo Advantage 4.43 software. The routine uses Scofield's photoionisation cross section data for the determination of relative sensitivity factors. This quantification routine uses the model of homogeneous and isotropic distribution of all constituents in the analyzed volume. The estimated IMFP was calculated with the Gries (G-1) equation using the NIST Electron IMFP Database Version 1.2.353.7. N2 physisorption
N2 physisorption at 77 K was measured with a Micromeritics ASAP 2020 instrument. Samples were degassed at 80 °C under high vacuum for 12 h. The specific surface area was calculated using the B.E.T. equation, and the pore size distribution was determined by the B.J.H. method.3.8. Chemisorption-IR
For the IR spectroscopy coupled with chemisorption of probe molecules (chemisorption-IR), about 25–30 mg sample was pressed at 1 ton into a self-supporting disc (2 cm2 area) for IR analysis. The sample disc was placed on a quartz cell equipped with KBr windows. The cell was connected to a vacuum line and a glass injection loop. A movable quartz sample holder allows adjusting the sample disc in the infrared beam for spectra acquisition and to displace it into a furnace at the top of the cell for thermal activation of the samples. The cell was connected to a vacuum line and a glass injection loop. After we activated the sample at 80 °C under vacuum, different probe molecules were added in steps by small doses. The amount of injected probe molecules was regulated by the valves. The IR spectra were recorded on a Thermo Scientific Nicolet iS10 spectrometer.3.9. Catalysis
A citronellal isomerisation reaction was performed in a Thermomixer comfort (Eppendorf) equipped with glass tubes. The samples were heated at 80 °C in vacuo for 2 h before use to remove the surface impurities. Different amounts of fluoride samples were added to the reactant mixture (0.2 mL citronellal (Acros, 93%) solved in 2 mL toluene (Acros, 99.99%), and 0.1 mL undecane (Sigma-Aldrich, ≥99%) as the internal standard for GC evaluation). The glass tubes were sealed and maintained at 80 °C for 6 h. After the reaction, the catalysts were separated by filtration and the products were analysed by GC (Shimadzu GC-2010 with an HP-1 column of 100 m × 0.25 mm × 0.5 μm, temperature programming: starting temperature 120 °C, hold time 50 min, rate 15 °C min−1, end temperature 270 °C, hold time 5 min).4. Conclusion
The structural and surface characterisation of the FeF3–MgF2 catalysts revealed that MgF2 strongly influences the porous structure and the chemical environment around the Fe atoms, and probably contributes to the enhanced Brønsted acidity of FeF3–MgF2. The investigation on the formation pathway of FeF3–MgF2 concludes for the first time a template effect of the MgF2, which explains the role of the MgF2 matrix in the FeF3–MgF2 catalysts. The template effect was introduced during the fluorination of mixed Mg2+ and Fe3+ precursors. During this step, Mg2+ becomes selectively fluorinated, forming dominantly MgF2 particles in the sol, whereas fluorination of the Fe-precursor proceeds afterwards. The discovery of this template effect is essential for tuning the porosity and surface acidity of FeF3–MgF2 catalysts and inspired us to investigate other ternary FeF3-based catalysts with heavier alkaline earth metal fluorides as matrices.In light of this background, FeF3–CaF2 and FeF3–SrF2 catalysts were successfully prepared via the fluorolytic sol–gel route and for CaF2 and SrF2 the template effect was evidenced based on structural and surface characterisation as well. Using different alkaline earth metal fluorides as matrices significantly changed the porosity, and a systematic trend of increasing average pore size was observed whereas the surface area decreased with the atomic number of alkaline earth metals. Both Lewis and Brønsted acid sites were detected on the surface of FeF3–CaF2 and FeF3–SrF2 by chemisorption-IR. Notably, by comparing all three ternary fluoride catalysts, the FeF3–SrF2 showed weaker Brønsted acidity and much weaker Lewis acidity than FeF3–CaF2 and FeF3–MgF2. Thus the template effect decreases with increasing atomic number of the alkaline earth metal. The results confirmed the importance of the template effect of matrix materials in the ternary fluoride catalysts.
In short, the ternary iron(III) fluoride-based catalysts exhibit great potential in heterogeneous catalysis due to their pronounced and adjustable surface acidity and flexibility in preparation. This work highlights for the first time the template effect of the matrix materials in tuning the surface properties of the catalysts. It furthermore shows the feasibility of adjusting the surface properties of the catalysts by varying the matrix material or the alkaline earth metal to iron ratio or both. This fluorolytic synthesis approach opens access to next-generation catalysts based on ternary metal fluorides with adjustable surface properties.
Acknowledgements
The authors would like to thank Dr Holm Kirmse for taking the STEM images, Dr Micheal Feist for performing the thermal analysis, and Dr Katharina Teinz and Larisa Schimdt for the fruitful discussion. Y. Guo thanks the Chinese Scholarship Council (CSC) for a PhD scholarship.References
- S. M. Coman, S. Wuttke, A. Vimont, M. Daturi and E. Kemnitz, Adv. Synth. Catal., 2008, 350, 2517–2524 CrossRef CAS.
- S. M. Coman, P. Patil, S. Wuttke and E. Kemnitz, Chem. Commun., 2009, 460–462 RSC.
- S. Wuttke, S. M. Coman, J. Kröhnert, F. C. Jentoft and E. Kemnitz, Catal. Today, 2010, 152, 2–10 CrossRef CAS PubMed.
- N. Candu, S. Wuttke, E. Kemnitz, S. M. Coman and V. I. Parvulescu, Appl. Catal., A, 2011, 391, 169–174 CrossRef CAS PubMed.
- Y. Guo, P. Gaczyński, K.-D. Becker and E. Kemnitz, ChemCatChem, 2013, 5, 2223–2232 CrossRef CAS.
- I. Agirrezabal-Telleria, F. Hemmann, C. Jäger, P. L. Arias and E. Kemnitz, J. Catal., 2013, 305, 81–91 CrossRef CAS PubMed.
- K. Tanabe and W. F. Hölderich, Appl. Catal., A, 1999, 181, 399–434 CrossRef CAS.
- K. Wilson and J. H. Clark, Pure Appl. Chem., 2000, 72, 1313–1319 CrossRef CAS.
- Y. Guo, S. Wuttke, A. Vimont, M. Daturi, J.-C. Lavalley, K. Teinz and E. Kemnitz, J. Mater. Chem., 2012, 22, 14587–14593 RSC.
- S. Wuttke, S. M. Coman, G. Scholz, H. Kirmse, A. Vimont, M. Daturi, S. L. M. Schroeder and E. Kemnitz, Chem. – Eur. J., 2008, 14, 11488–11499 CrossRef CAS PubMed.
- I. Agirrezabal-Telleria, Y. Guo, F. Hemmann, P. L. Arias and E. Kemnitz, Catal. Sci. Technol., 2014, 4, 1357–1368 CAS.
- A. Negoi, S. Wuttke, E. Kemnitz, D. Macovei, V. I. Parvulescu, C. M. Teodorescu and S. M. Coman, Angew. Chem., Int. Ed., 2010, 49, 8134–8138 CrossRef CAS PubMed.
- A. Negoi, K. Teinz, E. Kemnitz, S. Wuttke, V. Parvulescu and S. Coman, Top. Catal., 2012, 55, 680–687 CrossRef CAS.
- S. Wuttke, A. Negoi, N. Gheorghe, V. Kuncser, E. Kemnitz, V. Parvulescu and S. M. Coman, ChemSusChem, 2012, 5, 1708–1711 CrossRef CAS PubMed.
- K. Siegbahn and K. Edvarson, Nucl. Phys., 1956, 1, 137–159 CrossRef CAS.
- M. Kasrai and D. S. Urch, J. Chem. Soc., Faraday Trans. 2, 1979, 75, 1522–1531 RSC.
- A. V. Naumkin, A. Kraut-Vass, S. W. Gaarenstroom and C. J. Powell, NIST X-ray Photoelectron Spectroscopy Database, NIST Standard Reference Database 20, Version 4.1, National Institute of Standards and Technology, Gaithersburg, MD., U.S.A., 2012 Search PubMed.
- B. J. Tan, K. J. Klabunde and P. M. A. Sherwood, Chem. Mater., 1990, 2, 186–191 CrossRef CAS.
- N. S. McIntyre and D. G. Zetaruk, Anal. Chem., 1977, 49, 1521–1529 CrossRef CAS.
- E. Paparazzo, J. Phys. D: Appl. Phys., 1987, 20, 1091 CrossRef CAS.
- A. F. Holleman and E. Wiberg, Lehrbuch der Anorganischen Chemie, Walter de Gruyter, Berlin, New York, 2007 Search PubMed.
- A. A. Tsyganenko, D. V. Pozdnyakov and V. N. Filimonov, J. Mol. Struct., 1975, 29, 299–318 CrossRef CAS.
- E. H. Teunissen, R. A. Van Santen, A. P. J. Jansen and F. B. Van Duijneveldt, J. Phys. Chem., 1993, 97, 203–210 CrossRef CAS.
- A. Auroux, Acidity and Basicity, Springer-Verlag, Heidelberg, 2008 Search PubMed.
- G. Ertl, H. Knözinger and J. Weitkamp, Handbook of Heterogeneous Catalysis, Wiley-VCH, Weinheim, 2008 Search PubMed.
- D. Cook, Can. J. Chem., 1961, 39, 2009–2024 CrossRef CAS.
- A. G. Pelmenschikov, R. A. van Santen, J. Janchen and E. Meijer, J. Phys. Chem., 1993, 97, 11071–11074 CrossRef CAS.
- J. C. Leffingwell and R. E. Shackelford, Cosmetics Perfumery, 1974, 89, 69–89 CAS.
- D. H. Pybus and C. S. Sell, The Chemistry of Fragrances, RSC Paperbacks, Cambridge, 1999 Search PubMed.
- B. B. Snider, M. Karras, R. T. Price and D. J. Rodini, J. Org. Chem., 1982, 47, 4538–4545 CrossRef CAS.
- W. Oppolzer and V. Snieckus, Angew. Chem., Int. Ed. Engl., 1978, 17, 476–486 CrossRef.
- H. M. R. Hoffmann, Angew. Chem., Int. Ed. Engl., 1969, 8, 556–577 CrossRef CAS.
- Z. Yongzhong, N. Yuntong, S. Jaenicke and G.-K. Chuah, J. Catal., 2005, 229, 404–413 CrossRef PubMed.
- G. K. Chuah, S. H. Liu, S. Jaenicke and L. J. Harrison, J. Catal., 2001, 200, 352–359 CrossRef CAS.
- C. J. Powell and A. Jablonski, NIST Electron Inelastic-Mean-Free-Path Database, Version 1.2, SRD71, National Institute of Standards and Technology, Caithersburg, MD, 2010 Search PubMed.
Footnote |
| † Electronic supplementary information (ESI) available. See DOI: 10.1039/c4dt03229b |
| This journal is © The Royal Society of Chemistry 2015 |

