 Open Access Article
Creative Commons Attribution 3.0 Unported Licence
Versatile properties of CaGd2ZnO5:Eu3+ nanophosphor: its compatibility for lighting and optical display applications
G.
Seeta Rama Raju
 ,
E.
Pavitra
,
Goli
Nagaraju
and
Jae Su
Yu
*
,
E.
Pavitra
,
Goli
Nagaraju
and
Jae Su
Yu
*
Department of Electronics and Radio Engineering, Kyung Hee University, 1 Seocheon-dong, Giheung-gu, Yongin-si, Gyeonggi-do 446-701, Republic of Korea. E-mail: jsyu@khu.ac.kr; Fax: +82-31-206-2820; Tel: +82-31-201-3820
First published on 17th November 2014
Abstract
Red color-emitting CaGd2ZnO5:Eu3+ (CGZO:Eu3+) nanophosphors were synthesized by a facile sol–gel process. The structural and luminescent properties of these phosphors were investigated as a function of annealing temperature and Eu3+ ion concentration. The orthorhombic phase was confirmed at different annealing temperatures, showing an irregular morphology within the nanoscale range. Photoluminescence (PL) excitation spectra of CGZO:Eu3+ showed host absorption band (HAB), charge transfer band (CTB), and intense f–f transitions of Eu3+ in the violet and blue wavelength regions. The CTB intensity increased and the HAB intensity decreased with increasing annealing temperature or Eu3+ ion concentration. The CGZO:Eu3+ exhibited a strong absorption in the blue region as compared to the CTB and had a superior property compared to available commercial phosphors. This feature facilitates the fabrication of high color rendering index white light-emitting diodes for display systems. In PL spectra, an intense red emission was observed due to the hypersensitive 5D0→7F2 transition with good asymmetry ratio and chromaticity coordinates. Optimized annealing temperature and concentration of Eu3+ ions were observed for CGZO host lattice based on the 466 nm excitation wavelength. The cathodoluminescent properties were also similar to the PL results.
Introduction
Inorganic oxide phosphors are in increasing demand due to their potential applications in different fields such as biomedical applications, plasma display panels, light-emitting diodes (LEDs), cathode ray tubes, fingerprint detection, sensors, etc.1–10 With the emerging global energy crisis, solid-state lighting-based white LEDs (WLEDs) have made tremendous progress over the past decade due to their good luminous efficiency, low power consumption, reliability, and environmental friendliness.6,11 Among different kinds of WLEDs, phosphor-converted WLEDs (pc-WLEDs) are extensively used and are very important because they significantly reduce global power requirements and the use of fossil fuels.12 These pc-WLEDs are fabricated by coating yellow phosphor on the surface of InGaN/GaN blue LED chips, but they have poor color rendering index (CRI) caused by color deficiency in the red region.12 Currently, red phosphors used for GaN-based LEDs are nitridosilicate and sulfide phosphors. Nitrodosilicate phosphor exhibits a very broad and deep red emission that does not have a high luminous efficacy of radiation,11 and sulfide phosphor shows a chemical instability and low efficiency.13 The commercially available red color-emitting oxide phosphor of Y2O3:Eu3+ has stable physical and chemical properties, but it has weak absorption in the blue region. Therefore, the availability of red phosphors under blue light excitation continues to be a challenge. In this context, our efforts have been focused on the development of a physically and chemically stable red color-emitting oxide phosphor with strong absorption in the blue wavelength region.In recent times, different kinds of oxide host materials, such as silicates,14 phosphates,15 molybdates,3 tungstates,16 titanates,17 zirconates,18etc., have been explored for obtaining different kinds of emissions in the visible region. Among the oxide phosphors, binary1 and ternary17 compounds have been studied extensively. However, nowadays, oxide-based quaternary compounds are emerging as attention grabbing phosphors. For instance, A4RE6(XO4)6O2![[thin space (1/6-em)]](https://www.rsc.org/images/entities/char_2009.gif) 14 and ARE2MO5
14 and ARE2MO5![[thin space (1/6-em)]](https://www.rsc.org/images/entities/char_2009.gif) 19 (A = alkaline earth elements, RE = rare earth elements, X = Si or P, and M = Co, Ni, Cu, Zn, Pd or Pt) compounds are established as having the desired luminescent properties for the fabrication of efficient optical systems. Xu et al.20 reported a novel CaGd2ZnO5 (CGZO) host lattice with GdO7, CaO11, and ZnO5 polyhedral units based on the ARE2MO5 structure, Mishra et al.21 studied the limited luminescent properties of CGZO:Eu3+, but no other reports have been found on this host lattice. The main advantage of CGZO host lattice is the strong blue absorption when doped with Eu3+ ions as compared to the commercial Y2O3:Eu3+ phosphors.
19 (A = alkaline earth elements, RE = rare earth elements, X = Si or P, and M = Co, Ni, Cu, Zn, Pd or Pt) compounds are established as having the desired luminescent properties for the fabrication of efficient optical systems. Xu et al.20 reported a novel CaGd2ZnO5 (CGZO) host lattice with GdO7, CaO11, and ZnO5 polyhedral units based on the ARE2MO5 structure, Mishra et al.21 studied the limited luminescent properties of CGZO:Eu3+, but no other reports have been found on this host lattice. The main advantage of CGZO host lattice is the strong blue absorption when doped with Eu3+ ions as compared to the commercial Y2O3:Eu3+ phosphors.
In this paper, we reported the phase stability and annealing temperature effect on the transmittance and luminescent properties of CGZO:Eu3+ nanophosphors obtained via a sol–gel process for the first time. The structural, morphological, and optical properties were evaluated by X-ray diffraction (XRD) patterns, scanning electron microscope (SEM) images, and UV-visible transmittance spectra, respectively. The photoluminescent excitation (PLE), photoluminescence (PL) emission, and low-voltage electron beam excitation-based cathodoluminescent (CL) properties were investigated. To examine the emission richness, the synthesized CGZO:Eu3+ phosphors were compared with the commercially available Y2O3:Eu3+ and YAG:Ce3+ phosphors under similar measurement conditions.
Experimental
Eu3+ ion-activated CGZO nanophosphors were prepared by means of a facile sol–gel method. Stoichiometric amounts of high purity (Sigma-Aldrich) grade calcium nitrate tertrahydrate [Ca(NO3)2·4H2O], gadolinium nitrate hexahydrate [Gd(NO3)3·6H2O], europium nitrate pentahydrate [Eu(NO3)3·5H2O], zinc nitrate hexahydrate [Zn(NO3)2·6H2O] and citric acid [HOC(COOH)(CH2COOH)2] were used. First, a solution was prepared by dissolving 1 M of Ca(NO3)2·4H2O, 2(1 − x) M of Gd(NO3)3·6H2O, 2x M of Eu(NO3)3·5H2O, and 1 M Zn(NO3)2·6H2O in 200 ml de-ionized water. After few minutes of stirring, 8 M of citric acid (1![[thin space (1/6-em)]](https://www.rsc.org/images/entities/char_2009.gif) :
:![[thin space (1/6-em)]](https://www.rsc.org/images/entities/char_2009.gif) 2 ratio of metal ions and citric acid) was added to the metal ions solution and stirring was continued for a minimum of 2 h without heating for the formation of a homogeneous solution. In order to get homogeneous heating of the solution in the beaker, the beaker was closed with a cap and then the solution was heated on a hot plate at 80 °C (solution temperature) with continued magnetic stirring for 1 h. After opening the cap, the solution was evaporated gradually and a yellowish wet gel was formed. The obtained wet gel was dried at 120 °C in an oven for 12 h, and thus a porous solid matrix called xerogel was formed due to liquid expulsion from the pores (syneresis) and capillary pressure-related substantial matrix shrinkage. This xerogel was decomposed to give black-colored flakes with extremely fine particle size on further heating at 400 °C for 3 h. The resulting sample was further annealed at different temperatures ranging from 800 to 1250 °C for 5 h.
2 ratio of metal ions and citric acid) was added to the metal ions solution and stirring was continued for a minimum of 2 h without heating for the formation of a homogeneous solution. In order to get homogeneous heating of the solution in the beaker, the beaker was closed with a cap and then the solution was heated on a hot plate at 80 °C (solution temperature) with continued magnetic stirring for 1 h. After opening the cap, the solution was evaporated gradually and a yellowish wet gel was formed. The obtained wet gel was dried at 120 °C in an oven for 12 h, and thus a porous solid matrix called xerogel was formed due to liquid expulsion from the pores (syneresis) and capillary pressure-related substantial matrix shrinkage. This xerogel was decomposed to give black-colored flakes with extremely fine particle size on further heating at 400 °C for 3 h. The resulting sample was further annealed at different temperatures ranging from 800 to 1250 °C for 5 h.
XRD patterns of the CGZO:Eu3+ phosphor powders after annealing at different temperatures were recorded using a Mac Science (M18XHF-SRA) X-ray powder diffractometer with Cu Kα radiation (1.5406 Å). The morphology of the samples was examined by using a field emission SEM (Zeiss, LEO SUPRA 55), fitted with an energy dispersive X-ray spectrometer. The transmittance spectra of CGZO:Eu3+ phosphors as a function of annealing temperature were measured using a CARY 300 Bio (Varian) UV-visible spectrophotometer. The room-temperature PL and PLE spectra were measured using a Photon Technology International (PTI, USA) fluorimeter with a Xe arc lamp of 60 W power and the lifetime was measured with a phosphorimeter attachment to the main system with a Xe flash lamp (25 W power). The quantum yield measurement as a function of excitation wavelength was carried out using a fluorescence spectrophotometer equipped with integrating sphere (Hamamatsu Photonics C9920-02). The CL properties were measured by a Gatan (UK) MonoCL3 system attached to a scanning electron microscope (Hitachi S-4300 SE).
Results and discussion
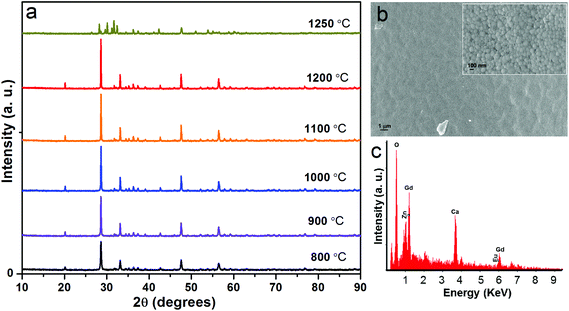
In order to examine the structural properties, initially, 5 mol% Eu3+ ion-doped CGZO (CGZO:5Eu3+) phosphors were synthesized at different annealing temperatures. Fig. 1(a) shows the XRD patterns of CGZO:5Eu3+ phosphors obtained at different annealing temperatures ranging from 800 to 1250 °C. Very recently, Xu et al.20 reported the novel CGZO host lattice, and so its JCPDS card is not available. As the annealing temperature increased from 800 to 1200 °C, the XRD patterns were in good agreement with those of Xu et al., and confirmed the orthorhombic phase of typical CGZO diffraction peaks with the space group of Pbnm. However, on increasing the annealing temperature over 1200 °C, the Gd2O3 monoclinic phase was dominant along with the presence of ZnO peaks. Therefore, the optimum annealing temperature for the CGZO:5Eu3+ phosphor was found to be 1200 °C. Furthermore, using the intense diffraction peaks, the crystallite sizes were calculated by the Scherrer equation of Dhkl = kλ/βcos![[thin space (1/6-em)]](https://www.rsc.org/images/entities/char_2009.gif) θ, where D is the average crystallite size, λ is the X-ray wavelength (1.5406 Å), k is the shape factor (0.9), β is the full width at half maximum, and θ is the diffraction angle of an observed peak. The average crystallite sizes were 42.2, 51.05, 66.75, 80, and 86.7 nm at 800, 900, 1000, 1100, and 1200 °C. Fig. 1(b) shows the low- and high-resolution SEM images of the CGZO:5Eu3+ phosphors, which show an irregular morphology with nanometer sized particles. Fig. 1(c) shows the energy dispersive X-ray (EDX) spectrum. This confirmed the presence of Ca, Gd, Eu, Zn, and O elements.
θ, where D is the average crystallite size, λ is the X-ray wavelength (1.5406 Å), k is the shape factor (0.9), β is the full width at half maximum, and θ is the diffraction angle of an observed peak. The average crystallite sizes were 42.2, 51.05, 66.75, 80, and 86.7 nm at 800, 900, 1000, 1100, and 1200 °C. Fig. 1(b) shows the low- and high-resolution SEM images of the CGZO:5Eu3+ phosphors, which show an irregular morphology with nanometer sized particles. Fig. 1(c) shows the energy dispersive X-ray (EDX) spectrum. This confirmed the presence of Ca, Gd, Eu, Zn, and O elements.
Fig. 2 shows the UV-visible transmittance spectra of the CGZO:5Eu3+ phosphors as a function of annealing temperature. It was observed that the transmittance decreased when increasing the annealing temperature up to 1100 °C, indicating the decreased band gap of CGZO:5Eu3+. This lowering of the band gap with increasing annealing temperature was clearly observed between 200 and 260 nm of the transmittance spectra. Here, the absorption peaks were narrowed and absorption edge shifted towards the higher energy region. However, due to the stabilized orthorhombic phase, improved crystallinity, and increased band gap by widening the absorption edge with the doping of Eu3+ ions in the CGZO host lattice, the transmittance increased at 1200 °C. For further clarification, the transmittance spectra of CGZO:5Eu3+ and pure CGZO are shown in the inset of Fig. 2. Furthermore, when the annealing temperature increased to 1250 °C, the transmittance decreased again due to the phase transformation with a dominant monoclinic phase of Gd3+ ions in the CGZO host lattice.
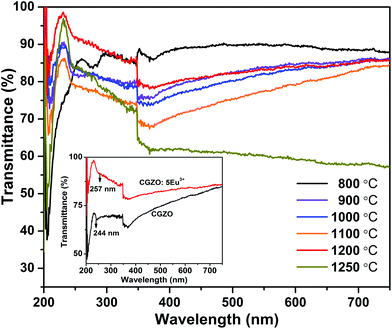 | ||
| Fig. 2 Transmittance spectra of the CGZO:5Eu3+ phosphors obtained at different annealing temperatures (inset shows the transmittance comparison between CGZO host lattice and CGZO:5Eu3+ phosphor). | ||
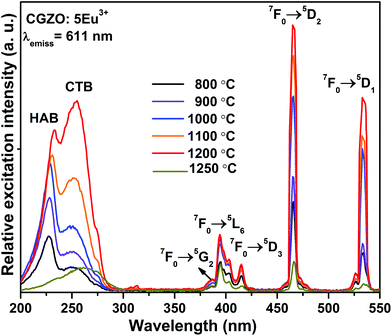
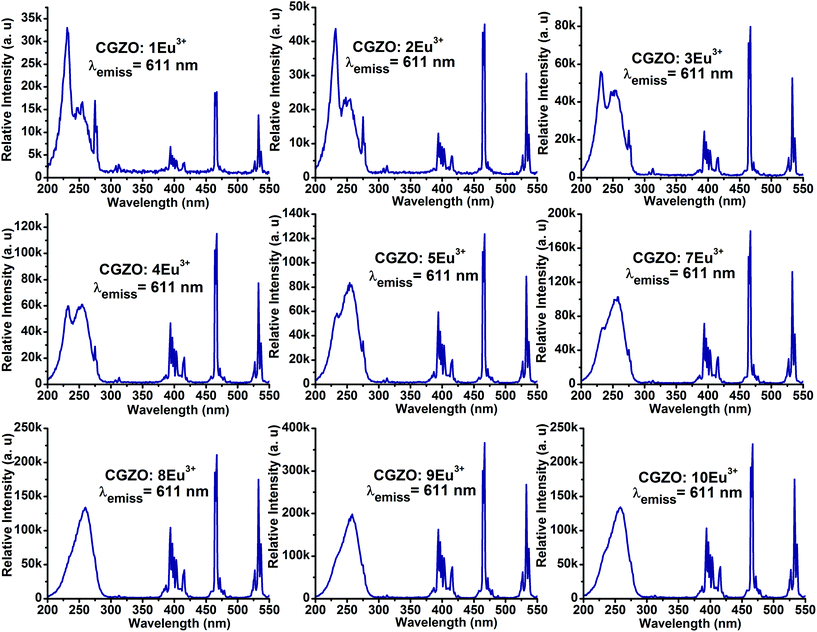
Fig. 3 and 4 show the PLE spectra of the CGZO:Eu3+ phosphors as a function of annealing temperature and Eu3+ ion concentration, respectively, obtained using 611 nm emission wavelength. It is noticeable that the spectral band positions in the lower energy region are similar for both annealing temperature and Eu3+ ion concentration variations. The PLE spectra consist of broad excitation bands such as host absorption band (HAB) and charge transfer band (CTB) with band maxima at 229 and 254 nm, respectively. Generally, the location of these band maxima depends upon the nature of the host lattice. However, in the present work, HAB and CTB positions are in good agreement with the transmittance spectra. The HAB is due to the valence to conduction band excitation,22 and the CTB is produced by the charge transfer between the fully filled 2p orbital of O2− ions and the incompletely filled 4f orbital of Eu3+ ions.14 The CTB is overlapped with the f–f transitions of Gd3+ ions in the higher energy region, which shows very weak intensity at 275 nm (8S7/2→6I11/2), 278 nm (8S7/2→6I9/2), and 313 nm (8S7/2→6P7/2) due to the efficient energy transfer from Gd3+ to Eu3+ ions. The PLE spectra of CGZO:Eu3+ are also composed of narrow excitation bands in the longer wavelength region due to the f–f transitions of Eu3+ ions. The narrow excitation peaks of the intra-configurational f–f transitions of Eu3+ ions are assigned to the electronic transitions of (7F0→5G2) at 385 nm, (7F0→5L6) at 394 nm, (7F0→5D3) at 416 nm, (7F0→5D2) at 466 nm, and (7F0→5D1) at 533 nm. In the PLE spectra, the (7F0→5D2) transition is more intense than the CTB, which is in contrast to the commercial Y2O3:Eu3+ phosphor. The main excitation peaks suggest that the CGZO:Eu3+ phosphors are able to generate red emission by exciting with ultraviolet (UV), near-UV (NUV) and blue laser diode/LED pumping sources.
From the variation of excitation intensities as a function of annealing temperature in Fig. 3, it was observed that the intensities of HAB at 229 nm, (7F0→5L6) at 394 nm, and (7F0→5D2) at 466 nm were much stronger as compared to the CTB when the sample is annealed at 800 °C. While on increasing the annealing temperature from 900 °C to 1200 °C, the strength of the CTB increased and the intensity of HAB decreased due to the improved energy transfer probability from the fully filled 2p orbital of O2− ions and the incompletely filled 4f orbital of the Eu3+ ions. The reason is because the crystallite size of the particles increases and the distance between the O2− and Eu3+ ions decreases with increasing the annealing temperature. However, the (7F0→5L6) and (7F0→5D2) transitions in the longer wavelength region increased continuously with increasing the annealing temperature. It is clear that the CTB intensity increases gradually and totally dominates the HAB after annealing at 1200 °C. The CTB maxima shifted towards the lower energy side, which facilitates the energy transfer from lowest strong absorption band to the hypersensitive transitions of Eu3+ ions.23 This effect is related to an appearance of Eu3+–Eu3+ pairs in the system because of the decrease in the average distance between the Eu3+ ions. This result is also consistent with the transmittance studies, where the transmittance increases suddenly at 1200 °C. Moreover, on increasing the Eu3+ ion concentration, the HAB and f–f transitions of Gd3+ ions were decreased gradually and almost disappeared at higher Eu3+ ion concentrations, as shown in Fig. 4. Also, the intensities of (7F0→5L6) and (7F0→5D2) transitions in the longer wavelength region and the intensity of the CTB increased with increasing the Eu3+ ion concentration. Particularly, the continuous enhancement in the intensity of the (7F0→5D2) transition in the blue region is a good sign for obtaining natural white light when mixing with YAG:Ce3+ yellow phosphors.
Red light emission of CGZO:Eu3+ phosphors was so strong as to be visible to the naked eye when exciting with UV, NUV or blue wavelengths. The PL spectra of the CGZO:Eu3+ phosphors as a function of excitation wavelength are shown in Fig. 5(a). Evidently, these phosphors can be excited with the intense f–f transition at 466 nm (7F0→5D2), 394 nm (7F0→5L6) and CTB. As can be seen in Fig. 5(a), it is evident that the CGZO:Eu3+ phosphors can strongly absorb blue light and transfer the excitation energy to the red (5D0→7F2) transition, suggesting that the CGZO:Eu3+ phosphors are suitable to be excited by a blue LED chip.
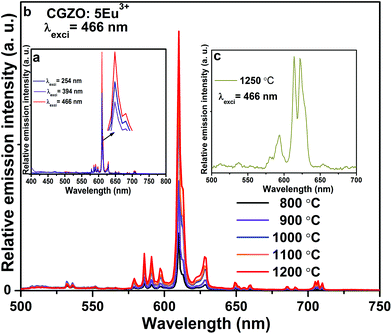 | ||
| Fig. 5 PL spectra of the CGZO:5Eu3+ phosphors (a) after annealing at 1200 °C at different excitation wavelengths, (b) at different annealing temperatures, and (c) after annealing at 1250 °C. | ||
Fig. 5(b) shows the PL spectra of the CGZO:Eu3+ phosphors as a function of annealing temperature. The spectra exhibited intense emission bands with a peak maximum at 611 nm. This can be ascribed to the forced electric-dipole also called the hypersensitive (5D0→7F2) transition of Eu3+ ions, which is located at the sites without inversion symmetry. The emission bands at 586, 591, and 598 nm with smaller intensities are due to the magnetic-dipole (5D0→7F1) transition of Eu3+ ions. The other weak emission bands of Eu3+ ions at 579, 650 and 705 nm are due to the (5D0→7F0), (5D0→7F3), and (5D0→7F4) transitions, respectively. Furthermore, it is well known that the 7FJ energy levels of Eu3+ ions split into several components under the crystal-field effect.24C2v is the highest orthorhombic symmetry that allows the full splitting of 7F1 levels of Eu3+ ions and shows three well-resolved components, due to the completely lifted “2J + 1” degeneracy. The full splitting of the 7F1 level confirmed the Eu3+ emission coming from the orthorhombic symmetry.
When the annealing temperature increased from 800 to 1200 °C, the intensity of the (5D0→7F2) transition increased significantly. The intensity ratio of (5D0→7F2) to (5D0→7F1), also called the asymmetric ratio (R), is close to being related to the local environment of Eu3+ ions. Usually, the larger the intensity ratio of (5D0→7F2) to (5D0→7F1), the lower the local symmetry. The asymmetric ratios of CGZO:Eu3+ phosphors obtained with various annealing temperatures were also calculated, and the results are shown in Table 1. The results show that the asymmetric ratio increases slightly with increasing the annealing temperature up to 1200 °C due to the increase of crystallite size, which confirms the decrease in the local symmetry and hence an increase in the red emission (5D0→7F2). When the annealing temperature was increased above 1200 °C, the position of the (5D0→7F2) transition shifted towards the longer wavelength side and the asymmetry ratio decreased due to the dominant monoclinic phase of Gd2O3, as shown in Fig. 5(c). From the above results, the optimized annealing temperature was 1200 °C. So, we measured the PLE and PL spectra with different concentrations at 1200 °C.
| Annealing temperature (°C) | Asymmetry ratio (R) | CIE chromaticity coordinates |
|---|---|---|
| 800 | 7.49 | (0.620, 0.379) |
| 900 | 8.13 | (0.633, 0.367) |
| 1000 | 8.47 | (0.641, 0.358) |
| 1100 | 8.90 | (0.644, 0.356) |
| 1200 | 9.07 | (0.645, 0.323) |
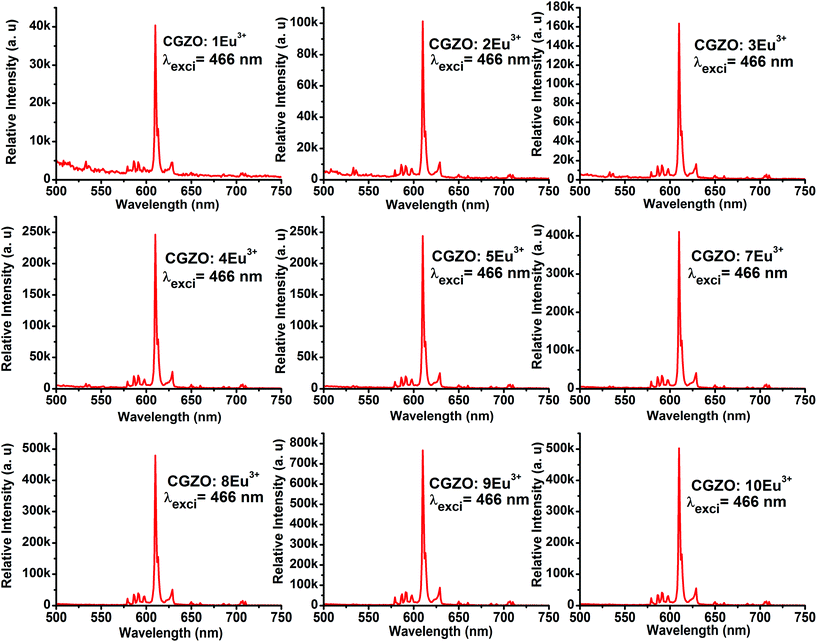
The shape and peak positions of PL emission spectra of CGZO:Eu3+ as a function of Eu3+ ion concentration upon annealing at 1200 °C were similar, as shown in Fig. 6. However, in addition to the 5D0 emissions, the 5D1,2 emissions of the higher energy levels at shorter wavelengths of 400–550 nm were observed at lower Eu3+ ion concentrations and gradually disappear with increasing the Eu3+ ion concentration due to the cross-relaxation effect. The presence of higher energy level emissions is not only dependent on the concentration, but also depends upon the phonon energies. The possible cross-relaxation channels in the CGZO host lattice are as follows:25,26
| 5D1 + 7F0→5D0 + 7F3 for depopulating the 5D1 level |
| 5D2 + 7F1→5D1 + 7F4 for depopulating the 5D2 level |
| 5D3 + 7F0→5D2 + 7F6 for depopulating the 5D3 level |
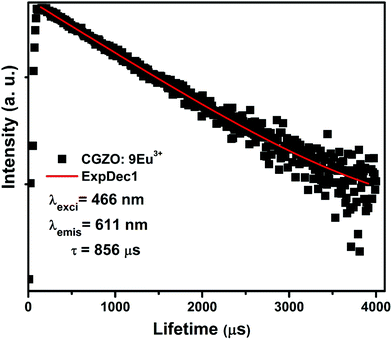
When the Eu3+ ion concentration increased from 1 to 9 mol% in the CGZO host lattice, the emission intensity also increased. As the Eu3+ ion concentration further increased above 9 mol%, the emission intensity decreased due to the concentration quenching. Therefore, the concentration quenching of Eu3+ ions in the CGZO host lattice was found to be 9 mol%. The concentration quenching has two types of origins: (i) when increasing the Eu3+ ion concentration in the CGZO host lattice, the excitation migration due to the resonance between the Eu3+ ions is increased, and thus the excitation energy reaches quenching centers, and (ii) the Eu3+ ions are paired or coagulated in the CGZO host lattice and are changed to quenching centers. To estimate the luminescence lifetime of the optimized CGZO:9Eu3+ phosphor, the decay curve was measured under 466 nm excitation and 611 nm emission wavelengths, as shown in Fig. 7. The decay curve was well fitted to a single exponential function of I(t) = I0(t) exp(−t/τ), where I(t) is the decaying luminescence intensity at time t, I0 is the initial intensity and τ is the decay time. The calculated lifetime was found to be around 856 μs.
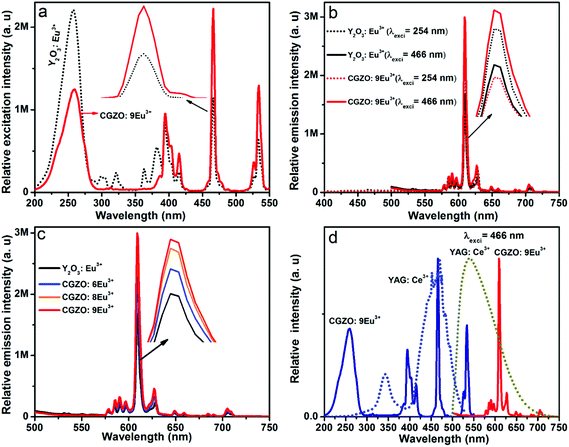
To clarify the red emission richness, the CGZO:Eu3+ phosphors were compared with the commercial Y2O3:Eu3+ (4.4 wt%) phosphor by monitoring the 611 nm emission wavelength, different excitation wavelengths and different concentrations of Eu3+ ions in the CGZO host lattice, as shown in Fig. 8(a–c). In Fig. 8(a), the blue excitation due to the (7F0→5D2) transition is more prominent than the CTB in the CGZO:Eu3+ phosphor. This is in contrast to the commercial Y2O3:Eu3+, where the CTB dominates the excitation spectrum. Also, the blue excitation band of the CGZO:Eu3+ phosphor is somewhat wider than that of the commercial phosphor (inset of Fig. 8(a)), which reduces the emission wavelength control of LEDs due to the increased absorption cross-section of the phosphor.11Fig. 8(b) and (c) show the comparison of PL spectra at different Eu3+ concentrations and different excitation wavelengths. Under 466 nm excitation, the emission intensities of 6, 8 and 9 mol% Eu3+ ion-doped CGZO were much greater than that of the commercial Y2O3:Eu3+ phosphors. However, this is in contrast to the situation under 256 nm excitation. It is also noted that the most intense transition is at 611 nm, which is the best red component for high luminous efficacy WLEDs, and the weak emission due to the (5D0→7F4) transition in the deep red region indicates the higher luminous efficacy of radiation.11 The R value for the Y2O3:Eu3+ is 8.75; however, for CGZO:6Eu3+, CGZO:8Eu3+, and CGZO:9Eu3+, it is 9.20, 9.35, and 9.46, respectively. The increased R value indicates the improved color purity of the red component of the CGZO:Eu3+ phosphors. Furthermore, the CGZO:9Eu3+ phosphor can also assist as a red compensator in the fabrication of Y3Al5O12 (YAG):Ce3+ yellow phosphor-based WLEDs for indoor illumination. With an appropriate amount of CGZO:9Eu3+ phosphor combined with YAG:Ce3+, as shown in Fig. 8(d), an excellent white-light emission might be possible because the excitation peaks of the CGZO:Eu3+ at 466 and 533 nm were overlapped well with the respective excitation and emission peaks of the YAG:Ce3+ phosphor. Hence, it is assumed that when the YAG:Ce3+ phosphor is excited at 466 nm, the excitation and/or emission spectra of YAG:Ce3+ may serve as an excitation source to the CGZO:Eu3+, thus leading to a yellow emission including red emission being obtained. This kind of pc-WLED can contribute to high CRI display systems and pleasant atmosphere for indoor illumination.
Based on the integrating sphere method, the absolute quantum yield (η) of CGZO:9Eu3+ nanophosphor as a function of excitation wavelength was measured. For the current synthesis condition, the η values were 36, 6, 20 and 24% at the excitation wavelengths of 254, 394, 466, and 533 nm, respectively. As compared to 466 nm excitation, 533 nm excitation shows higher η. This enhanced η might be due to the absence of higher energy level emissions of Eu3+ ions under 533 nm excitation. It is also noticeable that the η value of commercial Y2O3:Eu3+ under 466 nm excitation is <1%,21 which is much less than that of CGZO:9Eu3+ nanophosphor. Mishra et al. reported a value of 23% for CGZO:15Eu3+ nanophosphor,21 which is a little higher than that of CGZO:9Eu3+ phosphor due to the higher Eu3+ ion concentration and higher annealing temperature.
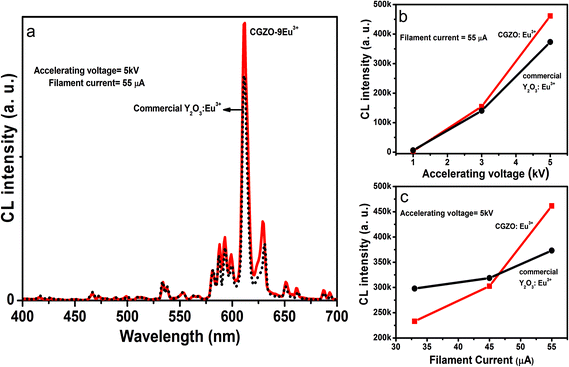
To explore the potentiality of the CGZO:Eu3+ phosphor for efficient red region emission in FED systems, the CL properties of CGZO:Eu3+ phosphors as a function of accelerating voltage and filament current were investigated. Fig. 9(a) shows the comparison between the CL spectra of Y2O3:Eu3+ and CGZO:9Eu3+ phosphors under low electron beam excitation at 5 kV of accelerating voltage and 55 μA of filament current. It is observed that there is a small difference between the CL and PL spectra. At higher Eu3+ ion concentrations, only the 5D0 emissions were observed in the PL spectrum and almost all the emissions in the higher energy regions disappeared. However, in the CL spectra, low-intensity emission bands appeared from 5D1 and 5D2 higher energy levels. This can be explained by the fact that there is a different mechanism between CL and PL. In CL, the high-energy electrons with the acceleration of anode voltage can be regulated from few electron volts to thousands of electron volts.27,28 Therefore, the Eu3+ ions in the host material are excited with much higher energy as compared to the photon-based PL. Furthermore, the CL spectrum of CGZO:9Eu3+ shows a better emission intensity than that of commercial Y2O3:Eu3+.
Fig. 9(b) and 9(c) show the CL intensities of the CGZO:Eu3+ and commercial Y2O3:Eu3+ phosphors as a function of accelerating voltage and filament current. When the accelerating voltage increased from 1 to 5 kV at a fixed filament current of 55 μA, the CL intensity of both phosphors increased and no optimization was observed up to 5 kV. A similar increment was observed for both samples on increasing the filament current from 35 to 55 μA under a fixed accelerating voltage of 5 kV as shown in Fig. 9(c). The reason is that more plasma will be produced when increasing the filament current or accelerating voltage due to the greater electron penetration depth by the recombination of more electron–hole (exciton) pairs, resulting in more Eu3+ ions from the boundary or surface including the inside of particles being excited.29 The increased CL intensity with increasing accelerating voltage and filament current indicates the possibility of promising applications in the development of FED systems.
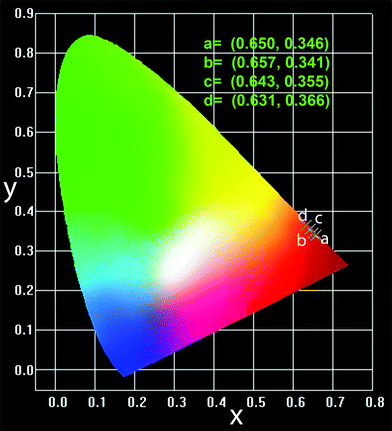
The Commission Internationale de l'Eclairage (CIE) chromaticity coordinates of the CGZO:Eu3+ and commercial Y2O3:Eu3+ phosphors were investigated as a function of excitation wavelength. Under 254 nm excitation, the CIE coordinates of Y2O3:Eu3+ phosphors were (0.650, 0.346), while, under 466 nm excitation, the CIE coordinates of CGZO:Eu3+ phosphors were (0.657, 0.341), as shown in Fig. 10. Clearly, the CGZO:Eu3+ phosphor has a higher red color purity under 466 nm excitation as compared to that of Y2O3:Eu3+ phosphors at 254 nm excitation wavelength. The CIE coordinates at different annealing temperatures are presented in Table 1. Also, both CGZO:Eu3+ and commercial Y2O3:Eu3+ phosphors show similar behavior of CIE coordinates under the low beam electron excitation, and the calculated CIE coordinates related to CL spectra are summarized in Table 2. The optimized coordinates are presented in the CIE diagram in Fig. 10. From the CL-related CIE coordinates, it is understood that the color purity of red emission decreases with increasing the accelerating voltage and filament current due to the presence of higher 5DJ levels of Eu3+ ions. The appearance of higher 5DJ levels is due to the greater penetration depth, as explained above. The CIE coordinates of CL spectra indicate the red color purity of Eu3+ ions not only depends upon the asymmetric ratio but also relies upon the presence of higher energy 5DJ(=3,2,1) emission levels. From the CIE chromaticity of both PL and CL spectra, CGZO:Eu3+ shows better emission than that of the commercial Y2O3:Eu3+ in the red region, which is useful for fabricating artificial white light to be similar to that of natural white light because of the better spectral overlap.30,31
| CIE chromaticity coordinates | ||
|---|---|---|
| Function | CGZO:9Eu3+ | Commercial Y2O3:Eu3+ |
| Accelerating voltage (kV) | ||
| 1 | (0.600, 0.392) | (0.601, 0.386) |
| 3 | (0.643, 0.355) | (0.631, 0.366) |
| 5 | (0.629, 0.368) | (0.621, 0.375) |
| Filament current (μA) | ||
| 33 | (0.641, 0.357) | (0.629, 0.368) |
| 45 | (0.639, 0.359) | (0.621, 0.375) |
| 55 | (0.629, 0.368) | (0.621, 0.375) |
Conclusion
The annealing temperature and Eu3+ ion concentration effects on the structural and luminescent properties of orthorhombic phase CGZO:Eu3+ phosphors prepared by the sol–gel process were systematically investigated. The transmittance and phase changes of CGZO:Eu3+ phosphors correlated with each other. The PLE spectra of these phosphors exhibited a dominant blue excitation in the visible region and the intensity increased significantly with increasing the annealing temperature and Eu3+ ion concentration. This performance is appropriate for obtaining natural white light emission when mixing with YAG:Ce3+ yellow phosphor. Detailed analytical data revealed that the PL intensity of CGZO:Eu3+ under 466 nm excitation dominates the commercially available Y2O3:Eu3+ phosphor under 254 nm excitation at similar measurement conditions. Concentration quenching of Eu3+ emission from the CGZO host lattice was observed when the Eu3+ doping level exceeded 9 mol%. Furthermore, the CL spectra also exhibited similar behavior to the PL spectra and the CGZO:Eu3+ dominated the commercial Y2O3:Eu3+ phosphor emission. From the observed luminescent properties, we are able to conclude that CGZO:Eu3+ under excitation of 466 nm blue wavelength is a promising red phosphor for applications in LEDs with natural white emission and high CRI optical display systems.Acknowledgements
This work was supported by a grant from the Kyung Hee University in 2013 (KHU-20131563), and also supported by the National Research Foundation of Korea (NRF) grant funded by the Korea government (MSIP) (no. 2013-068407).References
- R. Lv, G. Yang, Y. Dai, S. Gai, F. He and P. Yang, CrystEngComm, 2014, 16, 9612–9621 RSC.
- G. Seeta Rama Raju, E. Pavitra, G. Purnachandra Nagaraju, K. Ramesh, B. F. El-Rayes and J. S. Yu, Dalton Trans., 2014, 43, 3330–3338 RSC.
- G. Seeta Rama Raju, E. Pavitra, G. P. Nagaraju, R. Kandimalla, B. F. El-Rayes and J. S. Yu, Cryst. Growth Des., 2013, 13, 4051–4058 Search PubMed.
- C.-H. Kim, I.-E. Kwon, C.-H. Park, Y.-J. Hwang, H.-S. Bae, B.-Y. Yu, C.-H. Pyun and G.-Y. Hong, J. Alloys Compd., 2000, 311, 33–39 CrossRef CAS.
- J. T. Ingle, R. P. Sonekar, S. K. Omanwar, Y. Wang and L. Zhao, Opt. Mater., 2014, 36, 1299–1304 CrossRef CAS PubMed.
- P. Pust, V. Weiler, C. Hecht, A. Tücks, A. S. Wochnik, A.-K. Henß, D. Wiechert, C. Scheu, P. J. Schmidt and W. Schnick, Nat. Mater., 2014, 13, 891–896 CrossRef CAS PubMed.
- D. Hou, X. Xu, M. Xie and H. Liang, J. Lumin., 2014, 146, 18–21 CrossRef CAS PubMed.
- R. Dey, A. Pandey and V. K. Rai, Spectrochim. Acta, Part A, 2014, 128, 508–513 CrossRef CAS PubMed.
- R. Dey and V. K. Rai, Dalton Trans., 2014, 43, 111–118 RSC.
- N. Kaneko, M. Hagiwara and S. Fujihara, ECS J. Solid State Sci. Technol., 2014, 3, R109–R114 CrossRef CAS PubMed.
- M. Nyman, M. A. Rodriguez, L. E. Shea-Rohwer, J. E. Martin and P. P. Provencio, J. Am. Chem. Soc., 2009, 131, 11652–11653 CrossRef CAS PubMed.
- C. C. Lin and R.-S. Liu, J. Phys. Chem. Lett., 2011, 2, 1268–1277 CrossRef CAS.
- G. Li and J. Lin, Chem. Soc. Rev., 2014, 43, 7099–7131 RSC.
- G. S. R. Raju, Y. H. Ko, E. Pavitra, J. S. Yu, J. Y. Park, H. C. Jung and B. K. Moon, Cryst. Growth Des., 2012, 12, 960–969 CAS.
- L. Krishna Bharat, J. Y. Park and J. S. Yu, Chem. Eng. J., 2014, 240, 179–186 CrossRef CAS PubMed.
- G.-H. Lee and S. Kang, J. Lumin., 2011, 131, 2606–2611 CrossRef CAS PubMed.
- E. Pavitra, G. S. R. Raju and J. S. Yu, Phys. Status Solidi RRL, 2013, 7, 224–227 CrossRef CAS.
- Sheetal, V. B. Taxak, S. Singh, Mandeep and S. P. Khatkar, Optik, 2014, 125, 6340–6343 CrossRef CAS PubMed.
- I. Etchart, A. Huignard, M. Berard, M. N. Nordin, I. Hernandez, R. J. Curry, W. P. Gillin and A. K. Cheetham, J. Mater. Chem., 2010, 20, 3989–3994 RSC.
- D. Xu, D. Haranath, H. He, S. Mishra, I. Bharti, D. Yadav, B. Sivaiah, B. Gahtori, N. Vijayan, A. Dhar, J. Zhu, V. Shanker and R. Pandey, CrystEngComm, 2014, 16, 1652–1658 RSC.
- S. Mishra, R. Rajeswari, N. Vijayan, V. Shanker, M. K. Dalai, C. K. Jayasankar, S. Surendra Babu and D. Haranath, J. Mater. Chem. C, 2013, 1, 5849–5855 RSC.
- A. Lakshmanan, Luminescence and Display Phosphors: Phenomena and Applications, Nova Science Publishers, 2008 Search PubMed.
- G. Blasse and B. Grabmaier, Luminescent materials, Springer, 1994 Search PubMed.
- X. Y. Chen and G. K. Liu, J. Solid State Chem., 2005, 178, 419–428 CrossRef CAS PubMed.
- Z. Hao, J. Zhang, X. Zhang and X. Wang, Opt. Mater., 2011, 33, 355–358 CrossRef CAS PubMed.
- D. Hreniak, W. Stręk, P. Dereń, A. Bednarkiewicz and A. Łukowiak, J. Alloys Compd., 2006, 408–412, 828–830 CrossRef CAS PubMed.
- G. Seeta Rama Raju, E. Pavitra and J. S. Yu, Phys. Chem. Chem. Phys., 2014, 16, 18124–18140 RSC.
- X.-J. Wang, R.-J. Xie, B. Dierre, T. Takeda, T. Suehiro, N. Hirosaki, T. Sekiguchi, H. Li and Z. Sun, Dalton Trans., 2014, 43, 6120–6127 RSC.
- G. Li, Z. Hou, C. Peng, W. Wang, Z. Cheng, C. Li, H. Lian and J. Lin, Adv. Funct. Mater., 2010, 20, 3446–3456 CrossRef CAS.
- L. S. Kumari, P. P. Rao, M. Thomas and P. Koshy, J. Electrochem. Soc., 2009, 156, P127–P131 CrossRef CAS PubMed.
- S. Fujihara and K. Tokumo, Chem. Mater., 2005, 17, 5587–5593 CrossRef CAS.
| This journal is © The Royal Society of Chemistry 2015 |

