 Open Access Article
Creative Commons Attribution 3.0 Unported Licence
Syntheses of polypyridyl metal complexes and studies of their interaction with quadruplex DNA†
Verity S.
Stafford
a,
Kogularamanan
Suntharalingam‡
a,
Arun
Shivalingam
a,
Andrew J. P.
White
a,
David J.
Mann
b and
Ramon
Vilar
*a
aDepartment of Chemistry, Imperial College London, London SW7 2AZ, UK. E-mail: r.vilar@imperial.ac.uk
bDepartment of Life Sciences, Imperial College London, London SW7 2AZ, UK
First published on 17th October 2014
Abstract
A series of mono- and bi-metallic metal complexes (with CuII, PtII and ZnII) with substituted polypyridyl ligands have been prepared and their binding affinities towards quadruplex (c-Myc and human telomeric) and duplex DNA (ds26 and calf thymus) determined using fluorescent indicator displacement (FID) assays and UV/vis spectroscopic titrations. These studies have shown that the number of aromatic rings and number/position of cyclic amine substituents on the ligands, play an important role in defining the DNA binding abilities of the resulting metal complexes. We also show that bi-metallic complexes prepared using a novel terpyridine-cyclen ligand have higher affinity towards G-quadruplex DNA as compared to their mono-metallic counterparts. Cytotoxicity assays were carried out for all the new complexes against an osteosarcoma cancer cell line (U2OS) as well as a normal fibroblast cell line (GM05757). Several of these compounds displayed cytotoxicity similar to that of cisplatin.
Introduction
Guanine-rich oligonucleotides have the ability to self-assemble into quadruply-stranded structures known as G-quadruplexes.1 As has been extensively discussed in the recent literature, the formation of G-quadruplex DNA in vivo has been associated with a number of important biological processes including regulation of gene expression and telomere maintenance.2,3 Due to their proposed biological relevance, G-quadruplexes are attractive targets for anticancer drugs.4–7 Therefore, there has been increasing interest in the development of small molecules able to interact with high affinity and selectivity with quadruplexes. While initially most quadruplex binders were based on purely organic planar molecules,8–10 more recently an increasing number of metal complexes have been shown to be excellent quadruplex binders.11Over the past ten years we have developed several families of platinum(II) square planar complexes aimed at interacting with quadruplex DNA structures. The design of these platinum(II) complexes is based around planar polyaromatic ligand frameworks such as salphen,12 phenanthroline,13,14 disubstituted pyridines15 and terpyridines.16–18 In these examples, the metal plays an important structural role organising the polyaromatic ligands in an optimal planar geometry for end-stacking on top of guanine tetrads (via π–π interactions). In addition to their structural features, the metal ions withdraw electron density from the corresponding ligand framework which in turn renders the aromatic rings more prone to displaying π–π stacking interactions.11 Another important design feature when developing quadruplex binders is the addition of basic substituents to the planar π–π stacking core, which can be protonated at physiological pH. These groups have been shown to increase the solubility of the compounds in aqueous media as well as enhancing their interactions with quadruplexes. While most substituents used so far are based on organic groups (e.g. amines, amino acids) we recently incorporated as part of our design a “side-arm” based on a metal complex.16 The resulting di-metal complexes displayed higher affinities towards quadruplex DNA in comparison to the corresponding mono-metallic complexes.
The first studies of metal-terpyridines as G-quadruplex binders were reported by Teulade-Fichou et al.19–21 These studies showed that square planar and square-based pyramidal metal complexes containing substituted terpyridines, are very good G-quadruplex binders. Subsequently, we synthesised a different family of terpyridine metal complexes (1–4, see Fig. 1) and also showed that the platinum(II) square planar complexes had good affinity for G-quadruplexes.17 Ligands based on phenanthroline have also been previously used to prepare metal complexes with high affinity towards quadruplexes.13–15,22–29
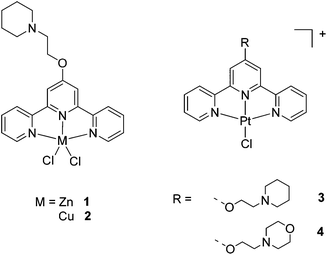 | ||
| Fig. 1 Metal-terpyridine complexes with M = ZnII, CuII and PtII previously reported and studied as G-quadruplexe binders. | ||
We have now extended our studies on polypyridyl metal complexes and present our results herein. More specifically, we have synthesised two new ligands (L4 and L8) and ten new mono- and bi-metallic metal complexes (5–15). The affinity of the new complexes towards G-quadruplex (c-Myc and HTelo) and duplex (d26 and calf thymus) DNA has been determined by fluorescent indicator displacement (FID)30,31 assays and UV/vis spectroscopic titrations. In addition, we report the cytotoxicity of these complexes against the osteosarcoma cancer cell line U2OS as well as against the normal fibroblast cell line GM05757.
Results and discussion
Synthesis of substituted polypyridyl ligands
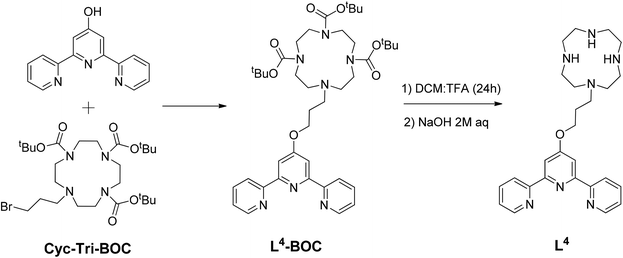
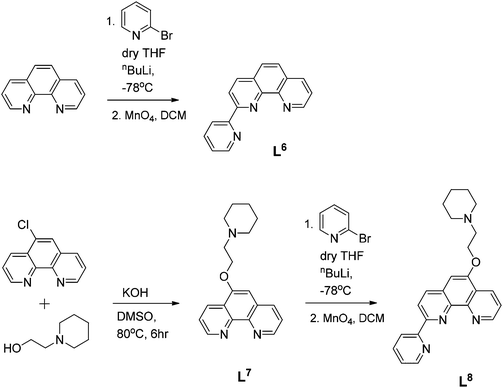
The ligands and complexes studied in this work are shown in Schemes 1 and 2 and Fig. 2–4. The rationale behind these ligands and the corresponding complexes was to explore the effect of various parameters on G-quadruplex binding. In particular, we focussed upon the effects of increasing the number of aromatic rings (e.g. comparing 15 with 3 and 4) and exchanging the labile chloride coordinated to the platinum(II) metal centre with a thiolate (complexes 5–7 and 14); we were also interested in studying the impact of a second metal centre within the same molecule (e.g.11 and 12) on the affinity of the complexes toward G-quadruplex DNA. | ||
| Fig. 2 Chemical structures of the terpyridine ligands employed to prepare the corresponding metal complexes under investigation. | ||
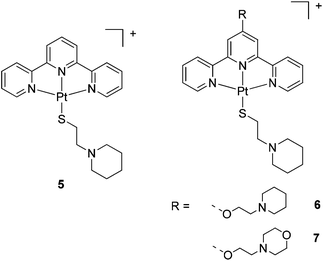 | ||
| Fig. 3 Chemical structures of the platinum(II)-thiolate complexes 5–7. The counterion for complex 5 is Cl−, while for 6 and 7 is PF6−. | ||
Ligands L2 and L3 were prepared as previously reported,17 while L4 was prepared by reacting the tri-Boc protected cyclen (Cyc-Tri-BOC),32 with 2,6-bis(2-pyridyl) 4(1H) pyridone (see Scheme 1) to first yield L4-BOC. This intermediate product was treated with TFA in CH2Cl2 to remove the BOC protecting groups. To neutralise the protonated crude solid, it was first dissolved in water and aqueous NaOH (2 M) was added dropwise until the solution became alkaline (pH 12). The product was then extracted into CH2Cl2. The solvent was removed under reduced pressure to yield L4 as a pale yellow sticky solid. This terpyridine-cyclen ligand was fully characterised by 1H and 13C NMR spectroscopy (including 1H–1H COSY NMR – see Fig. S1 in the ESI†), as well as by mass spectrometry (m/z = 462 a.m.u., [M + H]+).
Ligand L6 was prepared by coupling phenanthroline and 2-bromopyridine as shown in Scheme 2. The compound was fully characterized by 1H NMR spectroscopy as well as by mass spectrometry (m/z = 253 a.m.u., [M + H]+) and its purity confirmed by elemental analyses. The mono-functionalized pyridyl-phenanthroline ligand, L8, was prepared using a two-step approach: 5-chloro-1,10-phenanthroline was reacted with 1-(2-hydroxyethyl)piperidine and KOH in degassed DMSO to yield L7 (Scheme 2). The substituted phenanthroline was then coupled with 2-bromopyridine using nBuLi as a base. Upon extraction into CH2Cl2, re-oxidation using MnO4 and purification via alumina column chromatography, the desired product was isolated. The ligand was characterised by 1H NMR spectroscopy where the resonances of the aromatic protons were observed to shift downfield relative to the starting material. Furthermore, formation of the desired C–C bond was clearly shown by the disappearance of one ortho-phenanthroline proton signal. A distinctive molecular ion peak was observed in the ESI mass spectrum (m/z = 407 a.m.u., [M + Na]+), providing further evidence for product formation.
Synthesis of metal complexes
The new thiolato platinum complexes 5–7 were prepared by reacting the corresponding platinum(II)-terpyridine-chloro derivatives, [Pt(terpy)Cl]Cl, 3 and 4, with 4 equivalents of L5 (which was prepared by modification of a reported procedure33) in water at 25 °C for 48 h. Upon completion of the reactions, excess thiol starting material was removed. Complex 5 (as the chloride salt [Pt(L1)(L5)]Cl) was isolated as a deep purple solid. In contrast, complexes 6 and 7 could not be isolated pure as the chloride salts. In these cases an additional counter-anion exchange step was required, so the chloride ion was exchanged for PF6− ion to yield [Pt(L3)(L5)](PF6) (6) and [Pt(L4)(L5)](PF6) (7) as orange solids.The platinum(II)-thiol complexes were fully characterised by 1H NMR (and 31P NMR in the case of 6 and 7) spectroscopy, UV-Vis spectroscopy, mass spectrometry and elemental analyses. The aromatic proton signals were observed to shift downfield (ranging from 0.2 to 0.8 ppm) relative to the corresponding platinum(II)-chloro complexes, clearly demonstrating coordination of the thiol arm to the fourth position of the platinum(II)-terpyridine motif. The largest shift was observed for the ortho-terpyridine peak (0.8 ppm downfield), likely to result from the magnetic anisotropy of the neighbouring platinum–sulfur bond. The appearance of a LMCT/ILCT band (charge transfer from the sulfur p orbital to the platinum/terpyridine orbitals) at 505 nm in the UV-vis spectrum provided further evidence for the successful coordination of the thiol ligand. Complex 5 was also characterised by X-ray crystallography (see below).
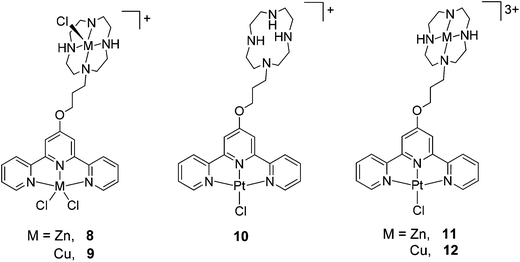
The dinuclear complexes 8 and 9 were prepared by reacting L4 (in methanol) with a methanolic solution containing 2 equivalents of the appropriate metal chloride salt (ZnCl2 and CuCl2·2H2O respectively). These solutions were heated at 40 °C for 48h after which time white and blue precipitates were obtained for the zinc(II) (8) and copper(II) (9) complexes respectively. These solids were purified by recrystallization: acetone was allowed to slowly diffuse into concentrated aqueous solutions of the complexes over 7 days yielding crystals of 8 and 9 suitable for X-ray crystallographic analysis (see below). These crystalline solids were also characterised by mass spectrometry and elemental analyses. The di-zinc(II) complex 8 was further characterised by 1H and 13C NMR spectroscopy (including 1H–1H COSY NMR – see Fig. S2 in the ESI†).
Complex 10 was prepared by reacting L4 with K2PtCl4 in DMSO for 24h. Addition of acetone to the reaction mixture yielded an orange solid (the chloride salt of 10) which was subsequently redissolved in DMSO and treated with an aqueous solution of NaPF6 to precipitate 10 as the pure PF6− salt. This complex was characterised by 1H and 13C NMR spectroscopy, mass spectrometry and elemental analyses. The hetero-bimetallic complexes 11 and 12 were prepared by reacting 10 with the corresponding metal salt (ZnCl2 and CuCl2·2H2O respectively) in DMSO. Addition of aqueous NaPF6 to this solution yielded the corresponding Pt–Zn and Pt–Cu complexes as yellow and green solids respectively. Both complexes were characterised spectroscopically and by elemental analyses.
The two phenanthroline-based ligands L6 and L8 were reacted with [Pt(COD)Cl2] in water at 75 °C for 3 h to yield the corresponding platinum(II) complexes 13 and 15 (isolated as the Cl− and PF6− salts respectively). Complex 13 (which has been previously reported34) was then reacted with thiol L5 in water to yield the new complex 14 (Fig. 5). These three platinum complexes were fully characterised by 1H NMR spectroscopy, mass spectrometry and elemental analyses.
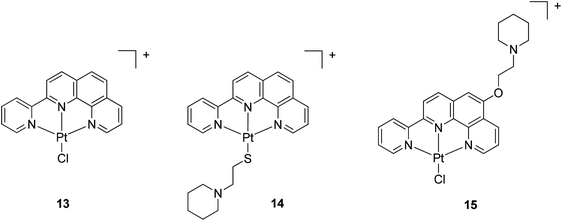 | ||
| Fig. 5 Chemical structures of the platinum(II)-phenanthroline complexes 13–15. The counterion for complex 13 is Cl−, while for 14 and 15 is PF6−. | ||
X-ray crystal structures of compounds 5, 8 and 9
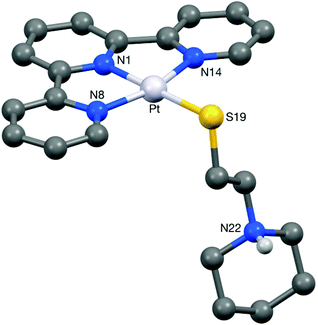
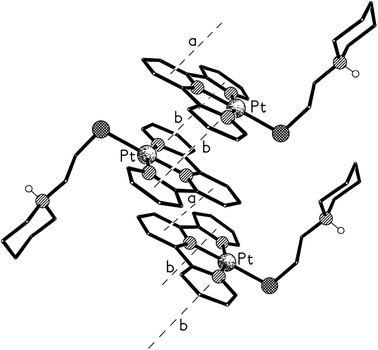
Crystals of 5 suitable for an X-ray crystallographic study were grown by slow diffusion of diethyl ether into a methanolic solution of the compound. The platinum centre in the structure of this complex (Fig. 6) was found to have adopted a distorted square planar coordination geometry, the Pt, N(1), N(8), N(14) and S(19) atoms being coplanar to within ca. 0.01 Å. This planarity extends to include the terpyridine unit, the twenty non-hydrogen atoms being coplanar to within ca. 0.08 Å. This extended planarity allows the cations in 5 to pack across two independent centres of symmetry to form an extended stack along the crystallographic a axis direction (Fig. 7). The N(1)-based ring in one cation links to its counterpart in an adjacent Ci-related cation (centroid⋯centroid and mean interplanar separations of ca. 3.68 and 3.41 Å, rings parallel, interaction a in Fig. 7), whilst the N(8)- and N(14)-based rings are linked across an independent centre of symmetry (centroid⋯centroid and mean interplanar separations of ca. 3.81 and 3.40 Å, rings inclined by ca. 4°, interaction b in Fig. 7).The structure of the di-zinc complex 8 (crystals of which were grown by slow diffusion of acetone into concentrated aqueous solution of the complex) was found to contain two independent cations (8-A and 8-B) with noticeably different coordination geometries between the terpyridine unit and the ZnCl2 moiety (cation 8-A is shown in Fig. 8, whilst cation 8-B is shown in Fig. S6 in the ESI†). For cation 8-B the terpyridine unit is approximately planar, and this plane includes the metal atom with Zn(1B) lying only ca. 0.02 Å out of the N3 plane (the torsion angles between the N(1B)- and N(8B)-based rings, and between the N(1B)- and N(14B)-based rings being ca. 3 and 1° respectively). This results in a distorted trigonal bipyramidal coordination geometry at Zn(1B) with a significantly bent major axis [N(8B)–Zn(1B)–N(14B) 150.33(9)°, Table 1]. Cation 8-A has a noticeably different geometry at Zn(1A) with the metal slightly perching above the N3 plane by ca. 0.32 Å. This perching distorts the terpyridine unit away from planarity, the torsion angles between the N(1A)- and N(8A)-based rings, and between the N(1A)- and N(14A)-based rings being ca. 13 and 2° respectively, resulting in a coordination geometry best described as distorted square-based pyramidal with Cl(1A) in the apical position (the four atoms of the basal plane are coplanar to ca. 0.23 Å with the metal lying ca. 0.63 Å out of this plane). By contrast the coordination geometries at the Zn(2) centres are very similar in both independent cations, each having a square-based pyramidal geometry with Cl(3) in the apical site; the four coordinated nitrogen centres are coplanar to within ca. 0.03 and 0.02 Å in 8-A and 8-B respectively, with Zn(2) lying ca. 0.83 Å (8-A) and 0.80 Å (8-B) out of this plane.
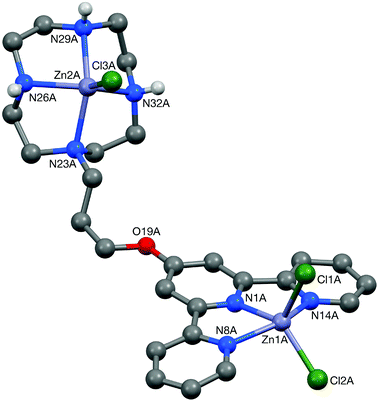 | ||
| Fig. 8 The structure of one (8-A) of the two independent cationic complexes present in the crystal of 8. | ||
| 8-A [M = Zn] | 8-B [M = Zn] | 9 [M = Cu] | |
|---|---|---|---|
| M(1)–Cl(1) | 2.2614(8) | 2.2678(8) | 2.5361(17) |
| M(1)–Cl(2) | 2.2903(7) | 2.2680(7) | 2.2341(18) |
| M(1)–N(1) | 2.094(2) | 2.077(2) | 1.944(5) |
| M(1)–N(8) | 2.183(2) | 2.175(3) | 2.051(4) |
| M(1)–N(14) | 2.193(2) | 2.205(2) | 2.030(6) |
| Cl(1)–M(1)–Cl(2) | 109.38(3) | 113.46(3) | 101.61(7) |
| Cl(1)–M(1)–N(1) | 114.19(6) | 116.47(7) | 102.66(12) |
| Cl(1)–M(1)–N(8) | 106.41(7) | 96.22(7) | 94.06(12) |
| Cl(1)–M(1)–N(14) | 97.47(6) | 97.65(6) | 96.10(15) |
| Cl(2)–M(1)–N(1) | 136.40(6) | 130.07(7) | 155.73(13) |
| Cl(2)–M(1)–N(8) | 94.80(6) | 99.28(7) | 98.34(14) |
| Cl(2)–M(1)–N(14) | 98.85(6) | 99.02(6) | 98.4(2) |
| N(1)–M(1)–N(8) | 74.91(8) | 75.24(9) | 79.71(17) |
| N(1)–M(1)–N(14) | 74.25(8) | 75.10(8) | 79.3(2) |
| N(8)–M(1)–N(14) | 146.69(9) | 150.33(9) | 158.3(2) |
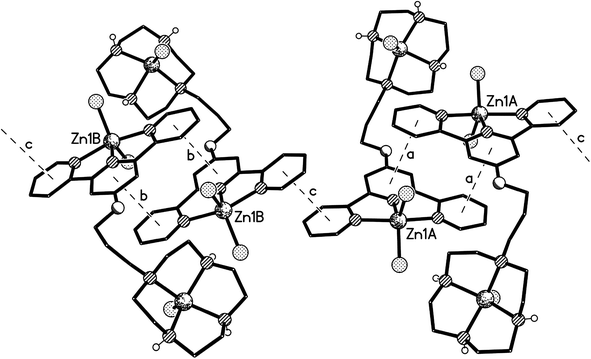
The two independent cations are both arranged in π–π linked dimer pairs across a centre of symmetry, with in each case the N(1)-based pyridyl ring in one cation overlaying the N(14)-based ring in the Ci-related counterpart, and vice versa (for cation 8-A: centroid⋯centroid and mean interplanar separations of ca. 3.72 and 3.33 Å, rings inclined by ca. 3°, interaction a in Fig. 9, and for cation 8-B: centroid⋯centroid and mean interplanar separations of ca. 3.56 and 3.42 Å, rings inclined by less than 1°, interaction b in Fig. 9). These dimer pairs are then joined by a further π–π interaction across an independent centre of symmetry between the “unused” pyridyl rings based on N(8) (centroid⋯centroid and mean interplanar separations of ca. 3.65 and 3.39 Å, rings inclined by ca. 13°, interaction c in Fig. 9) forming the extended ⋯AA⋯BB⋯AA⋯BB⋯ chain shown in Fig. 9.
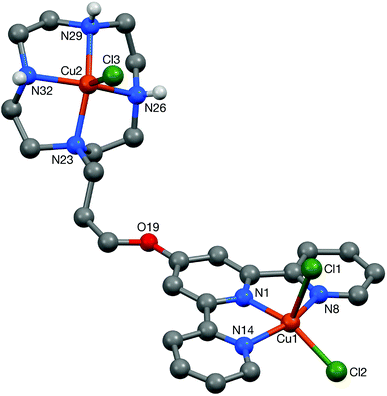
Crystals of the di-copper complex 9 were obtained from slow diffusion of acetone into concentrated aqueous solution of the complex. The cation in the structure of this di-nuclear complex (Fig. 10, Table 1) has an approximately planar terpyridine unit with the Cu(1) centre lying ca. 0.13 Å out of the N3 plane (the torsion angles between the N(1)- and N(8)-based rings, and between the N(1)- and N(14)-based rings being less than 1° and ca. 3° respectively). The coordination geometry at the Cu(1) atom is distorted square based pyramidal with Cl(1) in the apical position. (The four atoms of the basal plane are coplanar to ca. 0.15 Å with the metal lying ca. 0.31 Å out of this plane.) The coordination geometry at Cu(2) is a much less distorted square-based pyramid with Cl(3) in the apical site; the four coordinated nitrogen centres are coplanar to within ca. 0.01 Å, with Cu(2) lying ca. 0.51 out of this plane.35
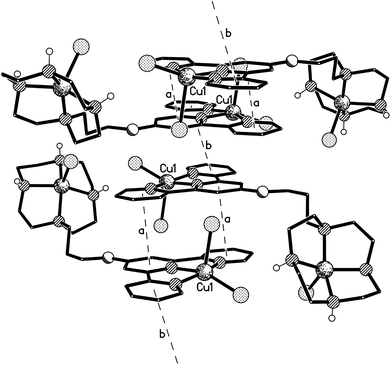
The cations are arranged in π–π linked dimer pairs across a centre of symmetry, with the N(1)-based pyridyl ring in one cation overlaying the N(8)-based ring in the Ci-related counterpart, and vice versa (centroid⋯centroid and mean interplanar separations of ca. 3.67 and 3.36 Å, rings inclined by less than 1°, interaction a in Fig. 11). These dimer pairs are then joined across a C2-axis by a further π–π interaction between the “unused” pyridyl rings based on N(14) (centroid⋯centroid and mean interplanar separations of ca. 3.81 and 3.62 Å, rings inclined by less than 1°, interaction b in Fig. 11) forming an extended chain along the crystallographic c-axis direction (Fig. 11).
Biophysical studies to determine the interactions between metal complexes and DNA
We first investigated the affinity of the complexes towards two quadruplexes (human telomeric, Htelo, and c-Myc DNA) and duplex ds26 DNA by fluorescent intercalator displacement (FID) assays.31,36 The results presented as DC50 values in Table 2 (i.e. the concentration at which 50% of thiazole orange (TO) had been displaced) indicates that several of the complexes are excellent quadruplex binders (with DC50 < 0.4 μM) and in some cases considerably selective over duplex ds26 DNA. It can also be observed that most of the complexes display lower DC50 values (i.e. higher affinity) for c-Myc than Htelo DNA.| Compound | TO displacement | Selectivity | |||
|---|---|---|---|---|---|
| HteloDC50 (μM) | cmycDC50 (μM) | ds26DC50 (μM) | ds26DC50/HteloDC50 | ds26DC50/cmycDC50 | |
| 1 | >10 | >10 | >10 | — | — |
| 2 | 1.32 | 2.45 | 2.16 | 1.6 | — |
| 3 | 1.25 | 0.26 | 2.44 | 2.0 | 9.4 |
| 4 | 2.24 | 1.01 | >2.50 | 1.1 | 2.5 |
| 5 | 0.46 | 0.30 | 0.68 | 1.5 | 2.3 |
| 6 | 0.33 | 0.49 | 1.17 | 3.5 | 2.4 |
| 7 | 0.48 | 0.30 | 1.18 | 2.5 | 3.9 |
| 8 | 2.75 | 0.86 | 3.34 | 1.2 | 3.9 |
| 9 | 0.21 | 0.09 | 0.60 | 2.9 | 6.7 |
| 10 | 0.28 | 0.16 | 0.70 | 2.5 | 4.4 |
| 11 | 0.35 | 0.08 | 1.50 | 4.3 | 18.8 |
| 12 | 0.18 | 0.17 | 0.77 | 4.3 | 4.5 |
| 13 | 0.66 | 0.27 | 1.18 | 1.8 | 4.4 |
| 14 | 0.40 | 0.13 | 0.71 | 1.8 | 5.5 |
| 15 | 1.01 | 0.25 | 1.77 | 1.8 | 7.1 |
Since FID assays are semiquantitative and therefore provide only an overview of the binding affinities between small molecules and DNA, a second technique to assess the binding was employed. Thus, UV-Vis spectroscopic studies were carried out with the corresponding complexes and DNA (Htelo, c-Myc and ct-DNA – the latter as an example of duplex DNA), using a previously established protocol.37 In order to perform these studies the test compounds were required to have an absorption maximum above 300 nm (higher than the λmax of DNA, 260 nm) and show optical changes when interacting with DNA. As the free ligands did not have absorption bands above 300 nm, only the metal complexes were tested. Due to the poor binding affinity of 1 and 2 to quadruplex DNA (as determined from the FID assay), these complexes were omitted from the UV-vis titration studies. Upon addition of aliquots of DNA (in the mM range) to solutions of the corresponding metal complexes, the absorption maximum was seen to decrease. From the absorption values, the concentrations of bound and unbound metal complex were calculated and extrapolated to determine the binding constants. This was done by fitting the data to a reciprocal plot of D/Δεapversus D using the following equation: D/Δεap = D/Δε + 1/(Δε × K) where the concentration of DNA (D) is expressed in terms of base pairs (determined by measuring the absorption at 260 nm and the appropriate extinction coefficients), the apparent molar extinction coefficient εa = Aobserved/[Complex], Δεap = [εa − εf] and Δε = [εb − εf]. εb is the extinction coefficient of the DNA bound complex, and εf is the extinction coefficient of the free complex.38 The intrinsic binding affinities toward the different DNA sequences were determined and are summarised in Table 3. These studies showed that most of the complexes have good affinity towards quadruplex DNA and they have generally higher affinity for c-Myc DNA over Htelo DNA and quadruplex DNA over ct-DNA. In particular, complexes 9–12 (with the pyridine-cyclen ligand L4) showed to have very high affinity towards G-quadruplexes – particularly c-Myc – and, up to 1000-fold selectivity over ct-DNA. The rationale for developing these complexes in the first place, was to test whether the addition of a second metal complex to the square planar platinum(II)-terpyridine or the square-based pyramidal copper(II)-terpyridine complexes would yield better quadruplex DNA binders. In particular, we chose the cyclen unit as a second coordinating ligand because: (a) cyclen does not coordinate with high affinity to platinum(II) and therefore it was possible to prepare mixed-metal complexes (11 and 12); (b) zinc(II)-cyclen complexes have been previously reported to have good affinity for phosphates39–42 and hence we rationalised that this type of moiety would be able to interact with the phosphate backbone of DNA; furthermore, it is well established that zinc(II)-cyclen complexes have high affinity for thymine and therefore one could expect strong interactions with bases in the loops of DNA.43–47 Indeed, the results obtained indicate that these bi-metallic complexes are excellent quadruplex DNA binders and the cyclen unit seems to provide them with high affinity over duplex DNA (even for complex 10 where the cyclen is metal-free).
| Compound | c-Myc K (M−1) | Htelo K (M−1) | ct-DNA K (M−1) |
|---|---|---|---|
| 3 | 6.33 ± 0.32 × 10⁶ | 1.83 ± 0.57 × 10⁶ | 9.24 ± 0.72 × 10⁴ |
| 4 | 1.64 ± 0.32 × 10⁷ | 1.75 ± 0.53 × 10⁶ | 2.18 ± 0.23 × 10⁵ |
| 5 | 4.87 ± 0.44 × 10⁷ | 1.95 ± 0.29 × 10⁶ | 1.10 ± 0.23 × 10⁶ |
| 6 | 1.32 ± 0.42 × 10⁷ | 1.06 ± 0.11 × 10⁷ | 1.95 ± 0.52 × 10⁵ |
| 7 | 6.85 ± 0.24 × 10⁷ | 1.60 ± 0.72 × 10⁷ | 5.46 ± 1.10 × 10⁵ |
| 8 | 7.45 ± 1.05 × 10⁶ | 1.12 ± 0.45 × 10⁶ | 2.40 ± 1.56 × 10⁵ |
| 9 | 5.57 ± 3.58 × 10⁸ | 1.46 ± 0.19 × 10⁷ | 2.80 ± 0.41 × 10⁵ |
| 10 | 1.12 ± 0.55 × 10⁸ | 1.47 ± 0.93 × 10⁷ | 1.92 ± 1.39 × 10⁵ |
| 11 | 2.81 ± 0.31 × 10⁸ | 1.90 ± 1.27 × 10⁷ | 4.00 ± 2.06 × 10⁵ |
| 12 | 1.41 ± 0.94 × 10⁸ | 2.35 ± 0.35 × 10⁷ | 9.43 ± 1.11 × 10⁵ |
| 13 | 1.42 ± 0.10 × 10⁷ | 6.21 ± 1.56 × 10⁶ | 5.20 ± 1.32 × 10⁵ |
| 14 | 1.14 ± 0.22 × 10⁷ | 1.46 ± 0.15 × 10⁶ | 1.07 ± 0.21 × 10⁶ |
| 15 | 5.52 ± 0.42 × 10⁶ | 8.00 ± 1.23 × 10⁵ | 4.35 ± 1.19 × 10⁴ |
UV-Vis spectroscopic titrations were also used to probe the binding mode between the complexes and the different DNA structures. Red shifts in absorption bands above 300 nm (those corresponding to MLCT or intraligand π–π* transitions) are characteristic of π–π42 interaction with DNA bases.48–50 This is generally suggestive of intercalative (for duplex DNA) or end-stacking (for quadruplex DNA) binding modes. The addition of Htelo DNA to the mono-platinum(II) terpyridine complexes 3–7, resulted in considerable hypochromicity of the metal perturbed intraligand π–π* band (ranging from 22–33%). A noticeable red shift (4–6 nm) was also observed for the complexes. These spectral features are suggestive of an end-stacking binding mode. Interestingly upon addition of c-Myc DNA, reduced hypochromicity (9–15%) and very small red shifts (1–2 nm) were observed. The latter suggests binding to c-Myc DNA may not necessarily be restricted to end-stacking but could also involve supplementary interactions with the DNA's loops and phosphate backbone. On the other hand, for the mono-platinum(II) phenanthroline-based complexes (13–15), addition of DNA (quadruplex and duplex) resulted in large hypochromicity (ranging from 18–38%) but no red shift. This suggests that for these complexes binding may not exclusively result from π–π stacking interactions. For complexes 9–12, significant hypochromicity was seen upon addition of Htelo, c-Myc and ct-DNA (9–25%) but no significant bathochromicity (red shift) was observed. This again suggests that the binding mode of these complexes to DNA is not exclusively a result of π–π stacking interactions but rather a combination of this binding mode and an electrostatic and covalent interaction. Indication of more than one binding mode can be rationalised by the dual targeting nature if the complexes: via π–π stacking interactions atop quadruplex DNA (with the metal-terpyridine core) as well as through electrostatic or covalent interactions (via the metal cyclen) to bases/phosphate backbone in the loops. Further structural studies are underway to establish the exact binding mode of these complexes with G-quadruplex DNA.
Cytotoxicity of metal complexes
Having established the high affinity of most of the complexes under investigation towards quadruplex DNA, we were interested in assessing their cytotoxicity. Thus MTS assays were carried out (using the CellTiter 96® AQueous Assay from Promega) on the complexes with two cell lines: human osteosarcoma (U2OS) and normal fibroblast (GM05757). U2OS cells expresses high levels of c-Myc protein making it a useful cell line for testing the anti-cancer properties of the synthesised quadruplex binders. GM05757 is a normal human fibroblast cell line which was used as a control.The IC50 values were determined for all the compounds under study with cisplatin employed as metal-containing control compound (Table 4). In general, the compounds had slightly higher toxicity towards the U2OS cells compared to GM05757 cell line. Under the conditions used, mono-platinum(II) complexes with chloride in the fourth coordination site (3, 4, 10, 13 and 15) gave EC50 values ranging between 57 and 95 μM for the U2OS cell line, which are comparable to cisplatin under the same conditions (EC50 = 48 μM). Similarly, the di-metallic complexes 11 and 12 which contain a [Pt(trpy)Cl]+ unit, displayed high cytotoxicity against U2OS (EC50 = 64 and 49 μM respectively) while the di-zinc and di-copper complexes were less potent (EC50 = 463 and 290 μM respectively). On the other hand, platinum(II) complexes with thiolate in the fourth coordination position (5–7 and 14) were found to be non-toxic (up to a concentration of 500 μM) for the two cell lines. It is well established that platinum(II) complexes containing Pt–Cl bonds (and more specifically [Pt(trpy)Cl]+ complexes), over time can hydrolyse to yield aquated complexes which eventually can coordinate to DNA. Therefore we propose that the high toxicity found for complexes 3, 4, 10, 13 and 15 may result from their ability to platinate DNA or perhaps some other biomolecules over time. Platinum(II)-thiol complexes, on the other hand, are relatively resistant to aquation because of their strong Pt–S bond and therefore do not platinate DNA sequences readily (see previous reports by Lippard et al. on the use of (trpy)Pt-thiolate complexes as metallo-intercaltors51–53). This probably explains their lack of toxicity against the cell lines tested over a 24 h period. The di-copper complex 9, on the other hand, displayed higher cytotoxicity against GM05757 cell line (155 ± 7 μM) than against U2OS (290 ± 64 μM) – although it should be noted that this is not particularly high for either of the two cell lines. The presence of copper(II) centres in this complex is likely to induce oxidative damage to DNA and hence the observed cytotoxicity might be due to this process rather than by targeting quadruplexes (for which 9 has a high affinity – see Table 2).
| Compound | U2OS EC50 (μM) | GM07575 EC50 (μM) |
|---|---|---|
| 3 | 61 ± 7 | 130 ± 12 |
| 4 | 95 ± 11 | 225 ± 26 |
| 5 | >500 | >500 |
| 6 | >500 | >500 |
| 7 | >500 | >500 |
| 8 | 463 ± 9 | 339 ± 81 |
| 9 | 290 ± 64 | 155 ± 7 |
| 10 | 57 ± 12 | 121 ± 5 |
| 11 | 64 ± 11 | 132 ± 8 |
| 12 | 49 ± 8 | 95 ± 1 |
| 13 | 74 ± 12 | 180 ± 15 |
| 14 | >500 | >500 |
| 15 | 79 ± 15 | 98 ± 5 |
| Cisplatin | 48 ± 6 | 74 ± 6 |
Cellular uptake
Cellular uptake studies were carried out to determine the cell permeability and localisation of a selection of the complexes. In particular, we were interested to establish whether the low cytotoxicity of compounds 7 and 14 (as representatives of the thiolated complexes) was due to their inability to aquate due to the thiolate being in the fourth coordination position rather than their inability to enter the cell. Thus, U2OS cells were incubated for 24 h at 37 °C with sub-lethal concentrations (10 μM) of two platinum-terpyridine complexes, 3 and 7 (with Cl and thiolate respectively in the fourth coordination position), and two platinum-phenanthroline complexes, 14 and 15 (with Cl and thiolate respectively in the fourth coordination position). The platinum content of the treated cells was determined for whole cell, nucleus and cytoplasm using inductively coupled plasma mass spectrometry (ICP-MS). Cellular platinum levels are expressed as ng of Pt/mg of protein and the results reported are a mean of seven determinations for each data point (see Fig. 12).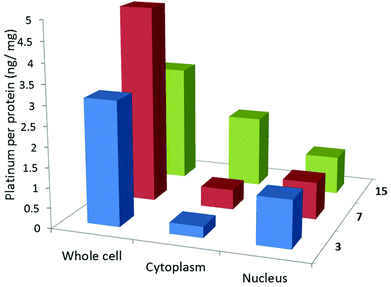 | ||
| Fig. 12 Cellular uptake data for a selection of the complexes under study. The amount of platinum or copper (ng) per protein (mg) is expressed for the whole cell, cytoplasm and nucleus. | ||
The platinum(II)-terpyridine complexes (3 and 7) were found to be taken up by U2OS cells (between 5 and 15% of the administered complexes at 10 μM). More importantly the complexes were also found to enter the nucleus (>0.5 ng of Pt/mg of protein corresponding to 2–8% of the added complexes, was found in the nuclear fractions). The cellular uptake values are comparable to those obtained for other platinum(II) terpyridine-like complexes previously reported.54,55 Yet, for complex 7, cytotoxicity is low implying the thiolate effectively prevents non-specific coordination to proteins and/or DNA. The platinum(II) pyridyl-phenanthroline complex 15 was also taken up by the cells (4% of the administered amount). However, in contrast, the thiol functionalised platinum(II) pyridyl-phenanthroline complex 14 was not taken up by cells, consistent with its low cytotoxicity.
Conclusions
Two new ligands and ten new metal complexes have been successfully prepared and their ability to bind to quadruplex DNA structures (c-Myc and HTelo) demonstrated. In general, most of the complexes were shown to bind c-Myc quadruplex DNA more strongly than ct-DNA and also bind to c-Myc quadruplex better than to Htelo quadruplex DNA. The complexes that display the highest affinity and selectivity for quadruplex DNA are those with the new terpyridine-cyclen ligand L4. In particular, the bimetallic complexes containing a square planar PtII-terpy unit plus a copper(II) or zinc(II)-cyclen moiety, display very high affinities for c-Myc quadruplex DNA (ca. 108 M−1) and up to 1000-fold selectivity over ct-DNA. This is likely to be due to a dual type of interaction where the platinum-terpy complex binds via end stacking with the G-tetrad (at least initially) and the metal-cyclen unit interacts with the loops of the quadruplex. Interestingly, even complex 10, which contains a platinum-terpyridine moiety and a metal-free cyclen, displays very high affinities. It is possible that in this case the cyclen is highly protonated and therefore is able to display strong electrostatic interactions with the negatively-charged phosphate backbone of DNA.For the platinum(II) complexes, we have shown that the nature of the ligand in the fourth coordination position plays an important role in their cytotoxicity. Complexes with chloride in the fourth coordination position have higher cytotoxicity than their thiolated counterparts. This is consistent with previous observations showing that [Pt(trpy)Cl]+ complexes, once inside the cell, can be readily aquated and therefore platinate (by direct coordination) DNA.
Cellular uptake studies showed that complexes 3, 7 and 15 are taken up by U2OS cells and localise in the nucleus whereas phenanthroline-platinum complex 14 is not cell permeable. Therefore, these results indicate that the low cytotoxicity of 14 is associated with poor uptake. Conversely, the low cytotoxicity of 7 is not due to cell permeability issues. Hence it is proposed that the coordinated thiolate prevents it from platinating DNA. Further studies are underway to determine in more detail the quadruplex DNA binding mode of these complexes.
Experimental section
General procedures
1H NMR, 13C NMR and 31P NMR spectra were recorded on a BrukerAvance 400 MHz Ultrashield NMR spectrometer. Electron spray ionisation mass spectra were recorded on a BrukerDaltronics Esquire 3000 spectrometer. Elemental analysis of the compounds prepared was performed by Mr Alan Dickerson (University of Cambridge). Cyc-Tri-BOC,32L1–L3 and 1–416,17 were prepared as previously reported. L1 was purchased from Sigma Aldrich and its purity was checked by 1H NMR spectroscopy prior to use. [PtCl(L1)]Cl, 13, L5 and L6 were prepared by small modifications of reported procedures33,34,56 and their successful syntheses confirmed by comparing the spectroscopic data with that reported in the literature. All oligonucleotides used were purchased from Eurogentec SA.Synthesis
![[thin space (1/6-em)]](https://www.rsc.org/images/entities/char_2009.gif) :
:![[thin space (1/6-em)]](https://www.rsc.org/images/entities/char_2009.gif) 1) (5 mL) and stirred at room temperature for 24 h. The solvents were then removed under reduced pressure and the resulting solid dried. This solid was then dissolved in water and NaOH 2 M (aq) was added dropwise until the solution became alkaline (pH 12). The product was then extracted into dichloromethane. The solvent was removed under reduced pressure to yield a pale yellow sticky solid (0.016 g, 67%); 1H NMR (400 MHz, DMSO-d6): δH 8.74 (d, 2H, 3JHH = 8.0, tpy 2-H), 8.66 (d, 2H, 3JHH = 8.0, tpy 5-H), 8.06 (dd, 2H, 3JHH = 8.0, 8.0, tpy 4-H), 8.02 (s, 2H, tpy′ 3-H and 5-H), 7.55 (dd, 2H, 3JHH = 8.0, 8.0, tpy 3-H), 4.32 (t, 2H, 3JHH = 4.0, propyl 3-H), 3.12–2.82 (br m, 16H, cyclen), 2.92 (t, 2H, 3JHH = 4.0, propyl 1-H), 2.01 (m, 2H, propyl 2-H); (for COSY 1H–1H NMR see Fig. S1 in ESI†); 13C NMR (400 MHz, DMSO-d6): δC 166.6, 156.3, 154.6, 148.9, 137.0, 124.2, 120.8, 106.4, 65.7, 51.4, 50.5, 47.3, 46.0, 44.9, 26.0; 19F NMR(400 MHz, DMSO-d6): absence of peak at δF −77.8 indicates no triflate left; IR (cm−1): 1672, 1585, 1565, 1464, 1444, 1420, 1393, 1198, 1127, 1008, 871, 828, 794, 744, 719; ESI-MS Calcd for C26H35N7O [M]+: 461 a.m.u. Found [M + H]+: 462 a.m.u.
1) (5 mL) and stirred at room temperature for 24 h. The solvents were then removed under reduced pressure and the resulting solid dried. This solid was then dissolved in water and NaOH 2 M (aq) was added dropwise until the solution became alkaline (pH 12). The product was then extracted into dichloromethane. The solvent was removed under reduced pressure to yield a pale yellow sticky solid (0.016 g, 67%); 1H NMR (400 MHz, DMSO-d6): δH 8.74 (d, 2H, 3JHH = 8.0, tpy 2-H), 8.66 (d, 2H, 3JHH = 8.0, tpy 5-H), 8.06 (dd, 2H, 3JHH = 8.0, 8.0, tpy 4-H), 8.02 (s, 2H, tpy′ 3-H and 5-H), 7.55 (dd, 2H, 3JHH = 8.0, 8.0, tpy 3-H), 4.32 (t, 2H, 3JHH = 4.0, propyl 3-H), 3.12–2.82 (br m, 16H, cyclen), 2.92 (t, 2H, 3JHH = 4.0, propyl 1-H), 2.01 (m, 2H, propyl 2-H); (for COSY 1H–1H NMR see Fig. S1 in ESI†); 13C NMR (400 MHz, DMSO-d6): δC 166.6, 156.3, 154.6, 148.9, 137.0, 124.2, 120.8, 106.4, 65.7, 51.4, 50.5, 47.3, 46.0, 44.9, 26.0; 19F NMR(400 MHz, DMSO-d6): absence of peak at δF −77.8 indicates no triflate left; IR (cm−1): 1672, 1585, 1565, 1464, 1444, 1420, 1393, 1198, 1127, 1008, 871, 828, 794, 744, 719; ESI-MS Calcd for C26H35N7O [M]+: 461 a.m.u. Found [M + H]+: 462 a.m.u.
![[thin space (1/6-em)]](https://www.rsc.org/images/entities/char_2009.gif) :
:![[thin space (1/6-em)]](https://www.rsc.org/images/entities/char_2009.gif) 1
1![[thin space (1/6-em)]](https://www.rsc.org/images/entities/char_2009.gif) :
:![[thin space (1/6-em)]](https://www.rsc.org/images/entities/char_2009.gif) 0.02) solvent system to give L8 as an off-white oily-solid (0.21 g, 21%); 1H NMR (400 MHz, CDCl3): δH 9.09 (dd, 1H, 3JHH = 4.0, 2.0, phen 2-H), 9.02 (dd, 1H, 3JHH = 8.0, pyridyl 2-H), 8.83 (s, 1H, phen 7-H), 8.82 (d, 1H, 3JHH = 4.0, phen 9-H), 8.78 (dd, 1H, 3JHH = 4.0, 2.0, phen 4-H), 8.15 (dd, 1H, 3JHH = 4.0, 2.0, phen 10-H), 7.94 (td, 1H, 3JHH = 4.0, 2.0, pyridyl 4-H), 7.60 (dd, 1H, 3JHH = 4.0,2.0, pyridyl 3-H), 7.40 (dd, 1H, 3JHH = 4.0, 2.0, phen 3-H), 7.28 (m, 1H, pyridyl 5-H), 4.46 (t, 2H, 3JHH = 6.0, ethyl 1-H), 3.06 (t, 2H, 3JHH = 6.0, ethyl 2-H), 2.66 (m, 4H, pip 1-H), 1.68 (m, 4H, pip 2-H), 1.51 (m, 2H, pip 3-H); ESI-MS Calcd for C24H24N4O [M]+: 384.2 a.m.u. Found [M + Na]+: 407.0 a.m.u.
0.02) solvent system to give L8 as an off-white oily-solid (0.21 g, 21%); 1H NMR (400 MHz, CDCl3): δH 9.09 (dd, 1H, 3JHH = 4.0, 2.0, phen 2-H), 9.02 (dd, 1H, 3JHH = 8.0, pyridyl 2-H), 8.83 (s, 1H, phen 7-H), 8.82 (d, 1H, 3JHH = 4.0, phen 9-H), 8.78 (dd, 1H, 3JHH = 4.0, 2.0, phen 4-H), 8.15 (dd, 1H, 3JHH = 4.0, 2.0, phen 10-H), 7.94 (td, 1H, 3JHH = 4.0, 2.0, pyridyl 4-H), 7.60 (dd, 1H, 3JHH = 4.0,2.0, pyridyl 3-H), 7.40 (dd, 1H, 3JHH = 4.0, 2.0, phen 3-H), 7.28 (m, 1H, pyridyl 5-H), 4.46 (t, 2H, 3JHH = 6.0, ethyl 1-H), 3.06 (t, 2H, 3JHH = 6.0, ethyl 2-H), 2.66 (m, 4H, pip 1-H), 1.68 (m, 4H, pip 2-H), 1.51 (m, 2H, pip 3-H); ESI-MS Calcd for C24H24N4O [M]+: 384.2 a.m.u. Found [M + Na]+: 407.0 a.m.u.
![[thin space (1/6-em)]](https://www.rsc.org/images/entities/char_2009.gif) 080), 331 (8940); ESI-MS Calcd for C26H35Cl4Cu2N7O [M]+: 729 a.m.u. Found [M − Cl]+: 694 a.m.u.; Anal. Calcd for C26H35Cl4Cu2N7O·3H2O: C, 39.80; H, 5.27; N, 12.50; Found: C 39.44, H 4.96, N 12.24.
080), 331 (8940); ESI-MS Calcd for C26H35Cl4Cu2N7O [M]+: 729 a.m.u. Found [M − Cl]+: 694 a.m.u.; Anal. Calcd for C26H35Cl4Cu2N7O·3H2O: C, 39.80; H, 5.27; N, 12.50; Found: C 39.44, H 4.96, N 12.24.
![[thin space (1/6-em)]](https://www.rsc.org/images/entities/char_2009.gif) 500), 334 (12
500), 334 (12![[thin space (1/6-em)]](https://www.rsc.org/images/entities/char_2009.gif) 240); ESI-MS Calcd for C26H35ClCuF18N7OP3Pt [M]+: 1189 a.m.u. Found [M − PF6]+: 1450 a.m.u.; Anal. Calcd For C26H35ClCuF18N7OP3Pt·4H2O·NaCl: C, 23.64; H, 3.28; N, 7.42; Found: C 23.45, H 2.83, N 7.04.
240); ESI-MS Calcd for C26H35ClCuF18N7OP3Pt [M]+: 1189 a.m.u. Found [M − PF6]+: 1450 a.m.u.; Anal. Calcd For C26H35ClCuF18N7OP3Pt·4H2O·NaCl: C, 23.64; H, 3.28; N, 7.42; Found: C 23.45, H 2.83, N 7.04.
X-ray crystallography
![[1 with combining macron]](https://www.rsc.org/images/entities/char_0031_0304.gif) (no. 2), a = 7.46100(15), b = 13.0861(3), c = 14.1346(3) Å, α = 85.6977(18), β = 80.5574(17), γ = 82.6405(18)°, V = 1348.07(5) Å3, Z = 2, Dc = 1.746 g cm−3, μ(Cu-Kα) = 12.511 mm−1, T = 173 K, red needles, Oxford Diffraction Xcalibur PX Ultra diffractometer; 5329 independent measured reflections (Rint = 0.0306), F2 refinement,57–59R1(obs) = 0.0295, wR2(all) = 0.0748, 4924 independent observed absorption-corrected reflections [|Fo| > 4σ(|Fo|), 2θmax = 145°], 337 parameters. CCDC 1023715.
(no. 2), a = 7.46100(15), b = 13.0861(3), c = 14.1346(3) Å, α = 85.6977(18), β = 80.5574(17), γ = 82.6405(18)°, V = 1348.07(5) Å3, Z = 2, Dc = 1.746 g cm−3, μ(Cu-Kα) = 12.511 mm−1, T = 173 K, red needles, Oxford Diffraction Xcalibur PX Ultra diffractometer; 5329 independent measured reflections (Rint = 0.0306), F2 refinement,57–59R1(obs) = 0.0295, wR2(all) = 0.0748, 4924 independent observed absorption-corrected reflections [|Fo| > 4σ(|Fo|), 2θmax = 145°], 337 parameters. CCDC 1023715.
![[1 with combining macron]](https://www.rsc.org/images/entities/char_0031_0304.gif) (no. 2), a = 14.9174(4), b = 15.4884(5), c = 18.5245(5) Å, α = 69.026(3), β = 81.075(2), γ = 63.677(3)°, V = 3582.0(2) Å3, Z = 4 (two independent molecules), Dc = 1.608 g cm−3, μ(Cu-Kα) = 5.773 mm−1, T = 173 K, colourless needles, Oxford Diffraction Xcalibur PX Ultra diffractometer; 13
(no. 2), a = 14.9174(4), b = 15.4884(5), c = 18.5245(5) Å, α = 69.026(3), β = 81.075(2), γ = 63.677(3)°, V = 3582.0(2) Å3, Z = 4 (two independent molecules), Dc = 1.608 g cm−3, μ(Cu-Kα) = 5.773 mm−1, T = 173 K, colourless needles, Oxford Diffraction Xcalibur PX Ultra diffractometer; 13![[thin space (1/6-em)]](https://www.rsc.org/images/entities/char_2009.gif) 810 independent measured reflections (Rint = 0.0342), F2 refinement,57–59R1(obs) = 0.0378, wR2(all) = 0.1087, 11772 independent observed absorption-corrected reflections [|Fo| > 4σ(|Fo|), 2θmax = 145°], 876 parameters. CCDC 1023716.
810 independent measured reflections (Rint = 0.0342), F2 refinement,57–59R1(obs) = 0.0378, wR2(all) = 0.1087, 11772 independent observed absorption-corrected reflections [|Fo| > 4σ(|Fo|), 2θmax = 145°], 876 parameters. CCDC 1023716.
Fluorescent intercalator displacement (FID) assay
The FID assay was performed on a Varian Cary Eclipse spectrometer following a reported procedure.31,36 The 22AG strand (5′-AGG-GTT-AGG-GTT-AGG-GTT-AGG-G-3′) and 20AG strand (5′-GG-GAG-GGT-GGG-GAG-GGT-GGG-3′) were used for the human telomeric and c-Myc studies, respectively. For the duplex DNA studies, a 26 base pair self-complimentary strand (5′-CAA-TCG-GAT-CGA-ATT-CGA-TCC-GAT-TG-3′) was used.UV-VIS titration procedure
The UV-Vis spectra were recorded on a Perkin Elmer Lambda 25 spectrometer. In order to determine the binding constants of the selected complexes with c-Myc, Htelo and ct-DNA, the complexes (50 μM) were titrated with concentrated solutions of DNA (c-Myc: 1.40 mM, Htelo: 2.50 mM and ct-DNA: 4.56 mM) in 50 mM Tris-HCl (pH 7.4)/100 mM KCl buffer. A 1 cm path-length quartz cuvette was used to carry out the measurements. The binding constants were obtained by fitting the data to a reciprocal plot of D/Δεapversus D using the following equation: D/Δεap = D/Δε + 1/(Δε × K) where the concentration of DNA is expressed in terms of base pairs (determined by measuring the absorption at 260 nm and the appropriate extinction coefficients), the apparent molar extinction coefficient εa = Aobserved/[complex], Δεap = [εa − εf] and Δε = [εb − εf]. εb is the extinction coefficient of the DNA bound complex and εf is the extinction coefficient of the free complex.Cellular studies – general procedures
The U2OS human osteosarcoma and GM05757 normal human fibroblast cell lines were obtained from the London Research Institute, Cancer Research UK. The cells were maintained in Dulbecco's Modified Eagle's Medium (DMEM-low glucose) media which was supplemented with 10% fetal bovine serum and 1% penicillin/streptomycin. All cells were grown at 310 K in a humidified atmosphere containing 5% CO2.MTS cytotoxicity assays
Cells (5 × 10⁴ for U2OS and 1 × 10⁴ for GM05757) were seeded in each well of a 96-well plate. After 24 h the cells were exposed to various concentrations of the test compound (0–500 μM) for a further 24 h (total volume 100 μL). The test compounds were prepared as 10 mM solutions in DMSO and diluted further using DMSO. The final concentration of DMSO in each well was 4%. After the incubation period, 20 μL of the MTS solution (made up of 2 mg mL−1 MTS reagent + 100 μL of PMS 0.96 mg mL−1) was added to each well. The mixture was incubated for a further 1.5 h at 37 °C. After this time, the absorption at 490 nm was recorded and the EC50 values were determined using the Conventional Method (“Refinement in the Use and Data Analysis of the Promega CellTiter 96® AQueous Non-Radioactive Cell Proliferation Assay” by A. Zarei and B. Markovic, Promega Corporation, 2000). EC50 values were calculated from the following equation: Abs EC50 = (Abs EC0 + Abs EC100)/2; where EC0 is the mean absorption at 490 nm of the media only and EC100 is the mean absorption at 490 nm of the cells only (with 4% DMSO). Then the x-axis intercept of the dose–response curve at Abs EC50 (determined by the above equation) was considered as the EC50 value for each test compound. The dose–response curve plot the concentration of test compound exposed to the cells (x-axis) against absorption at 490 nm (y-axis). Prior to plotting the curve the background absorption (due to the reaction of the test compound and MTS reagents) was subtracted from the absorption values obtained from the cells that had been incubated with the compounds.Cellular uptake protocol
To measure the cellular uptake of the metal complexes, ca. 2 million U2OS cells were treated with 10 μM of the corresponding compound at 37 °C for 24 h. Then the media was removed, the cells were washed with PBS solution (×3), harvested from adherent cultures by trypsinization and centrifuged (1000g for 5 min). The cellular pellet was suspended in an appropriate volume of PBS to obtain a homogeneous cell suspension. The suspension was divided in two. One part was used to analyse the metal content in the whole cell and the other was used for the cytoplasmic and nucleus analysis. The Thermo Scientific NE-PER Nuclear and Cytoplasmic Extraction Kit was used to extract the separate cytoplasmic and nuclear protein fractions. From each of the fraction aliquots were removed for protein determination using the Bradford Assay (carried according to the instructions of the manufacturer – Sigma Aldrich, micro-well plate protocol). The remaining cell suspension was mineralized with 65% HNO3 and then completely dried at 120 °C. The solid extracts were re-dissolved in 2% HNO3 and analysed using ICP-MS. Cellular metal levels were expressed as ng metal/mg protein. Results are presented as the mean of 7 determinations for each data point ± standard deviation obtained in three separate experiments. The fraction of the administered complexes that were taken up by the cells was calculated by dividing the amount of complex detected in the whole cell, cytoplasm and nucleus (i.e. the raw measurement in ng) by the total mass of metal corresponding to the concentration administered for each complex (10 μM converted to ng). The fractions were normalised so that all treated cells were accounted. The percentage of the administered complexes that were taken up by the cells was then determined by timing the normalised fractions by 100.Acknowledgements
The UK's Engineering and Physical Sciences Research Council (EPSRC) is thanked for studentships to V.S.S., K.S. and A.S., and a Leadership Fellowship to R.V. (grant number: EP/H005285/1). Johnson Matthey PLC is thanked for a generous loan of platinum.References
- P. L. T. Tran, A. De Cian, J. Gros, R. Moriyama and J.-L. Mergny, Top. Curr. Chem., 2013, 330, 243–274 CrossRef CAS.
- N. Maizels and L. T. Gray, PLoS Genet., 2013, 9, e1003468 CAS.
- P. Murat and S. Balasubramanian, Curr. Opin. Genet. Dev., 2014, 25, 22–29 CrossRef CAS PubMed.
- S. Balasubramanian, L. H. Hurley and S. Neidle, Nat. Rev. Drug Discovery, 2011, 10, 261–275 CrossRef CAS PubMed.
- S. Balasubramanian and S. Neidle, Curr. Opin. Chem. Biol., 2009, 13, 345–353 CrossRef CAS PubMed.
- M. Duchler, J. Drug Targeting, 2012, 20, 389–400 CrossRef CAS PubMed.
- G. W. Collie and G. N. Parkinson, Chem. Soc. Rev., 2011, 40, 5867–5892 RSC.
- D. Monchaud and M.-P. Teulade-Fichou, Org. Biomol. Chem., 2008, 6, 627–636 CAS.
- A. Arola and R. Vilar, Curr. Top. Med. Chem., 2008, 8, 1405–1415 CrossRef CAS.
- S. Zhang, Y. Wu and W. Zhang, ChemMedChem, 2014, 9, 899–911 CrossRef CAS PubMed.
- S. N. Georgiades, N. H. Abd Karim, K. Suntharalingam and R. Vilar, Angew. Chem., Int. Ed., 2010, 49, 4020–4034 CrossRef CAS PubMed.
- N. H. Abd Karim, O. Mendoza, A. Shivalingam, A. J. Thompson, S. Ghosh, M. K. Kuimova and R. Vilar, RSC Adv., 2014, 4, 3355–3363 RSC.
- J. E. Reed, S. Neidle and R. Vilar, Chem. Commun., 2007, 4366–4368 RSC.
- K. Suntharalingam, A. Leczkowska, M. A. Furrer, Y. Wu, M. K. Kuimova, B. Therrien, A. J. P. White and R. Vilar, Chem. – Eur. J., 2012, 18, 16277–16282 CrossRef CAS PubMed.
- J. E. Reed, A. J. P. White, S. Neidle and R. Vilar, Dalton Trans., 2009, 2558–2568 RSC.
- K. Suntharalingam, A. J. White and R. Vilar, Inorg. Chem., 2010, 49, 8371–8380 CrossRef CAS PubMed.
- K. Suntharalingam, A. J. P. White and R. Vilar, Inorg. Chem., 2009, 48, 9427–9435 CrossRef CAS PubMed.
- S. Ghosh, O. Mendoza, L. Cubo, F. Rosu, V. Gabelica, A. J. P. White and R. Vilar, Chem. – Eur. J., 2014, 20, 4772–4779 CrossRef CAS PubMed.
- H. Bertrand, D. Monchaud, A. De Cian, R. Guillot, J.-L. Mergny and M.-P. Teulade-Fichou, Org. Biomol. Chem., 2007, 5, 2555–2559 CAS.
- H. Bertrand, S. Bombard, D. Monchaud, E. Talbot, A. Guedin, J.-L. Mergny, R. Grunert, P. J. Bednarski and M.-P. Teulade-Fichou, Org. Biomol. Chem., 2009, 7, 2864–2871 CAS.
- E. Largy, F. Hamon, F. Rosu, V. Gabelica, E. De Pauw, A. Guedin, J.-L. Mergny and M.-P. Teulade-Fichou, Chem. – Eur. J., 2011, 17, 13274–13283 CrossRef CAS PubMed.
- A. Artese, L. Parrotta, S. Alcaro, F. Ortuso, G. Costa and C. Sissi, Open J. Med. Chem., 2013, 3, 41–49 CrossRef CAS.
- S. Bianco, C. Musetti, A. Waldeck, S. Sparapani, J. D. Seitz, A. P. Krapcho, M. Palumbo and C. Sissi, Dalton Trans., 2010, 39, 5833–5841 RSC.
- K. J. Castor, J. Mancini, J. Fakhoury, N. Weill, R. Kieltyka, P. Englebienne, N. Avakyan, A. Mittermaier, C. Autexier, N. Moitessier and H. F. Sleiman, ChemMedChem, 2012, 7, 85–94 CrossRef CAS PubMed.
- A. F. Larsen, M. C. Nielsen and T. Ulven, Chem. – Eur. J., 2012, 18, 10892–10902 CrossRef CAS PubMed.
- C. Musetti, A. P. Krapcho, M. Palumbo and C. Sissi, PLoS One, 2013, 8, e58529 CAS.
- S. F. Ralph, Curr. Top. Med. Chem., 2011, 11, 572–590 CrossRef CAS.
- J. Wang, K. Lu, S. Xuan, Z. Toh, D. Zhang and F. Shao, Chem. Commun., 2013, 49, 4758–4760 RSC.
- J.-T. Wang, X.-H. Zheng, Q. Xia, Z.-W. Mao, L.-N. Ji and K. Wang, Dalton Trans., 2010, 39, 7214–7216 RSC.
- D. Monchaud, C. Allain, H. Bertrand, N. Smargiasso, F. Rosu, V. Gabelica, A. De Cian, J. L. Mergny and M. P. Teulade-Fichou, Biochimie, 2008, 90, 1207–1223 CrossRef CAS PubMed.
- D. Monchaud, C. Allain and M. P. Teulade-Fichou, Bioorg. Med. Chem. Lett., 2006, 16, 4842–4845 CrossRef CAS PubMed.
- C.-Q. Xia, X.-Y. Tan, S.-Y. Chen, Y. Yue and X.-Q. Yu, ARKIVOC, 2006, 68–76 CAS.
- N. Lazarova, J. Babich, J. Valliant, P. Schaffer, S. James and J. Zubieta, Inorg. Chem., 2005, 44, 6763–6770 CrossRef CAS PubMed.
- J. J. Moore, J. J. Nash, P. E. Fanwick and D. R. McMillin, Inorg. Chem., 2002, 41, 6387–6396 CrossRef CAS PubMed.
- The N4Cu(2)Cl(3) portion of the cation in the structure of 9 is highly disordered, so the details of the geometry should be treated with caution. See the ESI† for more details.
- D. Monchaud, C. Allain, H. Bertrand, N. Smargiasso, F. Rosu, V. Gabelica, A. De Cian, J. L. Mergny and M. P. Teulade-Fichou, Biochimie, 2008, 90, 1207–1223 CrossRef CAS PubMed.
- R. Kieltyka, J. Fakhoury, N. Moitessier and H. F. Sleiman, Chem. – Eur. J., 2008, 14, 1145–1154 CrossRef CAS PubMed.
- V. Wing-Wah Yam, K. Kam-Wing Lo, K.-K. Cheung and R. Yuen-Chong Kong, J. Chem. Soc., Dalton Trans., 1997, 2067–2072 RSC.
- S. Aoki and E. Kimura, J. Am. Chem. Soc., 2000, 122, 4542–4548 CrossRef CAS.
- C.-L. Do-Thanh, M. M. Rowland and M. D. Best, Tetrahedron, 2011, 67, 3803–3808 CrossRef CAS PubMed.
- B. Gruber, S. Stadlbauer, K. Woinaroschy and B. Konig, Org. Biomol. Chem., 2010, 8, 3704–3714 CAS.
- F. Schmidt, S. Stadlbauer and B. Konig, Dalton Trans., 2010, 39, 7250–7261 RSC.
- S. Aoki and E. Kimura, Chem. Rev., 2004, 104, 769–787 CrossRef CAS PubMed.
- I. M. A. del Mundo, M. A. Fountain and J. R. Morrow, Chem. Commun., 2011, 47, 8566–8568 RSC.
- I. M. A. del Mundo, K. E. Siters, M. A. Fountain and J. R. Morrow, Inorg. Chem., 2012, 51, 5444–5457 CrossRef CAS PubMed.
- E. Kikuta, M. Murata, N. Katsube, T. Koike and E. Kimura, J. Am. Chem. Soc., 1999, 121, 5426–5436 CrossRef CAS.
- M. Shionoya, T. Ikeda, E. Kimura and M. Shiro, J. Am. Chem. Soc., 1994, 116, 3848–3859 CrossRef CAS.
- C. Rajput, R. Rutkaite, L. Swanson, I. Haq and J. A. Thomas, Chem. – Eur. J., 2006, 12, 4611–4619 CrossRef CAS PubMed.
- W. I. Sundquist and S. J. Lippard, Coord. Chem. Rev., 1990, 100, 293–322 CrossRef CAS.
- M. Read, R. J. Harrison, B. Romagnoli, F. A. Tanious, S. H. Gowan, A. P. Reszka, W. D. Wilson, L. R. Kelland and S. Neidle, Proc. Natl. Acad. Sci. U. S. A., 2001, 98, 4844–4849 CrossRef CAS PubMed.
- J. K. Barton and S. J. Lippard, Biochemistry, 1979, 18, 2661–2668 CrossRef CAS.
- J. C. Dewan, S. J. Lippard and W. R. Bauer, J. Am. Chem. Soc., 1980, 102, 858–860 CrossRef CAS.
- S. J. Lippard, Acc. Chem. Res., 1978, 11, 211–217 CrossRef CAS.
- C. Sanchez-Cano and M. J. Hannon, Dalton Trans., 2009, 10765–10773 RSC.
- M. Huxley, C. Sanchez-Cano, M. J. Browning, C. Navarro-Ranninger, A. G. Quiroga, A. Rodger and M. J. Hannon, Dalton Trans., 2010, 39, 11353–11364 RSC.
- R. J. Mureinik and M. Bidani, Inorg. Nucl. Chem. Lett., 1977, 13, 625–629 CrossRef CAS.
- G. M. Sheldrick, Acta Crystallogr., Sect. A: Found. Crystallogr., 2008, 64, 112–122 CrossRef CAS PubMed.
- SHELX-2013, http://shelx.uni-ac.gwdg.de/SHELX/index.php Search PubMed.
- SHELXTL, Bruker AXS, Madison, WI Search PubMed.
Footnotes |
| † Electronic supplementary information (ESI) available. CCDC 1023715–1023717. For ESI and crystallographic data in CIF or other electronic format see DOI: 10.1039/c4dt02910k |
| ‡ Current address: Department of Chemistry, King's College London, Britannia House, London SE1 IDB, UK. |
| This journal is © The Royal Society of Chemistry 2015 |

