 Open Access Article
Creative Commons Attribution 3.0 Unported Licence
Correlation between the structural characteristics, oxygen storage capacities and catalytic activities of dual-phase Zn-modified ceria nanocrystals†
Fangjian
Lin
ab,
Renaud
Delmelle
c,
Thallada
Vinodkumar
d,
Benjaram M.
Reddy
d,
Alexander
Wokaun
*b and
Ivo
Alxneit
*ab
aSolar Technology Laboratory, Paul Scherrer Institute, CH-5232 Villigen PSI, Switzerland. E-mail: ivo.alxneit@psi.ch; Fax: +41 56 310 2688; Tel: +41 56 310 4092
bGeneral Energy Research Department, Paul Scherrer Institute, CH-5232 Villigen PSI, Switzerland. E-mail: alexander.wokaun@psi.ch; Fax: +41 56 310 4416; Tel: +41 56 310 2751
cLaboratory for Hydrogen and Energy, EMPA-Swiss Federal Laboratories for Materials Science and Technology, 8600 Dübendorf, Switzerland
dInorganic and Physical Chemistry Division, CSIR - Indian Institute of Chemical Technology, 500607 Hyderabad, India
First published on 5th May 2015
Abstract
Doping ceria with heterocations is a commonly applied strategy to alter its structural and chemical properties including its key feature oxygen storage capacity (OSC). Although a few papers have been published on the structural properties and chemical reactivity of Zn-doped ceria, one lacks a comprehensive investigation on the effect of zinc incorporation in the ceria lattice on its structural properties, and how it could be correlated to the changes in its chemical reactivity including OSC and catalytic activities. Here, we have established an interesting correlation between the structural properties of dual-phase Zn-modified ceria nanocrystals, their OSCs, and their catalytic performance for the reverse water-gas shift (RWGS) reaction and soot oxidation. Upon incorporation of zinc in the ceria lattice, the degree of crystallinity is decreased according to XRD. Raman spectroscopy reveals a concomitant increase of oxygen vacancy concentrations within the Zn-modified ceria samples in comparison to pure ceria. The incorporation of zinc increases the reducibility of ceria according to H2-TPR and doubles the OSC as revealed by thermogravimetric studies. When the variations of the degree of crystallinity, the oxygen vacancy concentrations and the OSCs within the Zn-modified ceria samples are compared, an excellent correlation is established. Catalytic testing shows that Zn-modified ceria exhibits higher activities for the RWGS reaction, especially at the lower temperatures of 400 °C and 600 °C, while at 800 °C the catalyst deactivates rapidly. Such deactivation at high temperature can be totally eliminated by impregnating additional cobalt oxide on the ceria support. Some improvement in the soot oxidation activity is achieved with Zn-modified ceria, attributed to enhanced OSCs of the materials. Within the set of Zn-modified ceria samples, the activities are essentially identical, which is again correlated to their nearly identical OSCs, irrespective of the zinc concentration. Upon impregnation of additional cobalt oxide, the materials' activities for soot oxidation are markedly enhanced, as observed with the RWGS reaction. Pure ceria and Zn-modified ceria samples perform significantly better for soot oxidation after being leached with citric acid. Such enhancement is more pronounced with CZ10 (10 mol% zinc) in comparison to pure ceria. This observation suggests that the removal of non-incorporated ZnO increases the activity for soot oxidation.
Introduction
In recent decades, materials based on ceria (CeO2) have been intensively studied for a wide range of applications. Notable examples include their use as electrolytes1–6 for solid oxide fuel cells, and particularly, as efficient catalysts to remove toxic pollutants from automobile exhausts including CO,7–12 volatile organic compounds,13 NOx,14,15 and soot particulates.16–19 The widespread application of ceria in catalysis is due to its relative abundance and especially its oxygen storage capacity (OSC). Many studies have shown that the three-way catalytic activities of ceria-based materials are intricately linked to their OSCs,8,10,15,16 which can be enhanced by incorporating rare earth and transition metal ions into the ceria lattice. Evident from first-principles calculations, the enhancement of the OSC of ceria is closely related to structural modification of the ceria lattice by the dopants.20–22 By incorporating divalent ions such as Zn2+, Cu2+ and Pd2+, structural distortion to the ceria lattice is induced, creating weakly- or under-coordinated oxygen ions that are more easily removed than in pure CeO2.21 Therefore the oxygen vacancy formation energy of ceria is significantly reduced. Ahn et al. also show that lattice distortion caused by the incorporation of multivalent praseodymium increases oxygen vacancy defects and thus enhances the mobility of oxygen ions, leading to a higher OSC than pure CeO2.22 These computational studies clearly reveal a link between the structural properties of doped ceria and its chemical reactivity.Among the numerous reports existing on the doped ceria, structural characteristics revealed by various techniques such as X-ray powder diffraction (XRD), transmission electron microscopy (TEM) and Raman spectroscopy are often discussed. However, few studies actually present a clear correlation of the structural characteristics of ceria to its chemical reactivity including OSC and catalytic activities. Let us take zinc as the dopant for example. Apart from the investigation of their electrical,23 structural and optical properties,24,25 Zn-doped or Zn-modified ceria materials have also been studied as catalysts or support oxide for gold nanoparticles for CO oxidation.26–30 However, none of these studies presents the effect of zinc incorporation on their OSCs, or in-depth evaluation of the structural characteristics relevant to their chemical reactivity. In fact, despite the promoting effect of zinc on the OSC of ceria suggested by Kehoe et al.,21 there are no reports available in literature presenting a systematic investigation on the effect of zinc incorporation on the structural modification of ceria correlated to its OSC and catalytic activities.
In our previous work,31 we carried out in-depth structural characterization of Zn-doped ceria nanocrystals synthesized by co-precipitation and revealed the presence of substantial amounts of un-incorporated X-ray amorphous ZnO within the seemingly monophasic materials after calcination at relatively modest temperatures. In this paper, the materials are further characterized by XRD and Raman spectroscopy in order to assess Zn-induced changes in crystallinity and defects in the oxygen sub-lattice. X-ray photoelectron spectroscopy (XPS), H2-temperature programmed reduction (H2-TPR) and thermogravimetric analysis (TGA) are employed to evaluate the materials' chemical status and compositions (including depth profiling), redox properties and OSCs. The catalytic activities are investigated for chemical reactions of environmental importance, including the conversion of greenhouse gas CO2 to value added fuel (mainly CO) in presence of H2 and soot combustion for reduced harmful PM (particulate matter) emission from diesel engines. We present in this paper a comprehensive and systematic correlation between the structural characteristics of Zn-modified ceria (i.e. Zn-induced structural modification and oxygen vacancy defects), and its chemical reactivity (i.e. OSC and catalytic activities). In addition, the effect of the second phase, namely the un-incorporated X-ray amorphous ZnO, on the catalytic activity, as briefly mentioned in our previous work and unknown to many previous studies, is elucidated in detail.
Experimental
Synthesis and sample treatment
Zn-modified ceria materials (nominal molar fraction of Zn x = 0.05, 0.1 and 0.2, balance Ce) were synthesized by co-precipitation in exactly the same manner described in a previous work.31 They are designated as CZ5, CZ10 and CZ20 in this paper. For the testing of catalytic activities, samples of 10 mol% of cobalt oxide supported on pure ceria and CZ10 were also synthesized by a simple and modified impregnation method. Cobalt(II) nitrate hexahydrate (Fluka) was used as the precursor. About 58 mg of the precursor salt was mixed with 302 mg of pure ceria or 293 mg of CZ10 (sieved, under 200 um) before adding about 10 ml of de-ionized water. Under mild heating (below 100 °C) and stirring the water was vaporized leaving black-grey fine powders. To obtain the final materials, the powders were then calcined at 500 °C for 3 h under air.In order to remove the un-incorporated X-ray amorphous ZnO from the materials, CZ20 and CZ10 (roughly 300 mg each) were dispersed in about 30 ml of ~0.1 M citric acid solution in two separate glass bottles at ambient temperature. The mixtures were set aside for 2 days and then the supernatant solutions were decanted. About 20 ml of DI water were added to each of the two bottles containing the settled particles. The milky colloidal solutions were let to settle for another 2 days and then decanted. The leached particles were collected by evaporating the water under a pressure of ~50 mbar at 200 °C. The obtained powder materials were finally calcined at 500 °C for 2 h. One pure ceria sample was treated in the same way for comparison.
Characterization
To identify the crystalline phases, the samples were characterized using a PANalytical X'Pert X-ray diffractometer with Cu Kα radiation (λ = 1.5405 Å) operated at 45 kV and 20 mA. The intensity was recorded stepwise at every 0.05° in a continuous scanning mode in the 2θ range of 20° to 80°. An acquisition time of 10 s per step was set for all measurements. Qualitative phase analysis was performed by comparing the peaks of diffractograms with reference data using the PANalytical HighScore software package. Raman spectra were recorded with a Horiba Jobin Yvon HR 800 Raman spectrometer at ambient conditions. The samples were excited by an Ar+ laser (633 nm). An optical microscope was used to focus the laser on the samples. Three different spots were measured for each sample. TEM images of selected samples after synthesis were recorded with a JEOL JEM 2010 transmission electron microscope operated at an acceleration voltage of 200 kV. Each sample was prepared by depositing a droplet of sample suspension in ethanol on a copper grid coated with lacey carbon.The XPS measurements were performed in UHV with base pressures on the order of 10−10 mbar (i.e. 10−9 mbar with X-rays on), using an XR3 Twin Anode (Thermo Scientific) with Al Kα radiation as the X-ray source. The anode power was set to 300 W, with a corresponding acceleration voltage and emission current of 15 kV and 20 mA. The analyser is a PHOIBOS 100 Hemispherical Energy Analyser from SPECS coupled to a HSA 3500 power supply. The measurements were carried out in fixed analyser transmission (FAT) mode with a pass energy of 50 eV. Depth profiling was performed with a Penning Ion Source IQP 10/63 from SPECS. Ar is ionized at low pressure with electrons generated by a cold cathode. The sputtering pressure, which is adjusted by a leak valve, allows the chamber to remain in high vacuum (~10−6 mbar). Discharge currents and voltages were typically around 7 mA and 700 V, with an acceleration potential of 5 kV and currents up to 3.5 μA measured on the specimen surface. For overview spectra, 1 scan was recorded, while 10 scans were recorded for the high resolution regions. The energy step was set to 0.3 eV for all measurements. The XPS data were acquired by the SpecsLab software, while they were processed by the CasaXPS software. The binding energy calibration was based on the usual C 1s binding energy of 285 eV.
To study the effect of zinc incorporation on the reducibility of ceria, H2-TPR was carried out with a home-made test stand. The sample (particle size smaller than 200 μm) was loaded in a quartz tube with an inner diameter of 3 mm. In order to form a proper packed-bed, 500 mg of sample were used. This larger amount would also result in a better TPR signal-to-noise ratio due to increased H2 consumption. Quartz wool was used to plug both sides of the sample bed and a K-type thermocouple was placed in the middle of the bed to record its temperature during heating. The sample was heated to up to 930 °C under a flow of 10 vol% H2 in Ar at a total flow rate of 100 Nml min−1. The H2 consumption was determined by measuring the ion current of m/q = 18 (water vapour) using a Pfeiffer Vacuum D-35614 Asslar mass spectrometer (model: GSD 301 O1). Before H2-TPR measurement, the sample was heated to ~600 °C under a flow of 20 vol% O2 in Ar (total flow rate 100 Nml min−1) in order to eliminate the adsorbed water and hydrocarbons on the sample surface. Although the state of the calcined samples may have been slightly changed by the brief excursion to a higher temperature than the calcination temperature of 500 °C, all samples were subjected to the same procedure and thus the H2-TPR results were comparable.
The OSCs of the samples were determined using a Thermogravimetric analyser (Netzsch TA409). About 100 mg of each sample were loaded in alumina crucible. The sample was exposed alternatively to reducing (10 vol% H2/Ar) and oxidizing conditions (10 vol% O2/Ar) at 500 °C for 4 cycles while the weight was recorded. Each condition lasted for 10 min. To compensate the buoyancy effect, a blank run was measured.
BET surface areas of selected samples were obtained by measuring the N2 adsorption–desorption isotherms using a Micromeritics Tristar II 3020 apparatus at liquid nitrogen temperature (77 K). The samples were degassed for a day at 250 °C before the measurements.
X-ray fluorescence (XRF) results presented in the ESI† of this paper were obtained using an EDAX ORBIS micro X-ray fluorescence analyser. It is equipped with a Rhodium anode and a solid-state multi-channel photon detector. It was operated at 35 kV and 400 μA. For spectra collection, the beam size was set to 2 mm in diameter and the collection time to 100 s. For elemental mapping, a dwell time of 200 ms was selected and the beam size was set to 30 μm.
Catalytic tests
Both the RWGS reaction and soot combustion were carried out using the Netzsch TA409 thermogravimetric analyser. For the RWGS reaction, a gas mixture of H2 and CO2 (10 Nml min−1 each) balanced with Ar (80 Nml min−1) was used. The temperature was increased to 400 °C, 600 °C and 800 °C, and maintained for 1 h at each temperature. The concentrations of CO, CO2, H2 and CH4 in the effluent gases were quantified by a micro gas chromatographer (Varian micro GC 4900) at a time interval of approximately 2 min. Meanwhile the relative weight changes during the RWGS reaction were recorded.To evaluate the performance of the materials for soot oxidation, carbon black from Degussa (Printex-U) was used as the model soot. The measurements were performed by heating approximately 30 mg of the soot–catalyst mixtures in synthetic air (total flow rate 100 NmL min−1) in the TG analyser at a heating rate of 10 °C min−1. In order to achieve a tight contact between the soot and the materials (weight ratio ~1![[thin space (1/6-em)]](https://www.rsc.org/images/entities/char_2009.gif) :
:![[thin space (1/6-em)]](https://www.rsc.org/images/entities/char_2009.gif) 4), the mixtures were ground with a pestle in an agate mortar. The soot conversion was evaluated by determining the relative weight losses between 200 °C and 700 °C.
4), the mixtures were ground with a pestle in an agate mortar. The soot conversion was evaluated by determining the relative weight losses between 200 °C and 700 °C.
Results and discussion
Materials characterization
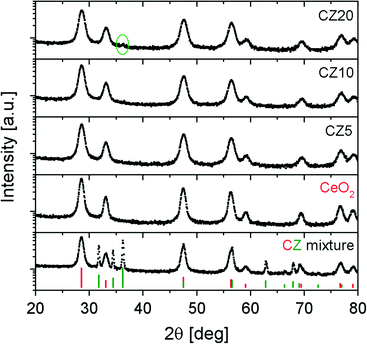
Fig. 1 presents the diffraction patterns of all materials after calcination. The diffraction pattern of an equimolar ceria–ZnO mixture and the stick patterns of ceria and ZnO are included for reference. Note that the intensities of all XRD patterns are plotted in logarithmic scale in order to reveal possible small peaks. It is clear that CZ5 and CZ10 show only reflections that are characteristic of cubic fluorite ceria. However, from our previous work,31 we know that substantial amounts of X-ray amorphous ZnO are present and only a fraction of the zinc is incorporated in the ceria lattice. A careful examination on the diffraction pattern of CZ20 reveals that there is a very small peak at about 36.306° (2θ), which is attributed to ZnO (101). The intensity of this peak is orders of magnitude lower than that of the ceria, suggesting very poor crystallinity of the un-incorporated ZnO. This is generally in line with the findings from our previous work.31 Despite the fact that substantial amounts of X-ray amorphous ZnO are not incorporated into the ceria lattice, insertion of some zinc cations is inferred by the shift of the most prominent (111) peak from 28.538° for pure ceria to 28.611°, 28.586° and 28.612° for CZ5, CZ10 and CZ20, respectively. These shifts, verified by multiple measurements, correspond to an initial lattice contraction, then expansion and contraction with increasing zinc concentrations. This could be possibly due to some variation of the concentration of zinc that is actually incorporated in the ceria lattice within the Zn-modified ceria samples.Substitution of Ce4+ by the divalent Zn2+ will cause the formation of extrinsic vacancies in the oxygen sub-lattice.21 These charge compensating oxygen vacancies are evidenced by Raman spectroscopy. Presented in Fig. 2a are the Raman spectra of the samples after calcination. All spectra exhibit a strong peak close to a Raman shift around 465 cm−1 due to the triply degenerate F2g active mode,32,33 characteristic of fluorite-type structures such as cerium dioxide. This scattering contribution can be viewed as the symmetric breathing of the oxygen ions surrounding cerium ions. The much weaker and disorder-induced component around 590–595 cm−1 (denoted as LO in Fig. 2b) is commonly associated with the presence of oxygen vacancies.22,28 This is due to the non-degenerate Raman inactive LO mode caused by a perturbation of the local Ce–O bond symmetry that leads to the relaxation of the symmetry selection rules.32,33 Thus increased intensities of this LO component in the spectra of Zn-modified ceria samples in comparison to pure ceria are the signatures of lattice perturbations caused by the insertion of zinc cations in the ceria lattice. The presence of the LO component in the spectrum of pure ceria corresponds to intrinsic oxygen vacancies and thus indicates that Ce3+ is present after calcination, likely due to incomplete oxidation of the precursor cerium ions.
 | ||
| Fig. 2 Raman spectra of the as-calcined samples: (a) overview and (b) showing the Raman LO band at around 590–595 cm−1. | ||
By normalizing the LO intensity with its corresponding F2g intensity, it is possible to compare the oxygen vacancy concentrations within these materials.34,35 One set of data (square symbol) presented in Fig. 3 shows the variation of the Raman LO/F2g ratios (all values normalized by that of pure ceria) as a function of nominal zinc concentration. Unlike an earlier study by Laguna et al.,29 it is clear that all Zn-modified ceria samples in this study have higher oxygen vacancy concentrations in comparison to pure ceria. Within the Zn-modified samples (CZ5, CZ10 and CZ20), the oxygen vacancy concentration exhibits a small decrease for CZ10 followed by an increase for CZ20. Note that the errors of the oxygen vacancy concentrations obtained from the Raman measurements are not displayed in the graph as nearly identical spectra were obtained for each sample measured at three different locations. Interestingly, this increase in oxygen vacancy concentrations of Zn-modified samples relative to pure ceria as well as the variation within the Zn-modified samples is reflected by the changes in two other parameters, namely the degree of crystallinity and the lattice dimension of all samples, as evidenced by the two remaining sets of data included in Fig. 3. As XRD patterns of all samples were collected under identical conditions, the relative degree of crystallinity can be qualitatively evaluated by comparing the XRD intensities of (111) reflection peaks. The lattice dimensions of all samples are calculated based on the positions of the most prominent XRD reflection peaks: (111). Evident from Fig. 3, the insertion of zinc in the ceria lattice results in reduced degree of crystallinity as well as lattice contraction in comparison to pure ceria. Moreover, the two parameters for the Zn-modified samples vary in the opposite manner to that of the oxygen vacancy concentrations. This interesting and excellent correlation between these three parameters indicates that the smaller zinc cations are primarily incorporated by substituting the larger cerium cations when calcined at 500 °C, which causes the lattice to contract, creates extrinsic charge compensating oxygen vacancies and also distorts the ceria lattice resulting in reduced degree of crystallinity.
Fig. 4 presents typical TEM images of CZ5 (a, b and c) and CZ10 (d, e and f). As seen in Fig. 4a and d, both samples exhibit narrow size distribution with diameters below 10 nm. A close inspection reveals that the samples exhibit nanocube-like morphologies with well-defined edges and facets. Fig. 4b and e present the selected area electron diffraction (SAED) patterns of CZ5 and CZ10, confirming the fluorite-type cubic structure of both materials. No evidence of crystalline ZnO is found in the SAED patterns, consistent with XRD results (see Fig. 1). Discrete diffraction spots are clearly discernible in the SAED pattern of CZ10 due to a smaller diffraction area. Fig. 4c and f are typical HRTEM images of CZ5 and CZ10, confirming the nanocrystalline nature of the materials. Lattice fringes with a spacing of approximately 0.261 nm, indexed as ceria (200) lattice planes are clearly visible. The lattice plane with a spacing of approximately 0.161 nm (Fig. 4c) could be attributed to a ceria single crystal with an orientation of (311). Both of the two values are slightly smaller than those of the pure ceria found in the PANalytical HighScore software database (PDF 00-004-0593): approximately 0.271 nm for (200), and 0.163 nm for (311), consistent with the observed lattice contraction as shown in Fig. 3.
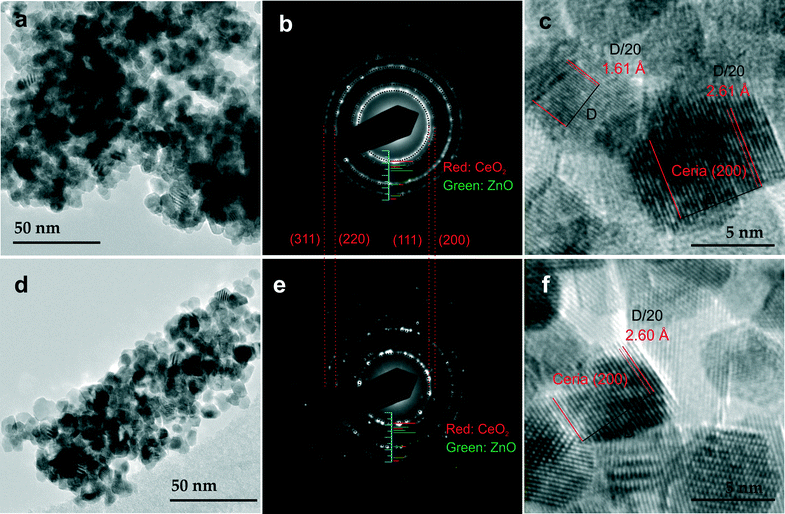 | ||
| Fig. 4 TEM images of CZ5 (a) and CZ10 (d) at lower magnifications showing nanocrystals of relatively uniform sizes. Corresponding SAED patterns of CZ5 (b) and CZ10 (e): stick patterns shown in Fig. 1 are also included for references. HRTEM images of CZ5 (c) and CZ10 (f) showing clear lattice fringes. | ||
In Fig. 5 background-subtracted Zn 2p, Ce 3d and O 1s XPS spectra of Zn-modified ceria (CZ5 and CZ20) are reported. Survey spectra are reported in the supporting information (see Fig. S1†). The Zn 2p spectrum of CZ20 clearly shows two peaks at about 1022 eV (2p 3/2) and 1045 eV (2p 1/2), indicating a 2+ oxidation state. In contrast, the Zn 2p spectrum of CZ5 only exhibits the more prominent 3/2 peak with an intensity more than one order of magnitude smaller than that of CZ20. This is clearly due to a much lower concentration of zinc in the sample of CZ5. The complicated Ce 3d spectra can be deconvolved into ten components using the notation introduced by Burroughs and colleagues.36 These components fall into two groups (u and v), originating from the spin-orbit coupling of the cerium 3d core electrons. The v0, v, v′, v′′ and v′′′ components are associated with the 3d5/2 electrons with a lower binding energy, and the u0, u, u′, u′′ and u′′′ components with 3d3/2 electrons with a higher binding energy. The u′/v′ (as well as u0/v0) doublet is attributed to the photoemission of 3d electrons from Ce3+ while the other doublets are associated with Ce4+.37 Thus it is evident from Fig. 5b that in the surface layer of the samples cerium is predominantly at 4+ oxidation state. The presence of cerium at 3+ oxidation state, although at a small fraction, is in general agreement with the Raman results which indicate the presence of intrinsic oxygen vacancies conjugated with Ce3+ within pure ceria samples (see Fig. 2), despite that XPS is surface sensitive while Raman spectroscopy probes into the bulk. Applying the quantification method reported by Preisler et al.,38 it is determined that the fraction of cerium at 3+ oxidation state in the surface layer is about 9.2% and 6.8% for CZ5 and CZ20, respectively. The O 1s spectra shown in Fig. 5c are fitted with two sub-bands similarly as reported previously.39,40 The sub-band at lower binding energy (529.6 eV), denoted as Oβ, corresponds to lattice oxygen O2−. The sub-band at higher binding energy (531.8 eV), denoted as Oα, corresponds to chemisorbed surface oxygen (hydroxyl-like groups) or defect oxide that is believed to be highly reactive in oxidation reactions due to its higher mobility.40,41 The Oα/(Oα + Oβ) ratio for CZ5 is about 19.2%, which is slightly lower than the ratio for CZ20 (21.9%). The very close values of Oα/(Oα + Oβ) ratios, despite very different nominal doping level of zinc, also indicates that the actual amount zinc incorporated in the ceria lattice is close, and excess amount of zinc remain non-incorporated in the case of CZ20, consistent with what was revealed by our previous study.31
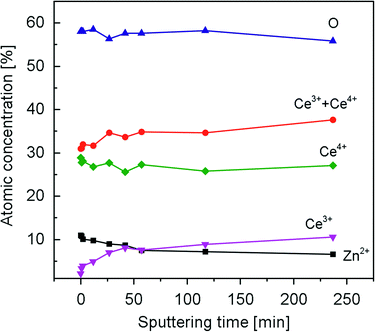
A series of XPS spectra were recorded during the course of sputtering lasting for about 4 h. Based on the deconvolution and quantification methods presented in association with Fig. 5, depth profiles of oxygen, cerium and zinc for CZ20 are presented in Fig. 6. It is evident that the concentration of zinc in the sample decreases significantly, especially within the first 50 min of sputtering. In the as-prepared sample of CZ20, the atomic concentrations of zinc and cerium are 11% and 31%, respectively. This corresponds to a Zn/(Ce + Zn) fraction of 26%, close to the value 29% reported in our previous work.31 After sputtering, the atomic concentration of zinc decreases to 6.6% and the atomic concentration of cerium increases to 38%, corresponding to a Zn/(Ce + Zn) fraction of 15%. In addition, the fraction of cerium in the 3+ oxidation state increases from 6.8% (as-prepared) to 28% (after sputtering), likely due to sputtering-induced reduction of cerium.42,43 The increase in the fraction of cerium in the 3+ oxidation state is also reflected by a decrease in the concentration of oxygen ions. For CZ5 (see Fig. S2†), a similar trend is observed: the concentration of zinc decreases upon sputtering. It is thus reasonable to infer that the doping level of Zn-modified ceria samples is decreasing with increasing depth from the top surface layer.
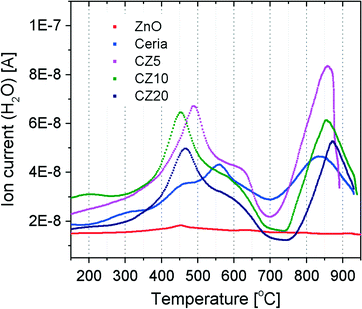
To evaluate the influence of the incorporation of zinc on the reducibility of ceria, H2-TPR was carried out for ZnO, pure ceria, CZ5, CZ10 and CZ20. The results are presented in Fig. 7. Essentially the degree of reduction of crystalline ZnO is negligible at temperatures up to 900 °C, likely due to its relatively large grain size. It is clear that the H2-TPR profiles of all ceria samples contain two major peaks, one at lower temperatures in the ranges of 450–560 °C corresponding to the reduction of surface cerium and the other at higher temperatures between 800 °C and 900 °C likely due to the reduction of cerium in the bulk of ceria. Without the incorporation of zinc in the ceria lattice, the reduction of surface cerium peaks at about 560 °C. For CZ5, CZ10 and CZ20, the peak temperature is reduced to approximately 490 °C, 450 °C and 465 °C respectively, indicating enhanced reducibility of ceria at the surface. A careful examination reveals that the surface reduction profile actually exhibits two peaks, likely attributed to the reduction of cerium in different coordination environments. Interestingly, the bulk reduction peak seems to shift monotonically to slightly higher temperatures with increasing zinc concentrations, from 840 °C for pure ceria to 875 °C for CZ20. This trend is consistent with what has been previously reported by Laguna et al.29 However, there is no evidence suggesting that the shift is due to a suppression of reducibility of the bulk by the incorporation of zinc. A close inspection reveals that the peak corresponding to the bulk reduction in the H2-TPR profile of pure ceria is very symmetrical while for Zn-modified samples it becomes asymmetrical towards the tail at the higher temperature side. As is known from our previous study,31 excess amounts of zinc exist as very fine X-ray amorphous zinc oxide within the Zn-modified ceria materials, particularly in the cases of CZ10 and CZ20. Thus it is possible that the observed shift could be due to hydrogen consumption through the reduction of increasing amounts of non-incorporated zinc oxide that happens at temperatures higher than the temperature for bulk reduction of ceria. In fact, condensation has been observed at the downstream of the quartz tube, suggesting the formation of zinc silicate from the reaction between metallic zinc vapour (by reduction of ZnO) and the silica quartz wool block used to secure the bed materials. Additional evidence is obtained from X-ray fluorescence (XRF) studies showing that after H2-TPR, the zinc concentration within the Zn-modified samples is significantly reduced (see Fig. S3†). Therefore, it is reasonable to conclude that the reducibility of surface cerium is enhanced upon the incorporation of zinc while the reducibility of the bulk is largely unchanged. This is also consistent with the XPS findings (see Fig. 6) that the zinc concentration decreases with sputtering, suggesting a decreasing doping level of zinc incorporated in the ceria lattice.
To quantitatively evaluate the OSC of all samples, we performed cyclic TGA measurements at 500 °C under alternating reducing (10 vol% H2/Ar) and oxidizing (10 vol% O2/Ar) conditions. Relative weight losses and weight gains are reported in Fig. 8. The mass changes in response to the alternating conditions are due to oxygen release and uptake. Since ZnO cannot be reduced in hydrogen at 500 °C as confirmed by in situ XRD under the same conditions (see Fig. S4†), the oxygen release and uptake is attributed to the redox cycle of Ce4+/Ce3+. The rapid mass increase followed by a slower decrease observed when switching reacting conditions is an artifact caused by incompletely compensated buoyancy effect. Such effect originates from the catalytic combustion of H2 with O2 in presence of ceria, while during blank measurements this catalytic effect is not available as no ceria is present. By comparing the mass change profiles of pure ceria and Zn-modified ceria, clear differences emerge. First, the rates of reduction for Zn-modified samples are considerably higher than the rate for pure ceria. This strongly indicates enhanced reducibility due to the incorporation of zinc in the ceria lattice, consistent with the finding from the H2-TPR results (see Fig. 7) and first-principles calculations.21 Second, the relative mass changes for Zn-modified samples are higher than that of pure ceria, meaning enhanced OSCs, although the reduction is not yet complete after 10 min exposure to the reducing condition.
 | ||
| Fig. 8 TGA curves showing the periodic mass changes of the samples when they are subjected to alternating reducing (~10 vol% H2/Ar) and oxidizing atmospheres (~10 vol% O2/Ar) at 500 °C. | ||
By averaging the relative mass changes over multiple cycles, the OSCs of all samples are obtained (Fig. 9). Zn-modified ceria (CZ5, CZ10 and CZ20) exhibits an OSC of 263.5 ± 11.6, 251.3 ± 8.2 and 267.7 ± 9 μmol O g−1 respectively, nearly twice the value of pure ceria (135.5 ± 3.5 μmol O g−1). There is no appreciable increase in the OSC as the nominal zinc concentration increases from 5 mol% (CZ5) to 20 mol% (CZ20), likely due to the fact that the excess zinc is not incorporated in the ceria lattice but exists as a separate amorphous phase of zinc oxide.31 Interestingly, the variation of the OSCs of all samples as shown in Fig. 9 exhibits an excellent correlation with three other parameters namely the oxygen vacancy concentration (LO/F2g), degree of crystallinity (XRD intensity) and lattice dimensions (see Fig. 3). This excellent correlation between these four different parameters demonstrates experimentally the close link between the structural properties and chemical reactivity of doped ceria.20
 | ||
| Fig. 9 Averaged OSC of all samples calculated from the weight losses over multiple redox cycles, correlated with LO/F2g, IXRD (XRD intensity) and LD (lattice dimension) as presented in Fig. 3. | ||
Reverse water-gas shift reaction
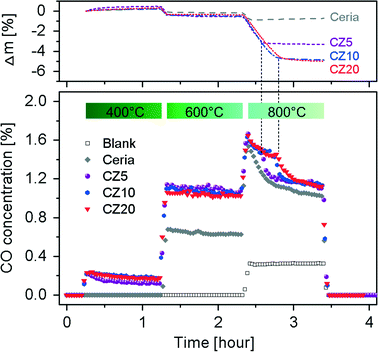
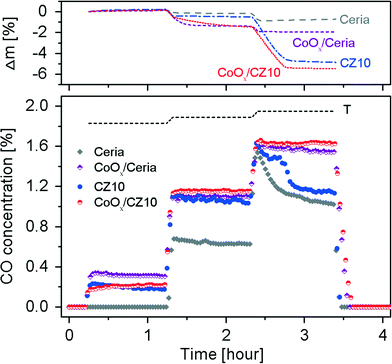
To evaluate the effect of Zn2+ incorporation into ceria lattice on its catalytic activities, we investigated the reverse water-gas shift (RWGS) reaction at temperatures in the range of 400–800 °C using Zn-modified ceria and pure ceria as catalysts with GC as well as the TGA, allowing monitoring the weight changes during the reaction. The time-on-stream mass signals and the CO concentrations in the effluent gases are presented in Fig. 10.It is clear that for both pure ceria and Zn-modified ceria, the RWGS reaction is favoured as the reaction temperature is increased, due to endothermic nature of the reaction. Pure ceria shows no activity for the RWGS reaction at 400 °C. In contrast, Zn-modified ceria exhibits significantly higher activity at this temperature. The promoted catalytic activity of Zn-modified ceria for the RWGS reaction is attributed to its significantly enhanced OSC as shown in Fig. 9. Ceria, as the oxygen carrier in this reaction, catalyses a cycle where it is reduced with the assistance of H2, and subsequently oxidized with CO2, producing CO. Thus a higher OSC of ceria at a given temperature translates to higher CO2 to CO conversion. All samples exhibit a gradual decrease of activity in CO2–CO conversion, with CZ5 being more pronounced especially within the first 10 min of reaction. Although there is no detectable carbon deposition on the samples after the subsequent two higher temperature steps from TGA analyses of the spent catalysts, the possibility of carbon deposition at 400 °C cannot be ruled out, and could account for the observed mass gain and activity decrease. As the temperature is increased to 600 °C, no obvious deactivation is observed for all Zn-modified ceria within an hour while the mass signals stay constant after a small initial decrease that is likely due to the reduction of ceria. However, at 800 °C, all samples show a rapid decrease in activity from the very beginning, which can be attributed to loss of surface area due to sintering at this elevated temperature. BET surface area of pure ceria, measured by nitrogen adsorption–desorption isotherms (see Fig. S5†), decreased from 62.78 ± 0.38 m2 g−1 to 0.57 ± 0.01 m2 g−1 after the RWGS reaction. The Zn-modified samples show almost no advantage over pure ceria, particularly in the later period of the isothermal segment. After about 10 min for CZ5 and 20 min for CZ10 and CZ20, a second-stage deactivation is observed for the Zn-modified samples but not the pure ceria. Interestingly, at exactly the time when the second-stage deactivation starts, the mass signal stabilizes for CZ5, CZ10 and CZ20 after much larger weight losses in contrast to pure ceria. It is observed that all materials turn grey from their initially yellow colour after the RWGS reaction. Since carbon deposition is negligible at this temperature, the change in colour is attributed to the reduction of ceria by H2, consistent with the observation made with the ceria samples after H2-TPR. Thus the considerably larger weight losses for Zn-modified samples can be partially caused by a higher degree of reduction. The main contribution is due to the loss of zinc (see Fig. S6†), likely from the reduction of the non-incorporated ZnO as evidenced in our previous work.31 Thus it is possible that at the beginning the non-incorporated ZnO acts as an inhibitor against sintering of ceria nanocrystals, and with the loss of such ZnO the ceria particles quickly sinter leading to the observed second-stage deactivation.
Cobalt or cobalt-containing catalysts supported on ceria or modified ceria have been investigated for a number of catalytic reactions including ethanol reforming for hydrogen production and CO2 dry reforming of methane (DRM) for syngas production.44–48 Interestingly, one study by Aw et al. shows some “unwanted” activities of cobalt containing catalysts supported on a solid solution of ceria–zirconia for the RWGS reaction during the CO2 DRM process.48 Here, with the aim to improve the catalytic activities of Zn-modified ceria for the RWGS reaction, 10 mol% cobalt oxides (CoOx) were impregnated onto CZ10 and pure ceria. XRD reveals that the dispersed cobalt oxides exhibit poor crystallinity (as Co3O4 phase) in comparison to the ceria support (see Fig. S7†). The RWGS results using CoOx/CZ10 and CoOx/ceria as catalysts are presented in Fig. 11. It is clear that upon impregnation of CoOx, the activity of pure ceria is significantly enhanced at 400 and 600 °C, which can be attributed the additional redox couple associated with cobalt oxide. However, in comparison, with the impregnation of CoOx, the activity of CZ10 is only very marginally enhanced at 400 and 600 °C. A larger weight loss is observed at 600 °C in both cases in contrast to non-impregnated ones, which is due to the reduction of CoOx by hydrogen as reflected by the colour change of the samples after the reaction (dark green to black). The most significant improvement in the activities of the Zn-modified ceria catalysts for the RWGS reaction is observed at 800 °C. CoOx/CZ10 and CoOx/ceria exhibit much more stable activities when compared to CZ10 and pure ceria, although loss of zinc is also evident from the TGA results (also evidenced by XRF mapping, see Fig. S8†). It seems that there is a synergistic effect between the cobalt phase and the supporting ceria phase towards the RWGS reaction. Although the cobalt oxides are not uniformly dispersed on the ceria support due to a relatively simple synthesis route, the obtained materials exhibit excellent thermal stability at even relatively high temperatures (i.e. 800 °C): the dispersion of cobalt is largely unchanged after the reactions (see Fig. S8†). Thus, the CoOx/Ce–O–Zn system could be an effective catalyst for CO2 to CO conversion by the RWGS reaction at modest to high temperatures.
Soot oxidation
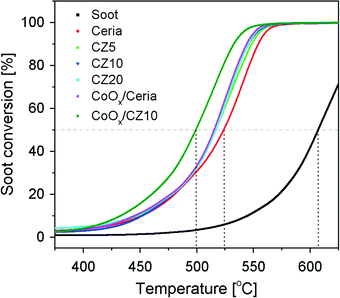
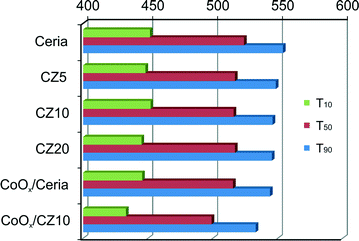
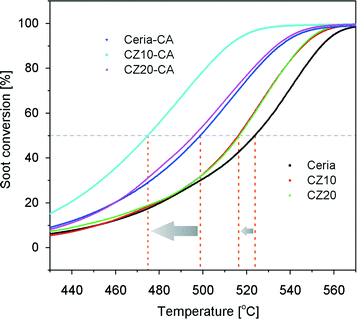
Fig. 12 shows the soot conversion profiles with respect to temperature using pure ceria and Zn-modified ceria as catalysts. The temperatures at which 10%, 50% and 90% of the soot converted (denoted as T10, T50 and T90, respectively) are summarized in Fig. 13. Without any catalysts, the T50 is about 608 °C, significantly higher than the cases catalyzed by ceria. However, the incorporation of zinc in the ceria lattice, although nearly doubling its OSC, only marginally reduces the T50 and T90 by less than 10 °C, with respect to pure ceria. Regardless of the zinc concentration, all Zn-modified ceria samples show nearly identical performance for soot oxidation, which correlates to their nearly identical oxygen storage and release performance as shown in Fig. 9. In attempt to further enhance the oxidative activity of Zn-modified ceria samples, additional 10 mol% cobalt oxides were impregnated on CZ10 (as well as pure ceria), due to promoting effects of cobalt oxides reported by previous studies.49,50 Clearly, cobalt oxides supported by pure ceria exhibit nearly equivalent soot oxidation performance as Zn-modified ceria samples, while the impregnation of cobalt oxides on CZ10 (CoOx/CZ10) is able to further bring down the T50 to just below 500 °C (524 °C for CoOx/ceria), and T90 to 533 °C (554 °C for CoOx/ceria). This can be due to an combined effect of enhanced oxygen storage capacity of ceria due to the incorporation of zinc in the ceria lattice, and the high oxidative activity of cobalt oxides due to its redox property.49As known from our previous study,31 substantial amounts of the zinc exist as non-incorporated X-ray amorphous ZnO within the Zn-modified ceria samples. To study the effect of this additional phase (not detectable by standard XRD) for catalysis, CZ10 and CZ20 were treated with citric acid and then evaluated for their soot oxidation activities. The results are presented in Fig. 14. It is clear that the samples treated with citric acid perform significantly better than the non-treated ones. For instance, the temperature of 50% conversion, T50 , is reduced by 25 °C from 524 °C to 499 °C for pure ceria. This could be due to surface etching effect of the acid, creating more surface defects which are highly active for soot oxidation. Interestingly, acid treatment of CZ10 is able to reduce the T50 more prominently, with T50 decreased by 41 °C (from 516 °C to 475 °C). It is reasonable to rationalize that the removal of the non-incorporated ZnO through acid treatment allows more intimate contact between soot particles and the catalytically active doped ceria particles. Thus, this observation suggests a detrimental role of the non-incorporated X-ray amorphous ZnO for soot oxidation.
Conclusions
In this study, we have established an interesting correlation between the structural properties of Zn-modified ceria nanocrystals, their oxygen storage capacities (OSCs) and catalytic performance for the RWGS reaction and soot oxidation. The incorporation of zinc in the ceria lattice is reflected by decreased crystallinity evidenced by XRD and a correlated increase of oxygen vacancy concentration evidenced by Raman spectroscopy. The incorporation of zinc increases the reducibility of ceria according to H2-TPR and doubles the OSC of pure ceria as revealed by thermogravimetric studies. Catalytic tests show that Zn-modified ceria samples exhibit much better activities for the RWGS reaction especially at lower temperatures of 400 °C and 600 °C, while at higher temperatures, the catalysts deactivate rapidly, which is correlated to the loss of zinc due to the reduction of non-incorporated ZnO by hydrogen. This seems to suggest that the second ZnO phase plays a beneficial role for the RWGS reaction. By impregnating additional cobalt oxide on the ceria support, deactivation can be eliminated and the material is able to maintain high level of activity at 800 °C. Some improvement in the activity for soot oxidation is achieved with Zn-modified ceria in comparison to pure ceria, due to enhancement in the OSCs of the materials. Upon impregnation of additional 10 mol% cobalt oxide, the material's activity soot oxidation is markedly enhanced. It is found that after being treated with citric acid, pure ceria and Zn-modified ceria samples perform significantly better for soot oxidation. The T50 is reduced by 25 °C for pure ceria and 41 °C for CZ10, suggesting a detrimental role of the non-incorporated ZnO phase for soot oxidation.Acknowledgements
This work was funded by the Indo Swiss Joint Research Program (grant #138852). This work was also partly supported by the European Commission, grant agreement no. FP7–284522 (infrastructure program H2FC) and the UZH-UFSP program LightChEC. The authors are grateful for the technical support from Mr. Alwin Frei. Fangjian Lin would like to thank Dr. Camelia N. Borca for assistance in XRF measurements.Notes and references
- H. Inaba and H. Tagawa, Solid State Ionics, 1996, 83, 1–16 CrossRef CAS.
- M. Mogensen, N. M. Sammes and G. A. Tompsett, Solid State Ionics, 2000, 129, 63–94 CrossRef CAS.
- V. V. Kharton, F. M. Figueiredo, L. Navarro, E. N. Naumovich, A. V. Kovalevsky, A. A. Yaremchenko, A. P. Viskup, A. Carneiro, F. M. B. Marques and J. R. Frade, J. Mater. Sci., 2001, 36, 1105–1117 CrossRef CAS.
- V. V. Kharton, F. M. B. Marques and A. Atkinson, Solid State Ionics, 2004, 174, 135–149 CrossRef CAS PubMed.
- D. A. Andersson, S. I. Simak, N. V. Skorodumova, I. A. Abrikosov and B. Johansson, Proc. Natl. Acad. Sci. U. S. A., 2006, 103, 3518–3521 CrossRef CAS PubMed.
- A. J. Jacobson, Chem. Mater., 2010, 22, 660–674 CrossRef CAS.
- S. Carrettin, P. Concepcion, A. Corma, J. M. L. Nieto and V. F. Puntes, Angew. Chem., Int. Ed., 2004, 43, 2538–2540 CrossRef CAS PubMed.
- B. M. Reddy, L. Katta and G. Thrimurthulu, Chem. Mater., 2010, 22, 467–475 CrossRef CAS.
- N. J. Lawrence, J. R. Brewer, L. Wang, T. S. Wu, J. Wells-Kingsbury, M. M. Ihrig, G. H. Wang, Y. L. Soo, W. N. Mei and C. L. Cheung, Nano Lett., 2011, 11, 2666–2671 CrossRef CAS PubMed.
- Q. Dong, S. Yin, C. Guo and T. Sato, Catal. Sci. Technol., 2012, 2, 2521–2524 CAS.
- D. H. Prasad, S. Y. Park, H. I. Ji, H. R. Kim, J. W. Son, B. K. Kim, H. W. Lee and J. H. Lee, J. Phys. Chem. C, 2012, 116, 3467–3476 CAS.
- V. M. Shinde and G. Madras, Appl. Catal., B, 2013, 138, 51–61 CrossRef PubMed.
- A. Aranda, E. Aylon, B. Solsona, R. Murillo, A. Maria Mastral, D. R. Sellick, S. Agouram, T. Garcia and S. H. Taylor, Chem. Commun., 2012, 48, 4704–4706 RSC.
- M. Casapu, O. Kroecher and M. Elsener, Appl. Catal., B, 2009, 88, 413–419 CrossRef CAS PubMed.
- X. Yao, C. Tang, Z. Ji, Y. Dai, Y. Cao, F. Gao, L. Dong and Y. Chen, Catal. Sci. Technol., 2013, 3, 688–698 CAS.
- L. Katta, P. Sudarsanam, G. Thrimurthulu and B. M. Reddy, Appl. Catal., B, 2010, 101, 101–108 CrossRef CAS PubMed.
- K. Harada, T. Oishi, S. Hamamoto and T. Ishihara, J. Phys. Chem. C, 2014, 118, 559–568 CAS.
- D. N. Durgasri, T. Vinodkumar, F. Lin, I. Alxneit and B. M. Reddy, Appl. Surf. Sci., 2014, 314, 592–598 CrossRef CAS PubMed.
- M. Piumetti, S. Bensaid, N. Russo and D. Fino, Appl. Catal., B, 2015, 165, 742–751 CrossRef CAS PubMed.
- A. Gupta, U. V. Waghmare and M. S. Hegde, Chem. Mater., 2010, 22, 5184–5198 CrossRef CAS.
- A. B. Kehoe, D. O. Scanlon and G. W. Watson, Chem. Mater., 2011, 23, 4464–4468 CrossRef CAS.
- K. Ahn, D. S. Yoo, D. H. Prasad, H.-W. Lee, Y.-C. Chung and J.-H. Lee, Chem. Mater., 2012, 24, 4261–4267 CrossRef CAS.
- K. Schmale, M. Daniels, A. Buchheit, M. Gruenebaum, L. Haase, S. Koops and H.-D. Wiemhoefer, J. Electrochem. Soc., 2013, 160, F1081–F1087 CrossRef CAS PubMed.
- R. X. Li, S. Yabe, M. Yamashita, S. Momose, S. Yoshida, S. Yin and T. Sato, Mater. Chem. Phys., 2002, 75, 39–44 CrossRef CAS.
- I. Nurhasanah, H. Sutanto and R. Futikhaningtyas, in 2013 International Conference on Advanced Materials Science and Technology, ICAMST 2013, Trans Tech Publications, Yogyakarta, 2014, vol. 896, pp. 108–111 Search PubMed.
- J. Papavasiliou, G. Avgouropoulos and T. Ioannides, Appl. Catal., B, 2007, 69, 226–234 CrossRef CAS PubMed.
- G. Avgouropoulos, M. Manzoli, F. Boccuzzi, T. Tabakova, J. Papavasiliou, T. Ioannides and V. Idakiev, J. Catal., 2008, 256, 237–247 CrossRef CAS PubMed.
- O. H. Laguna, F. R. Sarria, M. A. Centeno and J. A. Odriozola, J. Catal., 2010, 276, 360–370 CrossRef CAS PubMed.
- O. H. Laguna, M. A. Centeno, F. Romero-Sarria and J. A. Odriozola, Catal. Today, 2011, 172, 118–123 CrossRef CAS PubMed.
- S.-L. Zhong, L.-F. Zhang, L. Wang, W.-X. Huang, C.-M. Fan and A.-W. Xu, J. Phys. Chem. C, 2012, 116, 13127–13132 CAS.
- F. Lin, I. Alxneit and A. Wokaun, CrystEngComm, 2015, 17, 1646–1653 RSC.
- J. R. McBride, K. C. Hass, B. D. Poindexter and W. H. Weber, J. Appl. Phys., 1994, 76, 2435–2441 CrossRef CAS PubMed.
- F. Arena, G. Trunfio, J. Negro, B. Fazio and L. Spadaro, Chem. Mater., 2007, 19, 2269–2276 CrossRef CAS.
- M.-F. Luo, Z.-L. Yan, L.-Y. Jin and M. He, J. Phys. Chem. B, 2006, 110, 13068–13071 CrossRef CAS PubMed.
- D. Harshini, D. H. Lee, J. Jeong, Y. Kim, S. W. Nam, H. C. Ham, J. H. Han, T.-H. Lim and C. W. Yoon, Appl. Catal., B, 2014, 148–149, 415–423 CrossRef CAS PubMed.
- P. Burroughs, A. Hamnett, A. F. Orchard and G. Thornton, J. Chem. Soc., Dalton Trans., 1976, 1686–1698 RSC.
- D. R. Mullins, S. H. Overbury and D. R. Huntley, Surf. Sci., 1998, 409, 307–319 CrossRef CAS.
- E. J. Preisler, O. J. Marsh, R. A. Beach and T. C. McGill, J. Vac. Sci. Technol., B, 2001, 19, 1611–1618 CAS.
- Z. Wu, R. Jin, Y. Liu and H. Wang, Catal. Commun., 2008, 9, 2217–2220 CrossRef CAS PubMed.
- C. Fang, D. Zhang, L. Shi, R. Gao, H. Li, L. Ye and J. Zhang, Catal. Sci. Technol., 2013, 3, 803–811 CAS.
- F. Liu, H. He, Y. Ding and C. Zhang, Appl. Catal., B, 2009, 93, 194–204 CrossRef CAS PubMed.
- E. Paparazzo, Surf. Sci., 1990, 234, L253–L258 CrossRef CAS.
- E. Paparazzo, Chem. Eng. J., 2011, 170, 342–343 CrossRef CAS PubMed.
- I. I. Soykal, B. Bayram, H. Sohn, P. Gawade, J. T. Miller and U. S. Ozkan, Appl. Catal., A, 2012, 449, 47–58 CrossRef CAS PubMed.
- I. Luisetto, S. Tuti and E. Di Bartolomeo, Int. J. Hydrogen Energy, 2012, 37, 15992–15999 CrossRef CAS PubMed.
- S. Zeng, X. Zhang, X. Fu, L. Zhang, H. Su and H. Pan, Appl. Catal., B, 2013, 136–137, 308–316 CrossRef CAS PubMed.
- M. S. Aw, I. G. Osojnik Črnivec and A. Pintar, Catal. Sci. Technol., 2014, 4, 1340–1349 CAS.
- M. S. Aw, I. G. Osojnik Črnivec, P. Djinović and A. Pintar, Int. J. Hydrogen Energy, 2014, 39, 12636–12647 CrossRef CAS PubMed.
- J. Liu, Z. Zhao, J. Wang, C. Xu, A. Duan, G. Jiang and Q. Yang, Appl. Catal., B, 2008, 84, 185–195 CrossRef CAS PubMed.
- P. A. Kumar, M. D. Tanwar, N. Russo, R. Pirone and D. Fino, Catal. Today, 2012, 184, 279–287 CrossRef CAS PubMed.
Footnote |
| † Electronic supplementary information (ESI) available. See DOI: 10.1039/c5cy00351b |
| This journal is © The Royal Society of Chemistry 2015 |

