
Full kinetic analysis of a rhodium-catalyzed hydroformylation: beyond the rate-limiting step picture†
U.
Gellrich
a,
T.
Koslowski
*b and
B.
Breit
*a
aInstitut für Organische Chemie, Albert-Ludwigs-Universität, Freiburg, Albertstraße 21, D-79104 Freiburg im Breisgau, Germany
bInstitut für Physikalische Chemie, Albert-Ludwigs-Universität Freiburg, Albertstraße 23a, D-79104 Freiburg im Breisgau, Germany
First published on 27th October 2014
Abstract
A complete dynamic kinetic analysis beyond the steady state approximation of the rhodium-catalyzed hydroformylation with the 6-DPPon ligand is presented. The energy profile was calculated using a CCSD(T):B3LYP scheme. The results are compatible with the experimental trends for this system with regard to the activity, the selectivity and the substrate dependencies. In contrast to the classical understanding of the kinetics, not one rate-limiting step or energetic span governs the catalytic reaction. Conversely, the kinetic analysis shows that several intermediates and transition states control the reaction rate and the selectivity.
Introduction
Rhodium catalyzed hydroformylation, i.e. the formation of aldehydes upon the addition of CO and H2 to an olefin, is one of the most relevant homogeneous catalyzed processes in industry.1 In particular, terminal alkenes are important substrates with linear aldehydes as the most desired products. Hence, beside the activity, the selectivity of the catalytic process is of importance.2,3 Numerous experimental and computational studies on the mechanism of this process were reported.4 The current generally-accepted, dissociative mechanism is depicted in Scheme 1. A [HRh(L)2(CO)2] complex is formed in situ and dissociates in a [HRh(L)2(CO)] complex and CO, the former compound being able to coordinate an olefin via the transition state TS-1. The alkene complex 3 can undergo hydrometallation towards the branched or linear alkyl complex 4. A subsequent CO insertion leads to the 16 valence electron complex [(Acyl)Rh(L)2(CO)] 5. This intermediate can coordinate a second CO molecule to form the saturated acyl complex 5′, in previous studies detected by NMR and in situ IR,5 or undergoes oxidative addition of H2 to yield the octahedral complex 6. Finally, a reductive elimination via TS-5 generates the aldehyde 8 under concomitant formation of the hydride complex 2. Classically, two types of kinetics are discussed. Within the so-called “type I” kinetic, 1 represents the “resting state” of the catalytic transformation and the “rate determining transition state” is either TS-1 or TS-2. A first order dependence of the reaction rate on the olefin concentration and an inverse first order with regard to the CO partial pressure are characteristic for this type of kinetics. The “type II” kinetics shows a first order dependence on the H2 concentration, which is interpreted by assuming that 6′ is the “resting state” of the catalytic transformation and that TS-4 is the “rate determining transition state”.4 | ||
| Scheme 1 The generally accepted mechanism of the rhodium-catalyzed hydroformylation leading to the linear (top cycle) or the branched aldehyde (bottom cycle). The 6-DPPon ligand 9 is able to form hydrogen bond networks in the coordination sphere of a late transition metal. Furthermore, a schematic representation of the two layer IMOMO scheme is given at the example of the hydridodicarbonyl complex 1 is presented: the grey box indicates atoms described at the CCSD(T) level, whereas all other atoms are described at the B3LYP level. | ||
Model and numerical results
In order to gain a more profound understanding of the kinetics, especially with regard to the role of the individual intermediates and transition states for the activity and selectivity, we performed a detailed dynamic kinetic analysis of this process. As a case study we selected the rhodium catalyzed hydroformylation with the self-assembling 6-diphenylphosphinopyridone (6-DPPon, 9) ligand, since many experimental data, including kinetic studies as well as in situ IR and NMR investigations, are available for this system. Furthermore, due to its unique ability to form hydrogen bonds between two tautomeric forms in the coordination sphere of a transition metal, 9 is highly active and achieves selectivities comparable to those obtained with tailor-made bidentate ligands in the hydroformylation of terminal alkenes.6 In our work, quantum mechanical methods are used to model the energy profiles of the probranched and prolinear reaction path shown in Scheme 1. The experimentally used 1-octene was replaced by propene. Since the dynamic kinetic analysis presented herein requires accurate free energies for every elemental step of the catalytic process, methods beyond DFT are necessary.7 Following earlier work of Morokuma and co-workers, we decided to use a two-layer integrated molecular orbital – molecular orbital (IMOMO) scheme to allow for an accurate description of the energetics of all elementary steps of the catalytic transformation.8 The idea of an IMOMO calculation is to split the investigated system into two layers, which are treated by different methods and basis sets. An IMOMO method can be regarded as a special case of an ONIOM method, which usually combines DFT or ab initio methods with molecular mechanics. A model complex with PH3 ligands serves as high layer and is treated with a high-level ab initio method [here a CCSD(T)/MP2 compound method on a BP86/aug-cc-pVTZ optimized structure], whereas the actual molecule of interest, treated at the DFT level (B3LYP/6-31G(d,p)), can be regarded as the low layer. The partitioning scheme is illustrated in Scheme 1. Hydrogen atoms were used to link the two layers. The free energy values obtained at this level of theory for the probranched and the prolinear pathways of the rhodium-catalyzed hydroformylation with 9 are summarized in Table 1. Gas phase translational contributions to the entropy have been corrected to take into account the reduced mobility of ions and complexes in solution.9 A recent theoretical study of a ruthenium-catalyzed metathesis suggests the necessity of this approach.10| ΔGprolinear | ΔGprobranched | |
|---|---|---|
| a IRC calculations confirmed that the lowest energy pathways for the prolinear and probranched hydroformylation involve different conformers of TS-1 and 3. | ||
| 1 | 0 | 0 |
| 2 | 14.84 | 14.84 |
| TS-1a | 22.37 | 20.97 |
| 3 a | 14.35 | 14.05 |
| TS-2 | 24.81 | 26.02 |
| 4 | 14.79 | 23.43 |
| 5 | 5.32 | 10.27 |
| TS-3 | 18.04 | 19.95 |
| 6 | 8.61 | 11.54 |
| TS-4 | 12.47 | 15.14 |
| 7 | 8.00 | 9.74 |
| TS-5 | 15.99 | 16.79 |
| 8 | 0.48 | −0.71 |
| 6′ | −2.22 | 1.12 |
The kinetics of the catalytic cycle presented in Scheme 1 is approached with the help of first-order differential equations. Changes of concentrations of the species i with time are expressed by standard kinetic equations, such as
| dc4/dt = − (k4,TS‐2 + k4,5[CO])c4 + kTS‐2,4cTS‐2 + k5,4c5 | (1) |
 | (2) |
 , can be computed. The elements of the matrix K are the reaction coefficients, multiplied by the constant concentrations of the starting materials, if applicable.
Shaik and coworkers have described a particularly interesting solution of eqn (2) that permits an approximation that leads to the computation of the steady-state concentrations and the catalytic activity of a cycle in terms of a simple quantity, the so-called energetic span.12 From  , it is possible to identify the most abundant species within the cycle, the resting state. Catalytic activity is described by the turnover frequency, here given by TOF = kTS-5,2cTS5/cRh. As an alternative to just looking at the stationary state, we suggest to investigate the complete dynamics of the system by substituting
  , reducing the quasi-first-order differential equations akin to eqn (1) to an eigenvalue problem independent of time. It reads
 | (3) |
This problem has eigenvalues λ1 = 0 and λ2⋯λn > 0, and eigenvectors  , from which the temporal evolution of the concentrations can be computed as
 | (4) |
The coefficients that weight the partial solutions, Aμ, can be computed from the initial conditions. This approach has been used frequently in charge or energy transfer kinetics.13 With the help of eqn (4), a semi-analytical expression for the concentration of the catalytic species at any time is given, hence avoiding the tedious numerical integration of stiff kinetic equations. This approach can not only be used to compute a typical initialization time of the cycle, but in addition leads to a full description of the kinetics including varying alkene and product concentrations. Proceeding a small time step Δt, the product concentration can be computed, e.g. for the left cycle in Scheme 1, via an integration such as
| cp(Δt) = KTS‐5,2∫Δt0cTS‐5(t) dt. | (5) |
Again, it is possible to make use of eqn (4) for the computation of the reductive elimination transition state concentration, cTS-5, and for an analytical representation of the integral. The alkene concentration at the end of this time step is given by a simple argument of stoichiometry as cE(Δt) = cE(0) − cP(Δt) − Σici(Δt), where the sum is only taken over those rhodium complexes within the catalytic cycle ligated by the alkene. Replacing the initial conditions by  and cE(Δt), the calculation can now be performed repeatedly, until the starting material has all but vanished. In practice, Δt is chosen to meet a small decline in the alkene concentration, ΔcE = cE(t = 0) × 10−4, at each time step. From this integration, further characteristic times such as the starting material half life can be accessed.
First, however, the reliability of the kinetic model has to be demonstrated. For this purpose, we compare the calculated turn over frequency and the selectivity to those obtained experimentally (Table 2). Keeping in mind the notoriously high error propagation associated with taking the exponential of a free energy to obtain a reaction coefficient (an error of 1.8 kcal mol−1 in ΔG propagates to an order of magnitude in the TOF), the agreement between the experiment and the kinetic model is good with regard to both the catalyst activity and the regioselectivity. To further validate the kinetic analysis approach we benchmarked it against a series of experiments with varied 1-octene concentration and CO partial pressure. Both experimental trends in the TOFs, namely a decrease with increasing CO concentration and an increase with increasing alkene concentration, are reproduced by the numerical approach. All results are displayed in Fig. 1 as a double logarithmic plot of the theoretical versus the experimental TOFs.
![[thin space (1/6-em)]](https://www.rsc.org/images/entities/char_2009.gif) :
: | ||
| Fig. 1 Decadic logarithm of the computed vs. the experimental turnover frequency. Open symbols: olefin concentration series (from left to right: 1.21, 3.63, 6.07 and 8.63 mmol l−1). Closed symbols: CO partial pressure series (from left to right 20, 15, 10 and 5 bar). The dotted line has a slope of unity, it serves as a guide to the eye. | ||
We then focussed on the question which intermediates and transition states are responsible for the activity and selectivity. To study the influence of the free enthalpy of states within the catalytic cycles, the ΔG value of each state has been varied by a small amount, resulting in a change in the turnover frequency. This procedure is equivalent to computing the derivative Si = TOF−1(∂TOF/∂Gi) and extrapolating to a change in ΔGi of one kcal mol−1. The results are depicted in Fig. 2. Here, a value of Si > 1 implies a speedup of the reaction, for Si < 1 the reaction slows down, and ΔGi has no impact on the reaction if Si equals unity. The TOF of the linear hydroformylation is particularly sensitive to changes in the enthalpy of the hydrometallation transition state TS-2 and the hydridocarbonyl complex 1 (red bars). In case of the probranched hydroformylation (green bars), the hydridocarbonly complex 1 together with the alkyl complex 4 and the transition state for the hydrometallation TS-2 have the strongest influence on the TOF (Fig. 3).
 | ||
| Fig. 2 Sensitivity of the turnover frequency w.r.t. a change in the free energy of a reaction intermediate or transition state. The colours indicate the formation of a linear product (red) and a branched product (green). Other states do not show a significant deviation from unity at any reaction condition. | ||
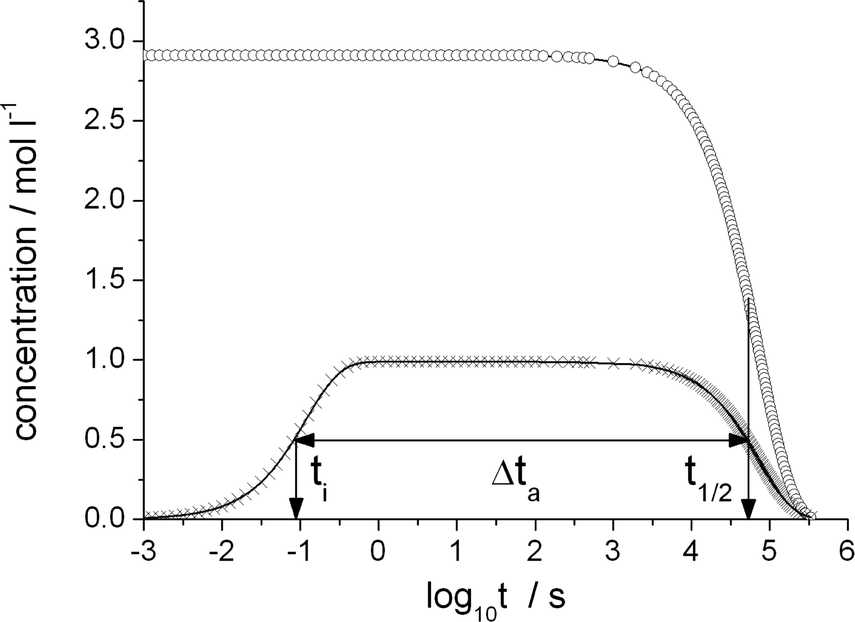 | ||
| Fig. 3 Olefin (circles) and product-generating transition state TS-5 (crosses) concentration as a function of the decadic logarithm of time reaction conditions as in Table 2. The TS-5 concentration has been divided by its static limit. Characteristic time scales: initialization time ti, olefin half life t1/2 and time during which the catalytic cycle is active, Δta. | ||
Increasing the enthalpy of 4 results in a decrease of the activity, an interesting finding as deuterium labelling experiments demonstrated that the probranched hydrometallation is reversible. Notably, our results show that not one rate determining step or energetic span accounts for the activity. Therefore the ΔΔGTS between two transition states neither accounts for the selectivity of the catalytic process! This finding is in stark contrast to the conclusions usually derived from static steady state interpretations of catalytic transformations.
The kinetic analysis predicts that the hydridodicarbonyl complex 1 and at high alkene concentrations is the most abundant species. This is in agreement with previous experimental studies where 1 was detected by in situ IR at low alkene concentrations.7
An approach complementary to our mathematical description of catalytic cycles has been presented by Reek and co-workers.14 By varying the starting material concentrations, these authors have been able to directly access selected reaction rates and integrate them into a kinetic scheme. This approach is feasible once the reaction setup permits such a variation, the number of relevant species participating in the catalytic cycle is comparable to the number of variations that are possible, and if the starting materials participate in only one relevant reaction. Unfortunately, none of these conditions are met by the experimental setup and reaction scheme used in our work. In the most extended scheme, we make use of two coupled catalytic cycles containing 24 species, with CO participating in five of them. Furthermore, our analysis relies on a constant concentration of CO and H2via Henry's law, permitting the application of a (quasi)first order scheme.
Conclusions
In summary, we have developed a method enabling the dynamic kinetic analysis of catalytic transformations and successfully tested it for the rhodium-catalyzed hydroformylation with the 6-DPPon ligand 9.‡ The results show that several intermediates and transition states contribute to the activity and selectivity of the catalytic transformation. This finding is in contrast to common interpretations of the kinetics of catalytic transformations and has to be taken into account when efforts are made towards the in silico design of new catalysts.Acknowledgements
This work was supported by the DFG, the International Research Training Group “Catalysts and Catalytic Reactions for Organic Synthesis” (IRTG 1038). Experimental and computational support by Dr. S. Diezel and M. Kähny is gratefully acknowledged.Notes and references
- K. Weissermel and H.-J. Arpe, Industrial Organic Chemistry, Wiley-VCH, Weinheim, 2003, pp. 127–144 CrossRef CAS; K. D. Wiese and D. Obst, Top. Organomet. Chem., 2006, 18, 1–33 CrossRef CAS.
- B. Breit and L. Diab, in Comprehensive Organic Synthesis, ed. Gary A. Molander and Paul Knochel, Elsevier, Oxford, 2nd edn, 2014, vol. 4, pp. 995–105 CrossRef CAS; B. Breit, Top. Curr. Chem., 2008, 279, 139–172 CrossRef CAS; B. Breit and W. Seiche, Synthesis, 2001, 1–36 CrossRef PubMed.
- T. J. Devon, G. W. Philips, T. A. Puckette, J. L. Stavinoha and J. J. Vanderbilt, US Pat., 4 694 109, 1987 CrossRef CAS; C. P. Casey, G. T. Whiteker, M. G. Melville, L. M. Petrovich, J. A. Gavey and D. R. Powell, J. Am. Chem. Soc., 1992, 114, 10680–10680 CrossRef CAS; E. Billig, A. G. Abatjoglou and D. R. Bryant, US Pat., 4 769 498, 1988 CrossRef; G. D. Cunny and S. L. Buchwald, J. Am. Chem. Soc., 1993, 115, 2066–2068 CrossRef; M. Kranenburg, Y. E. M. v. d. Burgt, P. C. J. Kamer, P. W. N. M. v. Leeuwen, K. Goubitz and J. Fraanje, Organometallics, 1995, 14, 3081–3089 CrossRef.
- See for example P.W.N.M. van Leeuwen in Rhodium Catalyzed Hydroformylation, ed. P.W.N.M. van Leeuwen and C. Claver, Kluwer Academic Publishers, Dordrecht, 2000 CrossRef CAS; T. Matsubara, N. Koga, Y. Ding, D. G. Musaev and K. Morokuma, Organometallics, 1997, 16, 1065–1078 CrossRef CAS; C. R. Landis and J. Uddin, J. Chem. Soc., Dalton Trans., 2002, 729–742 RSC; M. Sparta, K. J. Børve and V. Jensen, J. Am. Chem. Soc., 2007, 129, 8487–8499 CrossRef PubMed; J. J. Carbo, F. Maseras, C. Bo and P. W. N. M. van Leeuwen, J. Am. Chem. Soc., 2001, 123, 7630–7637 CrossRef PubMed; A. L. Watkins and C. R. Landis, J. Am. Chem. Soc., 2010, 132, 10306 CrossRef PubMed; E. Zuidema, L. Escorihuela, T. Eichelsheim, J. J. Carbo, C. Bo, P. C. J. Kamer and P. W. N. M. van Leeuwen, Chem. – Eur. J., 2008, 14, 1843–1853 CrossRef PubMed and the references cited therein. For a recent study on the computational kinetics of the cobalt catalyzed hydroformyation see: L. E. Rush, P. G. Pringle and J. N. Harvey, Angew. Chem., Int. Ed., 2014, 53, 8672–8676 CrossRef PubMed.
- A. G. Kent and J. M. Brown, J. Chem. Soc., Perkin Trans. 2, 1988, 1587–1607 Search PubMed; S. C. van der Slot, P. C. J. Kamer, P. W. N. M. van Leuween, J. A. Iggo and B. T. Heaton, Organometallics, 2001, 20, 430–441 CrossRef CAS; U. Gellrich, W. Seiche, M. Keller and B. Breit, Angew. Chem., 2012, 124, 11195 ( Angew. Chem., Int. Ed. , 2012 , 51 , 11038 ) CrossRef.
- B. Breit and W. Seiche, J. Am. Chem. Soc., 2003, 125, 6608–6609 CrossRef CAS PubMed; U. Gellrich, J. Huang, W. Seiche, M. Keller, M. Meuwly and B. Breit, J. Am. Chem. Soc., 2011, 122, 964–975 CrossRef PubMed; J. Huang, D. Häussinger, U. Gellrich, W. Seiche, B. Breit and M. Meuwly, J. Phys. Chem. B, 2012, 116, 14406–14415 CrossRef PubMed.
- U. Gellrich, D. Himmel, M. Meuwly and B. Breit, Chem. – Eur. J., 2013, 19, 16272–16281 CrossRef CAS PubMed.
- M. Svensson, S. Humbel, R. D. J. Froese, T. Matsubara, S. Sieber and K. Morokuma, J. Phys. Chem., 1996, 100, 19357 CrossRef CAS; S. Humbel, S. Sieber and K. Morokuma, J. Chem. Phys., 1996, 105, 1959 CrossRef PubMed; T. Vreven and K. Morokuma, J. Chem. Theory Comput., 2000, 21, 1419 Search PubMed; V. P. Ananikov, D. G. Musaev and K. Morokuma, J. Mol. Catal. A: Chem., 2010, 324, 104 CrossRef PubMed; A. Anoop, W. Thiel and F. Neese, J. Chem. Theory Comput., 2010, 6, 3137 CrossRef.
- R. L. Martin, P. J. Hay and L. R. Pratt, J. Phys. Chem. A, 1998, 102, 3565–3573 CrossRef CAS; D. Huang, O. V. Makhlynets, L. L. Tan, S. C. Lee, E. V. Rybak-Akimova and R. H. Holm, Proc. Natl. Acad. Sci. U. S. A., 2011, 108, 1222–1227 CrossRef PubMed; D. Huang, O. V. Makhlynets, L. L. Tan, S. C. Lee, E. V. Rybak-Akimova and R. H. Holm, Inorg. Chem., 2011, 50, 10070–10081 CrossRef PubMed; Y. Liang, S. Liu, Y. Xia, Y. Li and Z.-X. Yu, Chem. – Eur. J., 2008, 14, 4361–4373 CrossRef PubMed; Y. Chen, S. Ye, L. Jiao, Y. Liang, S.-D. K. Mahapatra, J. W. Herndon and Z.-X. Yu, J. Am. Chem. Soc., 2007, 129, 10773–10784 CrossRef PubMed; Z. X. Yu and K. N. Houk, J. Am. Chem. Soc., 2003, 125, 13825–13830 CrossRef PubMed; M. Wen, F. Huang, G. Lu and Z.-X. Wang, Inorg. Chem., 2013, 52, 12098 CrossRef PubMed.
- A. Poater, E. Pump, S. V. C. Vummaleti and L. Cavallo, J. Chem. Theory Comput., 2014, 10, 4442–4448 CrossRef CAS.
- J. Christiansen, Adv. Catal., 1953, 5, 311–353 CAS.
- S. Kozuch and S. Shaik, J. Am. Chem. Soc., 2006, 128, 3355–3365 CrossRef CAS PubMed; S. Kozuch and S. Shaik, Acc. Chem. Res., 2011, 44, 101–110 CrossRef PubMed.
- T. Cramer, A. Volta, A. Blumen and T. Koslowski, J. Phys. Chem. B, 2004, 108, 16586–16592 CrossRef CAS , and references therein.
- V. Bocokić, A. Kalkan, M. Lutz, A. L. Spek, D. T. Gryko and J. N. H. Reek, Nat. Commun., 2013, 4, 2670 Search PubMed.
Footnotes |
| † Electronic supplementary information (ESI) available: quantum chemistry input geometries, experimental details, sample kinetic analysis input and output files. See DOI: 10.1039/c4cy01209g |
| ‡ For non-commercial applications, the code written for the full kinetic analysis is available on request free of charge from the authors. |
| This journal is © The Royal Society of Chemistry 2015 |