
Synergistic effect of PtSe2 and graphene sheets supported by TiO2 as cocatalysts synthesized via microwave techniques for improved photocatalytic activity
Kefayat
Ullah
a,
Shu
Ye
a,
Zhu
Lei
a,
Kwang-Yeon
Cho
b and
Won-Chun
Oh
*a
aDepartment of Advanced Materials Science & Engineering, Hanseo University, Seosan-si, Chungnam-do 356-706, Korea. E-mail: wc_oh@hanseo.ac.kr; Fax: +82 41 688 3352; Tel: +82 41 660 1337
bKorea Institutes of Ceramic Engineering and Technology, Seoul 153-801, Korea
First published on 1st September 2014
Abstract
Here we report a new composite material consisting of TiO2 nanoparticles grown in the presence of a layered PtSe2/graphene hybrid as a high-performance photocatalytic material. The heterogeneous PtSe2–graphene/TiO2 nanocomposites were successfully synthesized through a facile and fast microwave-assisted method. The prepared composites were characterized through X-ray diffraction (XRD), scanning electron microscopy (SEM) with energy dispersive X-ray (EDX) spectroscopy, transmission electron microscopy (TEM), Raman spectroscopic analysis, X-ray photoelectron spectroscopy (XPS), and UV-vis absorbance spectra and UV-vis diffuse reflectance spectra (DRS) analyses were obtained. The catalytic behavior was investigated through the decomposition of rhodamine B (Rh. B) as a standard dye and Texbrite MST-L as an industrial dye. This extraordinary photocatalytic activity arises from the positive synergetic effect between the PtSe2 and graphene components in this heterogeneous photocatalyst. In this study the graphene behaves as an electron transfer agent, collector, contributor and a source of active adsorption sites. The optical properties were also observed to be affected by the different weight% of graphene in the composites by observing their respective band gaps from DRS spectra.
Introduction
Since the discovery of graphene and its uses in the field of photocatalysis, scientists have devoted a lot of research to understand and explore the role of this peculiar material. While graphene is a nanomaterial with high electron mobility and elevated conductivity,1,2 it has been reported that bare graphene, graphene oxide or the combination with other semiconductor materials can be used as catalyst materials. The results obtained from these researches greatly highlight the importance of the degree of oxidation of the graphite sheet which greatly influences the catalytic performance.3,4 The combination of graphene oxide with other photocatalyst materials such as BiVO4, PtSe2, CdS/ZnO, TiO2, etc., has been considered in studying the photocatalytic effect, and enhanced catalytic activities were claimed.5–9 The main theme of these ideas is to develop graphene-based semiconductor materials which collect the broadest part of the solar spectrum as a source of energy. In this context, many scientists consider metals or metal complexes supported by organic dyes as light harvesters to absorb light from the solar spectrum and inject electrons into the conduction band of semiconductor materials. A similar approach has been applied to graphene oxide as a light harvester in studying the visible light photocatalytic activity when combined with metal or semiconductor materials.10–14 In particular, owing to its unique sp2 hybrid carbonated network, graphene-based materials have attracted considerable attention because of their high thermal conductivity (~5000 W m−1 K−1), excellent charge mobility at room temperature (200![[thin space (1/6-em)]](https://www.rsc.org/images/entities/char_2009.gif) 000 cm2 V−1 s−1), and extremely high theoretical specific surface area (~2600 m2 g−1).15,16 These excellent properties make graphene an excellent material in photocatalysts to increase the charge transfer separation of generated electron and holes. The potential application of graphene-based photocatalysts to improve the efficiency of solar energy conversion has been explored.17–20
000 cm2 V−1 s−1), and extremely high theoretical specific surface area (~2600 m2 g−1).15,16 These excellent properties make graphene an excellent material in photocatalysts to increase the charge transfer separation of generated electron and holes. The potential application of graphene-based photocatalysts to improve the efficiency of solar energy conversion has been explored.17–20
The factors for an improved photocatalytic mechanism can be divided into four categories: electron–hole pair recombination time; support material acting as a catalyst and providing adsorption sites; modification of the energy gap/proper photo responsive effect; and the use of a cocatalyst to act as the reaction centre for a suitable catalytic effect.21 Recently much attention has been devoted to the photocatalytic effect of graphene-based materials by altering the band gap of the composites to extend the light response in the visible range.22–24 For example Lee et al. have verified the modification of the energy gap in a graphene-based anatase TiO2 nanocomposite. The improved catalytic property has been attributed to the red shift of the band edge from providing a precise band gap in the visible range and allows enhanced absorption of light.25 Similarly Zhang et al. studied the visible light response of the large band gap semiconductor ZnS/graphene oxide and observed enhanced catalytic effect.26 Conversely, combination with graphene alters the optical properties and increases the visible light response of the composites. Another approach, the Z-scheme catalyst system, has been introduced to consider graphene as an electron mediator between two semiconductor photocatalysts.27 The transfer of electrons in the Z-scheme system between two catalysts is the main feature in producing H2, oxygen or other mineral products. The main challenge in manufacturing a solid state electron mediator is in achieving a state of dynamic equilibrium between the electron acceptor and donor, and in remaining unchanged during the reaction while providing a greater interfacial contact. Similarly, ternary CdS–graphene–TiO2 hybrids (CdS–GR–TiO2) have been prepared through an in situ approach on the surface of graphene oxide (GO). It is found that the introduction of the third component TiO2 can sustain the porosity of the samples, tune the band gap, increase the surface area, and facilitate the charge transfer, thus extending the lifetime of photogenerated carriers.28
In spite of these promising results, the main problem which also alters the photocatalytic properties is agglomeration of nanoparticles on the graphene sheets, which causes a poor interfacial contact between the nanoparticles and the graphene surface. Thus homogeneous distribution of nanoparticles and maximum interfacial contact with graphene is an essential factor in enhancing the catalytic activity. This will help to improve the charge transfer effect between the catalytic nanoparticles and the graphene sheets under light illumination. It has been found that the coupling of small energy band graphene-based semiconductors with large energy band photocatalytic materials extends the light response to the visible region due to possible synergistic effects between the composite materials.29,30
In this work we report a fast and facile route for the preparation of a layered PtSe2–graphene supported TiO2 photocatalyst through microwave-assisted techniques. In this process, graphene oxide is mixed with Pt and Se precursor materials, and the resulting solution is irradiated by microwaves for 300 s followed by mixing with the TiO2 precursor material under appropriate conditions. During microwave irradiation, partial reduction of graphene oxide into graphene and attachment of PtSe2 and TiO2 nanoparticles on the graphene sheets was observed in ethylene glycol. The photocatalytic activities of as-prepared nanocomposites were tested with Rh. B as a standard and Texbrite MST-L as an industrial organic pollutant under UV/Vis light.
2. Experimental section
2.1. Materials
Titanium(IV) n-butoxide (TNB, C16H36O4Ti) used as a titanium precursor was purchased from Samchun Pure Chemical Co. Ltd., Korea. Hydrogen hexachloroplatinate(IV) hydrate (H2PtCl6·nH2O n = 5.5) and selenium powder (Se) were purchased from Kojima Chemical Co. Ltd., Japan. Rhodamine B (Rh. B, C28H31CIN2O3) was used as a model pollutant, purchased from Samchun Pure Chemical Co. Ltd., Korea. Ethylene glycol was purchased from Dae-Jung Chemical and Metals Co. Ltd Korea. Texbrite MST-L was purchased from Texchem Korea Co. Ltd. All of the chemicals were used without further purification.2.2. Synthesis of graphene oxide
Graphene oxide was prepared through a modified Hummers Offman method reported in our previous work.31,32 In short, 20 g of natural graphite powder were mixed with conc. H2SO4 (230 ml) at 0 °C with constant magnetic stirring. In the 2nd step, 30 g of KMnO4 was slowly added to the flask and the temperature was kept below 15 °C. The resulting mixture was stirred at 35 °C until it became pale brownish, and it was then diluted to 150 ml using de-ionized (DI) water and kept stirring at below 90 °C. After adding water, the container was sealed and kept at 100 °C with vigorous stirring for 30 minutes, followed by the addition of 20% H2O2, drop by drop, within 5 minutes. The mixture was then washed several times with water, acetone and 10% HCl solution to eliminate residual metal ions. The mixture was then heat-treated in a dry oven at 90 °C for 12 h to obtain graphite oxide powder. For the preparation of graphene oxide, 200 mg of graphite oxide powder were mixed in 200 ml DI water (1 mg ml−1), stirred for 30 minutes and ultrasonicated for 1 h. The resulting solutions were filtered and washed several times with hot water and kept in a dry oven for 8 h to achieve graphene oxide powder.2.3. Synthesis of platinium selenide
Platinium selenide was synthesized through fast microwave-assisted techniques. In a typical synthesis, 1.5 g of anhydrous sodium sulfite (Na2SO3) and 0.3 g of crude selenium (Se) powder were mixed together in 200 ml of ethylene glycol under vigorous magnetic stirring. The solution was stirred vigorously for 1 h at 60 °C to ensure homogeneous mixture and attainment of selenium salt. In the next step 0.5 mmol of hydrogen hexachloroplatinate (H2PtCl6·nH2O n = 5.5) was added to the above solution and stirred for 30 minutes to attain a stable solution. The obtained solution was finally transferred to a 500 ml reaction vessel placed in a conventional microwave oven. The solution was then irradiated with microwaves for 300 s, with periodic on off setting after 5 s. The mixture was then cooled to room temperature, filtered with Whatman filter paper and heat treated for 6 h at 90 °C to obtain a dark brown PtSe2 powder.2.4. Synthesis of the PtSe2–graphene supported TiO2 photocatalyst
PtSe2/graphene nanocomposites were obtained by following the above method. A borosilicate glass sealed reaction vessel specially designed for microwave techniques with a diameter of 8 cm and height 10 cm was used. Graphene oxide (200 mg) and the desired amount of TNB as titanium precursor were dispersed in 300 ml ethylene glycol for 30 minutes to attain a homogeneous mixture to form solution A. In the next step, 1 g of anhydrous sodium sulfite (Na2SO3) and 0.2 g of crude selenium powder (Se) were vigorously stirred in 100 mL of ethylene glycol for 30 min to attain a homogeneous solution. Following this the addition of the desired amount of hydrogen hexachloroplatinate (H2PtCl6·nH2O n = 5.5) with vigorous stirring for 1 h at 35 °C to ensure homogeneous mixing formed a stable suspension B. A and B were mixed together and stirred for several minutes then transferred into a 500 mL reaction vessel placed in a conventional microwave oven. The solution was then irradiated with microwaves for 5 s on and off for 300 s, and cooled to room temperature then filtered with Whatman filter paper. The resultant powder was washed 3 times with distilled water and transferred into a dry oven for 6 h at 90 °C. The powder was then heat treated at 500 °C for 1 h in an electric furnace. The weight ratios of GO to the other components PtSe2 and TiO2 were taken as 1%, 2.5%, 3.5% and 4.5%, and the obtained samples were labeled as PtSe2-GT1, PtSe2-GT2, PtSe2-GT3, PtSe2-GT4, respectively.2.5. Photocatalytic studies
The photocatalytic activity of the as-prepared PtSe2–graphene supported TiO2 nanocomposites was evaluated by the degradation of Rh. B and Texbrite MST-L as organic dyes under UV/Vis light. A xenon lamp (12 W) served as the simulated visible light source. In each run 10 mg of the PtSe2–graphene/TiO2 catalytic sample was added to an 80 ml solution of Rh. B (0.1 mg ml−1). To obtain adsorption–desorption equilibrium the solution was kept in the dark for 2 h. Before the xenon lamp was switched on a sample was collected from the solution and kept in a centrifuge at 10000 rpm for the removal of solid material. Afterwards, the xenon lamp was switched on and samples were collected periodically. At given time intervals, the collected samples were immediately centrifuged for 10 minutes to remove the solid material for further analysis. Each photocatalyst composite was irradiated for 150 minutes to compare their catalytic efficiencies.
A similar procedure is used to measure the photocatalytic activity of the PtSe2–graphene/TiO2 nanocomposite, using UV light for the degradation of Texbrite MST-L. The photocatalytic behavior of the samples was analyzed by absorbance spectrometry with a UV/Vis spectrophotometer (Optizen POP, Mecasys, Korea).
2.6. Instrumentation
The fabrication of the samples was carried out in a Microwave oven (RE-406B 700 W Samsung Korea Ltd.). A LED lamp (8 W, Fawoo, Lumidas-H, Korea) was used at a distance of 90 mm from the solution in the dark box for the investigation of catalytic properties. UV light source model no: VL-4. LC 365 nm, (8 W, Villber Lourmat, France) was used. To determine the crystal phase and the composition of the as-prepared PtSe2–graphene supported TiO2 samples, XRD characterization was carried out at room temperature using XRD (Shimata XD-D1, Japan) with Cu Kα radiation (λ = 1.54056 Å) in the range of 2θ = 10–80° at a scan speed of 1.2° min−1. SEM (JSM-5200 JEOL, Japan) was used to observe the surface state and morphology of the prepared nanoparticles. The morphology of the samples was studied by Energy dispersive X-ray spectroscopy (EDX), which was also employed for elemental analysis. Transmission electron microscopy (TEM, JEOL, JEM-2010, Japan) was used to observe the surface state and structure of the photocatalyst composites at an acceleration voltage of 200 kV. TEM was also used to examine the size and distribution of the PtSe2 and TiO2 nanoparticles on the graphene sheets. X-ray photoelectron spectroscopy (XPS) was performed using VG scientific VISACA lab 2000, and a monochromatic Mg X-ray radiation source. Survey (wide scan) spectra and high-resolution spectra of C 1s, and the elements contained within the samples, were recorded. C/O ratios were evaluated from the wide scan spectra using relative sensitivity factors. Diffuse reflectance spectra were obtained using a scanning UV/Vis spectrophotometer (Neosys-2000) equipped with an integrating sphere assembly. Raman spectra of the samples were observed using a spectrometer (Jasco Model Name NRS-3100) with an excitation laser wavelength of 532.06 nm. The decomposition kinetics for the photocatalytic activity were measured by using a spectrometer (Optizen POP, Mecasys, Korea).3. Results and discussions
3.1. Growth and characterization
The microwave-assisted fabrication of the nanocomposites is depicted in Scheme 1. Microwave synthesis is a solvent-limited technique and usually needs a polar solvent. Therefore ethylene glycol was selected as a solvent to absorb microwave energy and limit localized overheating which causes decomposition. Microwave techniques are advantageous over other synthesis techniques because lesser solvent amounts and clear reaction profiles result in reduced waste. A short reaction time is needed which helps to save electricity and additional cooled water for reflux. Another advantage of using a closed reaction vessel for a short time is in preventing the release of toxic gases to the environment.33,34 Microwaves act as high frequency electric fields and will generally heat any material possessing movable electric charges, such as in solid state conducting ions and polar molecules in a solvent. Polar solvents are heated as their component molecules are forced to rotate with the field and lose energy in collisions. Conductor and semiconductor materials produce heat when the ions or electrons within them form an electric current and energy is lost due to the electrical resistance of the material. The high frequency waves generate localized hot spots with extremely high temperature and pressure, accelerating the nanoparticles and simultaneous attachment occurs.35,36 Structural features and identification of crystalline phases of the PtSe2–graphene/TiO2 nanocomposites with varying amount of graphene were analyzed by XRD as shown in Fig. 1. The bare PtSe2 and PtSe2 in the composites had similar diffraction patterns that correspond to a hexagonal crystal phase (JCPDS PDF#: 00-065-3374) and exhibit characteristic diffraction peaks at (001), (011), (012), (110), (111), (201), (202), (113), (121) and (122) reflections. The intensity of the PtSe2 peaks is very high as compared to PtSe2–graphene/TiO2 nanocomposites. The suppression of the peaks confirms the minute development of crystalline phases on the graphene sheets. The intensity variation of the diffraction peaks for the nanocomposites also verifies the increased amount of graphene and suppression of the crystalline phases. The interaction of the nanoparticles with the graphene sheet creates a phonon confinement effect which decreases the probability of the formation of spherical particles. Decrease in peak intensity suggests that the lattice structure of PtSe2 is distorted by the interaction with GO.37,38 The PtSe2 are found to be sheet-like from the TEM results which also demonstrate this suppression of the peaks. The TiO2 diffraction peak (101) and graphene (002) peak are located at the same 2θ values. Therefore it is difficult to distinguish both peaks as a result of intense diffraction from the TiO2 (002) plane. The nanocomposite contains characteristic reflections (101), (004), (200), (105), (211), and (220) that correspond to the anatase crystal phase (JCPDS PDF#: 00-021-1272).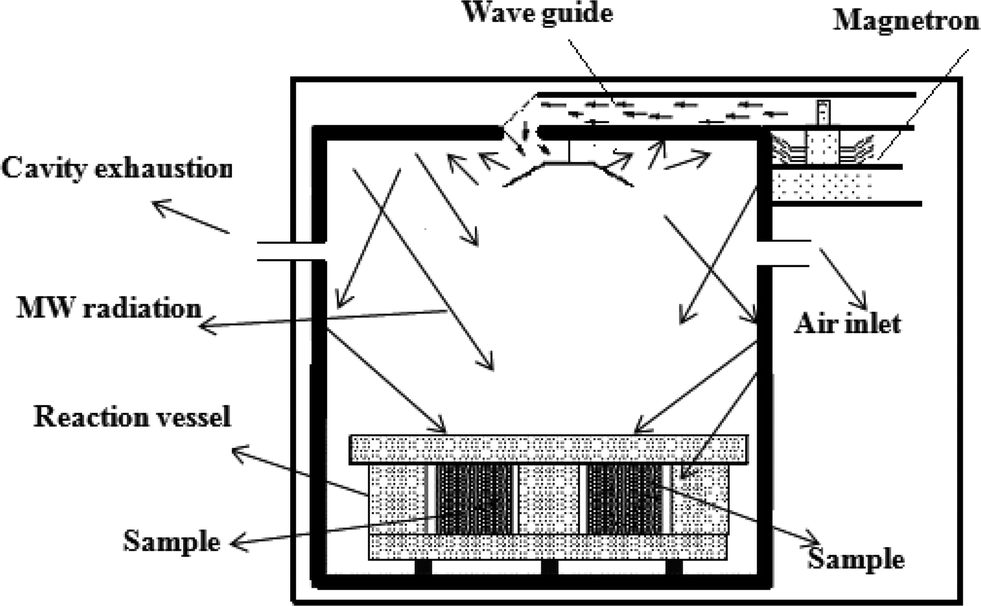 | ||
| Scheme 1 Microwave reaction chamber for the synthesis of the PtSe2–graphene/TiO2 nanocomposites. | ||
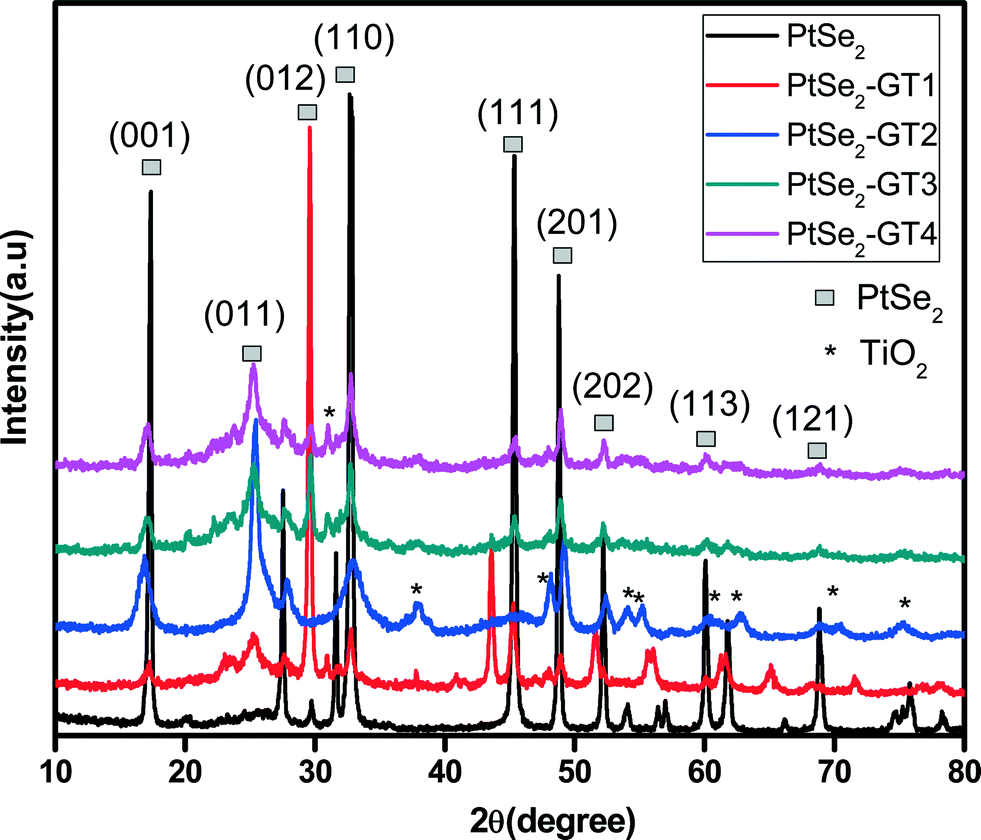 | ||
| Fig. 1 XRD pattern of bare PtSe2 and the PtSe2–graphene/TiO2 composites. | ||
EDX spectra were acquired to obtain the micro-elemental analysis of the microwave-assisted PtSe2–graphene/TiO2 nanocomposites as shown in Fig. 2. In the whole spectra, the C elemental peak was derived from the graphene sheets. The strong Kα and Kβ peaks from Se appear at 11.2 and 12.4 keV while a moderate Kα peak from O appears at 0.54 keV.30 The titanium and oxygen in the figure arise from the TiO2 precursor material. The strong Kα and Kβ peaks from Ti appear at 4.5 and 4.9 keV. Fig. 2 also confirms the presence of Pt in the composite from the strong peaks at 2.3 keV.39Table 1 lists the numerical results of the EDX quantitative microanalysis of the samples. There were some small impurities, which were attributed to the starting experiment for the oxidation of graphite to obtain graphene oxide.
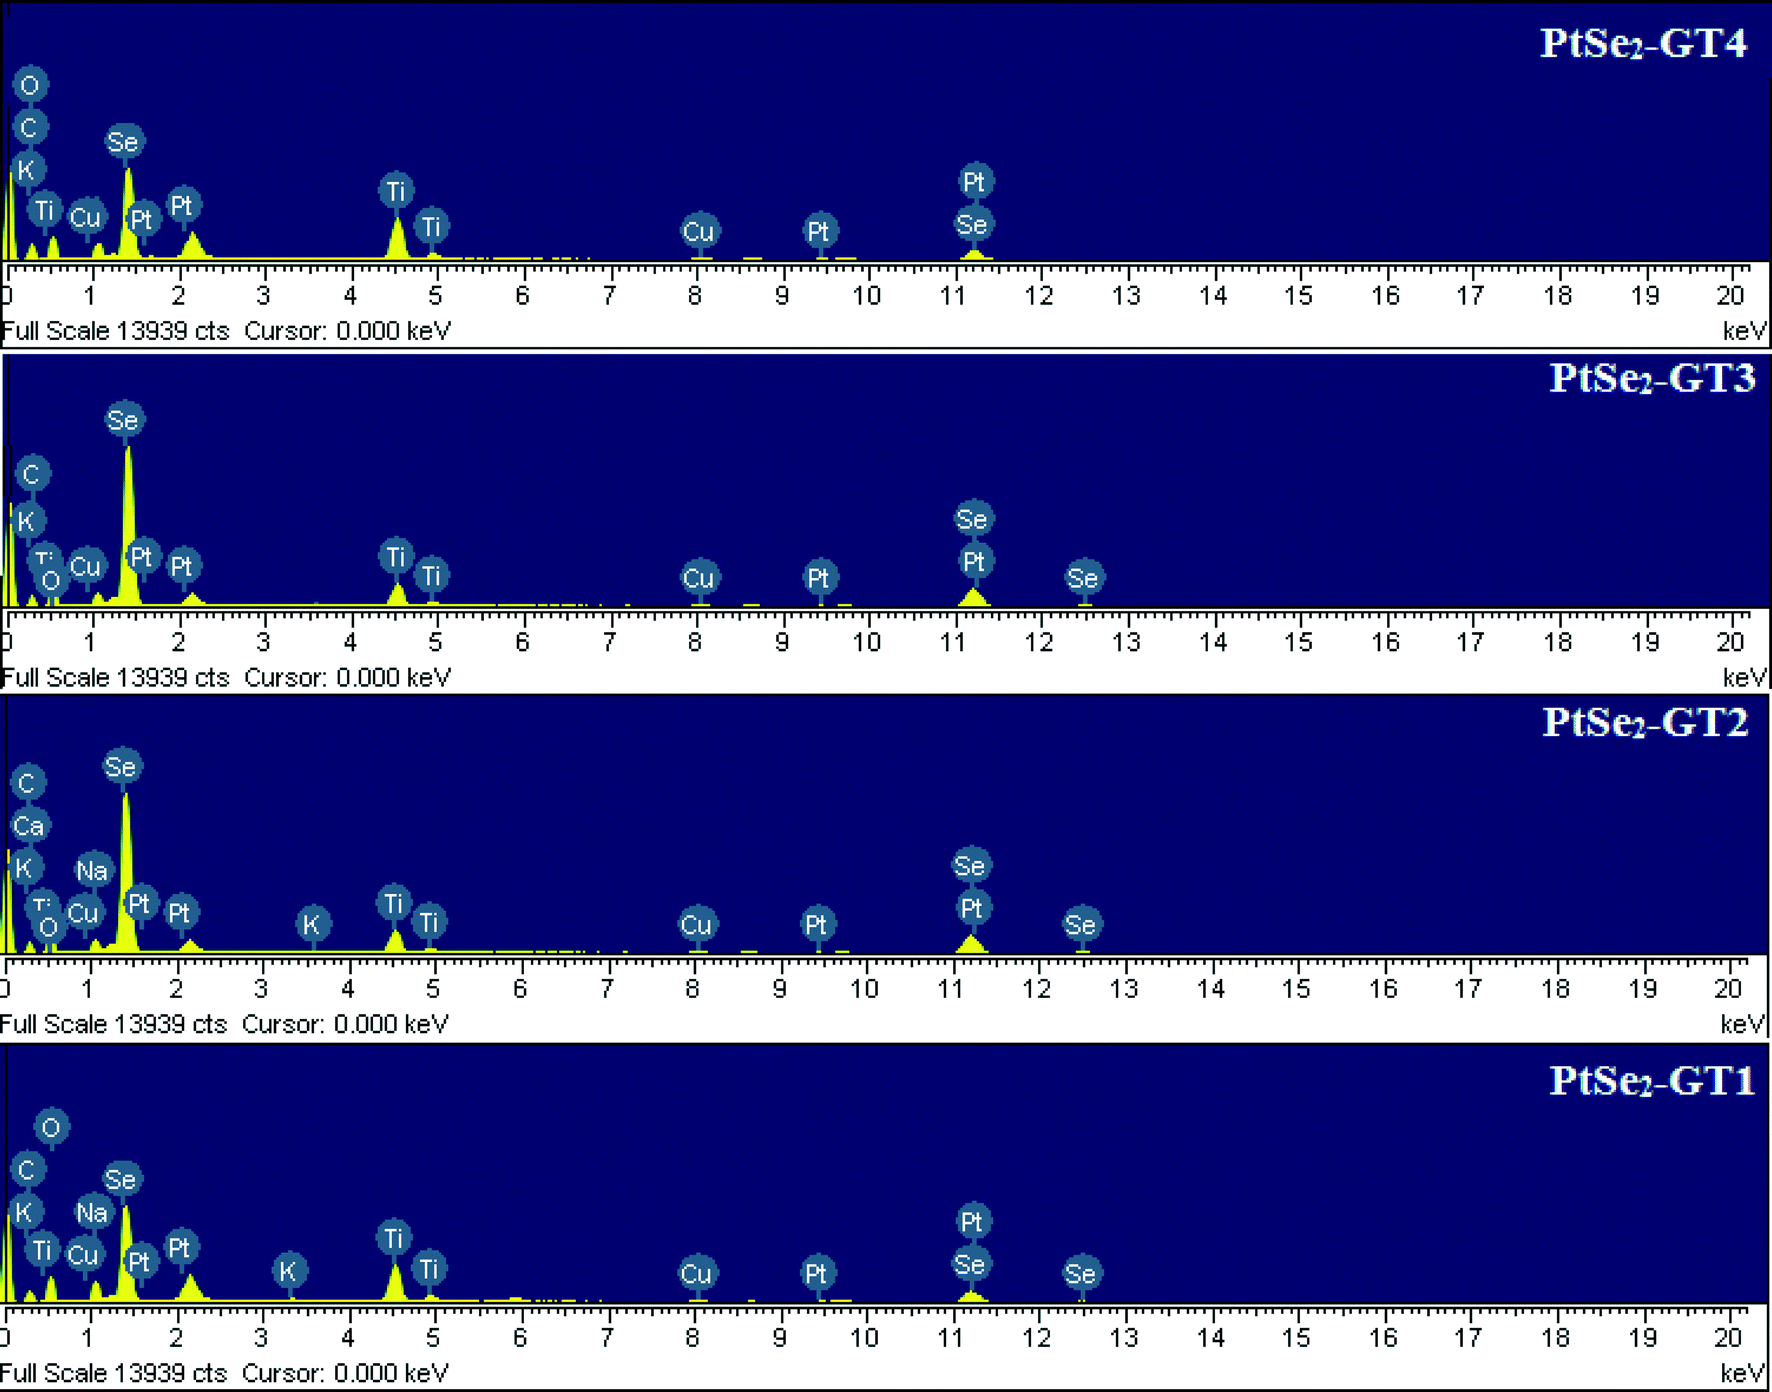 | ||
| Fig. 2 EDX spectra of the PtSe2–graphene/TiO2 nanocomposites. | ||
| Samples | C% | O% | Ti% | Se% | Pt% | Other% | K app (min−1) vis light | Band gap (eV) |
|---|---|---|---|---|---|---|---|---|
| PtSe2-GT1 | 70.2 | 9.78 | 10.6 | 3.6 | 4.9 | 0.92 | 1.70 × 10⁻³ | 2.20 |
| PtSe2-GT2 | 69.54 | 9.97 | 11 | 4.98 | 3.34 | 1.17 | 1.8 × 10⁻³ | 2.10 |
| PtSe2-GT3 | 64.13 | 13.86 | 10.5 | 5.51 | 5.34 | 0.66 | 6.1 × 10⁻³ | 1.91 |
| PtSe2-GT4 | 57.92 | 12.37 | 13.50 | 10.13 | 4.5 | 1.58 | 2.6 × 10⁻⁴ | 1.98 |
The surface morphology of the sample PtSe2-GT3 nanocomposite was examined using SEM as a function of graphene oxide content as depicted in Fig. 3. The sample was analyzed at different regions with same magnification to examine the overall morphology of the composite.
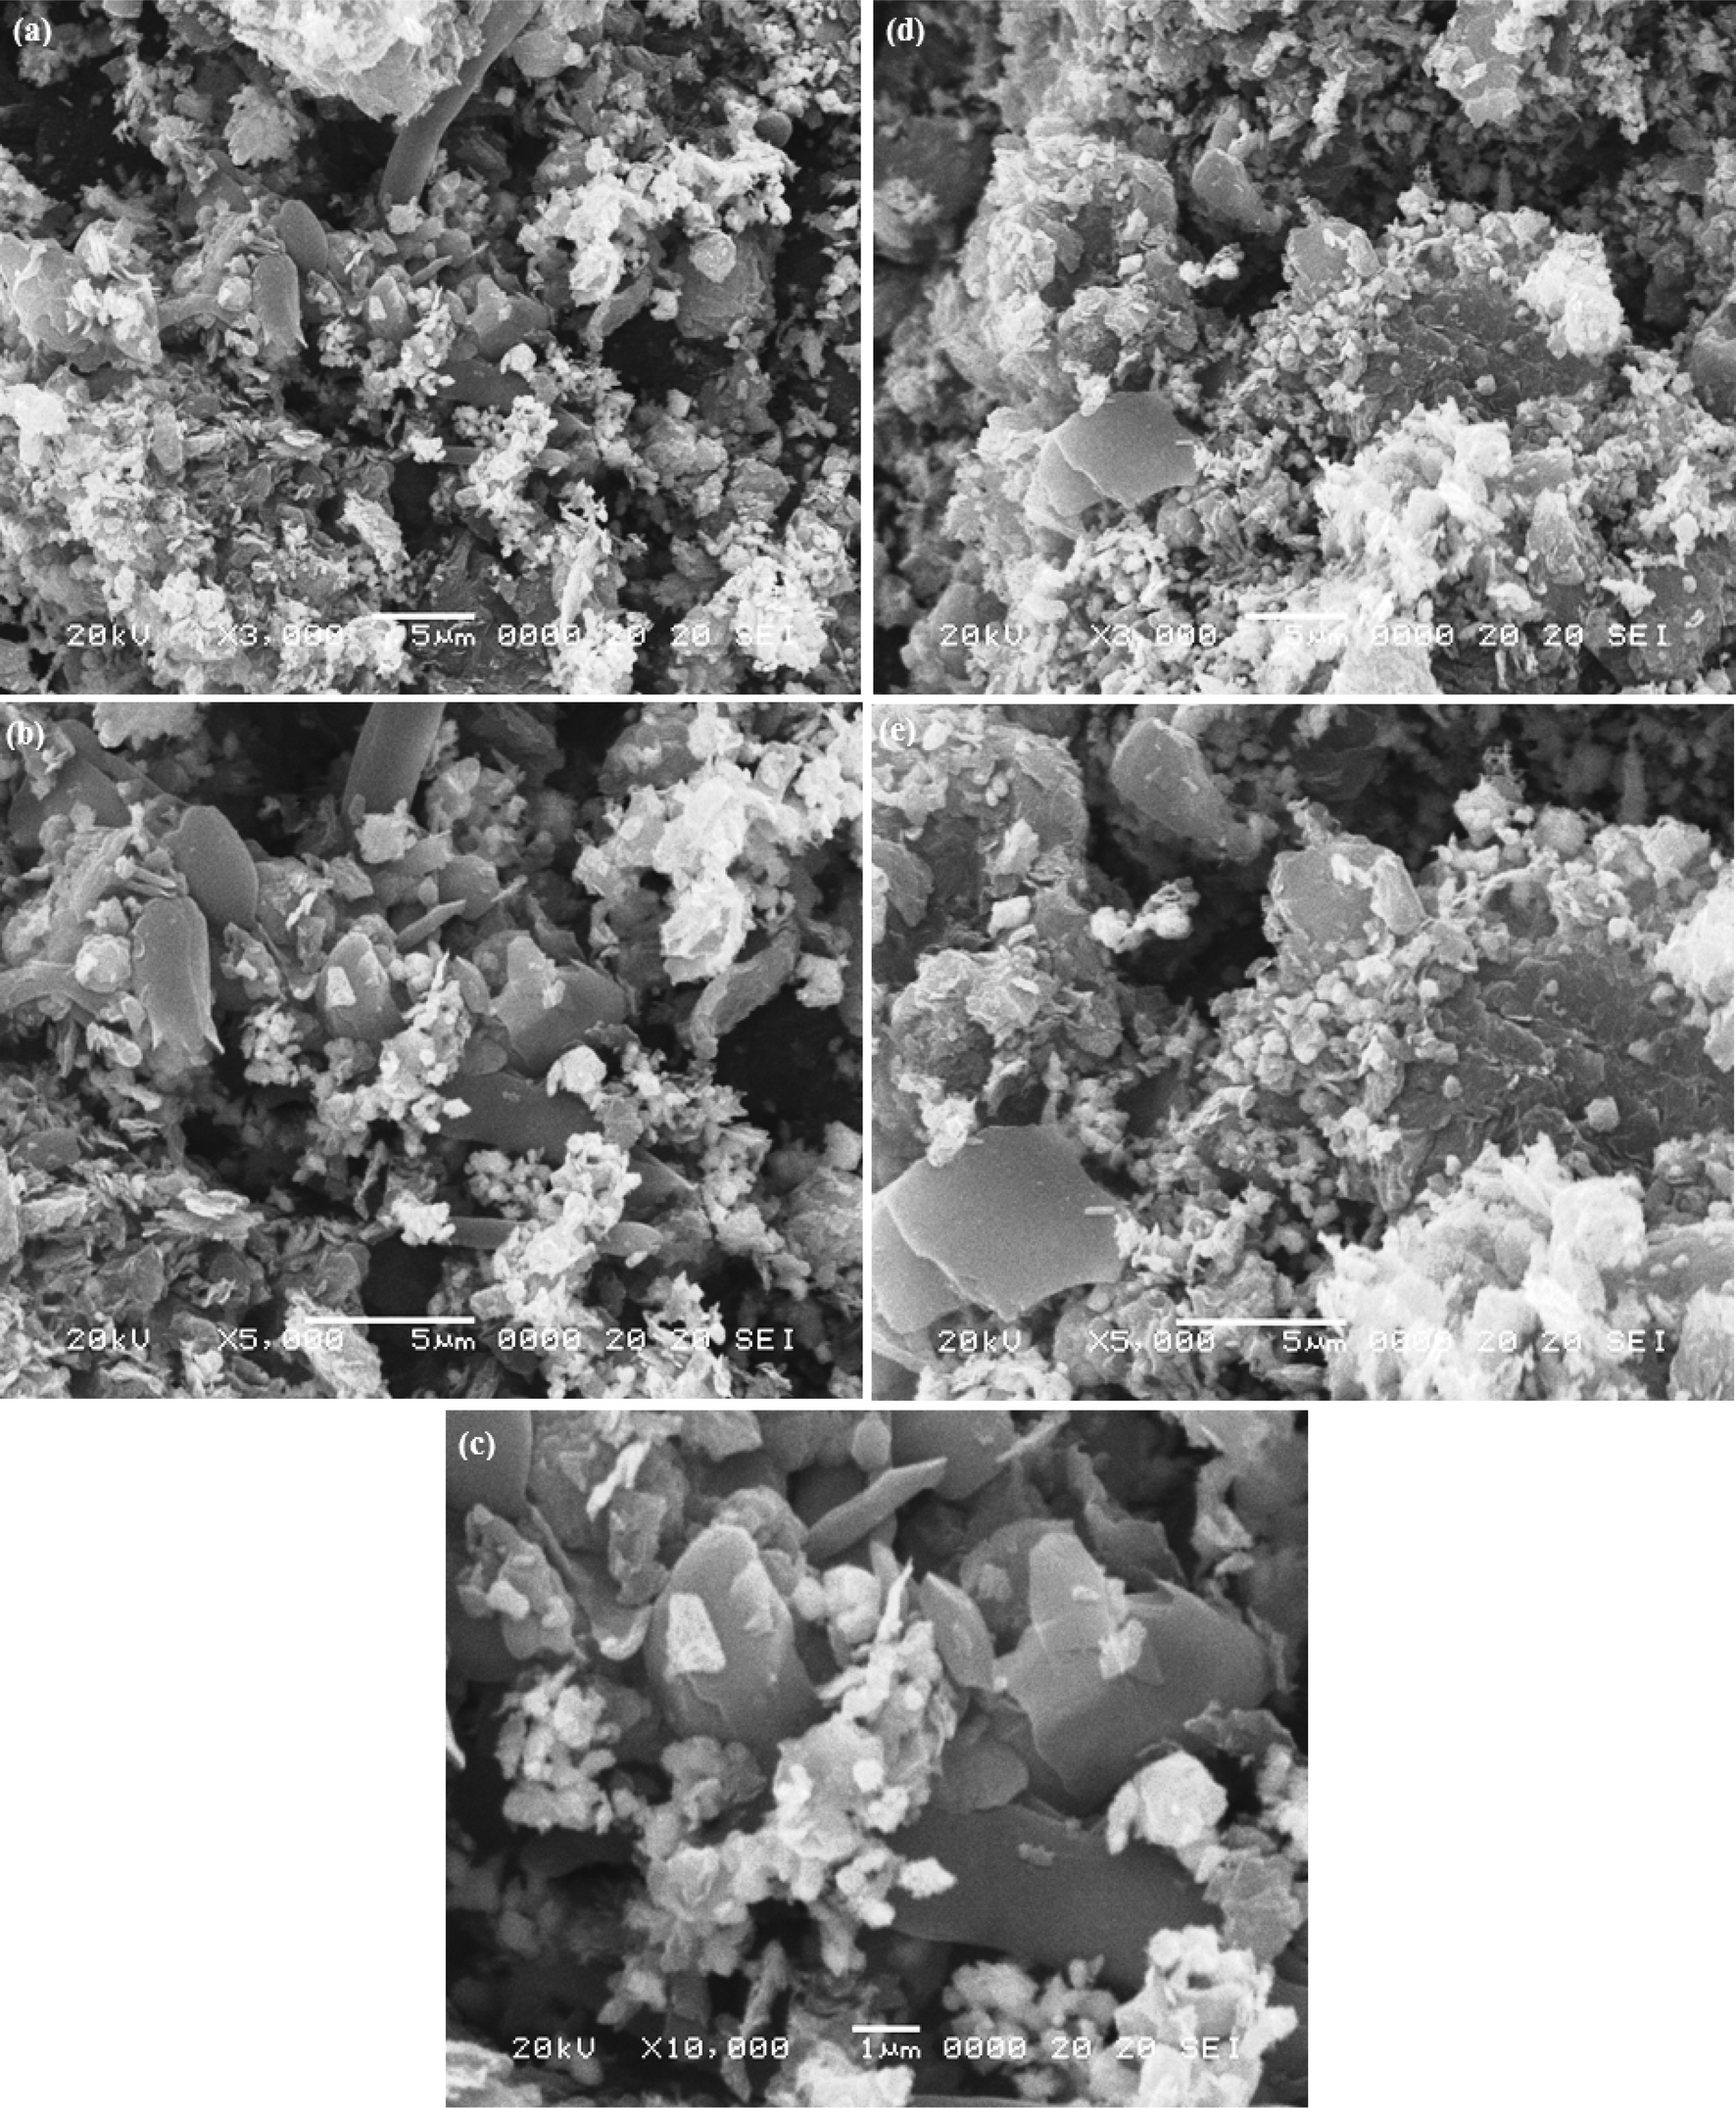 | ||
| Fig. 3 SEM micrographs of PtSe2-GT3 with different magnifications. | ||
Fig. 3(a) shows the SEM image of the PtSe2-GT3 sheet with a lower magnification. From this figure the overall structure can be clearly described as a graphene plate-like structure broken off in different directions. The morphology of the graphene is observed as a crumbling texture which reflects its layered structure. After microwave treatment, the sheet morphology is retained and the surfaces are covered with the PtSe2 layer and TiO2 nanoparticles as shown in Fig. 3(b–c). The same plate-like morphology can be seen in Fig. 3(d–e). Because of the presence of oxygen functionalities on the surface of the graphene sheets, electrostatic force arises among them in the form of a van der Waals interaction that tends to aggregate the graphene sheets back to a graphitic structure. Attachment of nanoparticles on the graphene sheets is helpful to overcome these interactions.40 The graphene sheet acts like a support material which may be advantageous to supply a path for the generated electrons and as a result will improve the photocatalytic behavior of the nanocomposites.
The microstructure of the nanocomposites was studied using TEM for further confirmation of the morphology and shape of the PtSe2-GT3 sample. The TEM image has been depicted in Fig. 4(a–e) with different magnifications. In Fig. 4(a–b), it can be seen that the nanoparticles of TiO2 are partially agglomerated on the surface of the PtSe2 and graphene sheets. The PtSe2 seems to form a bridge-like support between TiO2 and graphene sheet. These results are in good agreement with the theoretical reports.41,42 It is clear from Fig. 4(c–d) that the two-dimensional structure of the graphene sheet is retained with partial agglomeration and the TiO2 nanoparticles are seen to be spherical in shape residing on the PtSe2 nanosheets and graphene. Fig. 4(e) with 20 nm resolution shows TEM image of the resulting PtSe2-GT3 composite in which the layered PtSe2 acts as a novel support that is mostly decorated with TiO2 nanoparticles. Thus it can be inferred that the close neighboring of TiO2, PtSe2 and graphene components achieved through microwave-assisted techniques is supposed to favor the successful transfer of photoexcited electrons from PtSe2 to TiO2 or the graphene sheets, thus increasing the charge separation effect and catalytic efficiency.43
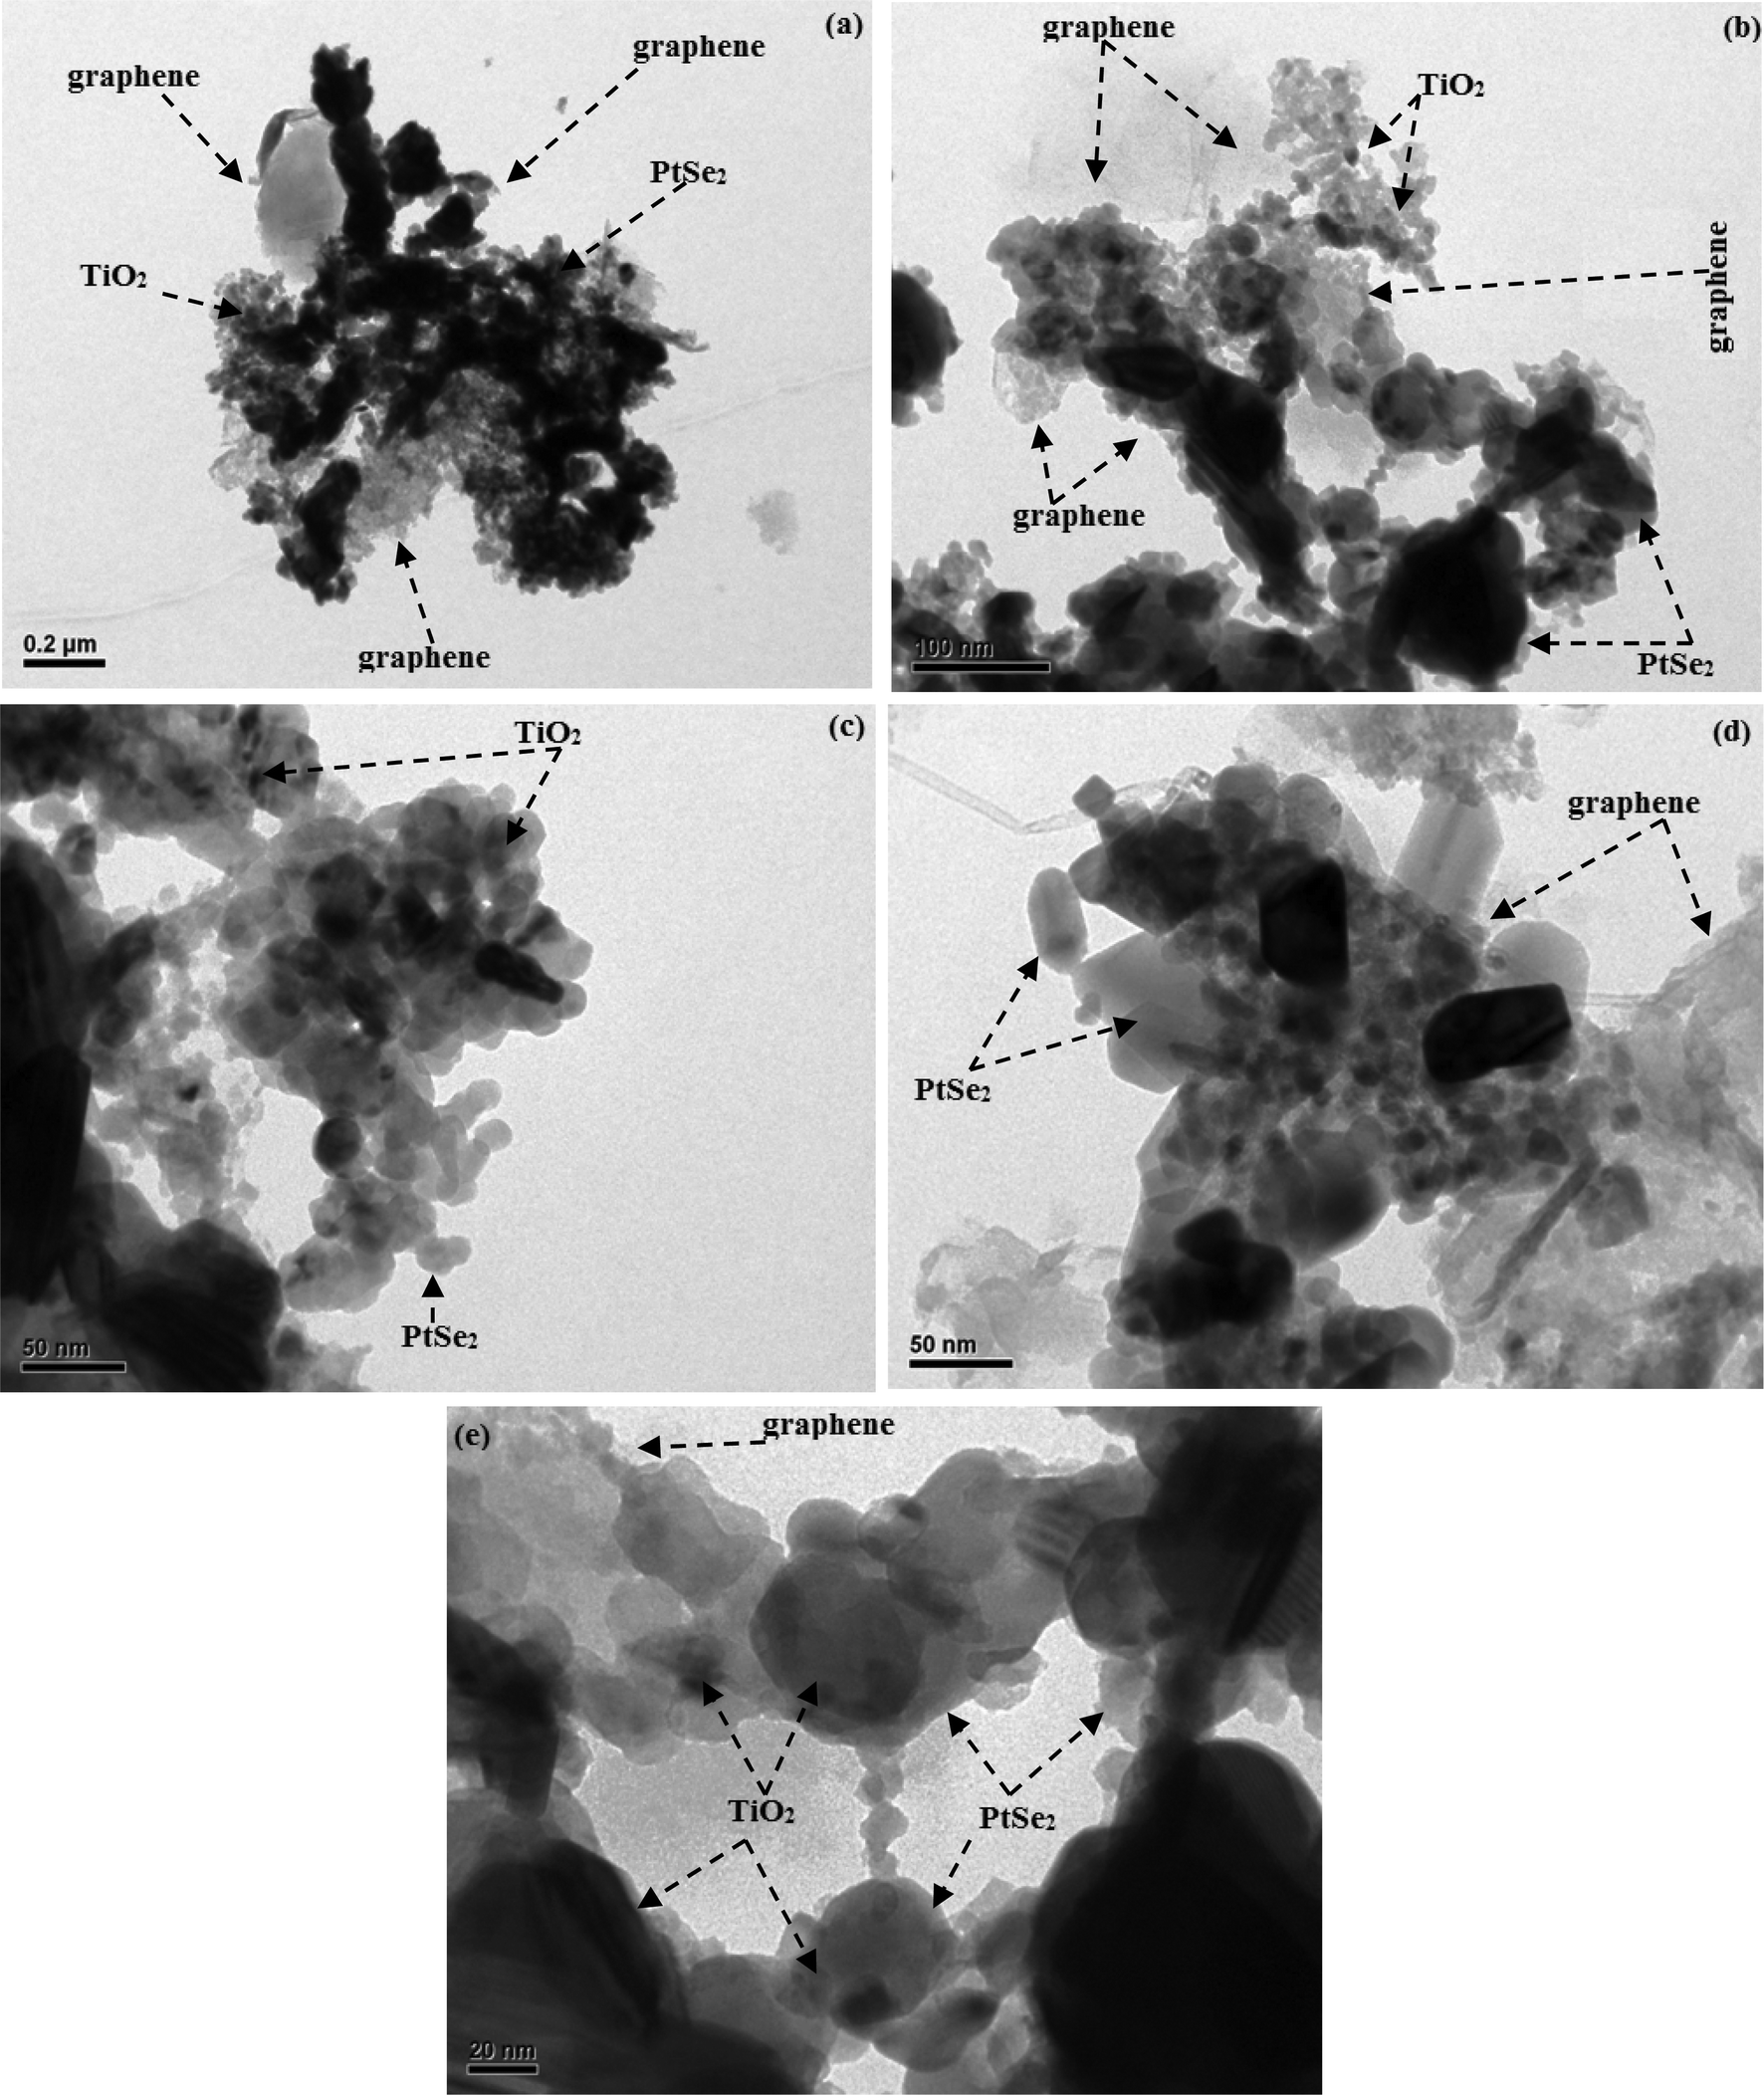 | ||
| Fig. 4 TEM images of PtSe2-GT3 (a) 0.2 μm, (b) 100 nm, (c) 50 nm and (d–e) 50 nm. | ||
XPS was carried out for the qualitative analysis of the PtSe2-GT3 nanocomposite containing PtSe2, TiO2 and graphene. The XPS survey spectrum had peaks corresponding to Pt, Se, O, C and Ti consistent with the formation of PtSe2–graphene/TiO2 nanocomposites as shown in Fig. 5(f). Fig. 5(a) shows the C 1s spectra of the carbon present in the composites. The C 1s has a strong peak located at around 284.1 eV and a slight peak at 289.1 eV. These binding energies correspond to the C–O and C![[double bond, length as m-dash]](https://www.rsc.org/images/entities/char_e001.gif) O functional groups. These results reveal that our nanocomposites still contain some partial oxygen functional groups. The peak position in Fig. 5(b) of Ti 2p corresponds to that of the Ti4+ oxidation state. During the thermal heating process, the Ti 2p peak becomes narrow and the peak position of Ti 2p3/2 moves, indicating that there is also some Ti existing in a low valence (Ti3+) form.44 The presence of oxygen functional groups may increase the light absorption towards the visible region.45 As it is clear that the O 1s photoelectron kinetic energies are smaller than those of the C 1s, the sampling depth is smaller, and therefore the O 1s spectra are slightly more surface-specific. We have assigned in Fig. 5(c) the O 1s peak at 532.1 eV to contributions from CO and O–C–OH groups. This means after heat treatment the conversion to other chemical species may be possible.46,47 The remaining peak at 534.7 eV indicates that the C–OH group is still appearing. It is assumed that the reduction of remaining C–OH groups in reduced graphene oxide is very difficult or it may not be possible at our heat treatment conditions.48 The selenium 3d core level peak was confirmed at 54.1 eV from the high resolution scan spectra as shown in Fig. 5(d). The authors assume that the XPS Pt 4f spectra invariably involve 2 different platinum chemical species as shown in Fig. 5(e) which produce a single peak each; any given platinum chemical species in fact produces 2 spin–orbit split (Pt 4f7/2 and Pt 4f5/2) Pt 4f peaks corresponding to (74.1 and 77.3) eV.49,50 Indeed, in Fig. 5(e) both the spin–orbit multiplicity and chemical state multiplicities of the Pt 4f peaks are observed; one invariably expects a branching ratio and energy separation for both the peaks Pt 4f7/2 and Pt 4f5/2 of 3.2 eV.51
O functional groups. These results reveal that our nanocomposites still contain some partial oxygen functional groups. The peak position in Fig. 5(b) of Ti 2p corresponds to that of the Ti4+ oxidation state. During the thermal heating process, the Ti 2p peak becomes narrow and the peak position of Ti 2p3/2 moves, indicating that there is also some Ti existing in a low valence (Ti3+) form.44 The presence of oxygen functional groups may increase the light absorption towards the visible region.45 As it is clear that the O 1s photoelectron kinetic energies are smaller than those of the C 1s, the sampling depth is smaller, and therefore the O 1s spectra are slightly more surface-specific. We have assigned in Fig. 5(c) the O 1s peak at 532.1 eV to contributions from CO and O–C–OH groups. This means after heat treatment the conversion to other chemical species may be possible.46,47 The remaining peak at 534.7 eV indicates that the C–OH group is still appearing. It is assumed that the reduction of remaining C–OH groups in reduced graphene oxide is very difficult or it may not be possible at our heat treatment conditions.48 The selenium 3d core level peak was confirmed at 54.1 eV from the high resolution scan spectra as shown in Fig. 5(d). The authors assume that the XPS Pt 4f spectra invariably involve 2 different platinum chemical species as shown in Fig. 5(e) which produce a single peak each; any given platinum chemical species in fact produces 2 spin–orbit split (Pt 4f7/2 and Pt 4f5/2) Pt 4f peaks corresponding to (74.1 and 77.3) eV.49,50 Indeed, in Fig. 5(e) both the spin–orbit multiplicity and chemical state multiplicities of the Pt 4f peaks are observed; one invariably expects a branching ratio and energy separation for both the peaks Pt 4f7/2 and Pt 4f5/2 of 3.2 eV.51
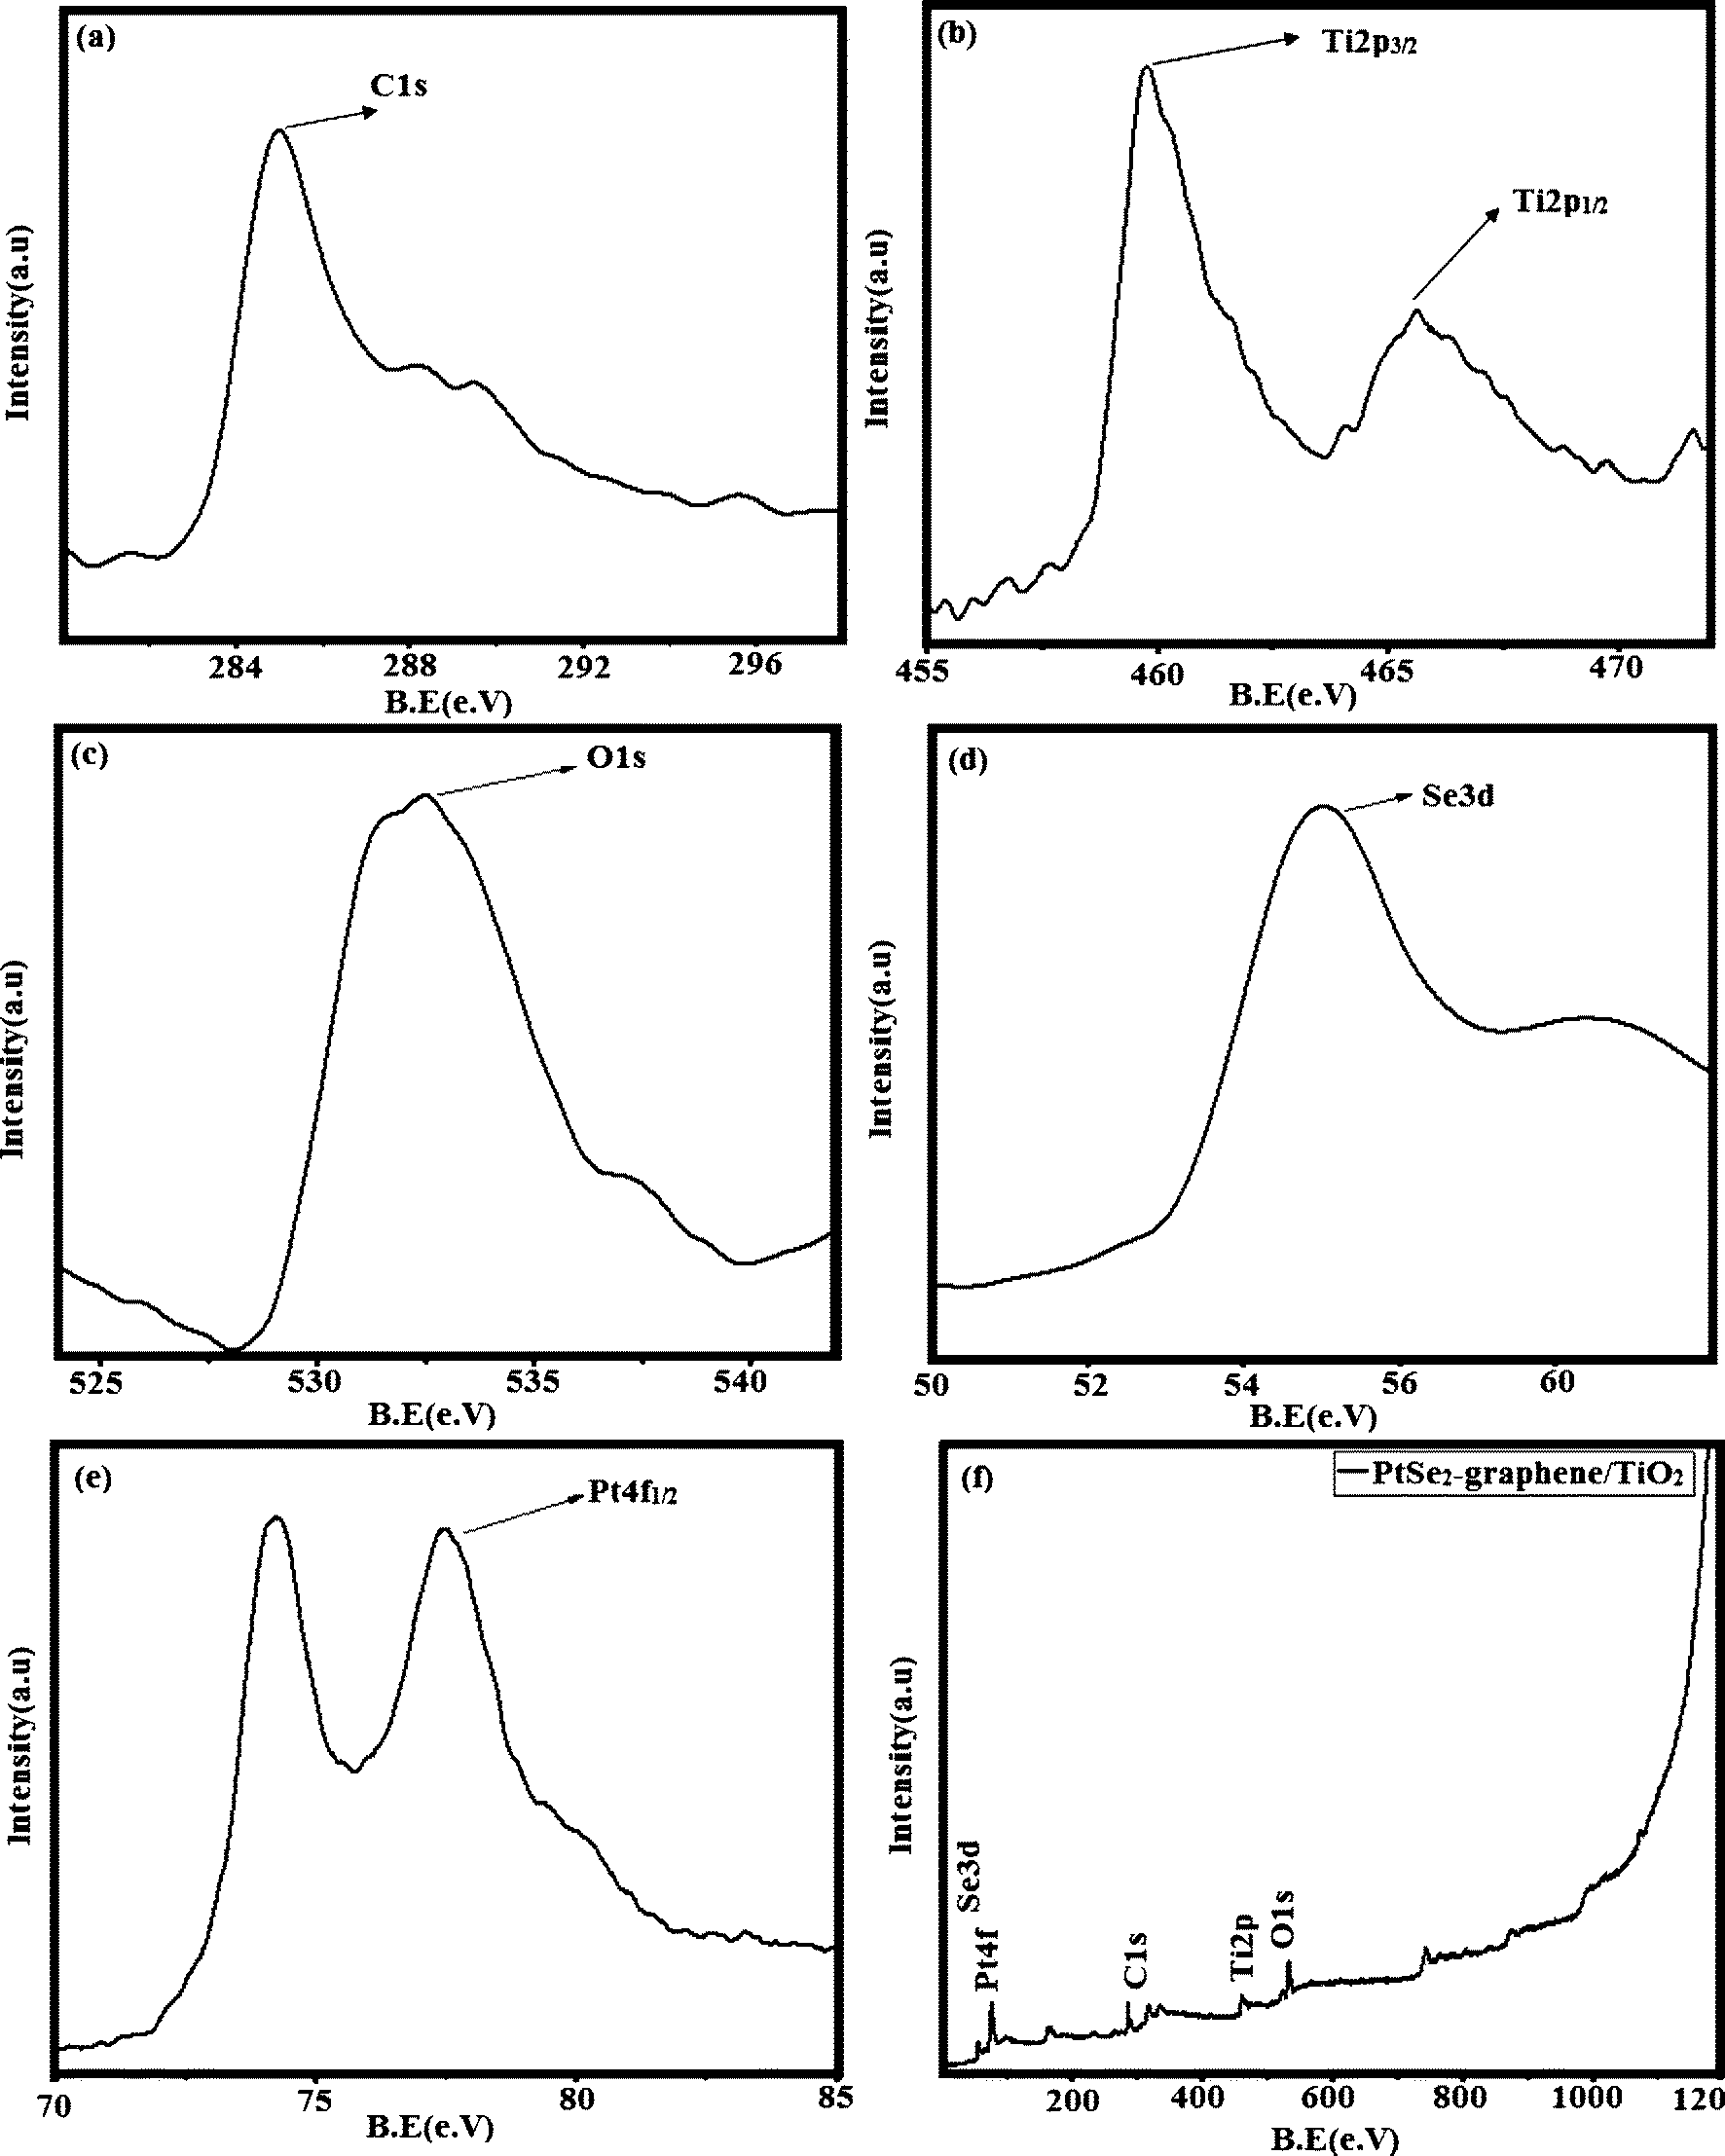 | ||
| Fig. 5 XPS results for the PtSe2-GT3 nanocomposite (a) C 1s, (b) Ti 2p, (c) O 1s, (d) Se 3d, (e) Pt 4f and (f) survey scan spectra. | ||
Raman spectroscopy was used to analyze the structural properties of the PtSe2–graphene/TiO2 nanocomposites. Fig. 6(A–B) depict the micro Raman spectra of GO and our nanocomposites with G band and D band corresponding to the vibration of carbon atoms in disorder or defect sites and in plane vibration of sp2-bonded carbon atoms respectively.52 The intensities of peaks depend on defect concentration. The difference in the Raman band intensity or shift provides information about the nature of the defects and C–C bonds.53 The characteristic D and G bands appear at 1354 cm−1 and 1590 cm−1 respectively. The peaks observed below 600 cm−1 may be assigned to a metallic component in the composite crystal. The peaks around 200 cm−1 to 300 cm−1 wave numbers are attributed to some Se0 trigonal phase. And the peaks around 410 cm−1 and 510 cm−1 seem to be associated with the anatase TiO2.54,55 The nature of the defects can be determined from the intensity ratio of the corresponding D to G band. The calculated ratio of the intensities from the D to G band were found to be ~0.960. This value is much smaller than that of graphene oxide in Fig. 6(A). The decrease in the ID/IG ratio is clear evidence of the increased number of graphene layers. Moreover, the lower ID/IG ratio implies an improved defect repair mechanism.56
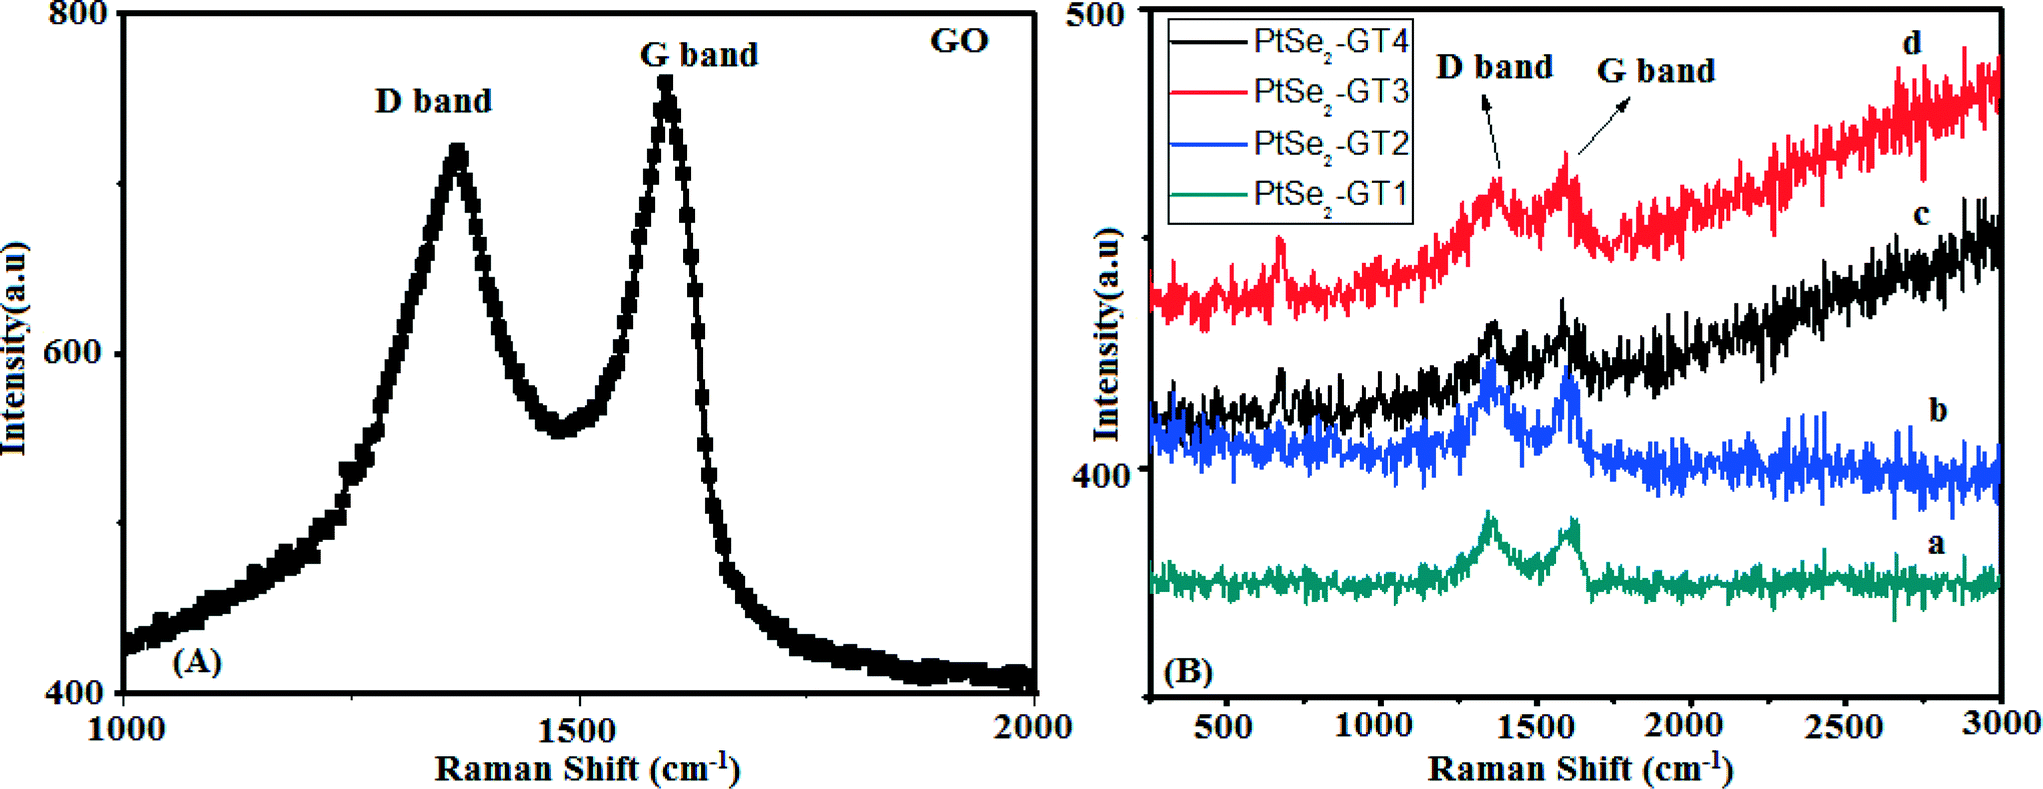 | ||
| Fig. 6 Raman spectra: (A) GO; (B) (a) PtSe2-GT1, (b) PtSe2-GT2, (c) PtSe2-GT4 and (d) PtSe2-GT3. | ||
The search for the design of new photocatalytic materials which utilize the broadest part of the solar energy spectrum is very important. For the decontamination or elimination of environmental pollutants, an ideal photocatalyst exhibiting maximum efficiency in both the UV and visible range of the electromagnetic spectrum is needed. In this context we carried out the absorption spectroscopy of our nanocomposites in order to understand the response of our nanocomposites to the electromagnetic spectrum. The DRS spectra depicted in Fig. 7 clearly reveal that our nanocomposites mainly absorb in the visible part of the electromagnetic spectrum. Overall the spectra look like ordinary carbon-based semiconductor materials.57 From the spectra it is clearly observed that bare TiO2 has absorbance in the UV region because of the intrinsic band gap energy absorption (3.2 eV). After the attachment of PtSe2 and graphene the absorption edge shifts towards the visible region. Due to the carbon-based structure of graphene, the unpaired π electrons may cause the interaction with metal nanoparticles. Such interaction may cause the shift in the band edges and may increase the light absorption towards the visible region.58 Lee et al. also observed such an effect with titania nanoparticles and observed the optical response towards the visible region of the electromagnetic spectrum.25 It can be clearly seen that the modification of graphene with platinium selenide results in red shifts in the absorption edges, and moreover, the absorption intensities are significantly increased in the whole visible region, confirming effectively improved light-harvesting activity.
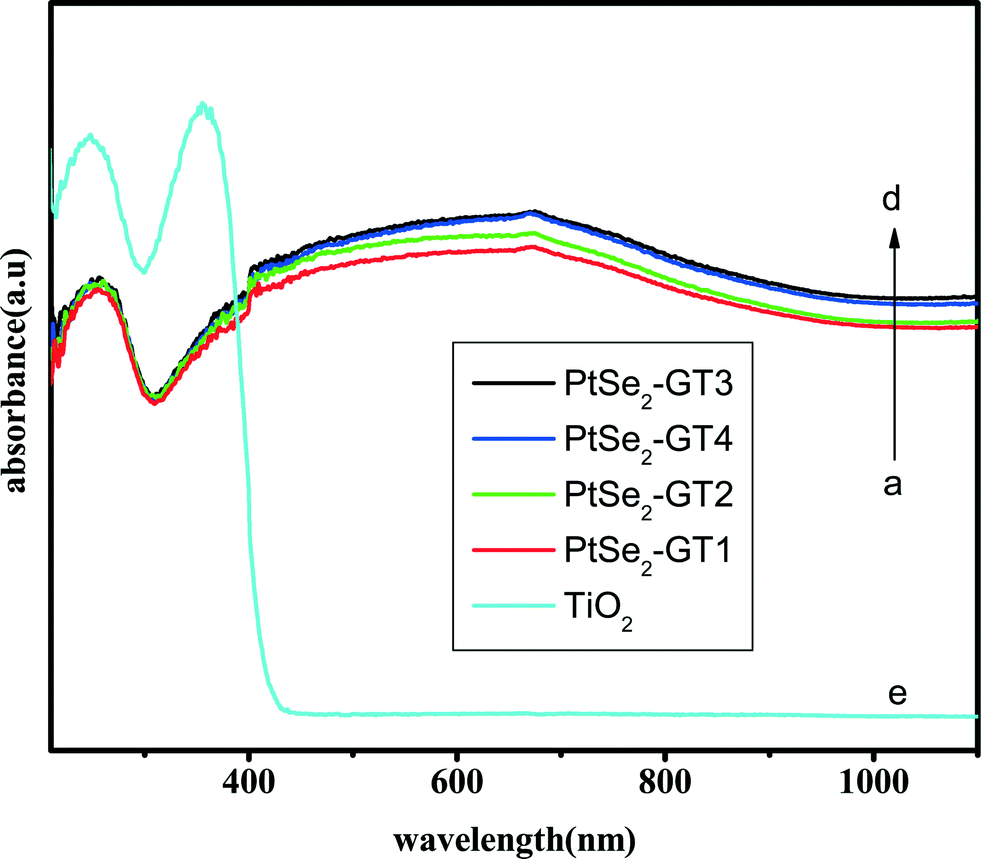 | ||
| Fig. 7 Diffuse reflectance spectra (DRS) of (a) PtSe2-GT1, (b) PtSe2-GT2, (c) PtSe2-GT4, (d) PtSe2-GT3 and (e) TiO2. | ||
The evaluation of the band gap was carried out using a Kubelka–Munk transformation by converting the reflectance plot according to the Tauc condition. The following equation was proposed by Tauc, Davis, and Mott.59
| (hνα)1/n = A(hν − Eg) | (1) |
Where h is the Planck constant, ν is the frequency of vibration, α is the absorption coefficient, Eg is the band gap and A is a proportional constant. The value of the n in the exponent of eqn (1) represents the nature of the sample transition; i.e., for the direct allowed transition n = 1/2. In the next step the acquired diffuse reflectance spectrum is converted using a Kubelka–Munk transformation. In this calculation the vertical axis is converted to a quantity called F(R∞), which is proportional to the absorption coefficient. Thus, the α in the Tauc plot equation is substituted with the function F(R∞). The actual relational expression becomes
| (hνF(R∞))2 = A(hν − Eg) | (2) |
Using the Kubelka–Munk function, (hνF(R∞))2 was plotted against hν. The curve with (hνF(R∞))2 on the horizontal and hν on the vertical axis defines the precise band gap of our nanocomposites. The unit of hν is eV and its relation to the wavelength is the well-known equation hν = 1240/λ. A line drawn tangential to a point of inflection on the curve and the hν value at that point defines the estimated band gap of the nanocomposites.6,9,20 The obtained plots are given in Fig. 8. The band gap energies were found to be in order of PtSe2-GT1 > PtSe2-GT2 > PtSe2-GT4 > PtSe2-GT3 for the PtSe2–graphene/TiO2 nanocomposites. The corresponding values for approximated band gaps are given in Table 1 in detail. The difference in the band gaps of our nanocomposites is attributed to the distribution of PtSe2 and TiO2 nanoparticles on the graphene sheets. Similarly the partial agglomeration can also affect the absorption property and hence may result in band gap variation. Another reason for the variation of the band gap may be the different amounts of graphene in the composites, which considerably affects the optical property of PtSe2–graphene/TiO2 nanocomposites. Therefore, reduction in the band gap is observed for the composites also reported elsewhere.60,61
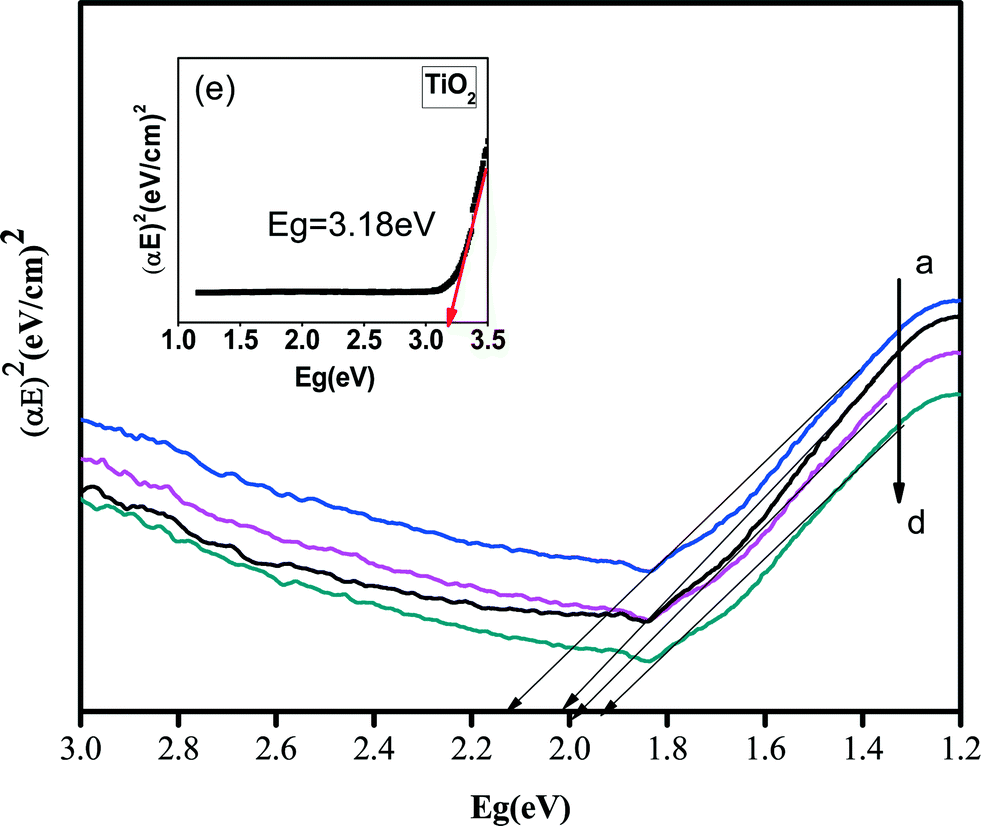 | ||
| Fig. 8 Kubelka–Munk transformation function versus photon energy: (a) PtSe2-GT1, (b) PtSe2-GT2, (c) PtSe2-GT4, (d) PtSe2-GT3 and inset (e) TiO2. | ||
3.2. Study of adsorption properties and proposed photocatalytic mechanism
The photocatalytic activity of the as-prepared nanocomposite was evaluated by catalytic degradation of Rh. B and Texbrite MST-L as organic dyes under UV and visible light irradiation. For the degradation and photocatalytic mechanism, important steps are the absorption by the photocatalyst, adsorption of pollutants on the surface of catalyst materials and the fast charge transfer route to create radical species to decompose the organic pollutants. In our nanocomposites graphene acts as an adsorption support material due to its conjugated structure and two-dimensionality. The dye molecules adsorbed on the surface of graphene via π–π interaction.62 In order to check the adsorption ability of the PtSe2–graphene/TiO2 nanocomposites, the concentration changes of Rh. B solution were recorded and are shown in Fig. 9(a–c).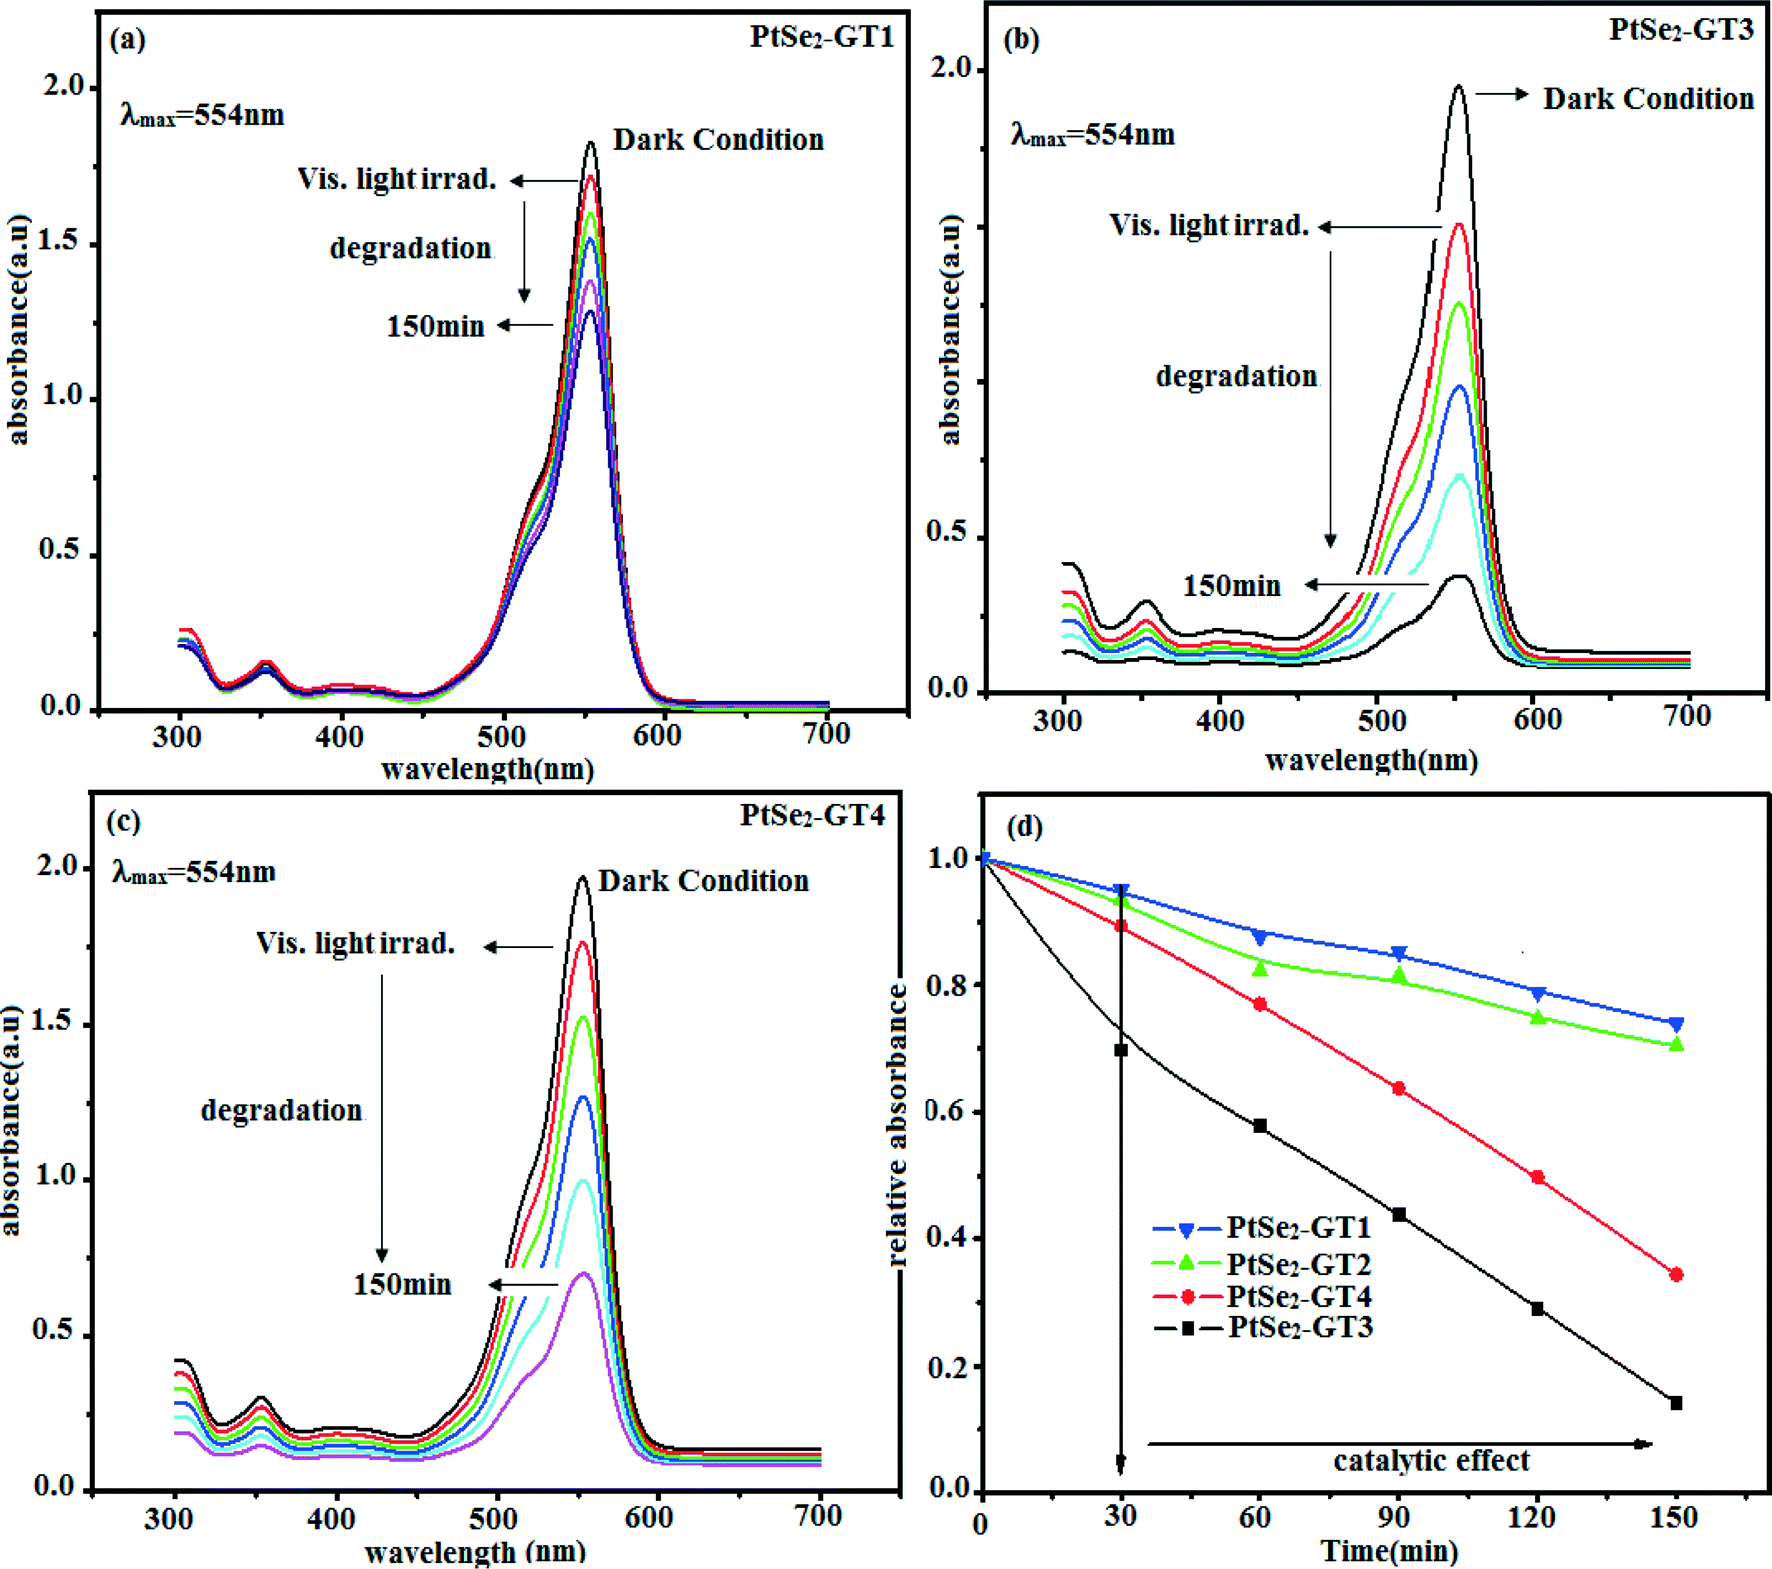 | ||
| Fig. 9 UV/Vis absorption spectra for Rh. B degradation by PtSe2–graphene/TiO2 under visible light (a) PtSe2-GT1, (b) PtSe2-GT3, (c) PtSe2-GT4 and (d) plot of Rh. B degradation efficiency vs. irradiation time. | ||
In order to attain adsorption–desorption equilibrium, the solution was kept in the dark for 2 h, and after adsorption–desorption equilibrium was achieved the solution was kept in a visible light chamber. The solution was irradiated with visible light radiation for 30 min. For analysis the sample was withdrawn periodically at 30 min time intervals and the solid materials were removed by centrifugation. Dye concentration of the sample was analyzed a using UV-visible spectrometer. As shown in Fig. 9 almost 80% of the organic dye was degraded by the PtSe2-GT3 sample in 150 minutes. The degradation rate can be seen from the decrease in the intensity of the peak at 554 nm of the Rh. B dye with increasing time intervals. The decrease in the concentration and improved catalytic effect can be attributed to the homogeneous distribution of the TiO2 and PtSe2 components by providing a large number of reaction centres. The metallic nanoparticles on the graphene sheets create a Schottky barrier at the interface with TiO2 and the graphene sheet. Therefore the trapped electrons will transfer and separate the excited molecules adsorbed at the interface of the PtSe2 and graphene sheets by retaining the recombination process. This may be helpful in increasing the degradation efficiencies of our nanocomposites. In order to test the adsorption ability of the nanocomposites, the concentration changes of Rh. B solution were recorded and shown in Fig. 9(d). It can be clearly seen that 80% of Rh. B was degraded by PtSe2-GT3 nanocomposite. Adsorption of Rh. B was slightly reduced by the incorporation of different wt% of graphene to TiO2 in the composites. Similar to the above results, loading of TiO2 slightly reduced the adsorption, while increasing the amount of graphene significantly enhanced the adsorption, which is evident from the PtSe2-GT3 nanocomposite, and describes the optimum loading condition for our nanocomposites.
The kinetic studies were performed on the basis of the degradation rate of the organic dye. The reactions between the dye molecules and the catalyst materials can be expressed by the Langmuir–Hinshelwood model as shown in Fig. 10 and calculated using the following equation.63
| −dC/dt = KappC | (3) |
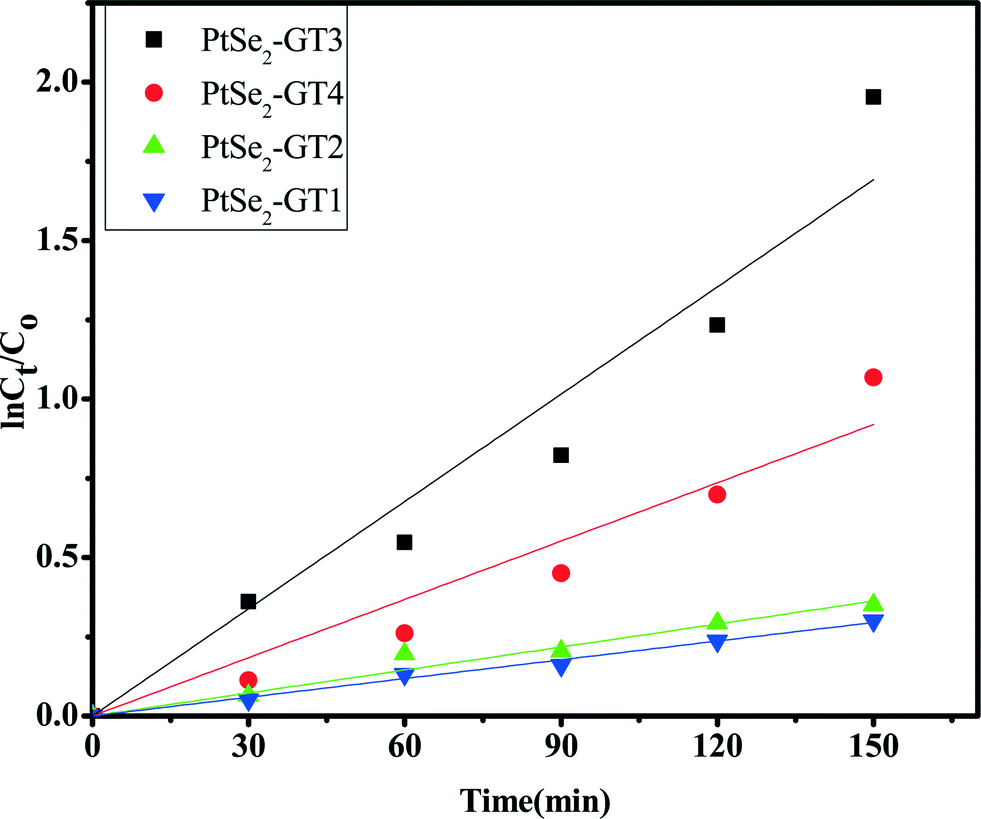 | ||
| Fig. 10 Apparent first order kinetics of Rh. B degradation over PtSe2-GT (1–4) nanocomposites under visible light. | ||
Integrating this equation (with the restriction C = C0 at t = 0, with C0 being the initial concentration in the bulk solution after dark adsorption, and t is the reaction time) will lead to the relationship
| −lnCt/C0 = Kappt | (4) |
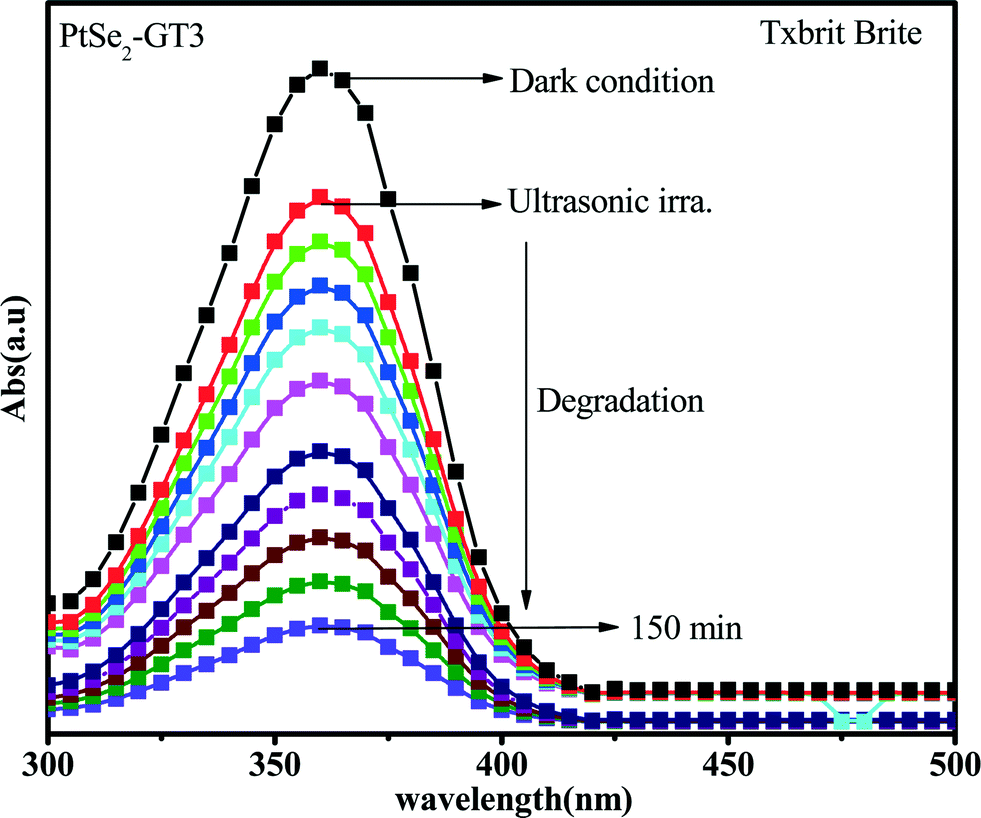 | ||
| Fig. 11 UV-vis absorption spectra for the Texbrite MST-L degradation by PtSe2-GT3 under UV light irradiation. | ||
The photocatalytic mechanism was proposed by a number of scientists worldwide for the utilization of light with wavelength in the range of 400–1000 nm to further explore the photocatalytic mechanisms for graphene-based materials. The PtSe2 band gap from theoretical and experimental observations was found to be ~1.8 eV. This semiconductor material can be excited from its ground state to an excited state upon irradiation with visible light. During the catalytic reaction, incident light radiation excites electrons from the valance band to the conduction band. This creates an electron–hole pair, in the absence of any dopant or support material, and most of the electron–hole pairs recombine and thus lower the catalytic effect. Attachment of PtSe2 on graphene sheets enhances the photocatalytic effect because of the extraordinary absorption and conducting properties of graphene.64,65 During light irradiation incident photons were absorbed by the graphene resulting in emission of photoelectrons and transfer to the conduction band of PtSe2. Simultaneously the excited electrons in the conduction band of PtSe2 transfer to the graphene sheets and prolong the recombination time. These electrons from the PtSe2 and graphene react with adsorbed molecules on the surface of the graphene sheets and thus prevent the recombination by improving the catalytic effect.6
Recently TiO2 on graphene has been found as a visible light photocatalytic material. This wide band gap (3.2 eV) TiO2 semiconductor material cannot be excited upon visible light irradiation. Modifying TiO2 nanoparticles with graphene can induce visible-light-responsive photocatalytic activity. The oxygen functionalities on the surface of graphene oxide with unpaired π electrons are bonded with titanium atoms on the surface of TiO2. These interactions are responsible for the reduction in the energy band of graphene–TiO2 nanocomposites. Therefore, it can be inferred that graphene with unpaired π electrons could be used to modify the TiO2 surface to manufacture a visible-light-responsive photocatalyst. The enhanced photocatalytic activity of graphene–TiO2 under visible light illumination is attributed to a red shift of the band edge and a significant reduction of the band gap of the graphene–TiO2 composite, which consequently allows the enhanced absorption of visible light and efficient transfer of photogenerated electrons through graphene nanosheets. The addition of graphene induces the light absorption intensity in the visible region. Therefore narrowing of the band gap is observed for the composite.
The photocatalytic activity can be further improved by the introduction of a heterogeneous system. The transfer of electrons between two distinct photocatalysts in the system is the determining factor in the decomposition of organic dyes.66 Under visible light irradiation, graphene and PtSe2 are excited and transfer electrons simultaneously. These electrons interact through the graphene sheet with VB electrons of TiO2. The graphene sheet behaves like an electron sea because of a significant charge transfer effect. These electrons thus react with the VB of the catalyst materials, increasing the recombination time, and will help to improve the catalytic effect. The electrons will transfer through the graphene sheet to the VB of the TiO2 in the composite and thus create a donor level. Thus the semiconductor material attached on graphene sheets acts like a kind of electron absorber in the photocatalytic reaction mechanism.61
The incident photons have sufficient energy to excite these electrons which are transferred to the CB of TiO2. This is because the photogenerated electrons from the PtSe2 photocatalysts accumulate on graphene; the Fermi level of graphene would shift upward and closer to the conduction band of the photocatalyst due to the metallic behavior of graphene. Under light irradiation the sandwich type structure is advantageous not only to electron injection but also to the hole recovery for both PtSe2 and TiO2. This unusual photocatalytic activity arises from the positive synergetic effect between the PtSe2 and graphene components in this hybrid cocatalyst, which serve as an electron donor, collector and transporter, and a source of active adsorption sites, respectively.13,21 The two-dimensional planar conjugation structure in graphene facilitated interfacial charge transfer along the graphene sheet to TiO2 and subsequently an effective charge separation was achieved. The generated electrons (e−) react with dissolved oxygen molecules and produce oxygen peroxide radicals O2˙−. The positively charged hole (h+) can react with OH− derived from H2O to form hydroxyl radicals OH˙. The Rh. B and Texbrite MST-L may be degraded by oxygen peroxide radicals O2˙−and hydroxyl radicals OH˙ to CO2, H2O and other mineralization products. The proposed mechanism is given in Fig. 12.
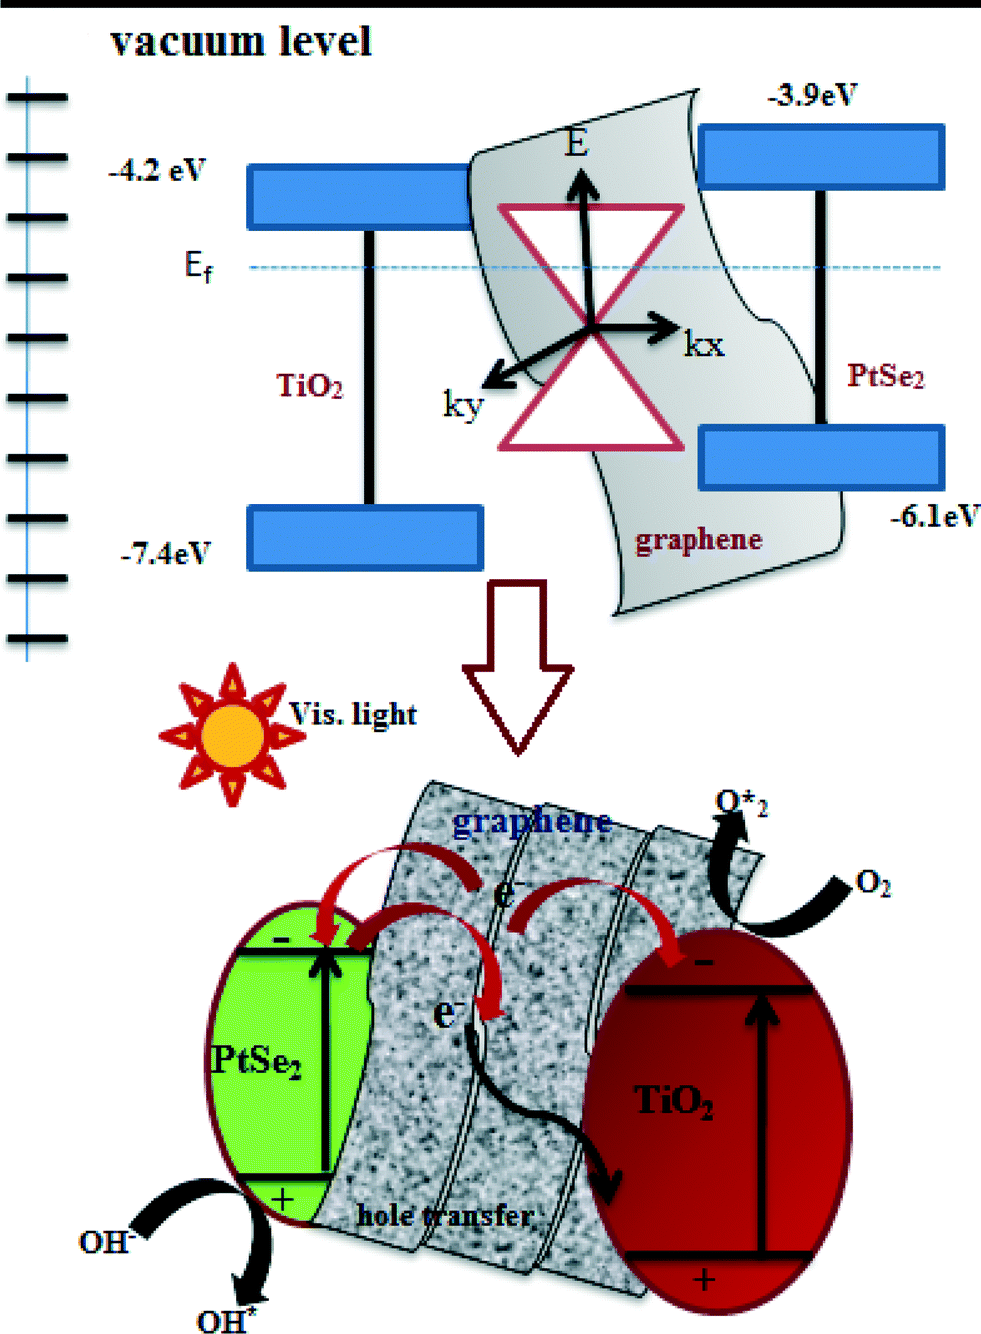 | ||
| Fig. 12 Charge transfer mechanism at the interface of PtSe2 and graphene supported by TiO2 catalyst nanocomposites. | ||
Conclusion
In this study, we successfully synthesized PtSe2–graphene/TiO2 nanocomposites by a facile microwave-assisted method. TEM images clearly indicate that the TiO2 nanoparticles are well distributed on the surface of transparent graphene sheets supported by PtSe2. The XPS result shows the presence of Pt, Se, C and partial oxygen functional groups on the graphene sheets. The XRD results show that hexagonal PtSe2 and anatase TiO2 were present. From the DRS results one can observe an overall red shift in the PtSe2-GT(1–4) samples. These also manifest the visible light response of the nanocomposites. From the UV-visible spectrum it is clear that an enhanced catalytic effect was observed for the PtSe2-GT3 nanocomposite, exhibiting the optimum loading effect of graphene in the composites. It is clearly found that the PtSe2–graphene/TiO2 nanocomposite can be used as an efficient photocatalyst under UV/visible light irradiation. It is believed that the positive synergetic effect between the PtSe2 and graphene sheets can efficiently suppress charge recombination, improve interfacial charge transfer, and provide a greater number of active adsorption sites and photocatalytic reaction centers. This high activity is also attributed to the positive synergetic effect of high charge mobility and the observed red shift in the absorption edge of the PtSe2–graphene/TiO2 nanocomposites.References
- Y. Zhu, S. Murali, W. Cai, X. Li, J. W. Suk, J. R. Potts and R. S. Ruoff, Graphene and Graphene Oxide: Synthesis, Properties, and Applications, Adv. Mater., 2010, 22, 3906–3924 Search PubMed.
- G. Eda, C. Mattevi, H. Yamaguchi, H. Kim and M. Chhowalla, Insulator to Semimetal Transition in Graphene Oxide, J. Phys. Chem. C, 2009, 113, 15768–15771 CAS.
- T. F. Yeh, F. F. Chan, C. T. Hsieh and H. Teng, Graphite Oxide with Different Oxygenated Levels for Hydrogen and Oxygen Production from Water under Illumination: The Band Positions of Graphite Oxide, J. Phys. Chem. C, 2011, 115, 22587–22597 CAS.
- C. K. Chua and M. Pumera, Renewal of sp2 bonds in graphene oxides via dehydrobromination, J. Mater. Chem., 2012, 22, 23227–23231 Search PubMed.
- Y. H. Ng, A. Iwase, A. Kudo and R. Amal, Reducing graphene oxide on a visible-light BiVO4 photocatalyst for an enhanced photoelectrochemical water splitting, J. Phys. Chem. Lett., 2010, 1, 2607–2612 Search PubMed.
- K. Ullah, L. Zhu, Z. D. Meng, S. Ye, S. Sarkar and W. C. Oh, Synthesis and characterization of novel PtSe2/graphene nanocomposites and its visible light driven catalytic properties, J. Mater. Sci., 2014, 49, 4139–4147 CrossRef CAS.
- A. Iwase, Y. H. Ng, Y. Ishiguro, A. Kudo and R. Amal, Reduced graphene oxide as a solid-state electron mediator in Z-scheme photocatalytic water splitting under visible Light, J. Am. Chem. Soc., 2011, 133, 11054–11057 CrossRef CAS PubMed.
- R. C. Pawar and C. S. Lee, Single-step sensitization of reduced graphene oxide sheets and CdS nanoparticles on ZnO nanorods as visible-light photocatalysts, Appl. Catal., B, 2014, 144, 57–65 CrossRef CAS PubMed.
- K. Ullah, L. Zhu, Z. D. Meng, S. Ye, Q. Sun and W. C. Oh, A facile and fast synthesis of novel composite Pt–graphene/TiO2 with enhanced photocatalytic activity under UV/Visible light, Chem. Eng. J., 2013, 231, 76–83 Search PubMed.
- R. C. Pawar and C. S. Lee, Sensitization of CdS nanoparticles onto reduced graphene oxide (RGO) fabricated by chemical bath deposition method for effective removal of Cr(VI), Mater. Chem. Phys., 2013, 141, 686–693 CrossRef CAS PubMed.
- N. Zhang, M.-Q. Yang, Z.-R. Tang and Y.-J. Xu, Toward Improving the Graphene–Semiconductor Composite Photoactivity via the Addition of Metal Ions as Generic Interfacial Mediator, ACS Nano, 2014, 8, 623–633 Search PubMed.
- K. Ullah, S. Ye, L. Zhu, S. B. Jo, W. K. Jang, K. Y. Cho and W. C. Oh, Noble metal doped graphene nanocomposites and its study of photocatalytic hydrogen evolution, Solid State Sci., 2014, 31, 91–98 Search PubMed.
- Q. J. Xiang, J. G. Yu and M. Jaroniec, Graphene-Based Semiconductor Photocatalysts, Chem. Soc. Rev., 2012, 41, 782–796 Search PubMed.
- M.-Q. Yang and Y.-J. Xu, Selective photoredox using graphene-based composite photocatalysts, Phys. Chem. Chem. Phys., 2013, 15, 19102–19118 Search PubMed.
- S. X. Min and G. X. Lu, Dye-Sensitized reduced graphene oxide photocatalysts for highly efficient visible-light-driven water reduction, J. Phys. Chem. C, 2011, 115, 13938–13945 CAS.
- K. Ullah, S. Ye, L. Zhu, Z. D. Meng, S. Sarkar and W. C. Oh, Microwave assisted synthesis of a noble metal-graphene hybrid photocatalyst for high efficient decomposition of organic dyes under visible light, Mater. Sci. Eng., B, 2014, 180, 20–26 Search PubMed.
- X. Q. An and J. C. Yu, Graphene-based photocatalytic composites, RSC Adv., 2011, 1, 1426–1434 Search PubMed.
- X. Pan, M.-Q. Yang and Y.-J. Xu, Morphology control, defect engineering and photoactivity tuning of ZnO crystals by graphene oxide – a unique 2D macromolecular surfactant, Phys. Chem. Chem. Phys., 2014, 16, 5589–5599 Search PubMed.
- L. Han, P. Wang and S. J. Dong, Progress in Graphene-based photoactive nanocomposites as a promising class of photocatalyst, Nanoscale, 2012, 4, 5814–5825 Search PubMed.
- R. C. Rajendra, V. Khare and C. S. Lee, Hybrid photocatalysts using graphitic carbon nitride/cadmium sulfide/reduced graphene oxide (g-C3N4/CdS/RGO) for superior photodegradation of organic pollutants under UV and visible light, Dalton Trans., 2014, 43, 12514–12527 Search PubMed.
- Q. Xiang and Yu J., Graphene-based photocatalysts for hydrogen generation, J. Phys. Chem. Lett., 2013, 4, 753–759 Search PubMed.
- C. Chen, W. Cai, M. Long, B. Zhou, Y. Wu, D. Wu and Y. Feng, Synthesis of Visible-Light Responsive Graphene Oxide/TiO2 Composites with p/n Heterojunction, ACS Nano, 2010, 4, 6425–6432 Search PubMed.
- Y. Zhang, Z.-R. Tang, X. Fu and Y.-J. Xu, Engineering the unique 2D mat of graphene to achieve graphene-TiO2 nanocomposite for photocatalytic selective transformation: What advantage does graphene have over Its forebear carbon nanotube?, ACS Nano, 2010, 4, 7303–7314 CrossRef CAS PubMed.
- Z.-D. Meng, S. Ye, S. Sarkar, L. Zhu, K. Ullah and Oh W.-C., Review for Graphene based photocatalysis materials, J. Multifunct. Mater. Photosci., 2013, 4(2), 103–111 Search PubMed.
- J. S. Lee, K. H. You and C. B. Park, Highly photoactive, low bandgap TiO2 nanoparticles wrapped by graphene, Adv. Mater., 2012, 24, 1084–1088 Search PubMed.
- Y. H. Zhang, N. Zhang, Z. R. Tang and Y. J. Xu, Graphene transforms wide band gap ZnS to a visible light photocatalyst. The new role of graphene as a macromolecular photosensitizer, ACS Nano, 2012, 6, 9777–9789 CrossRef CAS PubMed.
- M. Higashi, R. Abe, A. Ishikawa, T. Takata, B. Ohtani and K. Domen, Z-scheme overall water splitting on modified-TaON photocatalysts under visible light (l < 500 nm), Chem. Lett., 2008, 37, 138–139 Search PubMed.
- N. Zhang, Y. Zhang, X. Pan, M.-Q. Yang and Y.-J. Xu, Constructing Ternary CdS–Graphene–TiO2 hybrids on the flatland of graphene Oxide with enhanced visible-light photoactivity for selective transformation, J. Phys. Chem. C, 2012, 116, 18023–18031 CAS.
- K. Ullah, Z. D. Meng, S. Ye, L. Zhu and W. C. Oh, Synthesis and Characterization of Novel PbS-Graphene/TiO2 composite with enhanced photocatalytic activity, J. Ind. Eng. Chem., 2014, 20(3), 1035–1042 Search PubMed.
- N. Zhang, S. Liu and Y.-J Xu, Recent progress on metal core@semiconductor shell nanocomposites as a promising type of photocatalyst, Nanoscale, 2012, 4, 2227–2238 Search PubMed.
- K. Ullah, S. Ye, S. B. Jo, L. Zhu, K. Y. Cho and W. C. Oh, Optical and photocatalytic properties of novel heterogeneous PtSe2–graphene/TiO2 nanocomposites synthesized via ultrasonic assisted techniques, Ultrason. Sonochem., 2014, 21, 1849–1857 Search PubMed.
- T. Ghosh and W. C. Oh, Review on reduced graphene oxide by chemical exfoliation method and its simpler alternative of ultrasonication and heat treatment method for obtaining graphene, J. Photocatal. Sci., 2012, 3(1), 17–23 Search PubMed.
- E.-P. Ng, D. T.-L. Ng, H. Awala, K.-L. Wong and S. Mintova, Microwave synthesis of colloidal stable AlPO-5 nanocrystals with high water adsorption capacity and unique morphology, Mater. Lett., 2014, 132, 126–129 Search PubMed.
- L. Zhang, X. Chen, S. Jin, J. Guan, C. T. Williams, Z. Peng and C. Liang, Rapid microwaves synthesis of CoSix/CNTs as novel catalytic materials for hydrogenation of phthalic anhydride, J. Solid State Chem., 2014, 217, 105–112 Search PubMed.
- Gu L., L. Qian, Y. Lei, Y. Wang, J. Li, H. Yuan and D. Xiao, Microwave-assisted synthesis of nanosphere-like NiCo2O4 consisting of porous nanosheets and its application in electro-catalytic oxidation of methanol, J. Power Sources, 2014, 261, 317–323 Search PubMed.
- K. Ullah, S. Ye, L. Zhu, Z. D. Meng, S. Sarkar and W. C. Oh, Microwave assisted synthesis of a noble metal-graphene hybrid photocatalyst for high efficient decomposition of organic dyes under visible light, Mater. Sci. Eng., B, 2014, 180, 20–26 Search PubMed.
- S. D. Perera, R. G. Mariano, K. Vu, N. Nour, O. Seitz, Y. Chabal and K. J. Balkus Jr., Hydrothermal synthesis of graphene-TiO2 nanotube composites with enhanced photocatalytic activity, ACS Catal., 2012, 2, 949–956 Search PubMed.
- Biljana Pejova, Optical phonons in nanostructured thin films composed by zinc blende zinc selenide quantum dots in strong size-quantization regime: Competition between phonon confinement and strain-related effects, J. Solid State Chem., 2014, 213, 22–31 Search PubMed.
- B. D. Cullity, Elements of X-rays Diffraction, Addison Wesley Publishing Co, Philippines, 2nd edn, 1978, ch. 10, p. 338 Search PubMed.
- L. Zhua, M. Teo, P. C. Wong, K. C. Wong, I. Narita, F. Ernst, K. A. R. Mitchell and S. A. Campbell, Synthesis, characterization of a CoSe2 catalyst for the oxygen reduction reaction, Appl. Catal., A, 2010, 386, 157–165 Search PubMed.
- M. C Toroker, D. K. Kanan, N. Alidoust, L. Y. Isseroff, P. Liao and E. A. Carter, First principles scheme to evaluate band edge positions in potential transition metal oxide photocatalysts and photo electrodes, Phys. Chem. Chem. Phys., 2011, 13, 16644–16654 Search PubMed.
- H. L. Zhuang and R. G. Hennig, Computational search for single-layer transition-Metal Dichalcogenide Photocatalysts, J. Phys. Chem. C, 2013, 117(40), 20440–20445 CAS.
- Q. Xiang, J. Yu and M. Jaroniec, Synergetic effect of MoS2 and graphene as cocatalysts for enhanced photocatalytic H2 production activity of TiO2 nanoparticles, J. Am. Chem. Soc., 2012, 134, 6575–6578 Search PubMed.
- H. K. Jeong, H. J. Noh, J. Y. Kim, M. H. Jin, C. Y. Park and Y. H. Lee, X-ray absorption spectroscopy of graphite oxide, EPL, 2008, 82, 67004–67005 Search PubMed.
- D. R. Dreyer, S. Park, C. W. Bielawski and R. S. Ruoff, The chemistry of graphene oxide, Chem. Soc. Rev., 2010, 39, 228–240 Search PubMed.
- W. Gao, L. B. Alemany, L. Ci and P. M. Ajayan, New insights into the structure and reduction of graphite oxide, Nat. Chem., 2009, 1, 403–408 Search PubMed.
- D. W. Boukhvalov and M. I. Katsnelson, Modeling of graphite oxide, J. Am. Chem. Soc., 2008, 130, 10697–10701 Search PubMed.
- Z. He, W. Que, J. Chen, Y. He and G. Wang, Surface chemical analysis on the carbon-doped mesoporous TiO2 photocatalysts after post-thermal treatment: XPS and FTIR characterization, J. Phys. Chem. Solids, 2013, 74, 924–928 Search PubMed.
- E. Paparazzo, On the interpretation of XPS spectra of metal (Pt, Pt–Sn) nanoparticles/graphene systems, Carbon, 2013, 63, 578–581 Search PubMed.
- E. U. Condon and G. H. Shortley, The theory of atomic spectra, Cambridge University press, Cambridge, 1977, pp. 122–124 Search PubMed.
- K. L. Ono, B. Yuan, H. Heinrich and B. Roldan Cuenya, Formation and thermal stability of platinum oxides on size-selected platinum nanoparticles: support effects, J. Phys. Chem. C, 2010, 114(50), 22119–22133 Search PubMed.
- Z. Zafar, Z. H. Ni, X. Wu, Z. X. Shi, H. Y. Nan, J. Bai and L. T. Sun, Evolution of Raman spectra in nitrogen doped graphene, Carbon, 2013, 61, 57–62 Search PubMed.
- E. Anastassakis, Light scattering in transition metal diselenide CoSe2 and CuSe2, Solid State Commun., 1973, 13, 1297–1301 Search PubMed.
- R.-C. Wang, Y.-C. Chen, S.-J. Chen and Y.-M. Chang, Unusual functionalization of reduced graphene oxide for excellent chemical surface-enhanced Raman scattering by coupling with ZnO, Carbon, 2014,(70), 215–223 Search PubMed.
- S. Ameen, H. K. Seo, M. S. Akhtar and H. S. Shin, Novel graphene/polyaniline nanocomposites and its photocatalytic activity toward the degradation of rose Bengal dye, Chem. Eng. J., 2012, 210, 220–228 Search PubMed.
- G. Williams, B. Seger and P. V. Kamat, Electrocatalytically active graphene-platinum nanocomposites. Role of 2-D Carbon Support in PEM Fuel Cells, J. Phys. Chem. C, 2009, 113(19), 7990–7995 Search PubMed.
- R. Rao, R. Podila, R. Tsuchikawa, J. Katoch, D. Tishler, A. Rao and I. M. Shigami, Effects of Layer Stacking on the Combination Raman Modes in Graphene, ACS Nano, 2011, 5(3), 1594–1599 Search PubMed.
- K. John, D. T. Manolis, D. P. George, N. A. Mariza, S. T. Kostas, G. Sofia, B. Kyriakos, K. Christos, O. Michael and L. Alexis, Highly active catalysts for the photo oxidation of organic compounds by deposition of fullerene onto the MCM-41 surface: A green approach for the synthesis of fine chemicals, Appl. Catal., B, 2012, 117–118, 36–48 Search PubMed.
- J. Tauc, R. Grigorovici and A. Vancu, Optical properties and electronic structure of amorphous germanium, Phys. Status Solidi B, 1966, 15(2), 627–637 Search PubMed.
- T. Lv, L. Pan, X. Liu, T. Lu, G. Zhu, Z. Sun and C. Q. Sun, One-step synthesis of CdS–TiO2–chemically reduced graphene oxide composites via microwave-assisted reaction for visible-light photocatalytic degradation of methyl orange, Catal. Sci. Technol., 2012, 2, 754–758 CAS.
- P. Zeng, Q. Zhang, T. Peng and X. Zhang, One-pot synthesis of reduced graphene oxide–cadmium sulfide nanocomposite and its photocatalytic hydrogen production, Phys. Chem. Chem. Phys., 2011, 13, 21496–21502 Search PubMed.
- J. Low, Yu J., Q. Li and B. Cheng, Enhanced visible light photocatalytic activity of plasmonic Ag and graphene Co-modified Bi2WO6 nanosheets, Phys. Chem. Chem. Phys., 2014, 16, 1111–1120 Search PubMed.
- K. John, D. T. Manolis, D. P. George, N. A. Mariza, S. T. Kostas, G. Sofia, B. Kyriakos, K. Christos, O. Michael and L. Alexis, Highly active catalysts for the photo oxidation of organic compounds by deposition of fullerene onto the MCM-41 surface: A green approach for the synthesis of fine chemicals, Appl. Catal., B, 2012, 117–118, 36–48 Search PubMed.
- H. Kim, G. Moon, D. Monllor Satoca, Y. Park and W. Choi, Solar Photo conversion Using Graphene/TiO2 Composites: Nano graphene Shell on TiO2 Core versus TiO2 Nanoparticles on Graphene Sheet, J. Phys. Chem. C, 2012, 116, 1535–1543 CAS.
- N. Zhang, Y. H. Zhang and Y. J. Xu, Recent Progress on Graphene-Based Photocatalysts: Current Status and Future Perspectives, Nanoscale, 2012, 4, 5792–5813 Search PubMed.
- C. Chen, W. Cai, M. Long, B. Zhou, Y. Wu, D. Wu and Y. Feng, Synthesis of Visible-Light Responsive Graphene Oxide/TiO2 Composites with p/n Heterojunction, ACS Nano, 2010, 4, 6425–6432 Search PubMed.
| This journal is © The Royal Society of Chemistry 2015 |