
 Open Access Article
 This Open Access Article is licensed under a
 Creative Commons Attribution 3.0 Unported Licence
On the role of H2 to modify surface NOx species over Ag–Al2O3 as lean NOx reduction catalyst: TPD and DRIFTS studies
Muhammad Mufti
Azis
ab,
Hanna
Härelind
b and
Derek
Creaser
*a
aDivision of Chemical Engineering, Department of Chemical and Biological Engineering, Chalmers University of Technology, Göteborg, Sweden SE-41296. E-mail: derek.creaser@chalmers.se; Fax: +4631 7723035; Tel: +4631 7723023
bCompetence Centre for Catalysis (KCK), Department of Chemical and Biological Engineering, Chalmers University of Technology, Göteborg, Sweden SE-41296
First published on 20th August 2014
Abstract
Formation and stability of surface NOx species related to the promotional effect of H2 over Ag–Al2O3 as NOx reduction catalyst were investigated with temperature-programmed desorption and DRIFT spectroscopy. Formation of two groups of surface NOx species was found: a less thermally stable group of “low temperature (LT) species” and a more thermally stable group of “high temperature (HT) species”. The LT NOx was attributable to the decomposition of surface NOx species formed on the active sites where its elimination by addition of H2 or thermal decomposition correlated with higher NO oxidation and NOx reduction conversion. Under reaction conditions, these possibly inhibiting LT NOx species were stable up to about 300 °C and their formation depended on donation of oxygen from surface oxides. Removal of LT nitrate species by H2 accounted for only a fraction of the increased NO oxidation and NOx reduction conversion by co-feeding H2. Furthermore, it was also found that H2 facilitates formation of HT NOx that primarily corresponded to the decomposition of spectator species on the Al2O3 support identified as monodentate nitrate species. From TPD studies of C3H6-SCR, it was shown that H2 not only eliminated LT NOx but also promoted formation of greater quantities of adsorbed hydrocarbons.
Introduction
With a growing demand to reduce fuel consumption, lean-burn and diesel engine vehicles will continue to comprise an increasing fraction of road-vehicles in the future. The regulation of NOx (NO + NO2) emissions from the transportation sector in the upcoming years will be more stringent and therefore it is urgently required to develop efficient and reliable NOx reduction after treatment systems for a wide variety of lean-burn or diesel engines. Selective catalytic reduction (SCR) of NOx with hydrocarbons (HC) has remained as one possible concept to catalytically reduce NOx emissions from lean-burn and diesel engine vehicles. For hydrocarbon-selective catalytic reduction (HC-SCR), Ag/Al2O3 catalysts have been considered to have potential due to their lower cost, higher tolerance towards water vapor and sulfur1,2 but also lower selectivity to N2O formation compared to PGM catalysts.3However, it is important to mention that Ag/Al2O3 exhibits poor NOx reduction activity in the lower temperature region. Below 400 °C, the NOx reduction activity decreases abruptly which has been considered to be due to self-inhibition by adsorbed nitrates on the active sites of the catalyst.4 It has been shown that addition of H2 can drastically promote NOx reduction activity in the lower temperature region.5 The so called “H2-effect” results in better NOx reduction activity and a wider temperature operating window. Nevertheless, the reaction mechanism of HC-SCR over Ag/Al2O3 remains a challenging issue since it involves a number of reaction intermediates and surface species during the reaction. As a result, the mechanisms by which H2 promotes NOx reduction with Ag/Al2O3 are not entirely identified.
Generally, the reaction mechanism of HC-SCR over Ag/Al2O3 is initiated by activation of NOx and HC. Activation of NOx is characterized by formation of surface NOx species mainly as nitrate and/or nitrite species. Subsequently, oxygen partially oxidizes hydrocarbons (HC activation) to form oxygenated HC surface species which react further with surface NOx species and eventually lead to the formation of N2. For this reason, surface NOx species have been suggested to be important intermediates and therefore it is important to understand their formation, stability, reactivity and possible inhibition effects to elucidate the mechanism of HC-SCR.
Temperature-programmed desorption (TPD) is a useful technique to investigate the thermal stability of adsorbed species. TPD studies to investigate the stability of surface NOx species over Ag/Al2O3 have been reported in the literature.6–9 Following adsorption of NO and O2 over Ag/Al2O3, two NOx desorption peaks at low temperature (250–340 °C) and high temperature (435–539°) have been reported.6,9 Several attempts were made to identify the origin of these NOx desorption peaks. By combining TPD and IR spectroscopy, Kameoka et al.6 found that the peaks originated from three types of surface nitrates i.e. bridging, bidentate and monodentate nitrates. From additional TPD studies,7–9 it was pointed out that NOx desorption peaks at high temperature (~440 °C (ref. 7 and 8) and 539 °C (ref. 9)) resulted from surface nitrate decomposition.
It is interesting to note that H2 may play a dual role in its interaction with nitrate species. On one hand, H2 has been proposed to promote elimination of nitrates during H2-assisted HC-SCR.10–16 On the other hand, it has also been shown that H2 activates accumulation of nitrates on the surface, especially during NO oxidation.8,10,17–19
Elimination of surface nitrates from the active silver species by H2 has been proposed as one probable key step in the “H2-effect” for low temperature HC-SCR.10–16 H2 has also been found to promote NO oxidation8,13,17,18,20 and our previous study has simulated H2-assisted NO oxidation based on the main role of H2 to eliminate poisonous surface nitrate species.21 It is important to mention, however, that H2 has been proposed to have several other roles in HC-SCR which have been discussed in the literature such as to facilitate modification of surface species and active Ag sites.5,10,12,13,16,22,23
Seemingly contradictory to hydrogen's proposed role to eliminate nitrates during HC-SCR, in situ FTIR studies have been widely presented in the literature showing that H2 plays an important role to activate the accumulation of surface nitrates following exposure of the catalyst to a NO–O2–H2 gas mixture.10,17–19 Recently, Kim et al.23 also suggested that the kinetic effects of H2 was to promote formation of surface nitrate that later reacts with adsorbed HC. With the low silver loadings that are common for Ag/Al2O3 catalysts, it is also reasonable to expect that alumina also facilitates adsorption of surface NOx species. In addition, the existence of both silver nitrate and aluminium nitrate and their interaction following NOx adsorption has been proposed.8,11,24 Unfortunately, in situ IR analysis indicates overlapping peaks for nitrates over Ag/Al2O3 and bare Al2O3 which makes it difficult to discriminate between nitrates on the Al2O3 support and silver particles.17,25,26
In the present work, a series of TPD studies of NOx were carried out over Ag–Al2O3 and Al2O3 catalysts to quantify and characterize the stability of surface NOx species related to Ag–Al2O3 as a HC-SCR catalyst. In addition, in situ DRIFT spectroscopy experiments were also carried out to characterize formation of adsorbed NOx species. This study has also aimed to demonstrate the effect of H2 to modify the quantities and position of surface NOx species. These effects will also be correlated to the activity of the catalyst for NO oxidation and C3H6-SCR to determine quantitatively to what extent H2 removal of inhibiting nitrates may contribute to the so called “H2-effect”. An additional objective for studying surface NOx species was to examine whether these apparently contradictory roles for H2, discussed above, could be compatible. We have focused our work on the low temperature region 200–300 °C as it is expected to be favorable for formation of surface NOx species and therefore most relevant to understand the H2-effect in modification of surface NOx species.
Experimental method
Catalyst preparation
Ag–Al2O3 with 2 wt.% Ag loading on Al2O3 was prepared by a freeze dried sol–gel method. The powder was then washcoated onto a cordierite monolith with a diameter of 2 cm. Ag–Al2O3 and Al2O3 were washcoated onto 2 cm and 4 cm long cordierite monoliths respectively. Approximately 0.5 g of Ag–Al2O3 and 1.5 g Al2O3 was deposited onto the cordierite monoliths. The specific surface area of powders measured by N2 sorption (BET method) gave specific surface areas of 188 m2 g−1 and 233 m2 g−1 for Ag–Al2O3 and Al2O3, respectively. The details of methods for preparation and coating of monoliths were described elsewhere.21,27Flow reactor experiments
TPD experiments were performed in a horizontal quartz tube reactor 88 cm long with 2 cm diameter. The monolith sample was placed inside the reactor tube and thermocouples were used to measure both the monolith temperature (later also called catalyst temperature) and inlet gas temperatures. To minimize axial temperature gradients in the monolith sample, a number of blank monoliths (with total length of 14 cm) were placed to fill the empty space between the monolith and outlet end of the reactor. A test with only blank monoliths indicated that these blank monoliths were inert. To provide heat to the reactor, a spiral-shaped electrical heater was used around the reactor tube. A number of quartz wool layers were used to bundle the reactor tube in order to minimize heat loss.Several mass flow controllers (Bronkhorst) were used to supply gas flow to the reactor tube. Ar was used as a carrier gas in all experiments. The outlet flow from the reactor was sent to gas analyzers. A FTIR MKS 2000 was utilized to measure the majority of gas outlet component concentrations including NO, NO2, N2O, CO, C3H6, and NH3 in ppm level. In addition, a Hiden HPR 20 quadrupole mass spectrometer (MS) was employed to sample a small fraction of the outlet stream to detect variations in concentrations of some components from the following mass to charge (m/z) ratios: 2 (H2), 16 and 32 (O2), 28 (N2 and CO), and 44 (CO2). To present O2 measurement results, m/z 16 was selected from MS measurement.
Temperature-programmed desorption experiments (TPD) were initiated by pretreatment of the catalyst with 8% O2 for 20 minutes at 550 °C. Subsequently, the catalyst temperature was cooled down to a targeted adsorption temperature: 200, 250 or 300 °C. An adsorption gas mixture was introduced for a certain time as depicted in Table 1. After the adsorption step, feed of adsorption species were terminated and a flow of only Ar was maintained. The catalyst temperature was then kept constant at the adsorption temperature for 5 minutes to flush away any loosely bound surface species. Subsequently, the catalyst temperature was either maintained or decreased to 200 °C during a period of 30 min in Ar flow to allow further stabilization of the adsorbed species. The desorption step was performed by increasing the inlet gas temperature from 200 to 550 °C at a rate of 40 °C min−1 in Ar flow. Due to temperature gradients between measured inlet and catalyst temperatures, the maximum catalyst temperature reached varied between 530 to 545 °C. The catalyst temperature was the temperature used to identify the desorption profile and is therefore presented in all TPD results below.
| TPD type | Gas mixture (GM) | Adsorption gasesa | 2 wt.% Ag–Al2O3 | Al2O3 | ||
|---|---|---|---|---|---|---|
| Duration (min) | WHSVb (h−1) | Duration (min) | WHSVb (h−1) | |||
| a Ar was always used as carrier gas. b Weight hourly space velocity (WHSV) is the ratio of mass flow rate and mass of catalyst material. | ||||||
| NO oxidation | GM 1 | 500 ppm NO + 4% O2 | 30 | 266 | 30 | 231 |
| H2-assisted NO oxidation | GM 2 | 500 ppm NO + 4% O2 + 0.1% H2 | 30 | 266 | 30 | 231 |
| NO2–O2 adsorption | GM 3 | 150 ppm NO2 + 4% O2 | 120 | 620 | 180 | 231 |
| C3H6-SCR | GM 4 | 500 ppm NO + 0.1% C3H6 + 4% O2 | 30 | 266 | — | — |
| H2-assisted C3H6 SCR | GM 5 | 500 ppm NO + 0.1% C3H6 + 4% O2 + 0.1% H2 | 30 | 266 | — | — |
During adsorption with C3H6-SCR conditions (GM 4 in Table 1), H2-assisted C3H6-SCR (GM 5 in Table 1) as well as the following desorption steps, it was found that formation of N2O according to the FTIR analysis was negligible. Therefore, m/z 44 from MS measurement could be used as a reliable indicator of CO2 concentration with calibration. These MS measurements of CO2 concentration agreed quantitatively with average FTIR measurements but were found to be far less noisy and are thus reported here.
Total flow rates of gases during flow reactor experiments were varied between 1500–3500 mLn min−1. As a result, different weight hourly space velocities (WHSV) were used for the Ag–Al2O3 and Al2O3 catalysts based on the masses of catalyst material deposited on monoliths as shown in Table 1. It is thus noteworthy that the quantities of adsorbed species cannot be compared directly by merely inspecting the level of gas concentrations from TPD results over Ag–Al2O3 and Al2O3. A lower WHSV was usually used for the Al2O3 catalyst because it was expected that the quantities of adsorbed species would be lower compared to Ag–Al2O3 and thus there would be a risk that the desorbed quantities may be undetectable during the TPD experiments. Nevertheless, correct comparisons could be made since the flow reactor experimental results were integrated to calculate the quantities of adsorbed/desorbed NOx species per mass of catalyst materials.
In situ DRIFT Spectroscopy
The DRIFT instrument used in this work was a Bio Rad FTS6000 Spectrometer. The sample powder of 2 wt.% Ag–Al2O3 was placed in a sample holder (supported by a metallic grid) of a high temperature Harrick Praying Mantis cell coated with Silcolloy® 1000 and equipped with KBr windows. The gases were supplied by a number of mass flow controllers (Bronkhorst Hi-Tech). The total flow used was 100 mLn min−1 with Ar as the inert balance. The weight of sample powder was ca. 90 mg. To regulate temperature, the DRIFT cell was equipped with a Eurotherm heating system and water cooling system. In addition, a K-type thermocouple was placed near the sample holder to indicate the bed temperature.The DRIFT experiments were conducted following a similar TPD protocol that consisted of adsorption and desorption steps with temperature ramps. Prior to each experiment, the sample was pretreated with 8% O2 at 500 °C for 30 min. Subsequently, the cell temperature was decreased to 200 °C in inert gas flow. Here, background spectra were collected prior to each adsorption step by accumulating 60 scans with a resolution of 1 cm−1. The accumulation of IR spectra was initiated 2 min before the adsorption step by collecting 6 scans min−1 with a resolution of 1 cm−1. Table 2 shows the details of the adsorption step conditions. After the adsorption step, the cell temperature was kept constant at 200 °C for 10 min to stabilize adsorbed species in Ar flow. Subsequently, the cell temperature was raised to 500 °C with a ramping rate of 20 °C min−1. The IR spectra were collected continuously during adsorption and desorption steps.
| No. | Adsorption step | Adsorption gases | Duration (min.) |
|---|---|---|---|
| 1 | NO oxidation | 1000 ppm NO + 8% O2 | 30 |
| 2 | H2-assisted NO oxidation | 1000 ppm NO + 8% O2 + 0.2% H2 | 30 |
| 3 | NO2–O2 adsorption | 300 ppm NO2 + 8% O2 | 60 |
| 4 | C3H6-SCR | 1000 ppm NO + 8% O2 + 2000 ppm C3H6 | 30 |
| 5 | H2-assisted C3H6-SCR | 1000 ppm NO + 8% O2 + 2000 ppm C3H6 + 0.2% H2 | 30 |
Results
TPD following NO oxidation
In order to investigate formation of surface NOx species, adsorption conditions with NO–O2 gas mixture (GM 1) was carried out over Ag–Al2O3 and Al2O3. Fig. 1 shows the NOx uptake during the adsorption step and TPD profile over Ag–Al2O3 and Al2O3. The amount of NOx adsorbed and desorbed was calculated by integrating the NOx curves over these catalysts and normalized to the mass of catalyst. The results from integration are displayed in Table 3. | ||
| Fig. 1 TPD following NO oxidation over Ag–Al2O3 and Al2O3 showing the adsorption steps (a, c) and desorption profiles (b, d) at adsorption temperature 200 (red), 250 (green) and 300 °C (blue). Adsorption condition GM 1 as displayed in Table 1 was used. | ||
| Adsorption conditions | Ag–Al2O3 | Al2O3 | ||
|---|---|---|---|---|
| NOx adsorbed (μmol g−1) | NOx desorbed (μmol g−1) | NOx adsorbed (μmol g−1) | NOx desorbed (μmol g−1) | |
| TPD NO–O2 | ||||
| 200 °C | 111.4 | 110.7 | 61.9 | 59.6 |
| 250 °C | 98.2 | 98.1 | 57.9 | 57.7 |
| 300 °C | 59.3 | 58.7 | 41.5 | 40.9 |
| TPD NO–O2–H2 | ||||
| 200 °C | 189.6 | 188.8 | 31.3 | 28.7 |
| 250 °C | 153.5 | 150.8 | 17.8 | 14.0 |
| 300 °C | 103.7 | 100.4 | 8.8 | 6.8 |
| TPD NO2–O2 | ||||
| 200 °C | 450.8 | 448.9 | 357.6 | 356.6 |
| 250 °C | 337.9 | 335.4 | 282.3 | 281.2 |
| 300 °C | 245.7 | 242.4 | 212.6 | 210.8 |
As seen from Fig. 1 and Table 3, the quantities of NOx adsorbed decreased with increasing adsorption temperature. It was found that the duration of adsorption was in all cases sufficiently long to reach steady state reaction conditions and thus the catalyst was saturated with adsorbed species for each set of conditions. Conversion of NO to NO2 during the adsorption step over Ag–Al2O3 (Fig. 1a) was low and negligible at 200 and 250 °C. At 300 °C, there was a detectable conversion of NO to NO2 of about 4%. Following the switch from the adsorption gas mixture to only Ar flow, there was desorption of loosely bound surface NOx species.
Fig. 1b shows the desorption profiles of NOx over Ag–Al2O3. During the temperature ramp for Ag–Al2O3, two NOx desorption peaks were observed i.e. a low temperature (LT) peak at 277–340 °C and high temperature (HT) peak at ca. 440 °C. It is noteworthy that the LT peaks were skewed to higher temperatures with increasing adsorption temperature. The major NOx components desorbed were NO at both LT and HT peaks whereas NO2 was only observed at the LT peak following adsorption at 200 and 250 °C. No O2 release was observed during the desorption steps following all adsorption temperatures.
In order to investigate the formation of surface NOx species over Al2O3, similar TPD studies following NO oxidation were conducted on Al2O3 (Fig. 1c and d). As seen from Fig. 1c, the NO oxidation conversion to NO2 was negligible and at the highest temperature 300 °C, only ca. 8 ppm of NO2 (~1.6% conversion) was observed. Thus, it can be said that both Ag–Al2O3 and Al2O3 could be considered as a relatively poor NO oxidation catalysts below 300 °C. From the desorption profile (Fig. 1d), two desorption peaks were observed, similar to that for the Ag–Al2O3 catalyst. The characteristics and location of the LT peak resembled that for Ag–Al2O3. However, the HT peak over Al2O3 was shifted to a higher temperature of 486 °C. The major gas desorbed at the LT peak was NO followed by a slightly lower amount of NO2. Whereas, decomposition of surface NOx species at the HT peak gave mostly NO2. Similar to Ag–Al2O3, no desorption of O2 was observed during temperature ramps following all adsorption temperatures.
TPD following H2-assisted NO oxidation
Addition of H2 has been shown to promote NO oxidation activity over Ag–Al2O3 catalysts.5,8,13,17,18,20,21 TPD studies using a NO–O2–H2 adsorption gas mixture (GM 2) were carried out over Ag–Al2O3 and Al2O3. Fig. 2 shows the NOx uptake and TPD profile for the NO–O2–H2 system over Ag–Al2O3 and Al2O3 catalysts. The duration of adsorption was in all cases sufficiently long to reach steady state reaction conditions. As shown in Fig. 2a, NO oxidation conversion to NO2 was detected and increased from 5% at 200 °C to 10% at 250 and 300 °C during the adsorption step with Ag–Al2O3. In addition, formation of N2O and NH3 were negligible at below 5 ppm and 1 ppm (not shown), respectively. Likewise, NOx conversion was not observed. | ||
| Fig. 2 TPD following H2-assisted NO oxidation over Ag–Al2O3 and Al2O3 showing the adsorption steps (a, c) and desorption profiles (b, d) at adsorption temperature 200 (red), 250 (green) and 300 °C (blue). Adsorption condition GM 2 as displayed in Table 1 was used. | ||
During the temperature ramp with Ag–Al2O3 (Fig. 2b), the desorption peak of NO2 at ca. 450 °C was clearly observed which can be assigned as the HT peak as observed from NO–O2 TPD (Fig. 1b). Desorption of O2 was also observable and coincided well with the NO2 peak. In addition, desorption of low concentrations of NO were observed at ca. 340–350 °C and 505 °C. It is noteworthy that H2 desorption was not observed at all temperatures.
It can be noted that along with higher activity for NO oxidation in the presence of H2, the LT peak which was observed in the NO–O2 system was significantly suppressed and shifted towards the HT peak. The shift was also accompanied by higher total quantities of NOx adsorbed and desorbed as displayed in Table 3. The results from the TPD study with Al2O3 with adsorption gases GM 2 are shown in Fig. 2c and d. During the adsorption step (Fig. 2c), NO conversion to NO2 was negligible at all temperatures. Therefore, it could be concluded that H2 did not promote NO oxidation to NO2, but instead it acted as a reductant which also decreased the amount of NOx adsorbed compared to the NO–O2 system over Al2O3 (see Fig. 1c and Table 3).
During the temperature ramp with Al2O3 (Fig. 2d), the LT and HT desorption peaks were observable for adsorption temperatures 200 and 250 °C. The LT peak (at 270–280°) was markedly higher than the HT peak (at ca. 460°). The LT peak consisted of NO and NO2 where the quantities of NO were slightly higher than NO2. Decomposition of HT species gave only desorption of NO2. At an adsorption temperature of 300 °C, the desorption peaks of NOx were at trace levels. In addition, no desorption of O2 was observed following all studied adsorption temperatures.
TPD following NO2 adsorption
In order to investigate the adsorption of NO2 on Ag–Al2O3 and Al2O3 at conditions comparable to those for NO oxidation above, i.e. with excess O2 present, TPD experiments following exposure to gas mixture GM 3 were conducted. Fig. 3 shows the NOx uptake and NOx desorption profiles for both catalysts. As seen from the adsorption step over Ag–Al2O3 (Fig. 3a), a temporary formation of NO could be detected during NO2 adsorption. The quantities of NOx uptake decreased with higher adsorption temperature as also displayed in Table 3. The NO2–O2 system took much longer time to reach stable outlet NOx signals during the adsorption steps compared to the NO–O2 system due to the larger formation of surface NOx species on the catalysts as evident from Table 3. During the temperature ramp over Ag–Al2O3 (Fig. 3b), a substantial release of NO2 was observed that peaked at 440–460 °C. A minor desorption of NO was also detected at higher temperature ~525 °C. A broad release of O2 was observed reaching a peak at ~450–475 °C. | ||
| Fig. 3 TPD following NO2 adsorption over Ag–Al2O3 and Al2O3 showing the adsorption steps (a, c) and desorption profiles (b, d) at adsorption temperature 200 (red), 250 (green) and 300 °C (blue). Adsorption condition GM 3 as displayed in Table 1 was used. | ||
A similar TPD study with GM 3 was also conducted over the Al2O3 sample. Fig. 3c shows the NOx uptake over the Al2O3 catalyst and it gave a profile similar to that for the Ag–Al2O3 catalyst. Along with adsorption of NO2, temporary NO formation was also observed and reached a peak of ca. 35 ppm (adsorption temperature 200 °C). Similar to Ag–Al2O3, a broad O2 peak was observed with a peak at ~450 °C. In general, one can notice that the desorption profiles of NOx over Ag–Al2O3 and Al2O3 after NO2 adsorption were similar. Comparing the quantities of NOx, it can be seen from Table 3 that the amount of NOx adsorbed on Ag–Al2O3 is comparable to Al2O3 but somewhat greater on the Ag–Al2O3. It should be noted that in this case since the WHSV used for Ag–Al2O3 (620 h−1) was much higher than that for Al2O3 (231 h−1), the quantities of NOx adsorbed cannot be compared directly from Fig. 3a and c.
TPD following C3H6-SCR and H2-assisted C3H6-SCR
Further TPD studies were conducted to investigate the quantities and nature of adsorbed NOx and COx species during C3H6-SCR and H2-assisted C3H6-SCR over the Ag–Al2O3 catalyst. Fig. 4 presents TPD results following exposure to the C3H6-SCR gas mixture (GM 4) in the absence of H2 where panels 4a to 4d show the NOx uptake, desorption profile of NOx, COx formation during adsorption and the desorption profile of COx respectively. | ||
| Fig. 4 TPD following C3H6-SCR over Ag–Al2O3 showing adsorption (a) and desorption (b) of NOx, adsorption (c) and desorption (d) of COx. Adsorption condition GM 4 as displayed in Table 1 was used at adsorption temperatures 200 (red), 250 (green) and 300 °C (blue). | ||
During the adsorption step (Fig. 4a), the NO signal increased rapidly and NO2 yield was found to be negligible. Formation of N2O (not shown) was negligible at below 5 ppm during C3H6-SCR and also later during H2-assisted C3H6-SCR. Similarly, formation of NH3 (not shown) was negligible at below 1 ppm both during C3H6-SCR and H2-assisted C3H6-SCR. The NOx conversion during the adsorption step was negligible at less than 250 °C and increased to ~6% at 300 °C. Furthermore, C3H6 conversion to CO2 and CO was also observed during the adsorption step for C3H6-SCR (Fig. 4c).
During the temperature ramp (Fig. 4b), two remarkable NOx peaks could be observed at ca. 290 °C (LT) and 420 °C (HT). It should be noted that following adsorption at 200 °C a shoulder on the NO peak at ca. 235 °C could be seen. The LT NOx desorption quantity decreased with higher adsorption temperature and became markedly suppressed at the adsorption temperature of 300 °C. In addition, it could be seen that almost no O2 desorption was detected during desorption step. From Fig. 4d, the CO desorption peak was observed between 405 to 426 °C while the CO2 desorption peak was broad with the same rise and decline as the CO profile.
In order to investigate the influence of H2 on C3H6-SCR, 0.1% H2 was added in the adsorption step with gas mixture GM 5. Fig. 5a to f showing the NOx uptake, desorption profile of NOx, COx formation during adsorption, desorption profile of COx, H2 profile during adsorption and desorption profile of H2 respectively. During the adsorption step (Fig. 5a), NO consumption and NO2 formation were observed and increased with higher adsorption temperature. An NO2 yield of up to 20 ppm was observed at adsorption temperature 300 °C. Similarly, higher formation of CO and CO2 were observed in comparison with the absence of H2 (comparing Fig. 5c and 4c) indicating a higher conversion of C3H6. Consumption of H2 during the adsorption step (Fig. 5e) markedly increased with higher adsorption temperature. As expected, addition of H2 gave higher NOx conversion than in the absence of H2 and a NOx conversion up to 23% was observed at 300 °C. During the desorption step (Fig. 5b), a small peak of NO at 240 °C and a broad desorption peak reaching a maximum at ~440 °C were observed whereas NO2 desorption was negligible. These NO peaks decreased with higher adsorption temperature. The quantities of desorbed NOx in the presence of H2 were higher than in the absence of H2 as shown in Table 4. In addition, it could be observed that a broad O2 desorption was clearly detected accompanying NOx desorption.
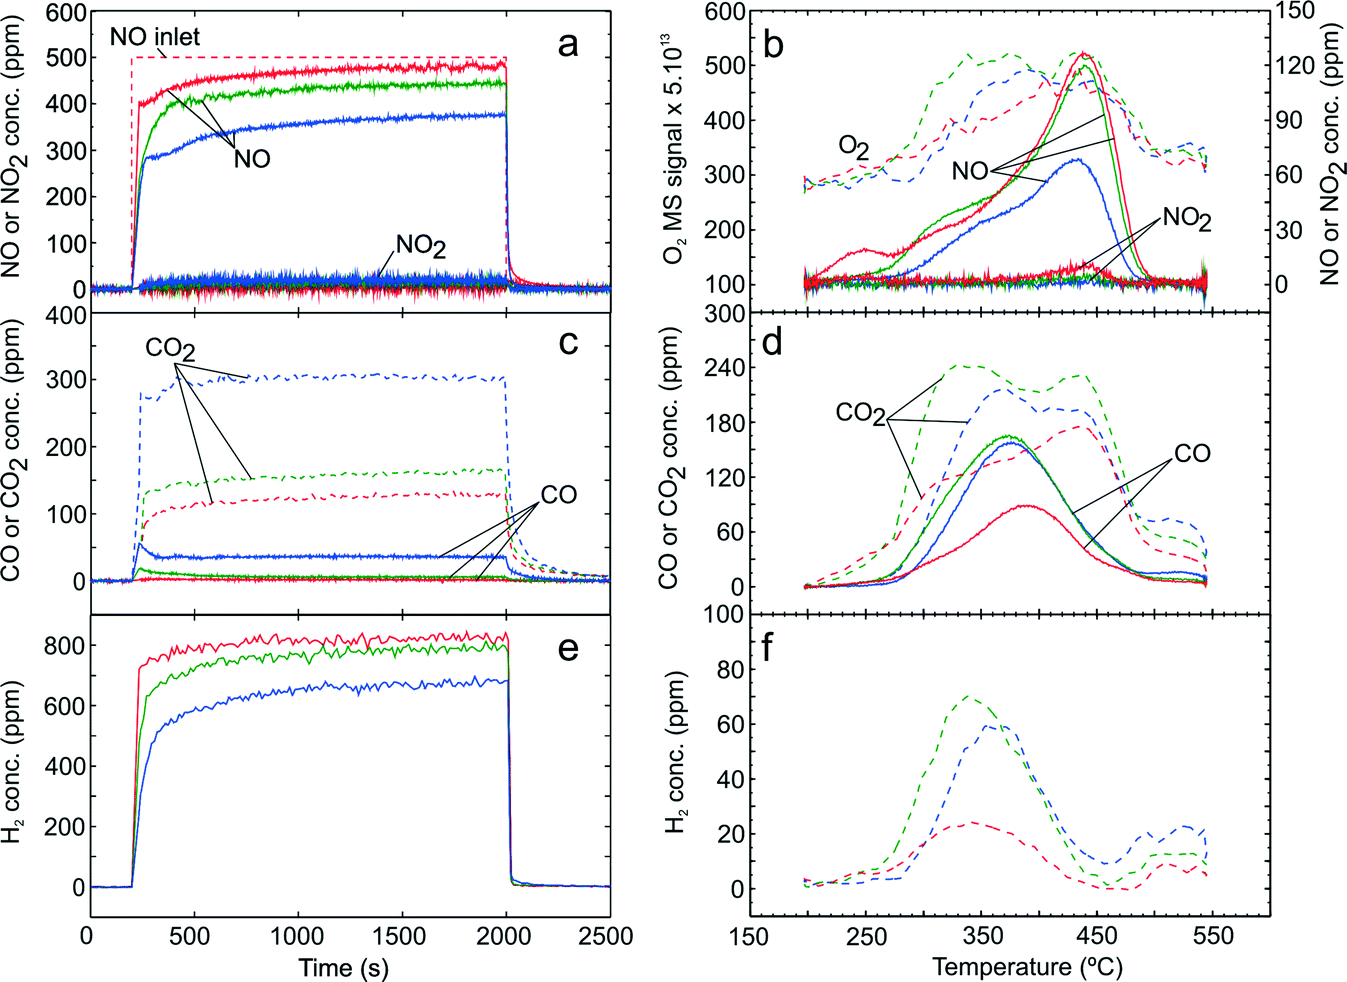 | ||
| Fig. 5 TPD following H2-assisted C3H6-SCR over Ag–Al2O3 showing adsorption (a) and desorption (b) of NOx, adsorption (c) and desorption (d) of COx. Adsorption condition GM 5 as displayed in Table 1 was used at adsorption temperatures 200 (red), 250 (green) and 300 °C (blue). | ||
| Adsorption conditions | C3H6-SCR | H2-assisted C3H6-SCR |
|---|---|---|
| NOx desorbed (μmol g−1) | NOx desorbed (μmol g−1) | |
| 200 °C | 70.7 | 91.4 |
| 250 °C | 53.5 | 69.3 |
| 300 °C | 35.4 | 50.3 |
From the desorption profile of CO and CO2 (Fig. 5d), one can see that a CO peak was observed at ca. 375 °C which is at lower temperature compared to the one in the absence of H2. Furthermore, the concentration of COx released was much higher than in the absence of H2 consistent with the higher conversion of C3H6 obtained with addition of H2. As seen from Fig. 5d and 4d, it can be noted that COx desorption both in the case of C3H6-SCR with and without H2 addition does not monotonically decrease with increasing adsorption temperature as was the case with NOx. Similarly, the desorption profile of H2 approximately coincided with the CO desorption as shown in Fig. 5f.
Identification and stability of adsorbed surface NOx species from in situ DRIFT
DRIFT spectroscopy was used to investigate types of adsorbed surface NOx species over Ag–Al2O3. Since the focus was to identify surface NOx species, only DRIFT spectra within the range of 1200–1800 cm−1 are presented. Here, adsorption steps were conducted at 200 °C to obtain a high quantity of NOx adsorbed species. Fig. 6 shows the evolution of IR spectra ensuing the increase of cell temperature during the desorption steps. Here, the adsorption steps were NO oxidation, H2-assisted NO oxidation and NO2–O2 adsorption (conditions 1–3 respectively in Table 2). As seen from the top panel of Fig. 6 at 200 °C, adsorption of NO–O2 resulted in the appearances of peaks at 1299 and a broad peak at 1564 cm−1. Further, a small peak or shoulder at 1248 and 1612 cm−1 were also seen. When H2 was added with NO and O2 (middle panel), several peaks were observed: a notable peak at 1299, a broad peak at 1576 and shoulders at 1612 and 1540 cm−1. It is important to mention that the shoulder peak at 1248 cm−1, clearly evident for the NO–O2 system, declined in the presence of H2. When the catalyst was exposed to NO2–O2 adsorption (bottom panel), IR spectra with vibration bands at 1248, 1299, shoulder at 1546, a broad peak at ca. 1567 and shoulder at 1612 cm−1 were observed.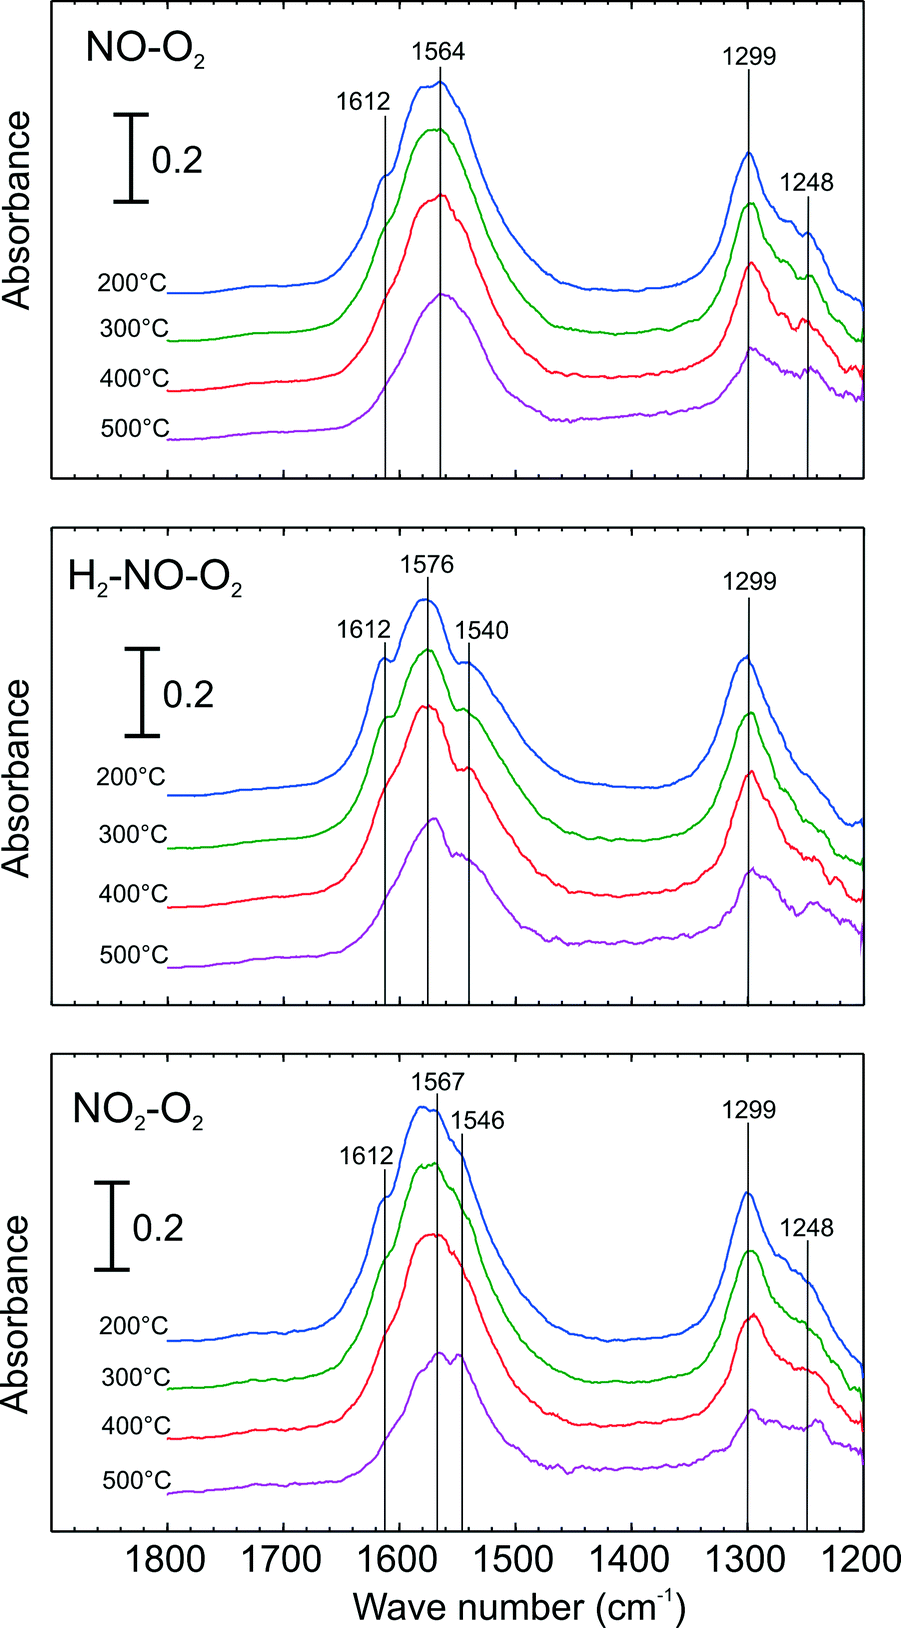 | ||
| Fig. 6 DRIFT Spectra of adsorbed species during temperature ramp and following adsorption with NO oxidation conditions (top), H2-assisted NO Oxidation conditions (centre) and NO2–O2 adsorption (bottom) over 2 wt.% Ag–Al2O3 at 200 °C. Adsorption conditions are displayed in Table 2. | ||
Possible structures of adsorbed nitrate species namely monodentate nitrate, bidentate nitrate and bridging nitrate are shown in Scheme 1 and peak assignments were mainly taken from our group's publications.24,28 The vibration band at 1248 can be assigned to bidentate nitrate as reported in literature.10,28 The peak at 1299 is also attributable to bidentate nitrate that was reported by literature at 1298, 1300 and 1304 cm−1.28,29 In the higher wavenumber regions (approximately between 1540–1615 cm−1), broad peaks at 1564 and 1576 cm−1 were observed resulting from the overlap of monodentate nitrate (1530–1546, 1558–1564 cm−1)24 and bidentate nitrate (1570–1590 cm−1).24 In addition, the shoulder peaks observed at 1612 cm−1 may be ascribed to the vibration of bridging nitrate that has been reported at 1614 cm−1.24,25,28
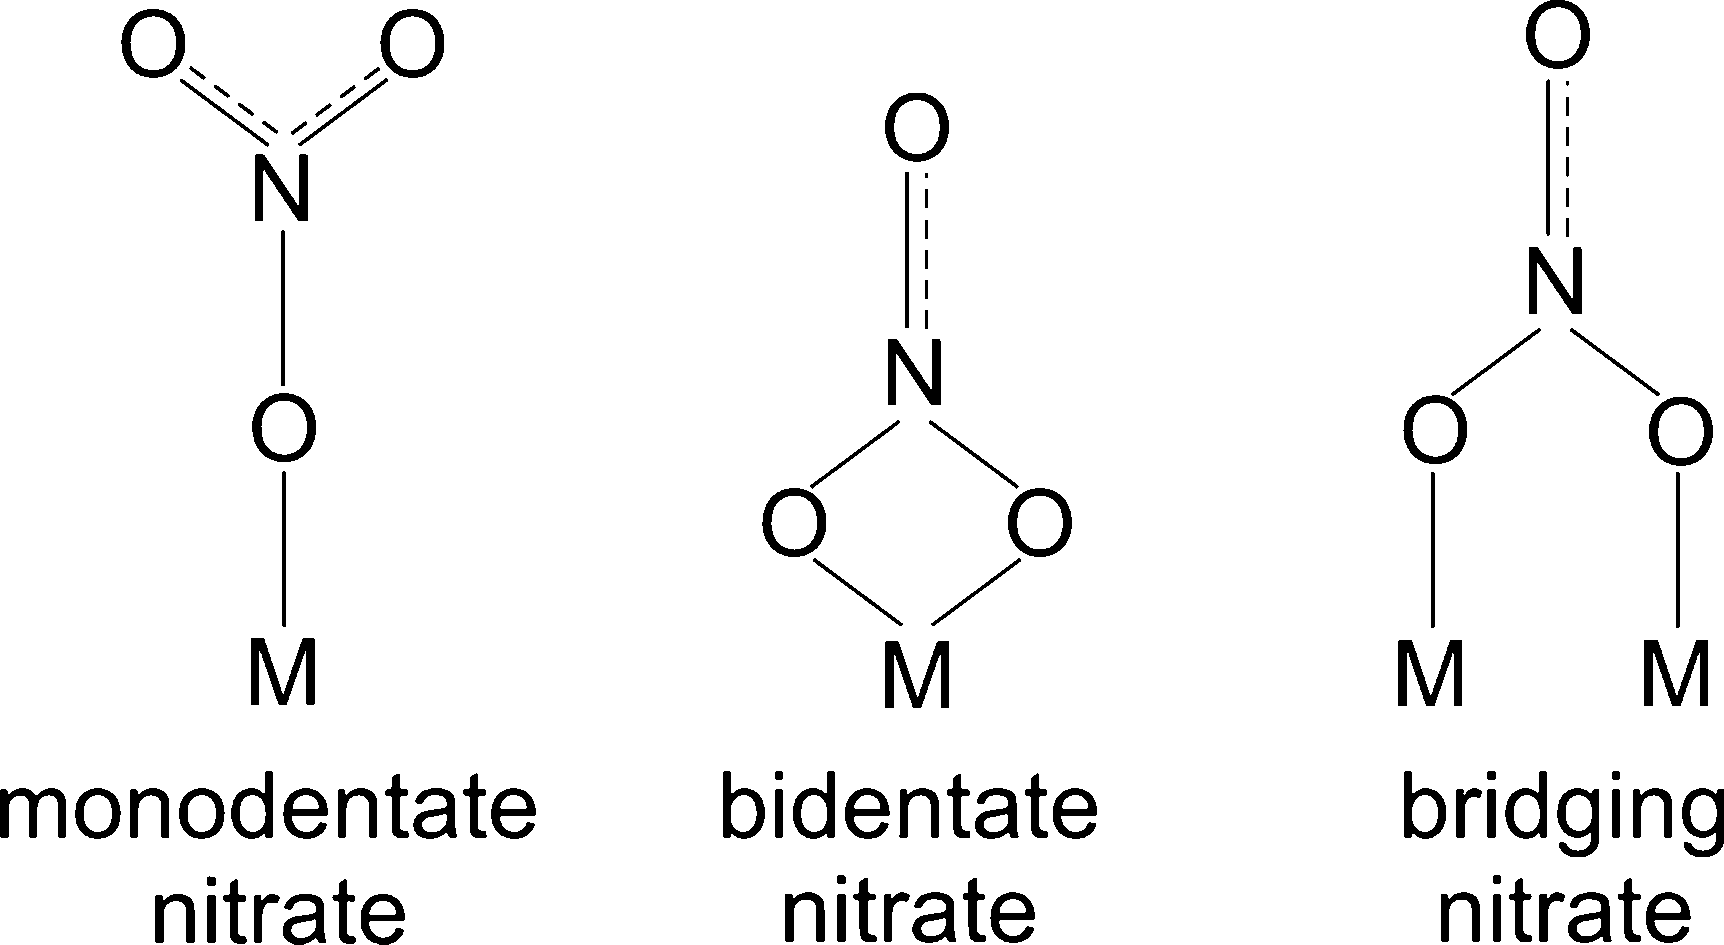 | ||
| Scheme 1 Possible structures of surface nitrate species (M = metal ion). Adapted from ref. 25 and references therein. | ||
In order to investigate the thermal stability of adsorbed NOx species, the cell temperature was increased to 500 °C in Ar flow. Fig. 6 presents a number of IR spectra at different temperatures during the temperature ramp. As seen here, the intensity of the bridging nitrates (1612 cm−1) readily disappeared in all cases. Further, it can be observed that the subsequent peak that decreased abruptly was that of the bidentate nitrate. The broad peak at 1564 cm−1 (top panel) and 1576 cm−1 (middle and bottom panel) tended to shift to the lower wavenumbers resulting from a decrease in bidentate nitrates, indicating peak separation of bidentate and monodentate nitrates. Comparing the intensity of the monodentate nitrate band (1540 or 1546 cm−1), it is interesting to note that its presence is more prevalent in the case of H2-assisted NO oxidation (middle panel) and NO2–O2 adsorption (bottom panel) compared to the case of NO–O2 adsorption (top panel). As seen during the temperature increase here, the intensity of monodentate nitrates are apparently the most stable among nitrate species.
Further in situ DRIFT experiments were carried out to investigate the stability of adsorbed NOx species following adsorption with C3H6-SCR and H2-assisted C3H6-SCR conditions. Fig. 7 presents the evolution of the DRIFT spectra during the temperature ramp following adsorption with C3H6-SCR and H2-assisted C3H6-SCR conditions. As seen from the top panel of Fig. 7 after adsorption from C3H6-SCR (indicated at 200 °C), vibration bands assignable to monodentate nitrate at 1546 cm−1 were observed. Strong vibration bands at 1299 and a broad peak at 1584 as well as shoulder at 1248 cm−1, ascribable to bidentate nitrate28 were apparent. A shoulder peak at 1612 cm−1, assignable to bridging nitrate, was also detected as in previous cases. In addition, small bands were observed at 1393 and 1378 cm−1 that may be ascribed to formate28 or acetate29 species and thus unrelated to the vibration of surface NOx species.
 | ||
| Fig. 7 DRIFT Spectra of adsorbed species during temperature ramp and following adsorption with C3H6-SCR (top) and H2-assisted C3H6-SCR conditions (bottom) over 2 wt.% Ag–Al2O3 at 200 °C. Adsorption conditions are displayed in Table 2. | ||
When H2 was added (lower panel of Fig. 7 at 200 °C), similar IR spectra were obtained as in the case of C3H6-SCR adsorption conditions. In comparison to the case of C3H6-SCR conditions, it can be seen that the shoulder peak at 1248 cm−1 had lower relative intensity. In contrast, the vibration band at 1546 cm−1 had a higher relative intensity. Similar to C3H6-SCR, broad peaks at 1299 and 1588 cm−1, assignable to bidentate nitrates, were outstanding. Also a peak at 1612 cm−1, assignable to bridging nitrate, was also observable. Finally, peaks at 1393 and 1379 cm−1 were observed with higher intensity for H2-assisted C3H6-SCR, attributed to acetate/formate species.
When the cell temperature was increased, as shown in Fig. 7, the bridging nitrates readily disappeared followed by a rapid decrease in bidentate nitrates at both 1588 and 1299 cm−1. At the highest temperature (500 °C), again the vibration band assigned to monodentate nitrate (1546 cm−1) was still observable showing its strong stability at high temperature. It is noticeable that the acetate/formate species also have rather strong stability with temperature (lower panel of Fig. 7), having disappeared finally at 500 °C.
Discussion
Formation of adsorbed NOx species from NO oxidation
From the results of TPD following NO–O2 exposure over Ag–Al2O3 and Al2O3, the NOx desorption profile over both catalysts was similar showing two desorption peaks; one at low temperature referred to as the LT peak (a major peak) and one at high temperature referred to as the HT peak (a minor peak). The increase in NO oxidation conversion with increase in temperature was accompanied by a decrease in the LT NOx desorption peak. These NOx desorption peaks, can then be considered to originate from the decomposition of two types of surface NOx species: a less thermally stable LT surface NOx species and more stable HT surface NOx species.From DRIFT results, the thermal stability of nitrate species were found to be in the order of bridging < bidentate < monodentate nitrate and therefore it is reasonable to regard the LT desorption peak to primarily originate from the decomposition of bidentate and bridging nitrate species, as in accordance with an earlier report.6 In the presence of H2 in the feed, it is apparent that the formation of the bidentate nitrate at 1248 cm−1 was less pronounced. This result is in agreement with Shibata et al.10 who reported minimal formation of a similar peak for H2-assisted C3H8-SCR. We therefore suggest that the vibration of bidentate nitrate at 1248 cm−1 can also be associated with the LT desorption peak.
Klacar et al.30 performed Density Functional Theory (DFT) calculations of NOx adsorption over oxidized silver. They found that adsorption of NO and NO2 over oxidized silver yielded formation of nitrate species, especially on well-dispersed silver clusters (size of clusters 4–8 atoms) indicating that surface NOx species borrow O atoms from the Ag to form mainly bridging nitrates. Additionally, similar TPD profiles following NO–O2 adsorption were observed for Ag–Al2O3 and Al2O3 and hence a part of these surface NOx species were also on Al2O3. A similar phenomenon of surface nitrate formation by loaning O atoms over Al2O3 can also be speculated, as has been shown by Zhang et al.25 As seen from Fig. 1b and d, when the temperature was increased, the LT peak consisted of more NO than NO2 and it was not accompanied by O2 desorption. This observed ratio of desorbed atomic nitrogen to oxygen indicates that the decomposition of nitrate species giving the LT peak should leave borrowed O atoms on Ag and Al2O3.
The HT desorption peak has often been proposed to result from the decomposition of monodentate nitrates that gave desorption of NO, NO2 and O2.6,23,25 Here, only a small HT desorption peak was observed that gave mainly NO without O2 desorption after NO–O2 exposure. In this case the amount of monodentate nitrate species was likely too small in our monolithic sample to yield detectable O2 desorption or they also partially left borrowed O atoms on the catalyst surface.
From TPD results for gas mixture of NO–O2–H2 over Ag–Al2O3 (Fig. 2b), it can be noted that along with higher activity for NO oxidation in the presence of H2, the LT peak observed in NO–O2 TPD (Fig. 1b) was significantly suppressed and shifted towards the HT peak (Fig. 2b). However, in the case of Al2O3 relatively little suppression in the LT peak was observed (Fig. 2d) along with no promotion of NO oxidation.
Due to the fact that the LT peak decomposed thermally at higher adsorption temperatures and was suppressed significantly in the presence of H2 which both gave higher NO oxidation conversion, it is therefore reasonable to consider the LT peak to result from the decomposition of surface NOx species on the active sites. This also tends to indicate that Ag is needed to activate H2 to suppress formation of surface NOx species that produce the LT peak. In addition, the active sites in the case of the Ag–Al2O3 catalyst may involve Ag in close vicinity with Al2O3 as assumed by others.14,31 By associating TPD and DRIFT, we suggest that H2 eliminated surface nitrate species on active sites (LT peak) which is predominantly bidentate nitrate (1248 cm−1). Our result coincides with that of Chansai et al.14 who used short time exposure (less than 120 s) in DRIFTS-MS study and suggested that the peak at 1255 cm−1 assigned as monodentate nitrate in their work was the surface nitrate species located on the active part of the catalyst.
Further, the difference between the integrated LT NOx (NO + NO2) peaks from Fig. 1b (over Ag–Al2O3) and d (over Al2O3) can give an indication of the coverage of surface NOx species on active Ag sites. Fig. 8a displays these results from TPD after NO–O2 exposure between 200 and 300 °C over both catalysts. As shown here, the coverage of surface NOx species on Ag sites decreased with higher temperature. By comparing with the amount of Ag available in the catalyst, the estimated amount of LT NOx on active sites (difference between Ag–Al2O3 and Al2O3) is much lower than the total amount of Ag (148 μmol g−1). At 200 and 250 °C, this LT NOx corresponded to 18% and 14% respectively of the total Ag, indicating that the dispersion of active sites may be comparable to these values.
 | ||
| Fig. 8 The amount of surface NOx species from integration of LT desorption peak after NO–O2 adsorption over Ag–Al2O3 and Al2O3 as shown earlier in Fig. 1 (upper panel, a) and reaction rate for NO oxidation and H2-assisted NO oxidation over Ag–Al2O3 (lower panel, b). | ||
At 300 °C, it could be observed that the amount of surface NOx species on Ag–Al2O3 was more or less equal to Al2O3, thereby indicating that Ag sites were largely free from LT surface NOx species by 300 °C. The differences in surface area for the Ag–Al2O3 (188 m2 g−1) and Al2O3 (233 m2 g−1) samples suggest that differences in their LT NOx adsorption cannot exactly quantify the NOx on Ag sites. However even disregarding NOx adsorption on Al2O3, it is clear that at least 80% of Ag sites were freed from LT surface NOx species by 300 °C compared to 200 °C. Fig. 8b compares the calculated reaction rates for NO oxidation (Fig. 1a) and H2-assisted NO oxidation (Fig. 2a). As seen here, the rate of NO2 formation was always higher in the presence of H2 at all temperatures, even at 300 °C where Ag was largely free from the presumably inhibiting LT NOx species. If removal of inhibiting nitrate species was the only promoting role of H2 for NO oxidation, one would expect the NO oxidation reaction rates with and without H2 feed to be nearly equal at 300 °C. If all inhibiting surface NOx species were thermally removed at 300 °C, comparison of reaction rates at this temperature indicates that as much as 60% of total rate with H2 feed could not be due to removal of inhibiting surface NOx. Therefore, this points out that H2 should have additional promoting roles.
As shown in Fig. 2b, the shift of the NOx desorption peak upon introduction of H2 over Ag–Al2O3 was also accompanied by higher total quantities of NOx adsorbed and desorbed (Table 3) which was not observed for the case of Al2O3. H2 induced NOx adsorption over Ag–Al2O3 can then be related to the increase of the HT surface NOx species. Surface decomposition of the HT surface NOx species resulted in the release of NO2 and O2 and can be explained by eqn (1) as has been addressed by Guo et al.7
| 2NO3−(ads) ↔ 2NO2(g) + 0.5O2(g) + O2−(s) | (1) |
The mechanistic role of H2 to promote NOx adsorption will be discussed further after following section.
TPD studies following NO2–O2 adsorption
The quantity and types of surface NOx species formed is also related to the NOx species composition of the gas phase and therefore TPD studies following NO2–O2 adsorption were conducted. As seen from the DRIFT results in the lower panel of Fig. 6, formation of various surface nitrate species were detected upon exposure to NO2 and O2. From Fig. 3a and c, formation of NO was observable during the NO2–O2 adsorption over Ag–Al2O3 and Al2O3. By integration of the curves in Fig. 3a and c, the average ratio of total NO2 uptake to total NO yield was 2.62 for Ag–Al2O3 and 3 for Al2O3. Therefore, one can deduce that self-oxidation of NO2 was likely to dominate during the adsorption step according to the following overall reaction:| 2NO2(g) → NO3(ads) + NO(g) | (2) |
However, surface oxides may also be involved by donating an O atom/ion similar to that discussed earlier in the first section of discussion part by the following overall reaction:7
| 3NO2(g) + O2−(s) → 2NO3−(ads) + NO(g) | (3) |
As seen from reactions (2) and (3), the ratio of NO2 adsorbed and NO released is 2 in reactions (2) and (3) in reaction (3). The ratios from the integration results fit well and suggest that both reactions are likely occurring during NO2–O2 adsorption, with the reaction involving surface oxides as in reaction (3) being most dominant for Al2O3.
During the temperature ramp (Fig. 3b and d), it is interesting to note that TPD after NO2–O2 adsorption over both Ag–Al2O3 and Al2O3 gave broad peaks of NO2 at temperatures exceeding 430 °C, suggesting that NO2 favors formation of HT surface NOx species. As seen from Fig. 3b and d, decomposition of the HT surface NOx species primarily produced NO2 and O2 as described in eqn (1) over a range of temperatures from 350 to 545 °C. The release of NO at more elevated temperatures above 500 °C is probably related to a more extensive decomposition of the surface nitrates or even subsequent decomposition of the released NO2 that is favored by thermodynamics. Both of these processes would also release gas phase O2.
The role of H2 to modify surface NOx species
TPD results for NO–O2–H2 (Fig. 2b) and NO2–O2 (Fig. 3b) were similar, giving a substantial release of NO2 and O2 at a similar temperature range of the HT peaks. During adsorption of NO–O2–H2 (Fig. 2a), production of NO2 was always observable. From comparison with Fig. 1b and the low production of NO2 during NO–O2 adsorption, it is apparent that NO2 production is linked to formation of the HT surface NOx species. Furthermore, additional experiments for NO2–O2 TPD on Al2O3 (Fig. 3d) gave a similar TPD profile for the same adsorption conditions with Ag–Al2O3 (Fig. 3b), suggesting that most of the HT surface NOx species formed are located on the Al2O3 support. Therefore, it was evident that the HT surface NOx species result from NO2 adsorption and primarily located on the Al2O3 support. It is also then likely that the HT surface NOx species formed on the Al2O3 support are spectator surface species. As has been addressed earlier, these HT surface NOx species appear to be predominantly in the form of monodentate nitrates by associating the DRIFT and TPD results. These findings agree well with those of Tamm et al.24 who suggested one role of H2 was to facilitate formation of monodentate nitrate that is not poisonous and likely to be located on Al2O3.A mechanism of NOx storage by a spillover mechanism has been proposed.8,11,24 An alternative mechanism of NOx storage by NO2 readsorption on the Al2O3 support has also been proposed by Johnson II et al.31 Based on the results of these TPD studies, it is indicative that the NO2 readsorption mechanism is most probable for NOx storage on Al2O3, since formation of the HT surface NOx species was related to the presence of gas phase NO2. However, this does not negate the possibility that a spillover mechanism also contributes to NOx storage on Ag–Al2O3.
As described earlier for NO–O2–H2 TPD over Al2O3 (Fig. 2d), it is likely that the characteristics of the adsorbed surface NOx species are not the same over Ag–Al2O3 and Al2O3. Consequently, desorption of O2 which was observed over Ag–Al2O3 (Fig. 2b) was not observed over Al2O3 (Fig. 2d) and NOx storage during adsorption of NO–O2–H2 over Al2O3 does not include formation of gas phase NO2.
Mechanistic insights regarding C3H6-SCR and H2-assisted C3H6-SCR
TPD studies with C3H6-SCR and H2-assisted C3H6-SCR adsorption conditions were conducted over Ag–Al2O3 to study how surface NOx species affect the NOx reduction performance. Reaction of surface NOx species with partially oxidized C3H6 is considered as an important step to obtain high activity for C3H6-SCR over a Ag–Al2O3 catalyst.7,32,33It is interesting to note that by comparing the NOx desorption profile in C3H6-SCR (Fig. 4b) and NO oxidation (Fig. 1b), both of them have a similar profile with LT and HT NOx desorption peaks. However, for C3H6-SCR (Fig. 5b) the NO2 desorption is very low probably due to the presence of adsorbed HC species that reduce the surface NOx species to NO during their decomposition and desorption. This presence of both LT and HT surface NOx species in approximately the same temperature ranges indicates that NO oxidation and C3H6-SCR should share some mechanistic features.
During the adsorption with C3H6-SCR conditions (Fig. 4a), NOx conversion at 300 °C were clearly higher than 200 and 250 °C. In addition, COx desorption was observed during the temperature ramp (Fig. 4d) due to decomposition and oxidation of adsorbed and oxidized HC species. There tended to be more of these species at 300 °C along with greater NOx reduction activity, suggesting that they are important intermediate species. Removal of the LT inhibiting surface NOx species at higher temperature (Fig. 4b) likely contributed to more formation of these intermediate species for the NOx reduction process.7
During the adsorption step for H2-assisted C3H6-SCR (Fig. 5a), higher NOx reduction activity was observed, reaching up to ~23% at 300 °C. The improvement in NOx reduction activity was also accompanied by a significant decrease in the LT NOx desorption peak as can be seen by comparing Fig. 5b and 4b. At the same time, the HT NOx desorption peak increased remarkably. Therefore, again removal of the inhibiting LT surface NOx species, in this case aided by reaction with H2, coincided with the improved NOx reduction activity. Unlike in the case of NO–O2–H2 (Fig. 2b) and NO2–O2 (Fig. 3b) TPD, the increase of the HT peak for H2-assisted C3H6-SCR (Fig. 5b) gave mostly NO desorption. Additionally, the O2 desorption, however, was observed during desorption in all cases of TPD for NO–O2–H2, NO2–O2 and H2-assisted C3H6-SCR. The larger production of NO for H2-assisted C3H6-SCR, probably resulted from the adsorbed HC which was oxidized by the adsorbed NOx species during their decomposition and desorption. From Fig. 5b, it can also be seen that the HT NOx desorption peak had a broad shoulder towards lower temperatures. This shoulder probably results from the presence of adsorbed HC species acting as reductants and destabilizing the nitrate species to cause some lower temperature NOx decomposition.
As seen from comparing Fig. 4d and 5d, the higher concentration of desorbed CO and CO2 infers that H2 had a promotional effect on low temperature C3H6 activation. Hydrocarbon (HC) activation to form oxidized HC species itself is often suggested as a key step in HC-SCR over Ag–Al2O3.10,13,16 Greater formation of surface HC and oxidized HC in the presence of H2 can be linked to the removal of inhibiting surface NOx species as suggested by the suppression of the LT surface NOx species also with H2. There was also a broadening of the COx desorption peaks and a shift to lower desorption temperature with the addition of H2 (comparing Fig. 5d and 4d) which suggests that a greater variety and possibly more reactive adsorbed hydrocarbon species with lower thermal stabilities were formed. This finding again points to the fact that H2 may have other effects to promote the NOx reduction activity similar to the case for NO oxidation. The reaction rates for NOx conversion were 6.1 × 10⁻⁵ and 22.5 × 10⁻⁵ mol kg−1 s−1 at 300 °C for C3H6-SCR and H2-assisted C3H6-SCR, respectively. It seems apparent from Fig. 4b that a large part of the inhibiting LT NOx species was removed by 300 °C. Thus, again like that for NO oxidation as much as 73% of the C3H6-SCR activity from co-feeding H2 could not be related to removal of inhibiting LT surface NOx species.
The amount of COx desorbed did not monotonically decrease with higher temperature (Fig. 4d and 5d) as was always the case for adsorbed NOx species. Greater accumulation of adsorbed species producing COx at higher temperature indicates that the reactions activating the HC to form oxygenated HC on the surface have relatively high activation energies. In other words, the activation energy to partially oxidize HC to form oxygenated HC surface species is higher than the activation energies of subsequent reactions between surface NOx species with the oxygenated HC species that leads to formation of N2. Greater accumulation of oxygenated HC surface species may also be due to less inhibiting nitrates covering the active sites where oxygenated HC are formed.
As seen from DRIFT results in Fig. 7, nitrate peaks assignable to monodentate, bidentate and bridging nitrates were detected for both C3H6-SCR and H2-assisted C3H6 similar to the case with NOx adsorption (Fig. 6). By increasing temperature, the stability of monodentate nitrate (1546 cm−1) was clearly observed. Comparing the decreasing intensity of bidentate nitrate peaks for C3H6-SCR and H2-assisted C3H6-SCR, it was found that the rate of decrease with temperature is somewhat slower for the lower panel of Fig. 7 (H2-assisted C3H6-SCR), indicating that the surface NOx species here were more stable which is in agreement with the TPD results. Further, it was also found that the relative intensity of formate/acetate bands was higher for the H2-assisted case which agrees with the TPD observations (Fig. 4d and 5d) that larger quantities of adsorbed HC species are present under the H2-assisted reaction conditions.
In this series of studies, it seems that the promoting role of H2 appears to be only partially due to the removal of inhibiting surface NOx species. As a result the findings here support the possibility of other H2 promoting roles as already described in the literature.5,10,12,13,16,22,23 It has however been observed here that the formation of surface nitrate species in the absence of H2 depends on the donation of oxygen from surface oxides. As a result the removal or prevented formation of these nitrate species caused by H2 may be linked to some partial reduction of Ag species and thus formation of sites with enhanced activity. However an investigation of the merits of all other possible roles for H2 to promote NO oxidation or NOx reduction is beyond the scope of this study and the methods used here.
Conclusions
A series of TPD experiments have been conducted to investigate formation and stability of surface NOx species related to the promotional effect of H2 for NO oxidation and C3H6-SCR. Formation of two general groups of surface NOx species were found to be present: a less thermally stable group of so called “LT surface NOx species” and a more thermally stable group of “HT surface NOx species”. The following conclusions can be drawn from this study.• The LT NOx desorption peak observed in this study could be attributed to the decomposition of surface NOx species formed on the active sites. It was apparent that Ag sites were largely free from these surface NOx species at and above 300 °C. Elimination or decrease in quantities of these LT surface NOx species either thermally or by reaction with H2 correlated with higher NO oxidation and NOx reduction conversion. However, as much as 60% and 73% of the activity for NO oxidation and NOx reduction respectively by co-feeding H2 could not be related to removal of LT NOx surface species.
• The HT NOx desorption peak primarily corresponded to the decomposition of surface NOx species on the Al2O3 support. Since the increase of surface NOx species formed on the Al2O3 did not hinder NO oxidation and NOx reduction, the HT surface NOx species were mainly comprised of spectator surface species in the form of monodentate nitrates.
• H2 facilitated formation of surface NOx species on the Al2O3 support. It was indicative that the mechanism of NOx storage on the Al2O3 support was via NO2 readsorption, but spillover may also play a role.
• H2 facilitated formation of oxygenated HC on the surface that may be aided by removal of inhibiting surface NOx species on active sites.
• Formation of the LT surface nitrate species depended on the donation of oxygen from surface oxides. As a result the removal or prevented formation of these nitrate species caused by H2 may entail some partial reduction of Ag species and be linked to enhanced C3H6-SCR and NO oxidation activity.
From this study, it was seen that the quantities of surface NOx species removed from the active sites were small compared to the amount simultaneously stored as spectator species mainly on the alumina support. Therefore, the dual role of H2 to both eliminate inhibiting surface NOx species from active sites and promote NOx storage was elucidated.
Acknowledgements
This work has been financially supported by the Swedish Research Council with grant number 621-2011-3926 and partly within the Competence Centre for Catalysis, which is hosted by Chalmers University of Technology and financially supported by the Swedish Energy Agency and the member companies AB Volvo, ECAPS AB, Haldor Topsøe A/S, Scania CV AB, Volvo Car Corporation AB and Wärtsilä Finland Oy. MMA acknowledged Fredrik Gunnarsson for collaboration in preparing Ag–Al2O3 catalyst.Notes and references
- T. Miyadera, Appl. Catal., B, 1993, 2–3, 199–205 CrossRef.
- K.-I. Shimizu and A. Satsuma, Phys. Chem. Chem. Phys., 2006, 8, 2677–2695 RSC.
- E. Seker, J. Cavataio, E. Gulari, P. Lorpongpaiboon and S. Osuwan, Appl. Catal., A, 1999, 183, 121–134 CrossRef CAS.
- M. Yamaguchi, I. Goto, Z. M. Wang and M. Kumagai, Stud. Surf. Sci. Catal., 1999, 121, 371–374 CrossRef CAS.
- S. Satokawa, J. Shibata, K.-I. Shimizu, A. Satsuma and T. Hattori, Appl. Catal., B, 2003, 42, 179–186 CrossRef CAS.
- S. Kameoka, Y. Ukisu and T. Miyadera, Phys. Chem. Chem. Phys., 2000, 2, 367–372 RSC.
- Y. Guo, M. Sakurai and H. Kameyama, Appl. Catal., B, 2008, 79, 382–393 CrossRef CAS.
- N. Sadokhina, D. Doronkin, P. Pributkov, V. Bukhtiyarov, R. Kvon and A. Stakheev, Top. Catal., 2011, 54, 1190–1196 CrossRef CAS.
- X. She and M. Flytzani-Stephanopoulos, J. Catal., 2006, 237, 79–93 CrossRef CAS.
- J. Shibata, K.-I. Shimizu, S. Satokawa, A. Satsuma and T. Hattori, Phys. Chem. Chem. Phys., 2003, 5, 2154–2160 RSC.
- R. Brosius, K. Arve, M. H. Groothaert and J. A. Martens, J. Catal., 2005, 231, 344–353 CrossRef CAS.
- J. P. Breen, R. Burch, C. Hardacre, C. J. Hill and C. Rioche, J. Catal., 2007, 246, 1–9 CrossRef CAS.
- Y. Guo, J. Chen and H. Kameyama, Appl. Catal., A, 2011, 397, 163–170 CrossRef CAS.
- S. Chansai, R. Burch and C. Hardacre, J. Catal., 2012, 295, 223–231 CrossRef CAS.
- N. A. Sadokhina, D. E. Doronkin, G. N. Baeva, S. Dahl and A. Y. Stakheev, Top. Catal., 2013, 56, 737–744 CrossRef CAS.
- J. P. Breen and R. Burch, Top. Catal., 2006, 39, 53–58 CrossRef CAS.
- P. Sazama, L. Capek, H. Drobna, Z. Sobalik, J. Dedecek, K. Arve and B. Wichterlova, J. Catal., 2005, 232, 302–317 CrossRef CAS.
- S. T. Korhonen, A. M. Beale, M. A. Newton and B. M. Weckhuysen, J. Phys. Chem. C, 2011, 115, 885–896 CAS.
- U. Bentrup, M. Richter and R. Fricke, Appl. Catal., B, 2005, 55, 213–220 CrossRef CAS.
- R. Burch, J. P. Breen, C. J. Hill, B. Krutzsch, B. Konrad, E. Jobson, L. Cider, K. Eränen, F. Klingstedt and L. E. Lindfors, Top. Catal., 2004, 30–31, 19–25 CrossRef.
- M. M. Azis, H. Härelind and D. Creaser, Chem. Eng. J., 2013, 221, 382–397 CrossRef CAS.
- K.-I. Shimizu, K. Sawabe and A. Satsuma, Catal. Sci. Technol., 2011, 1, 331–341 CAS.
- P. S. Kim, M. K. Kim, B. K. Cho, I. S. Nam and S. H. Oh, J. Catal., 2013, 301, 65–76 CrossRef CAS.
- S. Tamm, N. Vallim, M. Skoglundh and L. Olsson, J. Catal., 2013, 307, 153–161 CrossRef CAS.
- X. Zhang, H. He, H. Gao and Y. Yu, Spectrochim. Acta, Part A, 2008, 71, 1446–1451 CrossRef PubMed.
- F. C. Meunier, J. P. Breen, V. Zuzaniuk, M. Olsson and J. R. H. Ross, J. Catal., 1999, 187, 493–505 CrossRef CAS.
- H. Kannisto, H. H. Ingelsten and M. Skoglundh, J. Mol. Catal. A: Chem., 2009, 302, 86–96 CrossRef CAS.
- H. Härelind, F. Gunnarsson, S. M. S. Vaghefi, M. Skoglundh and P. A. Carlsson, ACS Catal., 2012, 2, 1615–1623 CrossRef.
- X. L. Zhang, Y. B. Yu and H. He, Appl. Catal., B, 2007, 76, 241–247 CrossRef CAS.
- S. Klacar, A. Hellman, I. Panas and H. Grönbeck, J. Phys. Chem. C, 2010, 114, 12610–12617 CAS.
- W. L. Johnson II, G. B. Fisher and T. J. Toops, Catal. Today, 2012, 184, 166–177 CrossRef.
- T. Furusawa, L. Lefferts, K. Seshan and K. Aika, Appl. Catal., B, 2003, 42, 25–34 CrossRef CAS.
- Y. Yu, X. Zhang and H. He, Appl. Catal., B, 2007, 75, 298–302 CrossRef CAS.
| This journal is © The Royal Society of Chemistry 2015 |