Effects of temperature pretreatment on propane cracking over H-SSZ-13 zeolites
J. H.
Yun
and
R. F.
Lobo
*
Center for Catalytic Science and Technology, Department of Chemical & Biomolecular Engineering, University of Delaware, Newark, DE 19716, USA. E-mail: lobo@udel.edu
First published on 13th August 2014
Abstract
The effect of thermal treatment of SSZ-13 on catalytic activity has been investigated by using monomolecular propane conversion as a probe reaction. Two samples with Si/Al ratios of 12 and 6 were prepared and characterized by solid-state nuclear magnetic resonance (NMR), X-ray powder diffraction (XRD), N2 adsorption, and temperature-programmed desorption (TPD). Samples were pretreated at different temperatures: mild activation at 773 K (treatment 1) and high-temperature activation at 823, 873, 973, and 1073 K (treatment 2). The catalysts showed similar catalytic propane reaction rates within the experimental error. On the other hand, after treatment 1 the catalysts showed higher cracking selectivity than dehydrogenation selectivity by a factor of 2, while the selectivity towards dehydrogenation was enhanced for the catalysts treated at high temperatures (cracking-to-dehydrogenation ratio of ~1). The change in selectivity suggests that the generation of different active sites—other than Brønsted acid sites (BAS), typically considered the active sites for hydrocarbon conversion. The SSZ-13-6 treated at 823 and 873 K showed different selectivity, without a notable change in reactivity and activation energies compared to the acid catalyst after treatment 1. After high-temperature treatments, SSZ-13-12 showed gradually decreasing activation energies and increasing selectivity toward dehydrogenation with increasing pretreatment temperature (from 823 to 1073 K). These results lead us to the hypothesis that different types of new active sites are generated in SSZ-13-12 and SSZ-13-6 samples.
Introduction
Understanding the effects of post-synthesis zeolite treatments, including high temperature, is important for improving and modifying the catalytic properties1–11 of zeolites in general. High-temperature treatment of zeolites, normally above 873 K, leads to the thermal decomposition of Brønsted acid sites (BAS), Si–O(H)–Al, by a process called dehydroxylation.12,13 The IR absorption band of the OH groups of the BAS is detected in the range of 3600–3660 cm−1 in the IR spectra of dehydrated samples,3,14 and the concentration of the BAS can be estimated based on the relative intensity of this signal. It has been shown that samples treated at high temperatures have new chemical properties, including the ability to extract electrons from adsorbed species. For example, xanthene, iminostilbene, fluorene, 2,5-dimethylhexa-2,4-diene, biphenyl, and naphthalene15–18 form radical cations upon adsorption on pretreated zeolites. It is also important to understand the properties of dehydroxylated zeolites because high temperatures are employed in important industrial processes, such as in the regenerators of a fluidized catalytic cracking (FCC) unit or in the catalytic converters of automobiles.Under a dry inert atmosphere, there are two mechanisms by which BAS dehydroxylation can proceed. In the heterolytic mechanism, dehydroxylation proceeds through the dehydration of BAS, leading to the formation of water and Lewis acid sites (LAS), as illustrated in Scheme 1.12,13,19 In the homolytic mechanism (Scheme 2), the hydrogen atoms of the acid sites are lost as H˙, that is hydrogen atoms, leading to the formation of an oxidized species on the zeolite surface. Nash et al. observed the production of hydrogen during dehydroxylation processes19 corroborating that dehydroxylation could proceed through a homolytic mechanism in high-silica zeolites. The electron-deficient sites formed by dehydrogenation of BAS (Scheme 2) can have redox properties that may impact the catalytic properties of the sample.19 More detailed investigation of the sites generated after dehydroxylation has been difficult because these sites are EPR-silent16 and do not appear to have any well-defined UV/Vis or IR signature. We have shown that the sites that are generated after dehydroxylation have the ability to extract a single electron from a neutral organic molecule, such as naphthalene, forming radical cations.4 In addition, long-lived electron–hole pairs are formed by migration of electrons from the zeolite framework to the radical cations. This observation suggests that the formation of new sites could lead to catalytic activation of adsorbed species by a redox mechanism instead of the typical protolytic mechanism.
The activation of small alkanes has been used frequently as a model reaction because the cleavage of the C–C and C–H bonds in the hydrocarbon is a problem of both scientific and technological interest. Alkane activation on acid sites in zeolites can proceed through bimolecular and monomolecular pathways. The bimolecular pathway involves hydride transfer between an alkane and an adsorbed carbenium ion when the concentration of surface species is high. In contrast, the monomolecular pathway (protolytic mechanism), involving the formation of alkanium-like ions,20–28 is kinetically dominant at high temperatures (~773 K), low alkane partial pressure, and low conversion (<2%). The propane reaction rates and selectivity over H-ZSM-5 before and after dehydroxylation were investigated,3 showing comparable catalytic rates for propane activation but different selectivity and different activation energies.3 In the monomolecular propane reaction, the reaction proceeds only through two channels, i.e., cracking and dehydrogenation. While acid catalysts have higher propane cracking selectivity than dehydrogenation selectivity by a factor of about three, the catalysts show similar cracking and dehydrogenation rates after dehydroxylation.3 Reduced apparent activation energies for cracking (from 184 kJ mol−1 to 144 kJ mol−1) and dehydrogenation (from 187 kJ mol−1 to 127 kJ mol−1) are also observed.3 These changes indicate that the new sites catalyze the hydrocarbon conversion through a different reaction mechanism; a redox mechanism is a potential path for the reaction. Deuterium-labeled propane (C3D8) was used to evaluate the redox mechanism by measuring the relative reaction rates of cracking and dehydrogenation (rC3H8/rC3D8) before and after dehydroxylation.3 The relative reaction rate of cracking is not affected by the deuterium label, while that of dehydrogenation is increased from 1.13 to 3.5.3 This change in the relative reaction rate of dehydrogenation is consistent with radical cation chemistry.23 The complexity of the ZSM-5 zeolite catalysts (12 distinctive tetrahedral sites) precludes complete understanding of the structure of the active sites. The presence of 12 distinctive T-sites results in different turnover rates for the monomolecular propane conversion.29
In this report, SSZ-13 (CHA) was used to activate propane because it has only one topologically distinct tetrahedron site and only four non-equivalent oxygen atoms30,31 in the structure. SSZ-13 is a promising solid catalyst for the methanol-to-olefin (MTO) process due to its unique shape selectivity.32–37 The adsorption capacity of SSZ-13 at ambient temperature and pressure also makes it as a promising adsorbent for CO2 capture.38 Copper-exchanged SSZ-13 is a promising catalyst for selective catalytic reduction of NOx with ammonia. Cu-SSZ-13 has high activity for NH3-SCR and shows high nitrogen formation selectivity.39,40
We report the catalytic reaction rates and selectivity over SSZ-13 with different Si/Al ratios (6 and 12) after thermal treatments for the monomolecular propane reaction. The samples treated at different temperatures were characterized by XRD, N2 adsorption isotherm, TPD, and 27Al and 29Si solid-state NMR. The product distribution and kinetic analysis indicate that different types of active sites are generated by thermal treatments. The catalytic properties of the newly generated sites are also different for the samples with different Si/Al ratios. In the case of SSZ-13-6, the selectivity has changed dramatically with just 50 K of change in the treatment temperature from 773 K to 823 K, which is the “normal” calcination temperature for acid zeolites prior to reaction tests. The activation energy does not change despite this drastic selectivity change. In the case of SSZ-13-12, the selectivity and activation energy changed gradually with the treatment temperature, indicating the generation of different active sites after thermal treatments. Further work is still necessary to establish the molecular structure of these new sites.
Experimental section
Synthesis of SSZ-13
SSZ-13 samples were synthesized using N,N,N-trimethyl-1-adamantanammonium ion (TMAda+) as the structure-directing agent (SDA). Two different methods were used to prepare the SSZ-13 samples with different Si/Al ratios. SSZ-13 with a low Si/Al ratio (SSZ-13-6, Si/Al ~6) was synthesized using the procedure reported by Zones.38,41 In this procedure, 20 g of sodium silicate (Na2O3Si, Sigma-Aldrich) and 0.64 g of sodium hydroxide (NaOH, Fisher Scientific) were mixed with 48 g of deionized water at room temperature for 15 min. Next, 2 g of NH4-Y zeolite (Zeolyst CBV-100) was added to the solution and stirred for 30 min. This was followed by the addition of 8.4 g of TMAdaOH (SACHEM Inc., 25% aqueous solution) to the solution and mixing for another 30 min in a covered container. The hydrothermal conversion of the synthesis solutions was carried out in Teflon-lined Parr autoclaves at a temperature of 413 K under rotation for 6 days. The zeolite samples were separated from the solution using vacuum filtration, washed using deionized water, and dried at room temperature. The as-synthesized zeolites were calcined in air at 823 K with a heating rate of 2 K min−1 for 8 h to remove the occluded TMAda+.The synthesis method of SSZ-13 with a high Si/Al ratio (SSZ-13-12, Si/Al = ~12) was also based on the reports written by Zones42 and by Eilertsen et al.43 13 g of tetraethyl orthosilicate (TEOS, Sigma-Aldrich) and 26.4 g of TMAdaOH were mixed with 2.7 g of water at room temperature. The solution was stirred for 2 h and then 0.7 g of aluminum ethoxide (Al(C2H5O)3, Sigma-Aldrich) was added and mixed for additional 1 h. The resulting solution was then hydrothermally treated in Teflon-lined Parr autoclaves at 413 K under static conditions for 6 days. Sample filtration, washing, drying, and calcination were identical to those of the SSZ-13-6 sample.
Analytical
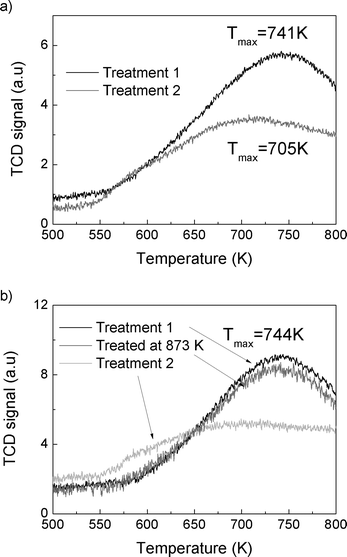
X-ray powder diffraction (XRD) patterns were collected with a Philips X'Pert X-ray diffractometer using CuKα radiation. EDX spectral analysis integrated into a JEOL JSM-7400F scanning electron microscope (SEM) was used to determine the composition of the samples. The micropore volumes of the samples were determined using N2 adsorption isotherms measured by using a Micromeritics ASAP 2020 instrument. The samples were degassed at 623 K for 1 day using an in-house-built silica tube. The adsorption isotherms were obtained for the acid form of the samples and the dehydroxylated samples.Ammonia temperature-programmed desorption (TPD) was measured by using a catalyst characterization system (Altamira Instruments, AMI-200iρ). About 30 mg of the sample was loaded in a quartz U-tube reactor and the first TPD experiment was carried out by heating the sample to 773 K at a ramping rate of 10 K min−1. The acid form of the sample was obtained after this treatment. The ammonium form of the sample was restored by exposing to NH3 flow for 30 min at 373 K, and then the TCD signal was recorded up to 800 K. For the thermally treated catalyst, the sample was first heated to 1073 K (and 873 K for SSZ-13-6) at a ramp rate of 10 K min−1, cooled down, exposed to NH3 flow for 30 min at 373 K, and then the TCD signal was recorded up to 800 K.
27Al and 29Si NMR experiments were recorded using a Bruker AVIII 500 solid-state NMR spectrometer operating at a Larmor frequency of 500.138 MHz for 1H and 99.362 MHz for 29Si. A 4 mm HX MAS probe was used for all measurements. All spectra were collected at a MAS frequency of 10 kHz, controlled to within ±2Hz using a Bruker MAS controller. 29Si single-pulse and cross polarization (CP) experiments were performed on each sample. For 29Si single-pulse MAS experiments, a 90 degree pulse with a width of 4.3 μs was used and the recycle delay was 30 s. For 1H-29Si CP MAS experiment, 1H 90° pulse duration was 2.5 μs, a linear amplitude ramp (80~100%) on 1H was used with a contact time of 4.5 μs, and the recycle delay was 5 s. For 27Al MAS with and without high-power proton decoupling, a pulse with a width of 1.35 μs was used and the recycle delay was 1 s.
Thermal treatment of zeolite and catalysis
The samples were treated in a quartz plug flow reactor (ID = 5 mm). To support the sample in the center of the reactor, quartz wool was placed near the bottom of the reactor tube and quartz chips were located between the quartz wool and the sample. The reactor was heated using a cylindrical furnace (C5232, Hoskins Mfg. Co.) and the temperature was managed using a temperature controller (NC 74000, Omega Engineering). Treatment protocols for treatments 1 and 2 are illustrated in Fig. 1. The zeolites were first heated at 673 K for 2 h to remove water in the samples. To obtain acid catalysts, the samples were then heated at 773 K for additional 3 h (treatment 1, solid black line). The other thermally treated catalysts were prepared by heating the samples once again at 823, 873, 973 (dashed grey lines), or 1073 K for 1.5 h (1073 K – treatment 2, solid grey line). After treatments, the reaction temperatures varied from 733 K to 803 K. The flow rate of the reactant gas, which contains 5 mole% of propane (Matheson Tri-Gas, research grade) diluted in N2, was fixed to 80 sccm. The conversion was kept low under 2% for the monomolecular propane reaction. The product distribution was collected by using a gas chromatography instrument (GC, Shimadzu 2014). A thermal conductivity detector (TCD) and a flame ionization detector (FID) were used to detect hydrogen and hydrocarbons, respectively.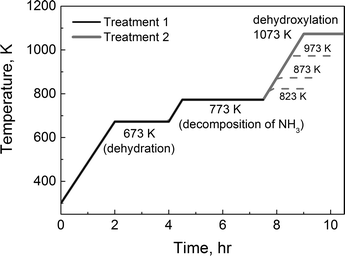 | ||
| Fig. 1 Temperature protocols for two treatments: 1) treatment 1 for the acid catalyst and 2) treatment 2 for the dehydroxylated catalyst. | ||
Results and discussion
Effect of treatment on the structure of the sample
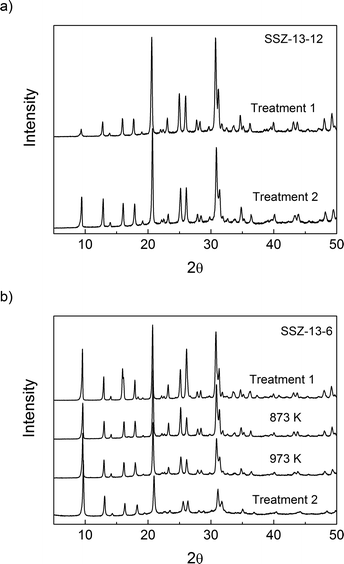
The micropore volumes of H-SSZ-13-12 and H-SSZ-13-6 after treatment 1 were 0.25 cm3 g−1 and 0.27 cm3 g−1, respectively, showing good agreement with the expected values based on the chabazite structure and previous reports.45Table 1 shows that the volume of micropores in SSZ-13-12 decreased by 5% after treatment 2; there was no substantial structural damage even if the decomposition of BAS led to a minor reduction in the volume of the micropores. After heating the SSZ-13-6 sample to 873 K, the microporous volume did not decrease, but after heating the SSZ-13-6 samples to 973 K and 1073 K (treatment 2), there was a significant reduction in the microporous volume, which is evidence of structural damage. XRD analysis and N2 adsorption analysis show then that the sample with a Si/Al ratio of 6 (SSZ-13-6) is less thermally stable and reveal some collapse of the crystalline structure at temperatures over 973 K. Consequently, the maximal treatment temperatures were 873 K for SSZ-13-6 and 1073 K for SSZ-13-12.
| Treatment protocol | H-SSZ-13-12 | H-SSZ-13-6 |
|---|---|---|
| Treatment 1 | 0.257 | 0.275 |
| Treated at 873 K | — | 0.274 |
| Treated at 973 K | — | 0.192 |
| Treatment 2 | 0.240 | 0.178 |
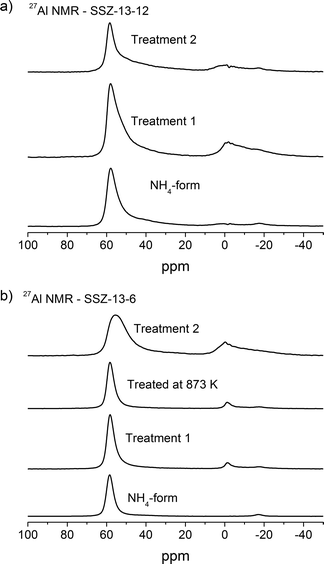 | ||
| Fig. 4 27Al NMR of a) SSZ-13-12 samples: NH4-form, treated at 773 K and 1073 K and b) SSZ-13-6 samples: NH4-form, treated at 773 K, 873 K, and 1073 K. | ||
29Si MAS NMR spectra of the NH4-form and thermally treated samples are depicted in Fig. 5. The three different resonances are assigned to the different Si(nAl) environments. The resonances at around −110 ppm, −104 ppm, and −98 ppm are related to Si4, Si3Al1, and Si2Al2 sites, respectively.47,48,53 The Si/Al compositions of the crystalline framework can be estimated from the relationship:
| Si/Al = ∑ISi(nAl)/0.25 ∑nISi(nAl) | (1) |
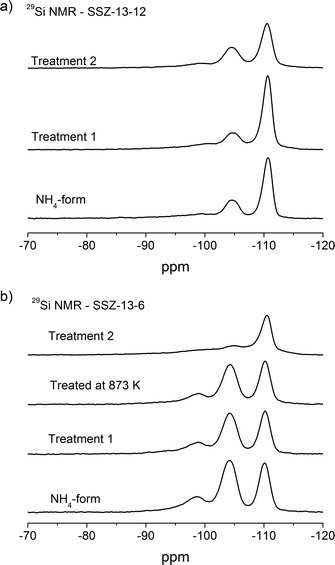 | ||
| Fig. 5 29Si NMR of a) SSZ-13-12 samples: NH4-form, treated at 773 K and 1073 K and b) SSZ-13-6 samples: NH4-form, treated at 773 K, 873 K, and 1073 K. | ||
| Treatment | Si4 | Si3Al1 | Si2Al2 | Si/Al ratio | |
|---|---|---|---|---|---|
| SSZ-13-12 | NH4-form | 0.73 | 0.24 | 0.03 | 13.1 |
| Treatment 1 | 0.68 | 0.31 | 0.01 | 12.1 | |
| Treatment 2 | 0.69 | 0.30 | 0.02 | 12.2 | |
| SSZ-13-6 | NH4-form | 0.42 | 0.52 | 0.07 | 6.2 |
| Treatment 1 | 0.44 | 0.49 | 0.07 | 6.4 | |
| Treated at 873 K | 0.44 | 0.49 | 0.06 | 6.4 | |
| Treatment 2 | 0.66 | 0.32 | 0.02 | 10.9 |
Effect of treatment temperature on the monomolecular propane reaction
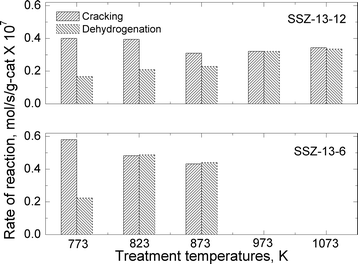 | ||
| Fig. 6 Reaction rates for cracking and dehydrogenation of propane at reaction temperature of 773 K over SSZ-13-12 and SSZ-13-6 treated at different pretreatment temperatures. | ||
| Treatment temp., K | 773 (treatment 1) | 823 | 873 | 973 | 1073 (treatment 2) |
|---|---|---|---|---|---|
| SSZ-13-12 | 2.39 | 1.88 | 1.35 | 1.00 | 1.03 |
| SSZ-13-6 | 2.59 | 0.99 | 0.98 | — | — |
The total reaction rates over the SSZ-13-12 samples treated at 823, 873, 973, and 1073 K were similar to the reaction rates observed over the SSZ-13-12 after treatment 1 (773 K), despite of a slight increase in the reaction rates over the sample treated at 823 K. Earlier reports3,4 and the TPD experiment reported above (Fig. 3) have found that the number of BAS decreases by dehydroxylation. It is notable that reaction rates of SSZ-13-12 after thermal treatments are similar to the rates of the samples treated at low temperature. This implies that new active sites, different from BAS, can be generated and can catalyze propane conversion. The cracking and dehydrogenation selectivity showed noticeable changes even though the total reaction rates over SSZ-13-12 samples treated at different temperatures barely changed. For the SSZ-13-12 samples, dehydrogenation selectivity increases step by step as the treatment temperature increases, and the reaction rates of the dehydrogenation channel become identical to the reaction rates of the cracking channel (0.32 mol s−1 per gram catalyst × 107) at 973 K. It can be assumed that the proportion of sites different from BAS increases stepwise with increasing treatment temperature and that the mechanism of the reaction changed starting from the temperature of 973 K.
SSZ-13-6 samples were treated at 773 (treatment 1), 823, and 873 K. The temperatures of 973 and 1073 K were not employed because of the samples' low thermal stability as discussed above. The acid form of SSZ-13-6 (after treatment 1) also showed higher reaction rates for cracking (0.58 mol s−1 per gram catalyst × 107) than for dehydrogenation (0.22 mol s−1 per gram catalyst × 107), resulting in a cracking-to-dehydrogenation ratio of ~2.59 (Table 3). The SSZ-13-6 treated at 823 exhibited a little higher total reaction rate, and the SSZ-13-6 treated at 873 K showed similar total reaction rates to that over the SSZ-13-6 after treatment 1 (773 K). The SSZ-13-6 samples showed very low reaction rates after treatment at 973 K and 1073 K (data not shown), as expected given that their structure was damaged by the treatment (see above).
The SSZ-13-6 samples showed drastic changes in selectivity with a small change in treatment temperatures. After a pretreatment temperature of 823 K, the cracking-to-dehydrogenation ratio decreased from 2.59 to 0.99 with just a 50 degree increase in the treatment temperature (Table 3). This drastic change in selectivity without apparent decomposition of BAS (as shown by the ammonia TPD experiments) cannot be explained at this time.
In Fig. 7, the reaction rates of cracking and dehydrogenation over SSZ-13-12 and SSZ-13-6 were compared for pretreatment temperatures of 773 K and for the respective highest treatment temperatures (1073 K for SSZ-13-12 and 873 K for SSZ-13-6). The cracking rates decreased slightly after thermal treatment for both samples, but dehydrogenation rates were significantly increased. Note that the change in selectivity after complete dehydroxylation is similar for both samples even if the treatment temperatures for SSZ-13-12 and SSZ-13-6 are different.
A kinetic analysis of the data has been carried out by using following relationships:
 | (2) |
| r = k3K1PC3H8 = kappPC3H8 | (3) |
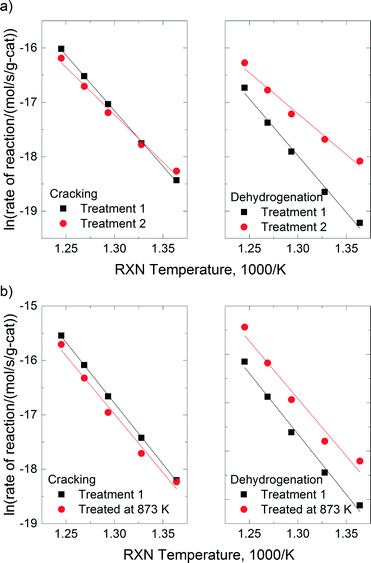
Under the conditions for monomolecular propane reaction, such as low partial pressure, low conversion, and high reaction temperatures, the rate expression can be simplified to a first-order rate equation (eqn (3)). The measured activation energies are reported in Table 4. For H-SSZ-13-12 after treatment 1, the activation energy for cracking is 170 kJ mol−1, a little lower than that for dehydrogenation (174 kJ mol−1). H-SSZ-13-6 after treatment 1 also exhibited a higher activation energy for dehydrogenation (208 kJ mol−1) than that for cracking (179 kJ mol−1). A higher activation barrier is expected for dehydrogenation than for cracking because of the relative stabilities of the protonated C–H and C–C bonds in the propane molecule.30 The difference in the activation energy (Ea,meas for cracking < Ea,meas for dehydrogenation) for the acid catalyst was consistent with previous reports. At the same time, the activation energy values showed good agreement with the experimental values for ZSM-5 samples3,23 and the values determined from the simulation of the propane reaction over the acidic chabazite.53,54
| Treatment temp., K | Measured activation energy, Ea,meas (kJ mol−1) | |||
|---|---|---|---|---|
| SSZ-13-12 | SSZ-13-6 | |||
| Cracking | Dehydrogenation | Cracking | Dehydrogenation | |
| 773 (treatment 1) | 170 | 174 | 179 | 208 |
| 823 | 170 | 161 | 178 | 206 |
| 873 | 165 | 158 | 179 | 198 |
| 973 | 114 | 84 | ||
| 1073 (treatment 2) | 146 | 114 | ||
The activation energies for reactions with SSZ-13-12 samples show a stepwise decrease as the treatment temperatures increased (146 kJ mol−1 and 114 kJ mol−1, for cracking and dehydrogenation, respectively), which is consistent with the change in selectivity. For the SSZ-13-12 sample after treatment 2, the activation energy for cracking was greater than that for dehydrogenation. The differences in activation energy indicate that the different intermediates are generated during the propane conversion over the SSZ-13-12 sample after treatment 2 compared to the sample after treatment 1. The NMR and ammonium TPD experiments indicate that the selectivity change in SSZ-13-12 is related to decomposition of BAS. In a previous report, different activation energies were also observed for propane conversion over ZSM-5 before and after thermal treatments.3 It was suggested that redox sites are generated in ZSM-5 after dehydroxylation, the sites that can extract an electron from neutral adsorbed molecules.3 Here, the activation energy for the reaction with SSZ-13-12 was significantly lower after treatment 2, as in the case of ZSM-5. We conclude that new sites must be generated by the thermal treatment and their effect increases as the treatment temperature increases because more BAS are decomposed. Consequently, the properties of the thermally treated catalysts lead to greater selectivity for the dehydrogenation channel in propane conversion.
The proposed redox catalytic cycle over the dehydroxylated SSZ-13-12 sample is depicted in Scheme 3. An electron is extracted from the propane molecule, resulting in the formation of a propane radical cation. The propane radical cation then dissociates into a propylene radical cation with hydrogen or an ethylene radical cation with methane. The reaction cycle is completed after the electron is given back to the propylene or the ethylene radical cations. Note that the activation energy at the treatment temperature of 973 K is exceptionally lower than the values observed at other temperatures. It is possible that 1) some new sites, which have the different ability of the catalytic reaction than redox sites or LAS, were generated at 973 K but disappeared at 1073 K, and 2) some specific portion of the newly generated sites may affect the high dehydrogenation selectivity and the kinetics of the reaction.
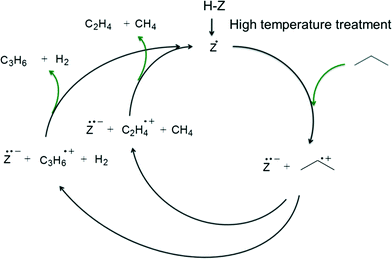 | ||
| Scheme 3 Redox catalytic cycle for propane conversion over zeolite after high-temperature treatment. | ||
The activation energies of SSZ-13-6 treated at 823 K were indistinguishable from those of SSZ-13-6 after treatment 1 (the acid catalyst). The activation energy of the dehydrogenation reaction decreased by ~10 kJ mol−1 (208 kJ mol−1 for SSZ-13-6 after treatment 1 to 198 kJ mol−1 for SSZ-13-6 treated at 873 K), while the values of the cracking reaction did not change. At this time, the molecular origin of this change in selectivity is not clear. It may be that only a small number of new dehydrogenation sites are formed given that the ammonia TPD traces are nearly unchanged and that the change in selectivity reflects the contributions of these sites.
Conclusions
The structure–activity relationship of the SSZ-13 samples after thermal treatments is summarized in Table 5. The low thermal stability of SSZ-13-6 limited the pretreatment temperature to a maximum of 873 K. Therefore, thermal decomposition of BAS was not observed in the SSZ-13-6 sample at given treatment temperatures (823 and 873 K) even if the heterolytic mechanism is expected to be predominant due to locations of BAS being close to each other. Instead, structural damage was observed for the samples after treated over 873 K. The reaction rates of the propane conversion were similar for the acid catalyst and the thermally treated catalysts. However, SSZ-13-6 treated at 873 K showed higher selectivity in the dehydrogenation but the identical kinetic parameters. The observed results indicate that the selectivity change is not a result of generation of LAS or redox sites, and the change in the cell volume after thermal treatment may lead to the confinement effect, promoting C–H cleavage. Different measured activation energies were observed for the SSZ-13-12 sample treated at 1073 K despite of higher selectivity in the dehydrogenation channel. The decreased activation energies and the change in selectivity suggest the generation of different active sites, other than BAS, in SSZ-13-12. After thermal treatments, LAS and the redox sites can be generated and could play an important role in the catalytic activity of the SSZ-13-12 sample. The observations in this work confirm the existence of different active sites other than BAS and their role in increasing the catalytic activity for hydrocarbon conversion.| SSZ-13-12 | SSZ-13-6 | |||
|---|---|---|---|---|
| Structure change with increase in treatment temperature | <973 K | Partial dehydroxylation | <973 K | Not changed |
| ≥973 K | Complete dehydroxylation | ≥973 K | Structural damage | |
| Selectivity change | Gradually (773 to 973 K) | Drastically (773 to 823 K) | ||
| Activation energy change | Decrease gradually | Not changed | ||
| Assumed generated sites | Redox sites (electron-deficient sites) & Lewis acid sites | New sites & structural damage (≥973 K) | ||
Acknowledgements
This work is funded by National Science Foundation under grant number NSF-CBET-0931059.Notes and references
- G. T. Kerr, J. Catal., 1969, 15, 200–204 CrossRef CAS.
- G. T. Kerr, J. Phys. Chem., 1969, 73, 2780–2782 CrossRef CAS.
- K. A. Al-majnouni, J. H. Yun and R. F. Lobo, ChemCatChem, 2011, 3, 1333–1341 CrossRef CAS.
- J. H. Yun and R. F. Lobo, Microporous Mesoporous Mater., 2012, 155, 82–89 CrossRef CAS PubMed.
- V. Valtchev, G. Majano, S. Mintova and J. Perez-Ramirez, Chem. Soc. Rev., 2013, 42, 263–290 RSC.
- A. Corma, M. Diaz-Cabanas, J. Martinez-Triguero, F. Rey and J. Rius, Nature, 2002, 418, 514–517 CrossRef CAS PubMed.
- A. Corma, A. Martinez, P. A. Arroyo, J. L. F. Monteiro and E. F. SousaAguiar, Appl. Catal., A, 1996, 142, 139–150 CrossRef CAS.
- J. C. Groen, J. A. Moulijn and J. Perez-Ramirez, J. Mater. Chem., 2006, 16, 2121–2131 RSC.
- J. C. Groen, L. A. A. Peffer and J. Perez-Ramirez, Microporous Mesoporous Mater., 2003, 60, 1–17 CrossRef CAS.
- M. Bjorgen, F. Joensen, M. S. Holm, U. Olsbye, K.-P. Lillerud and S. Svelle, Appl. Catal., A, 2008, 345, 43–50 CrossRef PubMed.
- P. A. Jacobs, E. M. Flanigen, J. C. Jansen and H. van Bekkum, Introduction to Zeolite Science and Practice, Elsevier Science, 2001 Search PubMed.
- J. B. Uytterho, L. G. Christne and W. K. Hall, J. Phys. Chem., 1965, 69, 2117–2126 CrossRef.
- D. N. Stamires and J. Turkevich, J. Am. Chem. Soc., 1964, 86, 749–757 CrossRef CAS.
- A. Zecchina, S. Bordiga, G. Spoto, D. Scarano, G. Petrini, G. Leofanti, M. Padovan and C. O. Arean, J. Chem. Soc., Faraday Trans., 1992, 88, 2959–2969 RSC.
- H. Garcia and H. D. Roth, Chem. Rev., 2002, 102, 3947–4007 CrossRef CAS PubMed.
- T. M. Leu and E. Roduner, J. Catal., 2004, 228, 397–404 CrossRef CAS PubMed.
- M. L. Cano, A. Corma, V. Fornes and H. Garcia, J. Phys. Chem., 1995, 99, 4241–4246 CrossRef CAS.
- A. Moissette, H. Vezin, I. Gener and C. Bremard, J. Phys. Chem. B, 2003, 107, 8935–8945 CrossRef CAS.
- M. J. Nash, A. M. Shough, D. W. Fickel, D. J. Doren and R. F. Lobo, J. Am. Chem. Soc., 2008, 130, 2460–2462 CrossRef CAS PubMed.
- W. O. Haag, R. M. Lago and P. B. Weisz, Nature, 1984, 309, 589–591 CrossRef CAS.
- A. M. Rigby, G. J. Kramer and R. A. vanSanten, J. Catal., 1997, 170, 1–10 CrossRef CAS.
- A. Corma, P. J. Miguel and A. V. Orchilles, J. Catal., 1994, 145, 171–180 CrossRef CAS.
- T. F. Narbeshuber, A. Brait, K. Seshan and J. A. Lercher, J. Catal., 1997, 172, 127–136 CrossRef CAS.
- S. M. Sharada, P. M. Zimmerman, A. T. Bell and M. Head-Gordon, J. Phys. Chem. C, 2013, 117, 12600–12611 Search PubMed.
- D. C. Tranca, N. Hansen, J. A. Swisher, B. Smit and F. J. Keil, J. Phys. Chem. C, 2012, 116, 23408–23417 CAS.
- F. C. Jentoft and B. C. Gates, Top. Catal., 1997, 4, 1–13 CrossRef CAS.
- S. Kotrel, H. Knozinger and B. C. Gates, Microporous Mesoporous Mater., 2000, 35–6, 11–20 CrossRef.
- A. Corma and A. V. Orchilles, Microporous Mesoporous Mater., 2000, 35–6, 21–30 CrossRef.
- R. Gounder and E. Iglesia, J. Am. Chem. Soc., 2009, 131, 1958–1971 CrossRef CAS PubMed.
- S. R. Stoyanov, S. Gusarov, S. M. Kuznicki and A. Kovalenko, J. Phys. Chem. C, 2008, 112, 6794–6810 CAS.
- C. Lo and B. L. Trout, J. Catal., 2004, 227, 77–89 CrossRef CAS PubMed.
- F. Bleken, M. Bjorgen, L. Palumbo, S. Bordiga, S. Svelle, K.-P. Lillerud and U. Olsbye, Top. Catal., 2009, 52, 218–228 CrossRef CAS PubMed.
- S. Bordiga, L. Regli, D. Cocina, C. Lamberti, M. Bjørgen and K. P. Lillerud, J. Phys. Chem. B, 2005, 109, 2779–2784 CrossRef CAS PubMed.
- E. A. Eilertsen, S. Bordiga, C. Lamberti, A. Damin, F. Bonino, B. Arstad, S. Svelle, U. Olsbye and K. P. Lillerud, ChemCatChem, 2011, 3, 1869–1871 CrossRef CAS.
- Q. Zhu, J. N. Kondo, T. Tatsumi, S. Inagaki, R. Ohnuma, Y. Kubota, Y. Shimodaira, H. Kobayashi and K. Domen, J. Phys. Chem. C, 2007, 111, 5409–5415 CAS.
- S. J. Kim, H.-G. Jang, J. K. Lee, H.-K. Min, S. B. Hong and G. Seo, Chem. Commun., 2011, 47, 9498–9500 RSC.
- L. Sommer, A. Krivokapic, S. Svelle, K. P. Lillerud, M. Stocker and U. Olsbye, J. Phys. Chem. C, 2011, 115, 6521–6530 CAS.
- S. I. Zones, J. Chem. Soc., Faraday Trans., 1991, 87, 3709–3716 RSC.
- D. W. Fickel, E. D'Addio, J. A. Lauterbach and R. F. Lobo, Appl. Catal., B, 2011, 102, 441–448 CrossRef CAS PubMed.
- J. H. Kwak, R. G. Tonkyn, D. H. Kim, J. Szanyi and C. H. F. Peden, J. Catal., 2010, 275, 187–190 CrossRef CAS PubMed.
- D. W. Fickel, J. M. Fedeyko and R. F. Lobo, J. Phys. Chem. C, 2010, 114, 1633–1640 CAS.
- S. I. Zones, US Pat., US 4544538 A, 1985 Search PubMed.
- E. A. Eilertsen, M. Haouas, A. B. Pinar, N. D. Hould, R. F. Lobo, K. P. Lillerud and F. Taulelle, Chem. Mater., 2012, 24, 571–578 CrossRef CAS.
- A. L. Patterson, Phys. Rev., 1939, 56, 978–982 CrossRef CAS.
- G. I. Kapustin, T. R. Brueva, A. L. Klyachko, S. Beran and B. Wichterlova, Appl. Catal., 1988, 42, 239–246 CrossRef CAS.
- H. Koller and M. Weiss, in Solid State Nmr, ed. J. C. C. Chan, 2012, vol. 306, pp. 189–227 Search PubMed.
- J. Klinowski, Chem. Rev., 1991, 91, 1459–1479 CrossRef CAS.
- S. Li, A. Zheng, Y. Su, H. Fang, W. Shen, Z. Yu, L. Chen and F. Deng, Phys. Chem. Chem. Phys., 2010, 12, 3895–3903 RSC.
- L. Wu, V. Degirmenci, P. C. M. M. Magusin, N. J. H. G. M. Lousberg and E. J. M. Hensen, J. Catal., 2013, 298, 27–40 CrossRef CAS PubMed.
- K. A. Thrush and S. M. Kuznicki, J. Chem. Soc., Faraday Trans., 1991, 87, 1031–1035 RSC.
- S. Li, S.-J. Huang, W. Shen, H. Zhang, H. Fang, A. Zheng, S.-B. Liu and F. Deng, J. Phys. Chem. C, 2008, 112, 14486–14494 CAS.
- D. E. Akporiaye, I. M. Dahl, H. B. Mostad and R. Wendelbo, J. Phys. Chem., 1996, 100, 4148–4153 CrossRef CAS.
- T. Bucko, L. Benco, J. Hafner and J. G. Angyan, J. Catal., 2011, 279, 220–228 CrossRef CAS PubMed.
- T. Bucko and J. Hafner, J. Phys.: Condens. Matter, 2010, 22, 384201 CrossRef CAS PubMed.
| This journal is © The Royal Society of Chemistry 2015 |


