
 Open Access Article
 This Open Access Article is licensed under a
 Creative Commons Attribution 3.0 Unported Licence
Imaging metals in biology: balancing sensitivity, selectivity and spatial resolution
Dominic J.
Hare
 *abc,
Elizabeth J.
New
d,
Martin D.
de Jonge
e and
Gawain
McColl
*b
*abc,
Elizabeth J.
New
d,
Martin D.
de Jonge
e and
Gawain
McColl
*b
aElemental Bio-imaging Facility, University of Technology Sydney, Thomas Street, Broadway, New South Wales 2007, Australia. E-mail: dominic.hare@uts.edu.au; Tel: +61 3 9053 9549
bThe Florey Institute of Neuroscience and Mental Health, The University of Melbourne, 30 Royal Parade, Parkville, Victoria 3052, Australia. E-mail: gawain.mccoll@florey.edu.au; Tel: +61 3 9053 6609
cSenator Frank R. Lautenberg Environmental Health Sciences Laboratory, Department of Preventive Medicine, Icahn School of Medicine at Mount Sinai, New York, USA
dSchool of Chemistry, The University of Sydney, Camperdown, Australia
eAustralian Synchrotron, Clayton, Australia
First published on 6th July 2015
Abstract
Metal biochemistry drives a diverse range of cellular processes associated with development, health and disease. Determining metal distribution, concentration and flux defines our understanding of these fundamental processes. A comprehensive analysis of biological systems requires a balance of analytical techniques that inform on metal quantity (sensitivity), chemical state (selectivity) and location (spatial resolution) with a high degree of certainty. A number of approaches are available for imaging metals from whole tissues down to subcellular organelles, as well as mapping metal turnover, protein association and redox state within these structures. Technological advances in micro- and nano-scale imaging are striving to achieve multi-dimensional and in vivo measures of metals while maintaining the native biochemical environment and physiological state. This Tutorial Review discusses state-of-the-art imaging technology as a guide to obtaining novel insight into the biology of metals, with sensitivity, selectivity and spatial resolution in focus.
 Dominic J. Hare | Dominic Hare completed his undergraduate studies in applied chemistry at the University of Technology, Sydney, and completed his PhD at UTS in 2009 in analytical chemistry under Professor Philip Doble. From 2010 to 2013 he held an Australian Postdoctoral (Industry) Fellowship from the Australian Research Council, after which he took up a Chancellor's Research Fellowship at UTS, splitting his time between Sydney and the Florey Institute of Neuroscience and Mental Health at the University of Melbourne. In 2015 he accepted an adjunct Assistant Professor appointment at the Icahn School of Medicine at Mount Sinai. His primary research focus is the use of cutting-edge analytical technology for elucidating the roles of metals in biology. |
 Elizabeth J. New | Elizabeth New undertook her undergraduate and Masters studies at the University of Sydney, and completed her PhD in 2009 with Professor David Parker at Durham University. From 2010–2011 she held a Royal Commission for the Exhibition of 1851 Postdoctoral Fellow with Professor Chris Chang at the University of California (Berkeley). In 2012, Liz returned to the University of Sydney as a Lecturer in Inorganic Chemistry, holding a Discovery Early Career Researcher Award from the Australian Research Council for 2012–2014. Her research is focussed on the development of small molecule fluorescent and magnetic resonance probes for the study of biological systems. |
 Martin D. de Jonge | Martin de Jonge holds a BSc(Hons)/BA and a PhD in Physics from the University of Melbourne. He is presently developing a range of new microscopies to elucidate the metallome at the Australian Synchrotron's X-ray Fluorescence Microprobe. Martin is advancing quantitative analysis in differential phase contrast microscopy, X-ray fluorescence tomography, X-ray fluorescence spectroscopy, and confocal fluorescence mapping to access biometals at length-scales ranging from the organelle to the organism. His current active projects address the self-absorption problem in fluorescence tomography, the implications of radiation damage in biological systems, and accessing the metallochemistry of the organism in vivo. |
 Gawain McColl | Gawain McColl completed undergraduate studies at the University of Melbourne followed by PhD in Genetics at Monash University. In late 1998, he initiated postdoctoral studies at the University of Manchester and in 2001 moved to the Buck Institute for Research on Aging, California, where he became a Glenn Foundation Postdoctoral Fellow. Gawain returned to Melbourne, Australia in late 2007 to establish a C. elegans laboratory at the Mental Health Research Institute. In 2012 he joined the Florey Institute for Neuroscience and Mental Health, with appointment to faculty in 2013. His research interests include investigating the fundamental biology of ageing, biometal homeostasis and disease processes. |
Key learning points1. Successful imaging of metals in a biological system is a balance of sensitivity, selectivity and spatial resolution.2. Contemporary analytical technology can provide spatial and quantitative information on metal levels, protein–metal associations, chemical state and differential uptake, from the macro- to micro-scale. 3. Disruption to the native chemical environment, through both sample preparation and during analysis, should be minimised. Potential confounding factors, from post mortem changes to the analytical technique itself may adversely affect metal chemistry and should be given appropriate consideration. 4. A unified approach employing multiple imaging modalities should be considered when designing experiments, as currently no single technique is ideal for comprehensively profiling all aspects of metal biochemistry. |
1. Introduction
Metals are found in every cell. It is estimated that as many as a third of all proteins and half of all enzymes in the human proteome require metals for their structure or function.1 These include the highly abundant s-block metals, such as magnesium and calcium, which are usually ionic and help maintain concentration gradients across cell membranes. Calcium is also a macromineral that forms the major chemical component of bone as hydroxyapatite. In terms of chemical activity, biologically relevant transition metals that can exist in more than one oxidation state play a number of significant roles, and within the metallome (the metal complement of a cell) they exist in a range of coordination environments that dictate reactivity and bioavailability. The propensity of transition metals to react is determined by the local redox environment and the nature of the ligands with which they interact, and these metals catalyse some of the most important, as well as analytically challenging reactions in the body. The bioinorganic chemistry of the cell influences the variety of roles that each metal ion can play. For example, iron-binding ligands affect oxidation and electronic spin states of the ion, and thereby the activity and reactivity. This determines whether an iron-binding biomolecule will be responsible for reactions involving oxygen transport and storage (e.g. haemoglobin); electron transfer (e.g. Fe/S clusters); or enzymatic conversion of small molecules (e.g. cytochromes). Weakly bound iron can also play a role in immune response through catalysis of reactive oxygen species production. Recently, it has been recognised that analysis must be sensitive to distinct metal pools, including tightly-bound metalloproteins and the more weakly-bound bioavailable, or labile, metal pool.2 However, the function of metals is not simply bimodal; fine discrimination of metal coordination environments is needed to understand the function of metals in a biological system.Metals have heterogeneous distribution within organs and organelles (Fig. 1). They are found in high concentrations within structures where their reactivity is most often used, particularly in organs with high metabolic activity, such as the brain. Within cells, metals are localised according to need, with mitochondria containing high levels of iron in Fe/S clusters and products of haem synthesis; the nucleus being rich in zinc finger proteins essential for gene transcription; and the Golgi apparatus being the major regulator of cellular copper levels through expression of copper-transporting ATPases.
 | ||
| Fig. 1 Organelle-specific metal distribution in a eukaryotic cell. While biologically relevant metals occur ubiquitously throughout the cell, higher concentrations are found in certain organelles depending on their biological role. For example, metal ions associated with soluble proteins are found within the cytoplasm; iron–sulfur (FeS) clusters form constituents of the electron transport chain in mitochondria; and zinc finger motifs stabilise DNA-transcription factor interactions. | ||
The detrimental effects of metal deficiencies are testament to their essential role in health, but dysregulation or overload of metals is just as significant. In numerous chronic conditions, metal dyshomeostasis and resulting oxidative stress is a hallmark of disease. The redox-active metals iron and copper are strongly implicated due to their ability to participate in catalytic Fenton and Haber–Weiss chemistry:3
| Mn+ + H2O2 → M(n+1)+ + OH˙ + OH− | (1) |
| M(n+1)+ + O2− → Mn+ + O2 | (2) |
Combining these reactions leads to redox cycling under normal physiological conditions, and indicates how these metals can contribute significantly to the cell's oxidative load:
| H2O2 + O2− → OH˙ + OH− + O2 | (3) |
The reactive oxygen species (ROS) produced by these processes have cytotoxic effects because of their tendency to react with biomolecules, including lipids and DNA. 8-Hydroxyguanosine is perhaps the best-known biomarker of ROS activity and oxidative stress, with links to carcinogenicity and senescence. Both metal-mediated ROS generation and the failure of antioxidant mechanisms (themselves often regulated by a metalloprotein such as copper and zinc-containing superoxide dismutase-1) are thought to play major upstream roles in disease pathogenesis. The chemical conditions and localisation of metals within the cell play a key role in controlling how potentially harmful reactions are minimised, and an altered chemical environment can result in increased radical production and resulting cell damage.
Given the diversity of metals at and below the micro scale, to better understand the roles of metals in physiology, we must be able to identify and determine the localisation of distinct metal coordination environments and oxidation states in addition to total metal levels. Visualising metal environments will improve understanding of how they impart key functions, and how these functions might be altered. While it is obvious why metal oxidation states and coordination environments in the cell must be tightly regulated, accurate and precise determination of these parameters is a challenge at the forefront of analytical technology. Constantly improving techniques and methods, from tomography of whole organisms to isotope tracing by mass spectrometry provide multiple windows into metal biology. Contemporary imaging retains metal distribution, which is often lost by less specific bulk assays, whilst also providing information on chemical specificity and flux.
Choice of imaging technology applied should be based on consideration of three key properties: sensitivity, where analytical limits of detection and quantification are low enough to reliably measure metals at biologically relevant levels; selectivity, where oxidation state, coordination environment and uptake dynamics (e.g. via isotope tracing) are considered; and spatial resolution, to co-localise metals with the smallest cellular structures (Fig. 2). With consideration of these three aspects, this Tutorial Review discusses the current methods for the micro- and nano-scale imaging of metals in biology, detailing how an array of technology can provide complementary information on a system-wide level, based on the unique information each approach can provide.
 | ||
| Fig. 2 Relationship between specificity, spatial resolution and sensitivity in metal imaging. Specificity refers to the ability to define a metal's chemical species, be it oxidation state or association with a specific protein. Additionally, isotope-tracing experiments (shown here as iron-54) can be used to follow movement of a specific metal throughout a system. Spatial resolution determines the scale at which imaging can be achieved, from organ to cell to organelle. Sensitivity refers not only to the ability to determine metal concentration, but also the ability to quantify the chemical states that constitute total metal levels. | ||
2. State of the art: the best techniques available for metal imaging
Approaches to in situ imaging of metals in biological samples are diverse. Histochemical stains have been employed for over 100 years, including Perls Prussian blue and Turnbull's stain for non-haem iron, and Timm's sulfide silver stain for zinc. More recently, developments in mass spectrometry (MS); X-ray emission spectroscopy and metal-sensitive fluorescent molecules have given biologists access to a number of complementary analytical techniques. For a comprehensive review ranging from traditional histochemistry to state-of-the-art analytical technologies, including a selection of their biological applications to 2009, see the review by McRae et al.4 In this Tutorial Review, we consider imaging techniques that currently offer the best achievable levels of sensitivity, selectivity and spatial resolution. Each method has its own advantages and limitations, such as quantitative capacity, sample preservation and accessibility, with no one technique being optimal for satisfying our three defined key properties for metal imaging. In fact, sensitivity and spatial resolution are somewhat intertwined, as absolute detection limits are defined by the amount of analyte being samples, which decreased proportional to the area being sampled (see eqn (4) in Section 2.1.1 for an example).Imaging technologies can be grouped into three categories: those that use mass spectrometric detection; those that measure the characteristic emission or absorption of electromagnetic radiation; and those requiring exogenously applied metal-selective probes. The method of sample preparation and introduction to the analytical device, the characteristic analyte chemistry, and how that specific information is detected differs for each group. These imaging approaches should be considered complementary to one another, and not either in competition or in isolation. It should be noted that specific attention is paid here to mass spectrometry (MS), X-ray fluorescence microscopy (XFM) and fluorescent probes, in accordance with their predominance in the literature.
2.1 Mass spectrometry (MS) imaging
The field of mass spectrometry recently celebrated its centenary, and continues to be one of the most diverse and dynamic fields in analytical chemistry. The ability to precisely control and manipulate the motion of a charged particle in an electromagnetic field and a vacuum has provided a multitude of advances in the biosciences, and much biological research relies heavily on access to mass spectrometry equipment. The variety of available mass spectrometers all operate on a similar principle: the mass-to-charge ratio (m/z) of an ionised particle can be used to accurately identify a specific chemical in a complex mixture. Variation of both sample introduction method and the physics and geometry of the detector provides a range of designs that cover a wide mass range. For example, inductively coupled plasma-mass spectrometry (ICP-MS) is ideal for measuring metal ions with low mass, whilst high resolution time-of-flight MS are used for identification of high mass biomolecules. The unique capability of MS-based metal detection relative to all other methods is the capacity to resolve various isotopes of the one element. This facilitates studies of dynamics, where addition of stable enriched isotopes and assessment of deviation from the natural isotopic abundance ratio of the analyte can be used to profile metal kinetics.Historically, MS techniques have been used to determine the identities and concentrations of chemical species in samples without spatial information. The most sensitive MS techniques (employing multiple mass separations or tandem MS technology) can detect species at attogram levels, with mass accuracies approaching 0.0001 atomic mass units (amu). In order to study biological systems and to image the heterogeneity of metal and metal-associated biomolecule distribution, a long-term challenge was to enable collection of spatial information, whilst retaining sensitivity and mass resolution. The spatial distribution of biomolecules by MS was first achieved using matrix-assisted laser desorption/ionisation (MALDI) in the early 1990s, and imaging MS has now expanded to encompass metals.
![[thin space (1/6-em)]](https://www.rsc.org/images/entities/char_2009.gif) :calcium in fish scales at a spatial resolution of 30 μm. Laser ablation employs high-energy focused lasers, typically either solid-state neodymium:yttrium aluminium garnet (Nd:YAG) or gaseous excited dimer (excimer) designs, which emit in the ultra-violet range. These lasers ablate small particles of a solid sample that are then carried by a gas to an ICP-MS for metal-specific detection (see the recent review by Pozebon et al.6 for an overview of techniques and selected applications). LA-ICP-MS has low detection limits capable of measuring to the mid-nanogram per gram range.4 Although highly sensitive, spatial resolution has not dramatically improved in the two decades following Wang's initial paper in 1994; 1 μm is the current finest imaging resolution achievable.7 Further improvements to resolution must overcome technical limitations regarding the transport of the ablated particles to the ICP-MS and subsequent detection by a suitably sensitive mass analyser. Quadrupole (Q) ICP-MS are the most sensitive, but are limited by sequential data acquisition; TOF-MS designs overcome this at the expense of sensitivity. As alluded to, sensitivity is dependent on the amount of material available to be analysed in a single measurement. Assuming that an ablation crater formed by a laser in a thin tissue section is a perfect cylinder, the volume (V), and thereby amount of ablated material is directly proportional to the square of the beam radius (r):
:calcium in fish scales at a spatial resolution of 30 μm. Laser ablation employs high-energy focused lasers, typically either solid-state neodymium:yttrium aluminium garnet (Nd:YAG) or gaseous excited dimer (excimer) designs, which emit in the ultra-violet range. These lasers ablate small particles of a solid sample that are then carried by a gas to an ICP-MS for metal-specific detection (see the recent review by Pozebon et al.6 for an overview of techniques and selected applications). LA-ICP-MS has low detection limits capable of measuring to the mid-nanogram per gram range.4 Although highly sensitive, spatial resolution has not dramatically improved in the two decades following Wang's initial paper in 1994; 1 μm is the current finest imaging resolution achievable.7 Further improvements to resolution must overcome technical limitations regarding the transport of the ablated particles to the ICP-MS and subsequent detection by a suitably sensitive mass analyser. Quadrupole (Q) ICP-MS are the most sensitive, but are limited by sequential data acquisition; TOF-MS designs overcome this at the expense of sensitivity. As alluded to, sensitivity is dependent on the amount of material available to be analysed in a single measurement. Assuming that an ablation crater formed by a laser in a thin tissue section is a perfect cylinder, the volume (V), and thereby amount of ablated material is directly proportional to the square of the beam radius (r):| Vmaterialablated ∝ r2 | (4) |
 | ||
| Fig. 3 Representation of a copper-65 (65Cu) tracing and imaging experiment in mice by LA-ICP-MS. After introduction of copper isotopes, the animal's brain is removed and cryosectioned in preparation for LA-ICP-MS analysis, where the two natural isotopes of copper (copper-63 and -65) are measured. (a) For control animals, total copper can be quantitatively imaged using appropriate calibration methods. (b) Division of each 65Cu pixel with its corresponding 63Cu value would produce a uniform, monotone image representing the natural isotopic abundance ratio of copper (0.44 ± the precision in analysis; highest for MC-ICP-MS, lowest for ICP-Q-MS). For animals treated with a source of enriched 65Cu (e.g.65CuCl2 or as a component of a drug vehicle), imaging would reveal (c) differential uptake of 65Cu across the brain, depicted as an increased 65Cu:63Cu value depending on the rate of uptake and turnover. Longitudinally designed imaging experiments (such as those described for monitoring zinc kinetics in the rate brain by Urgast et al.9) may reveal differential movement of metals over time, and can be used to profile the kinetics of metal uptake and redistribution in a specific organ or structural region. | ||
With minimal sample handling and appropriate sample storage protocols (see Section 5.1), MS-based imaging provides sensitive, quantitative and spatial information that is highly complementary to other imaging approaches. In addition, the potential of stable isotope tracing for studying specific metal uptake and redistribution is a unique feature of MS-based detection that is not achievable by alternative methods.
2.2 X-ray fluorescence methods
When an atom is bombarded with high-energy ionising radiation, electrons are ejected, leaving inner-shell vacancies. In the process of electronic relaxation, outer-shell electrons transition to fill these vacancies and in doing so emit X-rays whose energy is determined by the atom's unique electronic energy levels, and intensity of which is proportional to the element concentration. The emitted X-ray fluorescence spectrum provides highly specific quantitative information about the elemental species that are ionised by the incident radiation. In this manner, focused incident beams and highly sensitive detectors can be used to map the distribution of multiple elements in a single scan, at high spatial resolution and with high sensitivity. Several imaging techniques take advantage of these characteristic fluorescence, distinguished by the type of incident radiation used (Fig. 4): X-ray fluorescence microscopy (XFM) uses an X-ray beam; electron-probe energy-dispersive spectroscopy (EDS) uses electrons, usually within a scanning electron microscope (SEM); and micro-particle-induced X-ray emission (μPIXE) uses charged atoms, usually protons.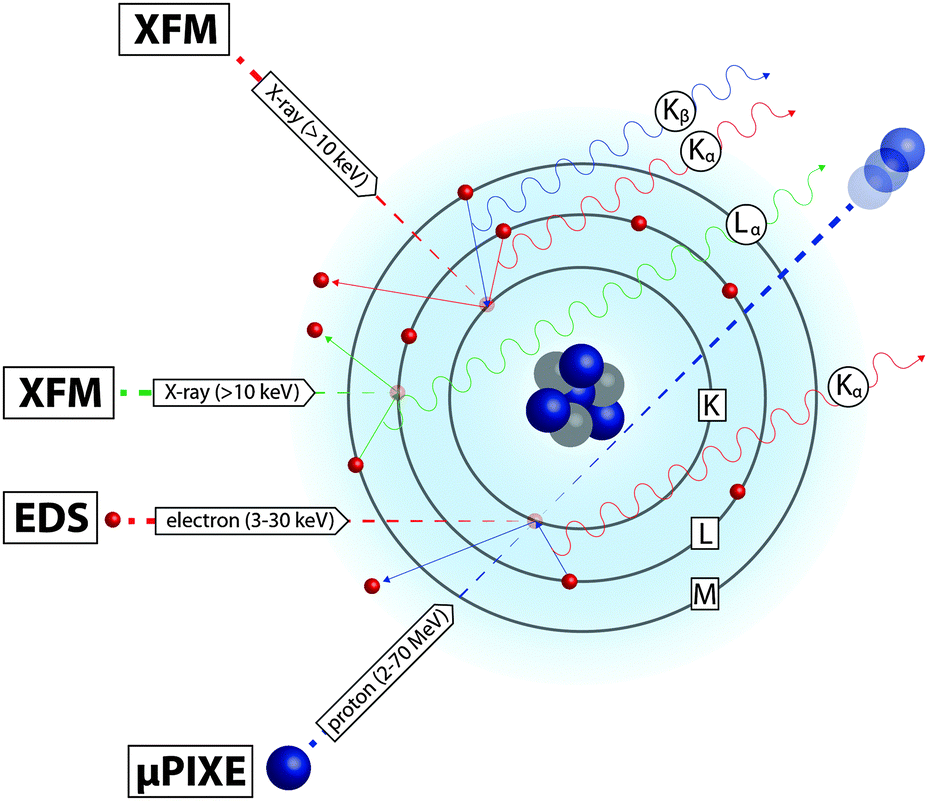 | ||
| Fig. 4 X-ray emission resulting from transfer of electrons to lower orbitals (shown in this simplified model of atomic structure) can be stimulated by ejection of inner-shell electrons by hard X-ray, electron and proton beams. μPIXE uses the most energetic incident beam, accelerating protons at velocity equivalent to the electrons they eject. Transmission of the proton and backscattering (reflection in the direction of the beam; not shown) add to the element-specific information provided by X-ray emission. | ||
The projective nature of XFM imaging leaves some ambiguity. For example, does an observed elemental increase correspond to an increased concentration at fixed thickness, or an increased thickness at fixed concentration? Methods for correlating cellular structures with XFM imaging using fluorescent markers were recently reviewed by Roudeau et al.12 Pre-treatment of cells with organelle-specific markers, such as MitoTracker® and ER-Tracker™ permits confocal microscopy prior to or after XFM,13 although this approach requires considerable sample handling that may disrupt endogenous metal concentrations (see Section 5.1). While off-line correlative measurements are powerful, the use of two separate measurements necessitates external image alignment. Several approaches to measure specimen ultrastructure and metal distribution simultaneously have used differential phase contrast, Zernike phase contrast, Compton scatter contrast, and ptychographic coherent diffractive imaging (CDI; an approach using overlapping measurements to reduce ambiguities in interpretation of diffraction data). Of these, ptychographic CDI provides excellent ultrastructural imaging. A measurement of green algae used a ptychographic reconstruction to deconvolve XFM images of lower resolution to obtain a gain of approximately 2–3 times in elemental resolution.14 However, whether ptychographic CDI provides sufficient sensitivity in biological tissue at optimum resolution, or whether optimised (and so no longer simultaneous) alternative correlative measurements are still required has yet to be evaluated.
Determination of chemical speciation can be assessed through X-ray spectroscopy. For example, X-ray absorption near-edge structure (XANES) provides specific information on chemical binding. For measurement of a XANES spectrum, the incident X-ray energy is varied over the elemental absorption edge of interest. Bound–bound electronic excitations, strongly influenced by bonding and coordination, result in characteristic structures in the absorption and fluorescence spectra. As XANES typically requires measurement of around 100 incident energies per spatial location, it is common to measure XANES at a single point only.15 Examples of XANES imaging enabled by recent advances in detector technology are presented in Section 4.3.
2.3 Metal-selective sensors
In recent years, a number of key advances in microscope technology have permitted the use of metal-selective fluorescent probes. Extremely high lateral and axial resolution is achievable by the use of confocal microscopes with pinhole excitation. Live cell imaging is now routine using incubated stages. Confocal microscopes have reached sub-μm resolution, and three colours can be readily imaged simultaneously. Increasing numbers of laser excitation sources are ensuring greater choice in excitation wavelengths. Multiphoton microscopes enable very short wavelength excitation with minimal cellular damage by using two or more incident photons of lower energy to enable higher energy excitation. More recently, a number of protocols have been established to enhance information that can be gained, including fluorescence recovery experiments, Förster resonance energy transfer (FRET), lifetime imaging, and superresolution microscopy.17 In addition, imaging cytometers are available, which combine the throughput of flow cytometry with the spatial resolution of microscopy.Despite the great potential of sophisticated fluorescence imaging technologies, there are very few naturally fluorescent molecules within cells, particularly those with low energy excitation and emission wavelengths. Consequently, fluorescence imaging studies typically involve the use of exogenous fluorophores that can be employed to report on the system, giving information about the structure (such as the aforementioned MitoTracker® and ER-Tracker™) or the chemistry of the cell (such as redox-specific sensors). Reporters can be designed to answer highly specific questions about the chemical environment of the cell, enabling great flexibility. Such reporters are interchangeably referred to as probes or sensors.
The first metal-responsive fluorescent sensors were developed for zinc in the 1960s, but the field did not gain momentum until the 1980s, when fluorescent calcium sensors were first introduced. There is now a vast range of fluorescent metal sensors, as extensively reviewed elsewhere,18 and these fall into two main categories. Genetically encoded fluorescent sensors are based on fluorescent proteins, and typically involve a metal-binding event that modulates the distance between two fluorescent proteins. Such systems have the advantage of being readily tuneable and targetable, but require integration into the genome of the target cells with plasmids encoding the protein. On the other hand, exogenous molecular probes based on organic compounds or inorganic complexes can be synthetically prepared and applied to cells via incubation. Fluorescent metal sensors of both classes typically operate by coordinating a metal to a specific receptor. As a result, the response will be sensitive to oxidation state (as different oxidation states of the same metal have vastly different preferred ligand sets) and to the metal ion concentration (related to the strength of binding). These sensors can also be sensitive to the coordination environment of the metal being probed.
Fluorescent metal sensors may operate reversibly in equilibrium, or irreversibly (Fig. 5a and b). The reversibility is arguably one of the greatest advantages of fluorescent sensors, enabling the imaging of metal flux within living cells over time (see Section 4.4). More recently, reaction-based metal sensors are being widely applied.19 In such a system the metal selectively catalyses a reaction of the sensor, eliciting change in fluorescence. Reaction-based probes are common for the detection of organic molecules, such as reactive oxygen species. While reaction-based sensors of metal ions cannot be used to monitor metal fluxes over time, they do have particular value in capturing transient changes in metal levels, or in sensing of very low metal concentrations that may lie below the detection limit of other direct imaging techniques.
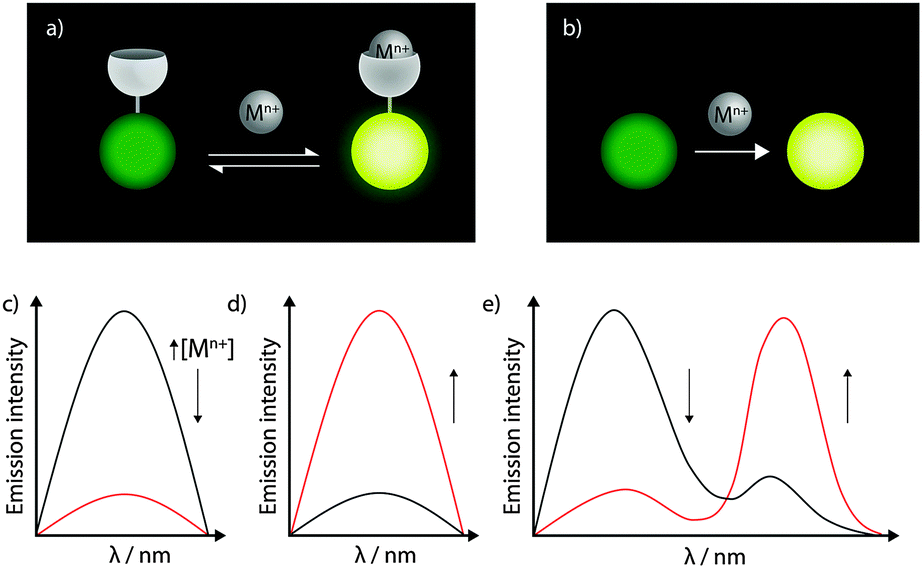 | ||
| Fig. 5 Fluorescent metal sensors may be based on reversible coordination events (a) or irreversible metal-mediated reactions (b), and can signal the presence of metals by a turn-off in intensity (c), a turn-on in intensity (d), or a ratiometric change (e). | ||
Both reversible and reaction-based metal sensors can elicit a number of different fluorescence responses according to changes in the emission intensity or wavelength (Fig. 5c–e). Intensity-based probes are those in which the fluorescence emission of a single peak changes. Such a change may be a decrease in intensity (for a ‘turn-off’ probe), for which the absence of probe or the presence of analyte cannot be distinguished. Alternatively, in the presence of an analyte ‘turn-on’ probes increase in fluorescence intensity. ‘Turn-on’ data are easier to interpret, though all intensity-based probes are subject to interference from environmental effects, most notably probe concentration and pH. By far the most robust information can be gained from colour-based, or ratiometric, probes, in which the analyte induces differential changes in more than one emission peak. By measuring the ratio of peak intensities, other factors such as probe concentration no longer need to be considered. Ratiometric probes are most easily developed by tethering a metal-responsive to a metal-insensitive fluorophore serving as the control peak, but some elegant single-fluorophore ratiometric systems have also recently been reported.20 Furthermore, metal binding may also alter emission lifetimes of fluorophores, and there is great potential for simultaneous measurement of fluorescence emission and lifetime in reporting on metal-binding events.
In the design and evaluation of metal-responsive fluorophores, a number of factors must be considered. The fluorescence output and any ratiometric changes must be measurable at the resolution of the microscope. Longer excitation and emission wavelengths, generally towards the red-infrared region, are preferable to minimise cellular damage upon excitation and to enable greater penetration of light through tissue. Furthermore, excitation peaks should lie close to commonly used monochromatic laser wavelengths. Metal-responsive fluorophores must, in both their binding and fluorescence response, be highly selective for the target metal and oxidation state, and the response should be minimally influenced by pH or ionic strength. For each metal sensor, the binding affinity should be assessed, as it must be tuned to the particular biological question being addressed. Fluorescent sensors with very weak binding affinities will only be able to bind to free or very weakly bound metal, while those with strong binding affinities may sequester metals that are tightly bound to proteins. The ability to tune binding affinities, and therefore provide sets of analogous probes of varying binding strengths, is highly advantageous in the study of metals in biology, presenting a more targeted approach for assessing specific biological conditions.
With fluorescent metal sensors in hand, many valuable observations can be made about the roles of redox-active metals in biology. Fluorescent metal probes are routinely applied to biological systems, and detected using confocal microscopy and flow cytometry (sorting or counting of cells), although the overwhelming majority only examine exogenously-added metals, rather than detecting endogenous metal pools.21 While most studies use cultured cells, sensors can also be applied to tissue slices. A consideration for the use of chemically fixed sections is to ensure that probes do not leak out of permeabilised cells. An important next step will be to establish clear and robust protocols for applying fluorescent metal sensors in studies of model organisms such as nematodes, zebrafish and small mammals. Recent reports of near-infrared emitting sensors have enabled sufficient tissue penetration for studies in mice.22 Despite the promise of metal-responsive probes, there tends to be a disconnect between the chemists who develop these sensors and the metal biologists who apply them. Detailed biological studies have tended to use probes developed decades ago, which certainly do not represent contemporary advances fluorescent sensor chemistry. In order to harness the potential of the next-generation probes being developed, it is essential that there is more communication between those who make and those who use these tools.21
3. Protein–metal association: new approaches and new challenges
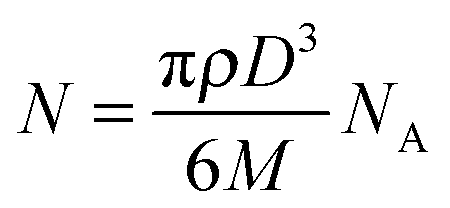
Metal ion function in biology is typically determined by the ligands to which it is bound. Thus, like alignment of metal images with cellular structures, there is also a need to identify spatial relationships between metals and the proteins with which they associate. This is possible by adapting existing immunohistochemical (IHC) protocols to replace traditional conjugated fluorophores with unique metal labels, making use of the sensitivity of MS-based techniques to specific isotopes and elements. Like immunofluorescence, this approach can be either ‘direct’, where the metal tag is chemically linked to a primary antibody; or ‘indirect’, using a labelled secondary antibody raised against the primary host. The MaxPar® reagent range (Fluidigm) uses isotopically-enriched rare earth elements (REEs) that can be conjugated to primary antibodies via a polymer that links with the immunoglobulin by maleimide-induced disulfide reduction. Pre-labelled antibodies can be purchased as part of application-specific panels, or alternatively primary antibodies may be labelled using REE pre-linked polymers, of which 34 different isotopes are currently available. These reagents have become available following the introduction of the CyTOF ‘mass cytometry’ system; an ICP time-of-flight (TOF)-MS design that is capable of simultaneously resolving up to 100 individual isotopes. Marketed as an alternative to fluorophore-based flow cytometry, primary antibody labelling using REE-tagged antibodies and CyTOF detection is attractive. This approach avoids the significant crossover of emission spectra that restricts immunofluorescence protocols to 7 fluorescent reporters, and thereby antigens, that can be simultaneously visualised. Giesen et al.7 recently used the aforementioned laser ablation ‘tube cell’ design (Section 2.1.1) coupled to a CyTOF to simultaneously image 34 antigens labelled with REE-tagged antibodies in a single experiment. The cell design and fast scanning capabilities of the TOF-MS produced images with a spatial resolution of 1 μm that were used to profile protein expression in human breast cancer samples. Similarly, imaging of 10 REE-tagged primary antibodies has also been achieved using the NanoSIMS 50L system with a 16O− ion beam at a 200–300 nm resolution.23Compared to primary antibody labelling, indirect detection using secondary antibodies with metal tags restricts the numbers of antigens that can be multiplexed, limited by the species-specific Fab (antigen binding) regions to which the secondary antibody is sensitive. However, a secondary labelling approach is advantageous over primary antibody labelling for a more targeted approach. It is estimated that a single count detected by the CyTOF represents 25000 atoms of an REE tag. The imaging method of Giesen et al.7 (reflective of the current state-of-the-art with regard to laser ablation technology), therefore produced images with a limit of detection of 6 counts, or 150000 atoms per pixel. A single REE-labelled primary antibody contains approximately 120–160 REE atoms,25 thus a 1 μm2 area must contain around 1,000 labelled primary antibodies to be detected. Alternatively, commercially available IgG/M secondary antibodies preabsorbed with gold nanoparticles can be used to visualise low concentrations of antigens less sensitive to REE-labelled primary antibodies. For instance, the number of gold atoms in a 10 nm diameter nanoparticle can be roughly estimated using:
 | (5) |
000 gold atoms. Thus, secondary labelling has the effect of amplifying signal intensity, which is further enhanced through binding of multiple labelled secondaries to each primary antibody. Larger (50 nm) gold nanoparticles have also been used to directly label human macrophages for LA-ICP-MS imaging, with confirmation that a single cell could hold over 3 × 10⁹ gold atoms with no loss of viability.26 Nanoparticle labelling may be employed for sensitive analysis of biomolecules at low abundance, and possible correlative studies with endogenous metals.
The major limitation of the CyTOF instrument is its inability to detect analytes below 80 amu (which nearly all biologically relevant elements fall) due to significant space-charge effects of the ion beam in the flight tube. Thus, co-localisation of endogenous metals with a specific protein requires the use of more traditional detection techniques, such as more sensitive quadrupole and sector-field ICP-MS designs combined with a more targeted approach that labels fewer antigens using secondary antibodies. Signal enhancement via reduction of metallic silver onto gold nanoparticle-labelled antibodies can be used to image co-localisation of endogenous metals with a specific protein target.27 The luminescence properties of lanthanides, including europium, samarium and terbium are often used as secondary antibody tags for enzyme-linked immunosorbent assays (ELISA; a widely-used REE-tagged antibody system for quantitatively measuring proteins), and these could also be adapted for LA-ICP-MS and SIMS imaging.
In order to monitor every aspect of metal metabolism, it is necessary to adopt a multiplexed imaging approach, in which multiple known proteins associated with a specific metal function can be visualised, as well as the endogenous metal itself. In Fig. 6, we propose a dual-system approach, where detection of antibodies as either nanoparticle or REE-labelled reagents are used for profiling metabolic factors involved in cellular metal trafficking. Detection of labelled antibodies would be achieved using a CyTOF, and simultaneous online detection of endogenous metals performed via ICP-Q-MS. Like many applications of LA-ICP-MS, this concept is adapted from the geosciences, in this case described by Yuan et al.,24 who used a sector-field MC-ICP-MS with online ICP-Q-MS to simultaneously determine uranium-lead isotopic ratios (with the MC-ICP-MS) and trace metal concentrations (with the ICP-Q-MS) in zircons. Ablated material is split by a Y-piece leading to either instrument, mixed with an additional helium and argon makeup gas in a cyclonic aerosol homogeniser and fed into the respective plasma ion sources. To align images produced by each MS and correct for variation in image resolution as a factor of MS integration time, a landmark feature, or fiducial marker apparent in images obtained from both systems must be produced. Frick et al.28 recently described the use of (η5-pentamethylcyclopentadienyl)-iridium(III)-dipyridophenazine; a DNA intercalator as a potential internal standard for quantitative IHC imaging using REE-labeled antibodies. Labeled with an iridium-193 isotope detected by each ICP-MS instrument, this DNA intercalator would provide a fiducial for image registration encompassing all tissue boundaries. Registration would then be a relatively simple task, regularly performed in several programing environments, including R, IDL, IgorPro or Python. For use as an internal standard, as suggested by Frick et al., the high spatial resolution achievable using the ‘tube cell’ design is in fact a limiting factor, as localisation of the intercalator to the nucleus would not provide the homogeneity required at <5 μm resolution. For high spatial resolution subcellular imaging by XFM, a similar approach used titanium oxide nanoparticles conjugated to DNA oligonucleotides to specifically mark cell nuclei and mitochondria and contrast with regional endogenous metal concentrations.29
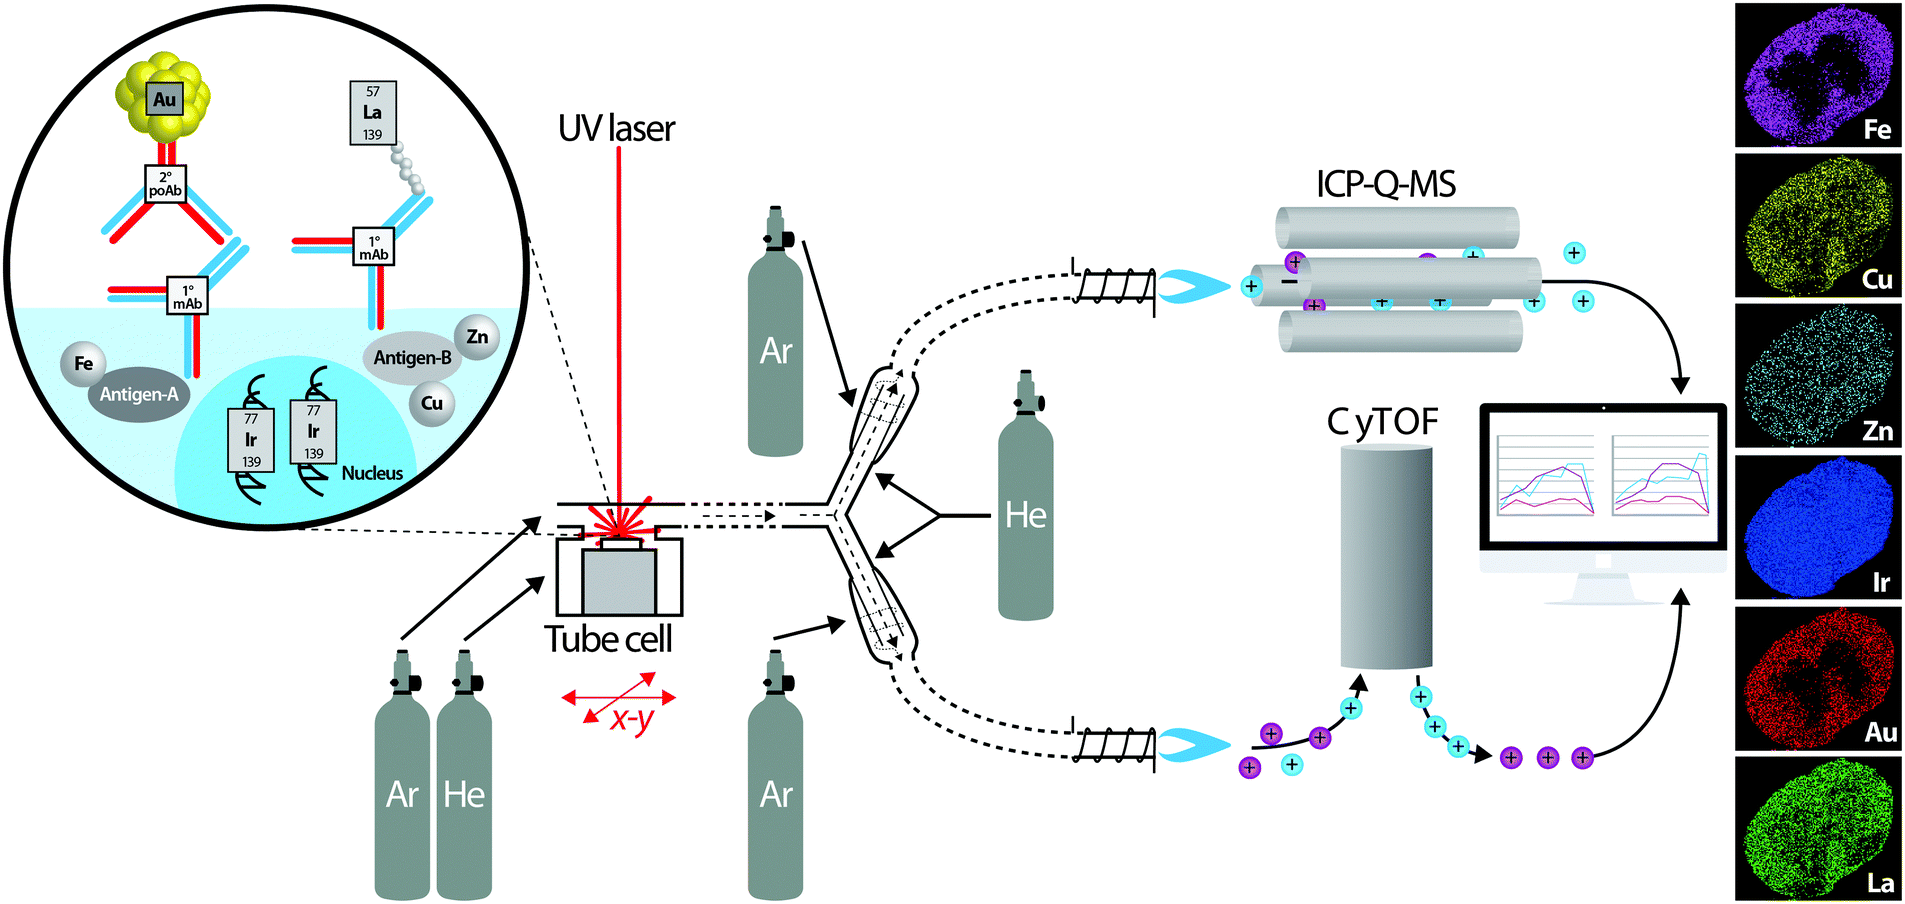 | ||
| Fig. 6 Schematic of proposed simultaneous quadrupole ICP-MS and CyTOF system for imaging spatial distribution of metal-tagged antibodies and endogenous metals. The concept is adapted from Yuan et al.24 who used a similar experimental design for simultaneous isotopic measurement of uranium, lead and hafnium isotopes by MC-ICP-MS and trace elements by ICP-Q-MS in zircon samples. A UV laser (excimer or Nd:YAG) ablates a sample mounted in the fast-scanning tube design ablation cell described by Wang et al.8 which uses a mixture of helium and argon to sweep material to a Y-piece. Here, the ablated material is equally directed towards two cyclonic aerosol homogenisers, using makeup helium and argon flows. Metals from antibody tags (m/z > 80) are detected by the CyTOF, and endogenous metals are analysed using ICP-Q-MS. In post-processing, distribution of iridium from a labelled DNA intercalator as a marker of tissue boundaries measured using both systems is used to align images and co-localise protein markers with native metal concentrations. | ||
4. Higher dimensionality: time, space and spectroscopy
The constant demand to obtain more information from metal imaging techniques have made sensitivity, spatial resolution and specificity the main drivers of emerging and improved analytical technology. Here we consider four major research directions that are impacted by improving technology: (i) scan speeds; (ii) three-dimensional (3D) imaging; (iii) imaging of the biological coordination environment; and (iv) assessing changing chemical conditions over time.4.1 Reducing analysis time
A number of challenges can limit the speed at which an image is collected. For constant signal strength, reducing the time spent collecting data will merely limit the total collected signal. Instead, increases in acquisition speed must follow improvements in signal strength.The fundamental physics behind the identification and quantification of multiple elemental species (regardless of the mode of detection) often necessitates a scanning approach for imaging. The minimum per-step acquisition, or dwell time required for a measurement is always determined by a limitation in the fundamental performance of the probe, the specimen, and the detector. Signal strength is directly proportional to elemental concentration. Some detectors may also be limited by repetition speeds or data transfer and storage requirements. Specimen limitations may include mechanical limitations such as sputtering rates (e.g. SIMS); mass spectrometry and changes in incident energy scan rates (e.g. XANES); mechanical scanning speeds (e.g. the motion of a stage or sample mount); and electronic communication overheads (e.g. large datasets).
For example, until recently the rate of data acquisition in XFM was limited by detector electronics. With per-pixel dwell times of an order of 1 second, studies were limited to low-definition imaging: a 150 × 150 pixel image required over 6.25 hours. Massively parallel hardware such as the Maia 384-detector array30 have increased overall pixel collection rates by addressing detector sensitivity (through increased detector solid angle), detector count rates (through the use of parallel detector arrays) and detector overheads (by moving to an event-mode data acquisition). Fast, efficient detectors provide opportunity for higher-dimensional studies such as XANES imaging (mapping chemical speciation across an extended area, rather than at a small number of discrete locations as previously mentioned in Section 2.2.1) and X-ray fluorescence (XRF) tomography (producing 2- and 3D volumetric reconstructions of elemental distribution).31 Improved detector efficiency also improves the experimental throughput, with reduced acquisition time and reduced X-ray dose to the specimen, the benefits of which are discussed in Section 5.2.
4.2 Three-dimensional imaging and tomography
Two-dimensional projections depicting overlapping 3D structures may inevitably result in ambiguity in interpretation of discrete structures. XRF tomography (see de Jonge and Vogt32 and the references therein) and 3D MS imaging overcomes this limitation and provide an opportunity to fully visualise the spatial distribution of metals in entire biological systems (Fig. 7). For XRF tomography, resolution is limited by the tolerance of the specimen to high doses of radiation. With older generation detectors, tomography required a heavy time commitment; imaging of 10 elements at 400 nm3 resolution in the marine diatom Cyclotella meneghiniania, requiring 240 kilopixels collected over 36 hours.33 Conversely, more recent measurements have capitalised on the Maia to image 8 megapixels in 5 hours, reconstructing metal distribution in a whole Caenorhabditis elegans nematode.34 Most technological challenges preventing the routine application of XRF tomography have been overcome in the past 5–10 years; the most significant remaining challenge is a fast and robust analytical method to correct the effects of re-absorption of X-ray fluorescence by the specimen. In lieu of a correction algorithm, the avoidance of self-absorption places a restriction on the size and composition of specimens that may be analysed; hydrated specimens must be narrower than around 50 μm in diameter to keep self-absorption below 10% for iron fluorescence and the wet-equivalent diameter increases by an order of magnitude in dehydrated specimens. The outlook of XRF tomography with next-generation light sources was recently explored in de Jonge et al.37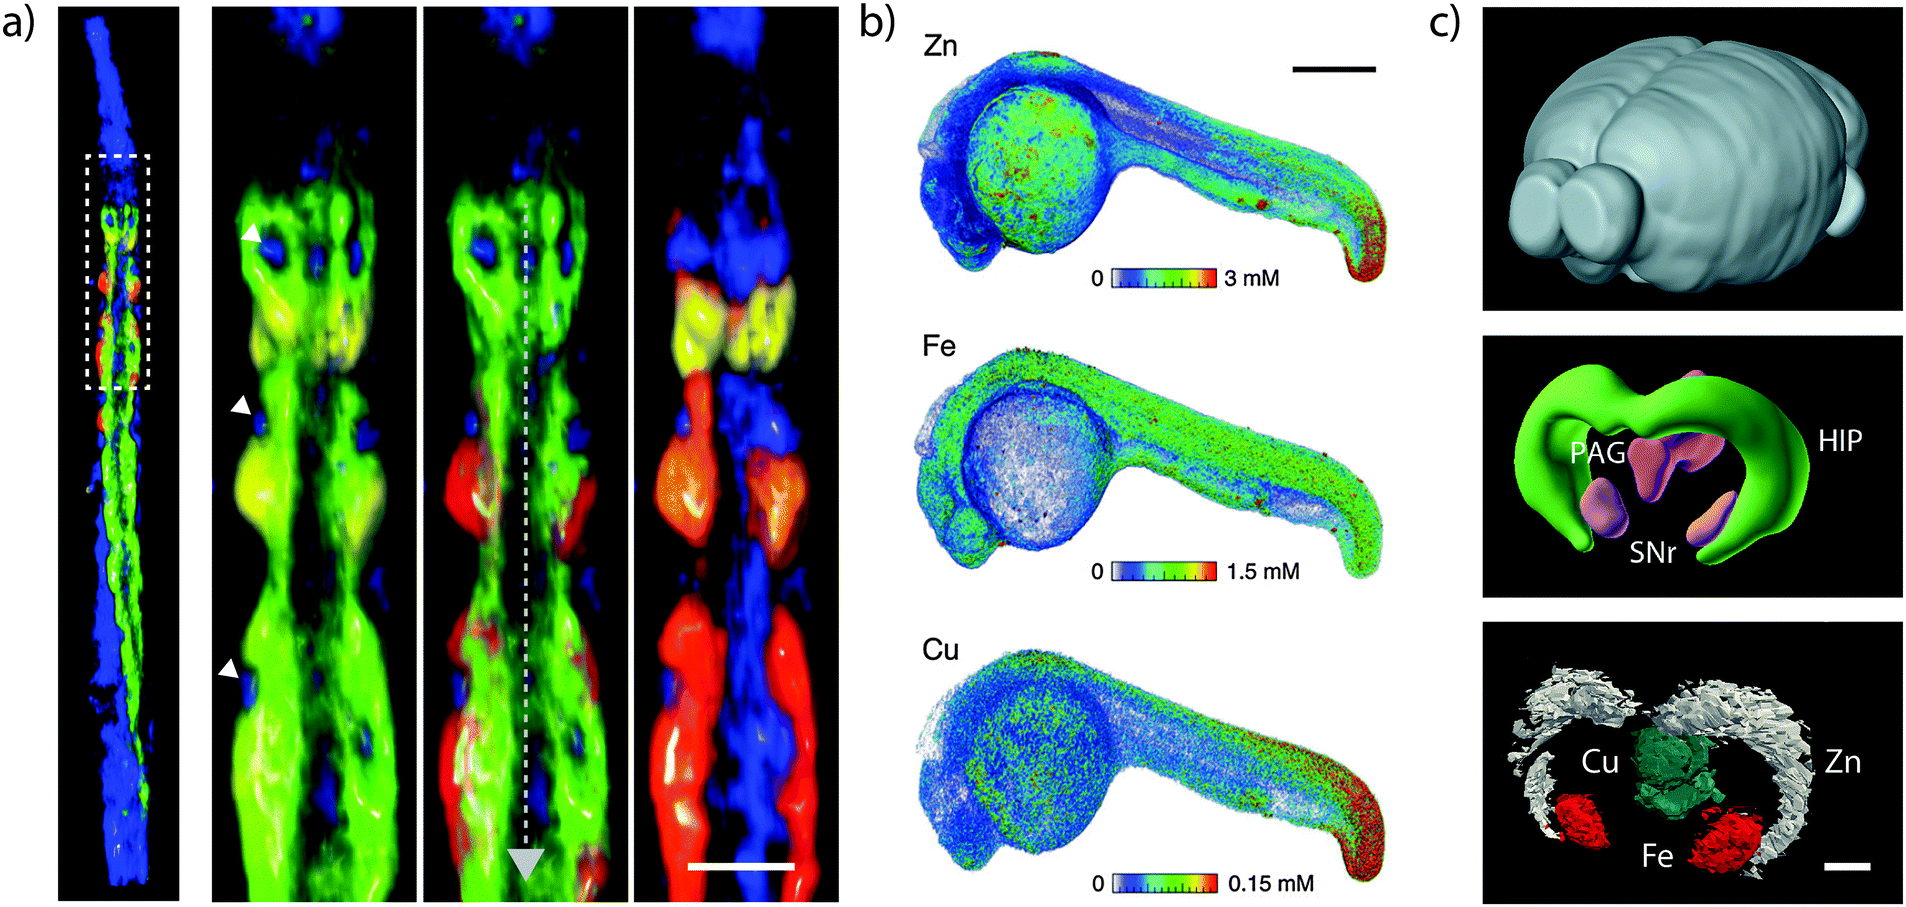 | ||
| Fig. 7 Three-dimensional imaging of metals. (a) XRF tomograph of the anterior portion of lyophilised adult hermaphrodite C. elegans. Inset shows metals in intestinal cells (calcium = yellow; manganese = red; iron = green; zinc = blue). Nuclei are marked with white arrowheads and the intestinal lumen with a grey dashed arrow (scale bar = 25 μm). Adapted from McColl et al.34 (b) Volume reconstruction of XRF tomograph of zinc, iron and copper in Danio rerio (zebrafish) 24- hour post-fertilisation embryo (scale bar = 200 μm). Figure reproduced from Bourassa et al.35 (Copyright 2014, Royal Society of Chemistry) (c) Whole mouse brain (top; for orientation purposes), 3D anatomic reference model (HIP = hippocampus; PAG = periaqueductal grey; SNr = substantia nigra pars reticulata) from the Brain Explorer application provided by the Allen Brain Atlas; and LA-ICP-MS images showing distinct compartmentalisation of zinc (in the HIP); copper (in the PAG) and iron (in the SNr; scale bar = 500 μm). Adapted and reprinted with permission from Hare et al.36 (Copyright 2012, American Chemical Society). | ||
Three-dimensional metal imaging by mass spectrometry (particularly using LA-ICP-MS) uses serial sectioning and imaging through a specimen, and as such has its own unique challenges. Consecutive sections must be accurately registered, or aligned, to build a 3D representation. Unlike tomography, where the sample is rotated about a single axis, the changing sample morphology and minor changes of sample orientation on the slide mount requires a more comprehensive approach to alignment. Manual registration of consecutive sections is possible using custom-built software,36 though this is prone to user bias. Simple affine (from the Latin affinis, meaning ‘connected with’) registration can reduce potential error when stacking consecutive sections with similar morphology (edge features, such as a comparatively narrow width or a uniform shape) is maintained along the z-axis. The development of registration methods that avoid user bias and can interpolate between sections with changing edge features is essential for the production of true 3D representations of metal distribution in biological systems. Regardless, using LA-ICP-MS has significant advantages, including the capacity to image much larger biological structures due to the negation of self-absorption issues; inherent high sensitivity; accessibility (i.e. not restricted by access to synchrotron light sources); and the potential for employing isotope-tracing studies outlined in Section 2.1.3.
4.3 Imaging coordination environments
Chemical state is integral to biological function, and so accurate measurement of chemical state is also integral to understanding metal biochemistry. In theory, fluorescent probes should be able to be designed to discriminate between coordination environments, but this is yet to be realised for essential metals. In the X-ray imaging context, examination of XANES with comparison to known chemical standards enables classification of the chemical states of a metal. As mentioned previously, the necessity for XANES measurements of over 100 energies has prohibited application to imaging; investigations instead tend to take only multiple point samples following XFM imaging. While such measurements certainly provide unique insight, they can also be affected by an observer bias. For example the tendency to perform XANES on the most highly concentrated part of the specimen frequently overlooks the large, lower concentration parts of the sample that can represent the dominant chemical species. Capitalising on the high pixel acquisition rates of next-generation detectors, XANES imaging can now be used to map an entire region at each of a series of energies across an absorption edge, and the resulting hyperspectral image of XANES spectra can be interrogated using statistical techniques. By sampling a wide area, XANES imaging may determine spectral similarity and dominant components, free of potential observer bias. Such an approach identified distinct anatomical regions of changing iron chemistry in live, hydrated C. elegans as they aged. In this system, the intensity of iron edge transitions provided a means for quantifying the Fe(II):Fe(III) ratio, and these showed a clear shift towards accumulation of Fe2+ during senescence, which was further supported by assessment of the spatial distribution of pre-edge features (shown in Fig. 8).38 Using this approach of XANES and XFM imaging to assess changing metal concentration and distribution moves further towards the pursuit of improved specificity, sensitivity and spatial resolution.
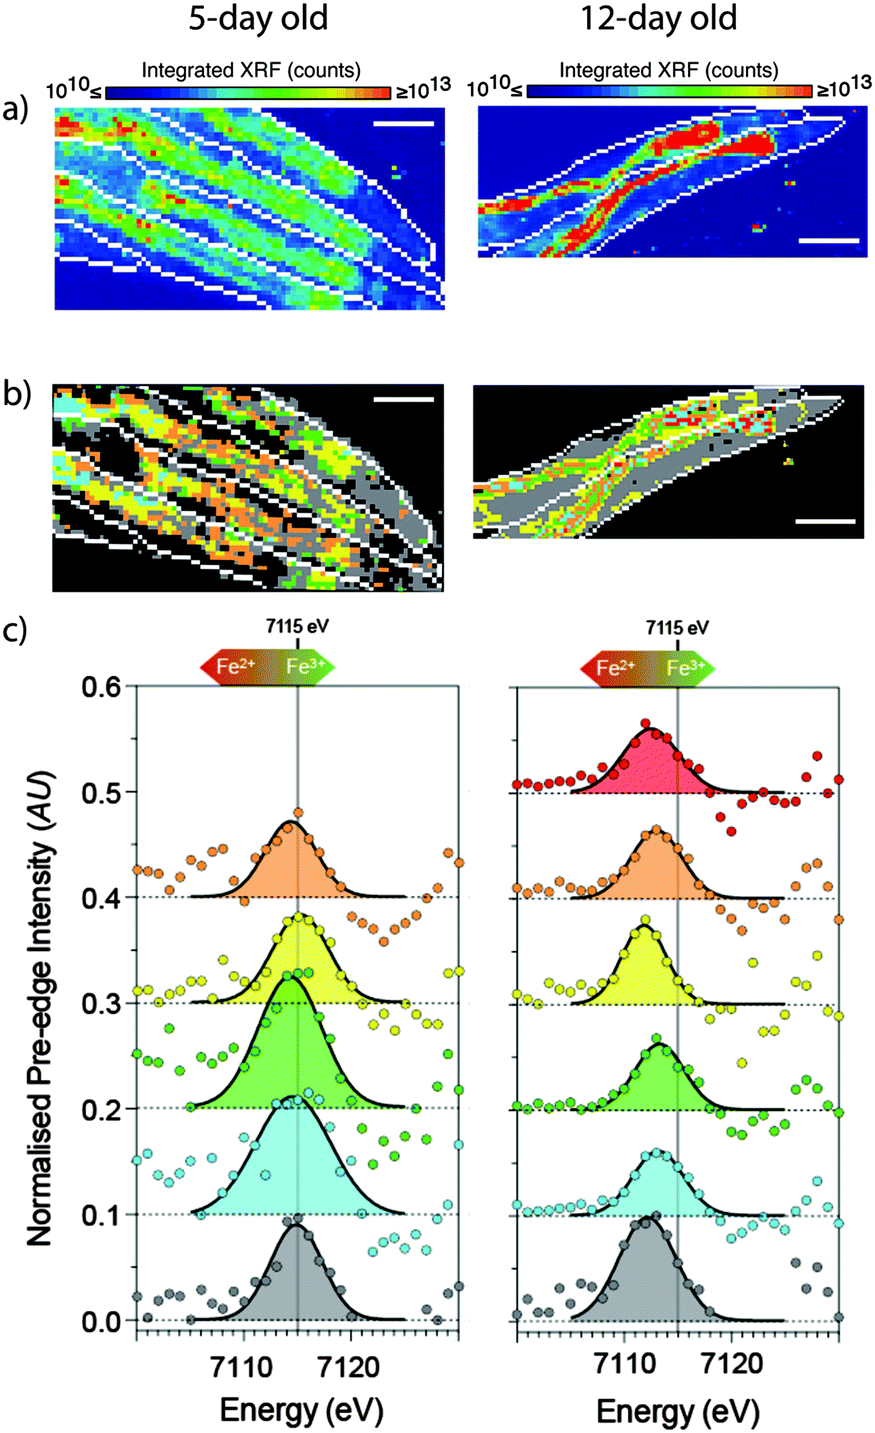 | ||
| Fig. 8 XANES imaging of young (5- day) and aged (12- day) live, hydrated C. elegans. (a) Standard XFM imaging revealed a general redistribution and accumulation of iron in the aged worms to the intestinal cells. (b) Spatial distribution of specific regions of interest (ROIs) according to k-means clustering revealed 5 distinct ROIs in young, and an additional 6th ROI in aged animals. (c) The extracted 1s → 3d pre-edge features (after subtraction of intensity due to the rising edge) show systematic changes in both centroid energy and intensity with the ratio of Fe3+/Fe2+. The raw data and fits are superimposed to emphasize the quality of the fits from which the centroid values were determined. The extracted pre-edge (circles) and Gaussian components of the fit (solid black lines) are shown for each ROI. Scale bar = 100 μm. Young animals were exposed to 6 MGy, and old animals exposed to 12 MGy. Figure is adapted from James et al.38 (Copyright 2015, Royal Society of Chemistry). | ||
4.4 Novel imaging applications of fluorescent sensors
Confocal microscopy techniques provide access to a range of technologies that, whilst beyond the scope of this Tutorial Review, dramatically expand the capabilities of fluorescence sensors for studying cellular metal distribution in three dimensions, as well as over time. The review by Domailie et al.39 provides an overview of how confocal microscopy has been applied to metal sensing.Since confocal microscopy enables high axial and lateral resolution without the need for sectioning, 3D images can be easily generated and are restricted only by the limited penetration of visible light through the tissue, much like self-absorption effects of thicker samples impeding XFM analyses. Additionally, advanced software tools, such as Amira (FEI) can be used to reconstruct multiple 3D images of fluorescence probes in complex cellular architectures, constructing a system-wide picture of metal distribution and chemical state.
Fluorescent probes and their compatibility with living cells provide the best opportunity to observe a response effect of a metal in real time. Combined with high-resolution confocal microscopy, metal-selective sensors offer a unique opportunity for temporal resolution; each fluorescence image can be acquired in seconds and the metal-probe binding equilibrium can be used to study changes in metal pools over time. Crucially, the capacity to measure flux of metals between the labile and protein-bound metal pools enables analysis of time as an additional dimension.
5. Observer effect: sample preparation and measurement disruption of metal chemistry
The delicate chemical balance in an organism is easily disturbed; be it by the post mortem interval, the conditions under which it is prepared for analysis, or the methods used to observe it. It is extremely difficult to be certain that the chemical environment within a cell is a true representation of normal physiology unless it can be assured the cell is functioning and alive, and even then some uncertainties remain. Each step of the analytical process, and even the sample type itself, contributes some degree of uncertainty. Whilst these effects may seem insignificant, they can compound and interfere with the desired analysis.It is worthwhile taking a practical attitude to potential chemical disruption of a sample. Ultimately, this ‘damage’ must be defined as any alteration of the specimen that compromises the fidelity of the derived information. Therefore, the criteria for chemical disruption (i.e. damage) of a sample will depend on the information sought. There is no universal standard for this artefact; LA-ICP-MS, for instance, is destructive, but if the ablated regions do not overlap or cross-contaminate, then the approach may be free of damage artefacts within discrete regions of the sample. Alternately, extended exposure to ionising radiation might not exhibit visible damage, but may cause significant chemical disruption within the region analysed.
5.1 Sample preparation
The Achilles' heel of any experiment seeking to image elemental distribution is the prevailing uncertainty introduced by the frequently unavoidable steps required for sample preparation. Within the context of metal imaging, where highly energetic lasers, plasmas and beams of light hotter and brighter than the sun are used to stimulate often-miniscule events in thin cut sections, true in vivo measurements are not possible. Advances in magnetic resonance imaging (MRI), such as T2* relaxation tomography may permit relative measurements of iron accumulation in situ, but it does not rival the techniques described here with regard to micro- and nanoscale imaging. Traditional light microscopy and metal-specific stains have been the clinical mainstay for assessing metal accumulation for over a century (a brief overview is included in the review by McRae et al.4), though there is significant potential for post mortem and procedural artefacts during the extensive chemical preparation typically required. Recent refinements to these techniques, including a novel approach using in vivo perfusion of Perls and Turnbull's reagents that are specific to non-haem iron (see Meguro et al.40 and the references therein) do, however, demonstrate that these established techniques still have a place in contemporary metal imaging alongside those discussed in this Tutorial Review.The many preparative techniques used for the IHC methods outlined in Section 3, as well as general sample preparation strategies employed in metal imaging experiments are potential sources of error or contamination. Frozen sectioning of tissue typically uses fixatives and cryoprotecting agents to preserve cellular structures and reduce cutting artefact, and these processes can have dramatic effects on tissue metal concentration. In whole mouse brains, a three-step fixation and cryoprotection protocol resulted in the near-total washout of Group I and II metals, as well as a 27–32% loss of total iron, copper and zinc levels.41 It is unclear if this procedure is solely affecting total metal levels or also causes metal redistribution; LA-ICP-MS imaging of the mouse midbrain, which underwent the same three-step preparative process, showed no significant loss of iron content when compared to paired fresh frozen samples taken from the alternate hemisphere of the same animal.27 Hackett et al.42 convincingly demonstrated that cut brain sections left in 10% neutral buffered formalin for 12 hours leached amino acids, carbohydrates, lipids, phosphates, proteins and Cl− and K+, the latter two assessed by μPIXE imaging. Additionally, in contrast to the aforementioned loss of iron, copper and zinc following immersion of whole brains, these metals were shown to transfer from the fixative to the cut tissue section. There is no doubt, however, that exposure to fixatives like formalin should be approached with due caution because of the unpredictable effects they may have on not only metal concentration, but also the oxidation state of chemical species of interest.
Immunohistochemistry preparation protocols also introduce significant potential for either contamination or loss of elements, through cell permeabilisation, non-specific epitope blocking and prolonged immersion in solutions of antibodies. In light of the effects described by Hackett et al.42 (though it is pertinent to mention that IHC protocols typically expose cut sections to paraformaldehyde for cell permeabilisation for less than 60 seconds), a detailed study on metal loss and/or redistribution in cut sections undergoing immunolabelling is necessary. A comparative study of cryogenically-fixed, lyophilised cells and samples prepared according to typical IHC protocols by XFM revealed significant loss of Group I and II metals (attributable to their high water solubility), and reduction in cellular manganese, copper and zinc (though surprisingly not iron) levels in the IHC-prepared group.12
Across all techniques capable of imaging tissue sections, dehydration of tissue prior to analysis can significantly change sample thickness and density. For example, the density of neurological tissue decreased by more than 75% prior to μPIXE imaging.43 The influence this has on subcellular metal distribution is not clear, although preservation of calcium (which exists primarily as free Ca2+) was maintained, at least at a 2 μm image resolution of neurological tissue.43
5.2 Measurement effects
The effect of the analytical technique on metal chemistry and concentration is another consideration that should, but is not always, adequately considered. As opposed to sample preparation steps, which are often common across multiple analytical methods, measurement effects must be considered in the context of the technique itself.For destructive techniques, such as LA-ICP-MS, mitigating potential measurement effects primarily requires that robust quantification strategies are in place: the physical transport of ablated material from a biological matrix through transport lines, into an 8000 K plasma and from atmospheric pressure to a near-vacuum introduces significant potential for analytical bias and error. For a comprehensive guide to quantification strategies see the review by Hare et al.44 Numerous novel approaches have been described, validated and implemented, though there is still much conjecture and disagreement regarding a truly universal calibration and quantification protocol. Matrix-matching of appropriate standard materials is perhaps more important in LA-ICP-MS than any other analytical technique for visualising metal distribution, working under the assumption that only a standard with a similar chemical matrix can provide accurate quantification of metal levels. Signal normalisation, as discussed in Section 3 within the context of IHC imaging, and here as a means to account for variable laser power output and sample transport efficiency has also been the subject of some debate. From the suitability of using endogenous isotopes such as carbon-13 to the deposition of samples on thin films containing exotic metals such as gold and ruthenium, there are multiple approaches available.
An important question regarding experimental design across all techniques that measure total metal levels is the significance of analytical accuracy when comparing metals between experimental groups. Metal levels in biology are heavily dependent on numerous environmental factors, and a ‘standard model’ of metal concentrations in any biological system not only is impossible to define, but also is impractical. In this case, analytical precision is the more important factor, and thus an appropriate means to standardise measurements, be it simply by a single reference material, may often be sufficient to identify trends between experimental groups. For example, a pressed bone meal standard was combined with signal normalisation to calcium-43 to observe both inter- and intrasample variation in barium and strontium levels in teeth. By using a comparative matrix (both predominately hydroxyapatite), differences in barium levels between experimental groups of breast and formula fed infants could be discerned and translated into determining the length of time a Middle Palaeolithic juvenile Neanderthal was breastfed.45
Techniques typically referred to as non-destructive, including EDS, XFM and μPIXE, may still result in chemical disruption resulting from the incident microprobe that is not visually apparent in the sample morphology. Subsequent analysis using microscopy to correlate metal images with structural features may be spurious if the primary analysis has caused measurement damage. All microprobe measurements obtain a greater statistical precision with increased exposure; however, at some level the effects of radiation damage outweigh these improvements, disrupting the very structure and chemistry that is under investigation. As a result, gains to the experimental efficiency are critically desired, as these improve signal without increasing radiation dose. Following our earlier definition of damage as any effect that compromises the fidelity of the derived information, we note that the criteria for damage are more stringent for studies that map chemistry compared to those that map elements. Additionally, the damage threshold for individual elements may be quite different, potentially due to the strength of ligands to which they are bound (according to the Irving–Williams series) or the type of covalent bond formed (e.g. iron versus selenium). In XFM, including XRF tomography, only the position of the atoms needs to be maintained, so any preparation that is capable of fixing the atoms in their original locations is sufficient. In contrast, the requirements for XANES imaging include preservation of both position and chemical coordination. Hard X-ray exposure results in bond-breakage through photoionisation and thermalisation of high-energy photoelectrons within the specimen. Cryogenic (around 100 K) preservation of samples during analysis has been shown to allow exposure of up to 1.4 × 10⁹ Gy, though longer exposures produced structural ‘beam burn’ visible in ptychographic images.14 The stability of chemical state has been maintained up to 109–1010 Gy, with validation via repeated, fast XANES scans.46 Neutze et al.47 proposed that the hard X-ray ‘damage limit’ for biological samples was 200 photons per Å2 to ensure maintenance of the structural integrity of biomolecules. Although the principle of radiation damage in chemical systems has long been appreciated, we are yet to develop a clear picture of the relationship between radiation exposure, specimen presentation, and chemical damage, and it may be that detailed models of the probe–specimen interaction are required in order to appreciate the complexity of this issue. At present, however, simple measures of specimen integrity provide broad guidelines for exposure limits.
Hard X-ray beams also cause hydrolysis of water, which itself can form reactive species that can impact the regional chemical environment. Cross-linked specimens are likely to be slightly more robust in this regard due to increased matrix density, and dehydrated specimens more so due to the absence of water as a mobile phase to facilitate redistribution of metals, or as a source of reactive species that disrupts redox chemistry. However, both dehydration and chemical cross-linking assumes an intrinsic level of specimen damage, with changes in morphology and metal composition apparent to a greater or lesser degree, depending on the detailed preparation methods. Frozen hydrated imaging appears to offer the ‘best’ (i.e. minimally disrupted) preparation and stabilisation method, though again should be considered on an application-specific basis. For example, XFM of total calcium, manganese, iron and zinc levels in live, hydrated C. elegans were compared with plunge-frozen and lyophilised samples, showing no significant difference in metal levels nor distribution observable at 2 μm spatial resolution,48 although disruption effects have not yet been investigated at the subcellular level. The fact that C. elegans appear to be able to withstand significant radiation dosage and are amenable to imaging whilst anaesthetised would suggest that any potential artefact arising from sample preparation protocols may be minimised. An example of 2 μm imaging of several metals in live, hydrated C. elegans is shown in Fig. 9.
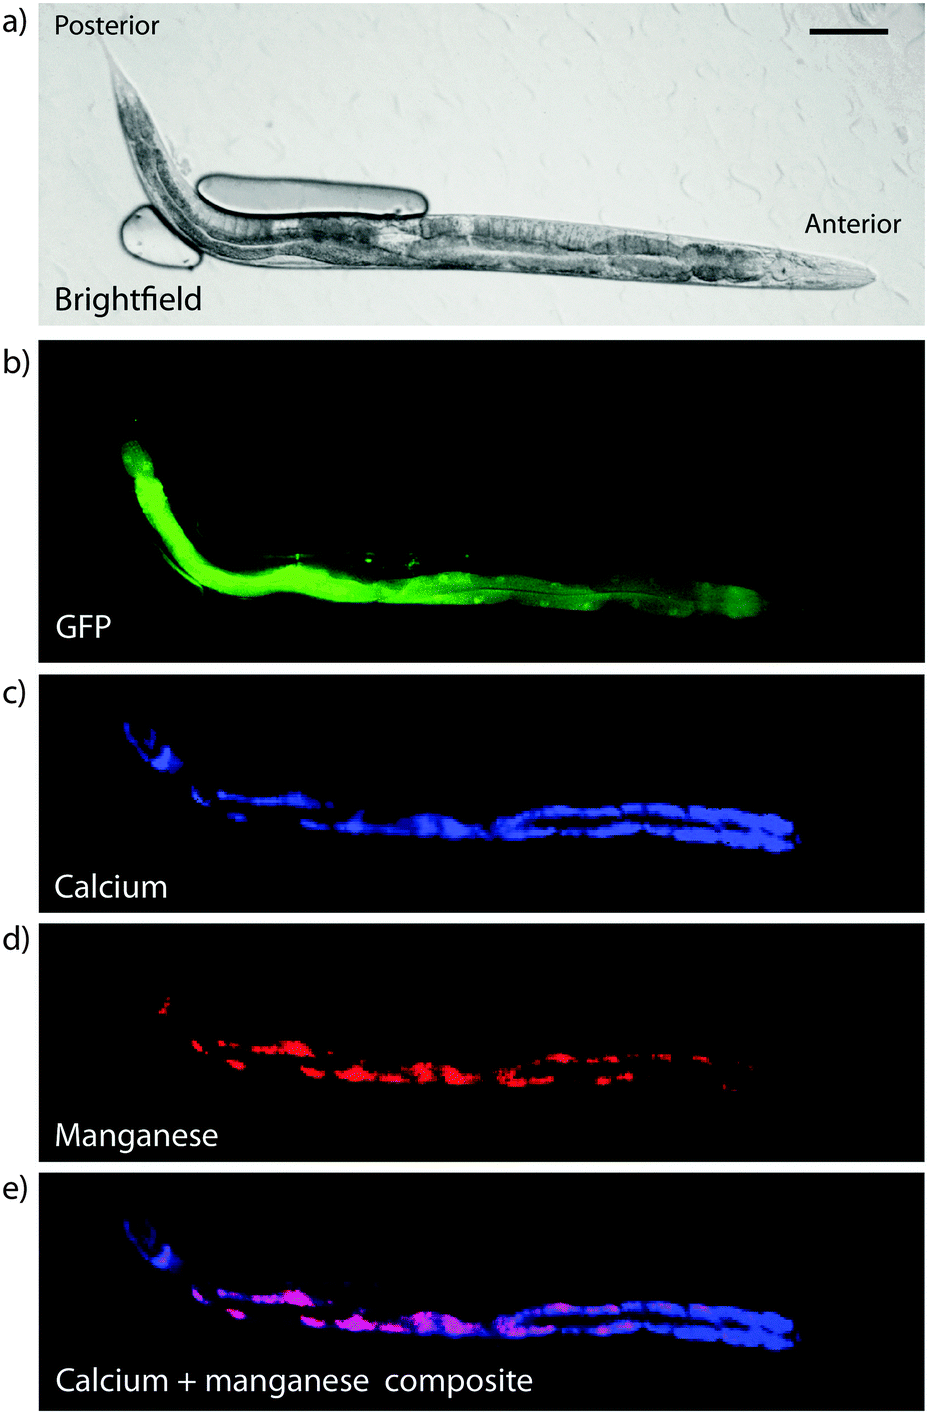 | ||
| Fig. 9 X-ray fluorescence micrograph of hydrated C. elegans. (a) Brightfield microscopy image of anaesthetised adult hermaphrodite and (b) corresponding intestinal green fluorescent protein, with XFM images of calcium (c), manganese (d) and overlay (e), showing partial co-localisation of calcium and manganese in the intestine (scale bar = 100 μm). Total radiation dose was 81 kGy. Note that due to incomplete immobilisation of the live sample some movement occurred between GFP and XFM imaging, preventing an overlay of these data. | ||
While initial impressions would suggest that SIMS would be destructive, as it uses a highly focused incident energy source to physically eject secondary particles, it in fact has little damaging effect, particularly when used in static mode, and may be amenable to subsequent visual analysis. Dispersion of the ion beam tends to only eject particles from the top 1% of the area of an analysed monolayer, leaving the remainder intact and relatively unaffected by the analytical process (see the review by Lombi et al.49 which also discusses potential artefacts from several techniques used for imaging metals in plant materials). Once again, though meeting the needs for spatial resolution and, to some degree, specificity when one considers the range of small molecules beyond just metals that can be detected by SIMS, sensitivity is something of an issue, because the sputtering of the ion beam and surface ejection/ionisation process is not well understood. Ratiometric measurements and signal normalisation provide some alternatives for standardised measurements, but compared to XFM and LA-ICP-MS achievable detection limits are not well established and are highly element-specific.
For fluorescent metal sensors, the prevailing question that is commonly addressed towards those who develop and use such compounds is that the introduction of a sensor itself can perturb metal homeostasis, particularly through alteration of metal oxidation state or by facilitating metal redistribution between organelles. In reality, highly sensitive probes tend to be used at sufficiently low concentrations (far lower than the pool they are sensing), so it is expected that any effect that they have will be negligible to the system as a whole. Nevertheless, it is essential that clear protocols be established for demonstrating the lack of effect (or otherwise) of a probe on the system; to date, some studies have measured the effect on total metal level (reviewed by Dean et al.50), but a more comprehensive approach should certainly be a priority for chemists and biologists alike. The organelle-marking fluorescent dyes MitoTracker® and ER-Tracker™ both increased cellular iron and copper (though not calcium and zinc) in neuronal cultures measured by XFM,13 though these dyes were used at a comparatively high concentration of 500 nM. Regardless, new probes used for metal sensing should be investigated for possible effects on total cellular metal levels. For now, the best approach is to couple the information gained from studies using fluorescent probes with that gained from complementary studies using other techniques.
6. A unified approach to profiling metal distribution
There is no one approach that adequately satisfies all requirements for true in vivo imaging of metals in their native state. This review has outlined how individual technology can provide information on an application-specific basis, from isotope tracing to track metal movement to XANES imaging for spatially profiling metal coordination environments. The future of visualising metal distribution and chemical state in cells will likely rely upon a unified approach that takes advantage of the numerous technologies available and subsequent advances as they become accessible.In the last few years, several seminal papers have begun applying a complementary analytical approach to studying metal biology, with impressive results. Hong-Hermesdorf et al.10 used fluorescent metal sensors and NanoSIMS to spatially pinpoint copper in specific structures of C. reinhardtii. Further characterisation through genetic manipulation, electron microscopy and point-XANES and extended X-ray absorption fine structure simulations categorically showed this green algae accumulated copper as Cu+ within these structures, which were dynamic in response to zinc deficiency. A similar combination of imaging technology, in this case fluorescent sensors, electron microscopy, EDS, XFM and XRF tomography was used to study the formation and proliferation of zinc sparks in early fertilisation events in real time.51 These are just two examples highlighting how specific advantages of individual techniques can be used in concert to provide a more system-wide assessment of metal biology, and are perhaps the best example of contemporary imaging that show the optimum balance of sensitivity, selectivity and spatial resolution.
Designing a similarly cohesive imaging experiment requires significant planning, and should be approached on an application-specific basis. Fig. 10 shows a hypothetical workflow for imaging using each method described in this Tutorial Review, based on sample preparation steps, possible artefacts arising from the measurement process, and the type of information provided. While it is often impractical, or perhaps even impossible, to employ all imaging methods in a single experiment, the current suite of technology available means that, when developed in line with a measured and reasonable hypothesis, biologists do have at their disposal a very comprehensive arsenal of analytical techniques to address specific questions about metal biology, beyond simply determining where metals are located and at what concentrations.
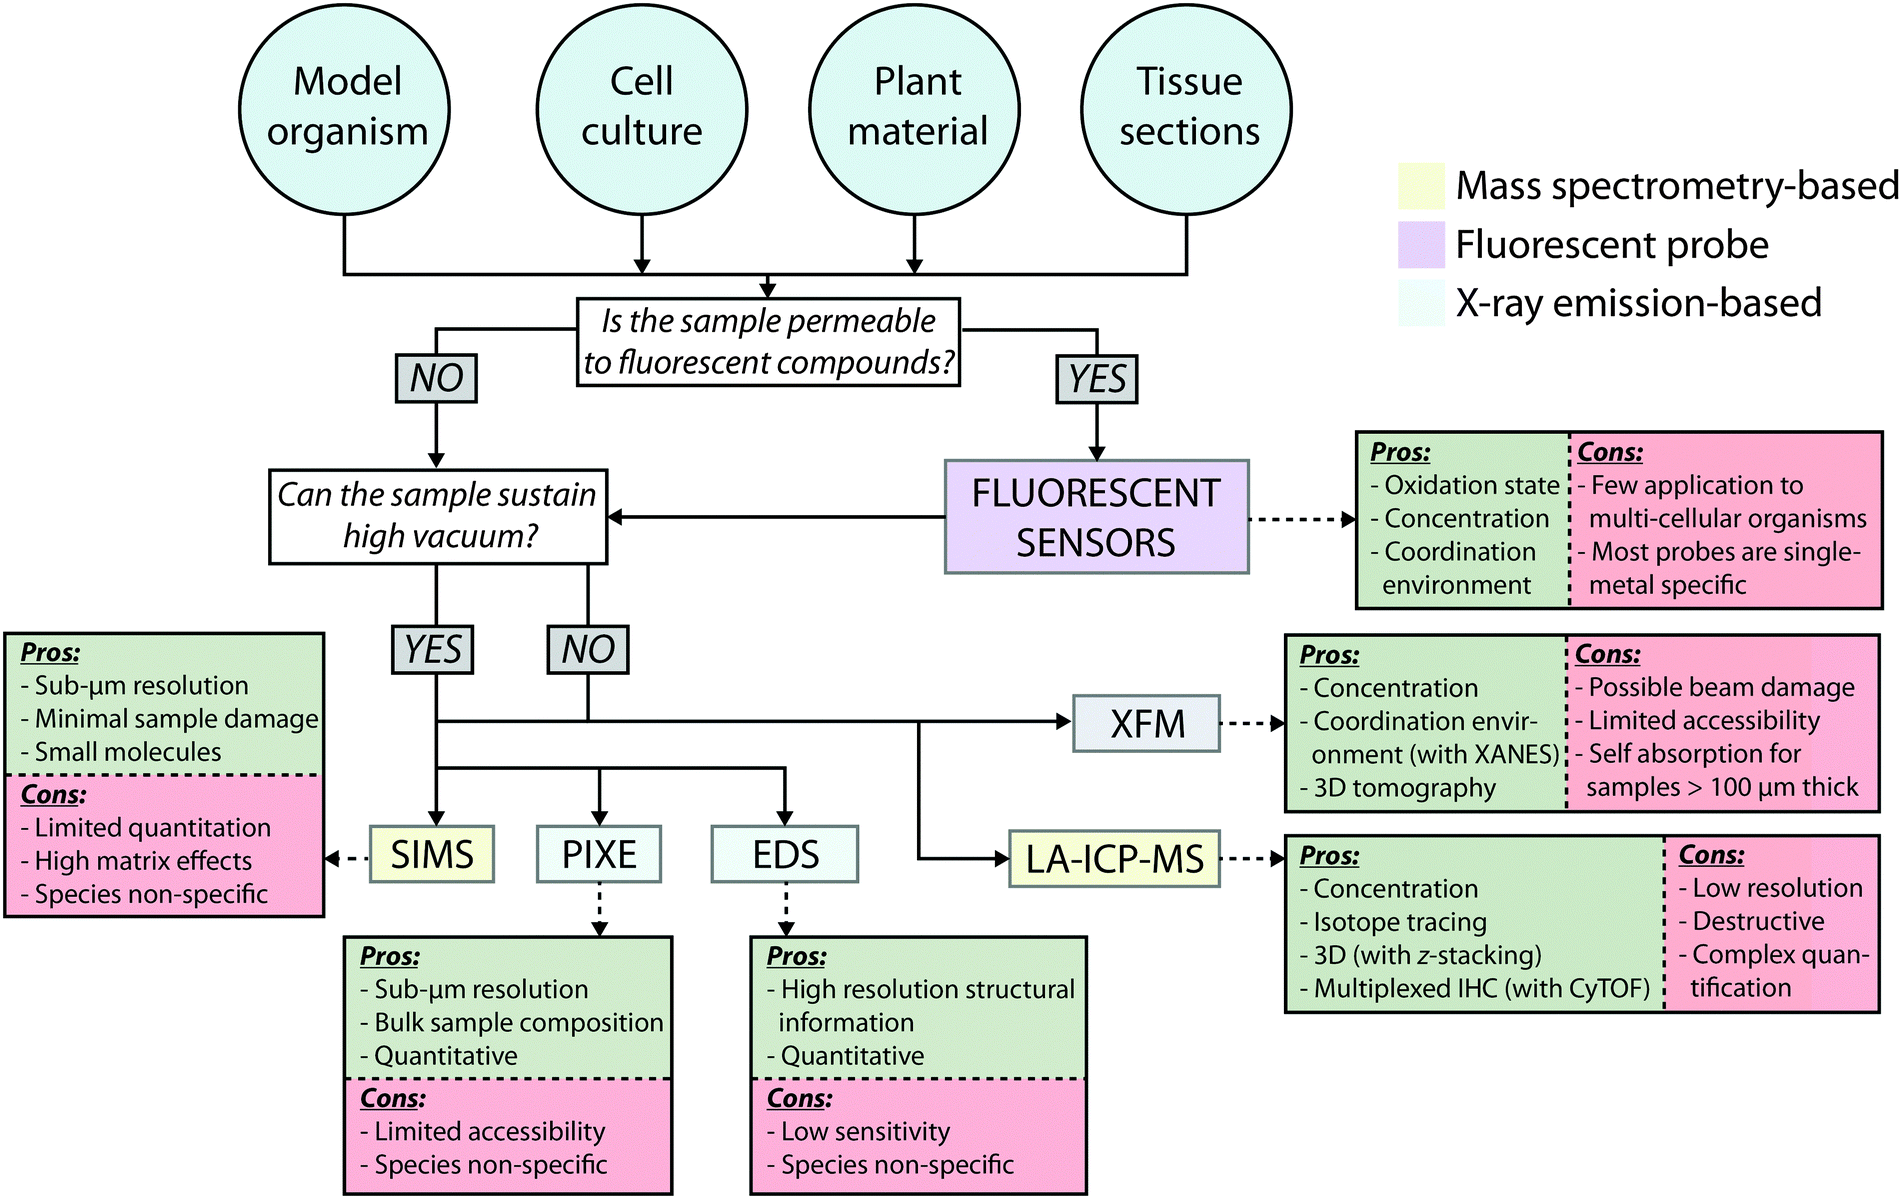 | ||
| Fig. 10 Proposed workflow for designing a unified imaging experiment. | ||
7. Conclusions
Visualising metal distribution is key to elucidating the functions they play in both a healthy and diseased biological system. Just as measuring changes in total protein levels seems insufficient in the age of proteomics, measuring total metal levels provides only a small window into wider metallobiology, given our current understanding of the ubiquity of metals in the cell and the role their chaperoning proteins play in determining function. As repeated throughout this Tutorial Review, designing the ideal approach to imaging metals in a biological system is very much application-specific, in that the ideal balance of sensitivity, selectivity and spatial resolution (see Fig. 2) for a particular experiment is dependent on the required outcomes, the sample itself, and the techniques available. With these considerations in mind, contemporary analytical technology can be used in sequence and parallel to design a cohesive and comprehensive experiment that is approaching the ideal for imaging metals in as close to their native state as possible, whilst also taking advantage of the diverse capability that each technique can offer. As is the case with the aforementioned need for improved communication between biologists using and chemists developing new fluorescent sensors, consultation with experts in each imaging discipline (e.g. synchrotron radiation and imaging mass spectrometry scientists) is essential. Establishing feasibility, practicality and sufficient access at the planning stage of an experiment is highly recommended, if not essential.Acknowledgements
We gratefully acknowledge support from the Australian Research Council and National Health and Medical Research Council, the Victorian Government's Operational Infrastructure Support Program, the Australian Synchrotron, and the UTS Chancellor's Postdoctoral Research Fellowship program. We wish to thank Drs Nicole Jenkins, Simon James and Peter Crouch for critical comments, suggestions and assistance. We also wish to thank Jonas Marnell of Ethix Design for assistance with digital artwork. Due to space limitations, this Tutorial Review could not give appropriate credit to all research in this field, and we wish to acknowledge to the authors of the many great works that were not cited directly.Notes and references
- K. J. Waldron, J. C. Rutherford, D. Ford and N. J. Robinson, Nature, 2009, 460, 823–830 CrossRef CAS PubMed.
- E. J. New, Dalton Trans., 2013, 42, 3210–3219 RSC.
- J. P. Kehrer, Toxicology, 2000, 149, 43–50 CrossRef CAS.
- R. McRae, P. Bagchi, S. Sumalekshmy and C. J. Fahrni, Chem. Rev., 2009, 109, 4780–4827 CrossRef CAS PubMed.
- S. Wang, R. Brown and D. J. Gray, Appl. Spectrosc., 1994, 48, 1321–1325 CrossRef CAS.
- D. Pozebon, G. L. Scheffler, V. L. Dressler and M. A. G. Nunes, J. Anal. At. Spectrom., 2014, 29, 2204–2228 RSC.
- C. Giesen, H. A. O. Wang, D. Schapiro, N. Zivanovic, A. Jacobs, B. Hattendorf, P. J. Schüffler, D. Grolimund, J. M. Buhmann, S. Brandt, Z. Varga, P. J. Wild, D. Günther and B. Bodenmiller, Nat. Methods, 2014, 11, 417–422 CrossRef CAS PubMed.
- H. A. O. Wang, D. Grolimund, C. Giesen, C. N. Borca, J. R. H. Shaw-Stewart, B. Bodenmiller and D. Günther, Anal. Chem., 2013, 85, 10107–10116 CrossRef CAS PubMed.
- D. S. Urgast, S. Hill, I.-S. Kwun, J. H. Beattie, H. Goenaga-Infante and J. Feldmann, Metallomics, 2012, 4, 1057–1063 RSC.
- A. Hong-Hermesdorf, M. Miethke, S. D. Gallaher, J. Kropat, S. C. Dodani, J. Chan, D. Barupala, D. W. Domaille, D. I. Shirasaki, J. A. Loo, P. K. Weber, J. Pett-Ridge, T. L. Stemmler, C. J. Chang and S. S. Merchant, Nat. Chem. Biol., 2014, 10, 1034–1042 CrossRef CAS PubMed.
- M. J. Pushie, I. J. Pickering, M. Korbas, M. J. Hackett and G. N. George, Chem. Rev., 2014, 114, 8499–8541 CrossRef CAS PubMed.
- S. Roudeau, A. Carmona, L. Perrin and R. Ortega, Anal. Bioanal. Chem., 2014, 406, 6979–6991 CrossRef CAS PubMed.
- A. Grubman, S. A. James, J. James, C. Duncan, I. Volitakis, J. L. Hickey, P. J. Crouch, P. S. Donnelly, K. Kanninen, J. R. Liddell, S. L. Cotman, M. D. de Jonge and A. R. White, Chem. Sci., 2014, 5, 2503–2516 RSC.
- J. Deng, D. J. Vine, S. Chen, Y. S. G. Nashed, Q. Jin, N. W. Phillips, T. Peterka, R. Ross, S. Vogt and C. J. Jacobsen, Proc. Natl. Acad. Sci. U. S. A., 2015, 112, 2314–2319 CrossRef CAS PubMed.
- E. D. Ingall, J. M. Diaz, A. F. Longo, M. Oakes, L. Finney, S. Vogt, B. Lai, P. L. Yager, B. S. Twining and J. A. Brandes, Nat. Commun., 2013, 4, 1981 Search PubMed.
- J. M. A. Mauritz, R. Seear, A. Esposito, C. F. Kaminski, J. N. Skepper, A. Warley, V. L. Lew and T. Tiffert, Biophys. J., 2011, 100, 1438–1445 CrossRef CAS PubMed.
- H. C. Ishikawa-Ankerhold, R. Ankerhold and G. P. C. Drummen, Molecules, 2012, 17, 4047–4132 CrossRef CAS PubMed.
- K. P. Carter, A. M. Young and A. E. Palmer, Chem. Rev., 2014, 114, 4564–4601 CrossRef CAS PubMed.
- J. Chan, S. C. Dodani and C. J. Chang, Nat. Chem., 2012, 4, 973–984 CrossRef CAS PubMed.
- M. H. Lee, J. S. Kim and J. L. Sessler, Chem. Soc. Rev., 2015, 44, 4185–4191 RSC.
- C. Shen and E. J. New, Metallomics, 2015, 7, 56–65 RSC.
- T. Hirayama, G. C. Van de Bittner, L. W. Gray, S. Lutsenko and C. J. Chang, Proc. Natl. Acad. Sci. U. S. A., 2012, 109, 2228–2233 CrossRef CAS PubMed.
- M. Angelo, S. C. Bendall, R. Finck, M. B. Hale and C. Hitzman, Nat. Med., 2014, 20, 436–442 CrossRef CAS PubMed.
- H.-L. Yuan, S. Gao, M.-N. Dai, C.-L. Zong, D. Günther, G. H. Fontaine, X.-M. Liu and C. Diwu, Chem. Geol., 2008, 247, 100–118 CrossRef CAS PubMed.
- O. Ornatsky, D. Bandura, V. Baranov, M. Nitz, M. A. Winnik and S. Tanner, J. Immunol. Methods, 2010, 361, 1–20 CrossRef CAS PubMed.
- A. J. Managh, R. W. Hutchinson, P. Riquelme, C. Broichhausen, A. K. Wege, U. Ritter, N. Ahrens, G. E. Koehl, L. Walter, C. Florian, H. J. Schlitt, H. J. Reid, E. K. Geissler, B. L. Sharp and J. A. Hutchinson, J. Immunol., 2014, 193, 2600–2608 CrossRef CAS PubMed.
- D. J. Hare, P. Lei, S. Ayton, B. R. Roberts, R. Grimm, J. L. George, D. P. Bishop, A. D. Beavis, S. J. Donovan, G. McColl, I. Volitakis, C. L. Masters, P. A. Adlard, R. A. Cherny, A. I. Bush, D. I. Finkelstein and P. A. Doble, Chem. Sci., 2014, 5, 2160 RSC.
- D. A. Frick, C. Giesen, T. Hemmerle, B. Bodenmiller and D. Günther, J. Anal. At. Spectrom., 2014, 30, 254–259 RSC.
- T. Paunesku, S. Vogt, B. Lai, J. Maser, N. Stojićević, K. T. Thurn, C. Osipo, H. Liu, D. Legnini, Z. Wang, a. Chung Lee and G. E. Woloschak, Nano Lett., 2007, 7, 596–601 CrossRef CAS PubMed.
- C. G. Ryan, D. P. Siddons, R. Kirkham, P. A. Dunn, A. Kuczewski, G. Moorhead, G. De Geronimo, D. J. Paterson, M. D. de Jonge, R. M. Hough, M. J. Lintern, D. L. Howard, P. Kappen and J. Cleverley, AIP Conf. Proc., 2010, 1221, 9–17 CrossRef CAS PubMed.
- E. Lombi, M. D. de Jonge, E. Donner, C. G. Ryan and D. Paterson, Anal. Bioanal. Chem., 2011, 400, 1637–1644 CrossRef CAS PubMed.
- M. D. de Jonge and S. Vogt, Curr. Opin. Struct. Biol., 2010, 20, 606–614 CrossRef CAS PubMed.
- M. D. de Jonge, C. Holzner, S. B. Baines, B. S. Twining, K. Ignatyev, J. Diaz, D. L. Howard, D. Legnini, A. Miceli, I. McNulty, C. J. Jacobsen and S. Vogt, Proc. Natl. Acad. Sci. U. S. A., 2010, 107, 15676–15680 CrossRef CAS PubMed.
- G. McColl, S. A. James, S. Mayo, D. L. Howard, C. G. Ryan, R. Kirkham, G. F. Moorhead, D. Paterson, M. D. de Jonge and A. I. Bush, PLoS One, 2012, 7, e32685 CAS.
- D. Bourassa, S.-C. Gleber, S. Vogt, H. Yi, F. Will, H. Richter, C. H. Shin and C. J. Fahrni, Metallomics, 2014, 6, 1648 RSC.
- D. J. Hare, J. K. Lee, A. D. Beavis, A. van Gramberg, J. George, P. A. Adlard, D. I. Finkelstein and P. A. Doble, Anal. Chem., 2012, 84, 3990–3997 CrossRef CAS PubMed.
- M. D. de Jonge, C. G. Ryan and C. J. Jacobsen, J. Synchrotron Radiat., 2014, 21, 1031–1047 CrossRef CAS PubMed.
- S. A. James, B. R. Roberts, D. J. Hare, M. D. de Jonge, I. E. Birchall, N. L. Jenkins, R. A. Cherny, A. I. Bush and G. McColl, Chem. Sci., 2015, 6, 2952–2962 RSC.
- D. W. Domaille, E. L. Que and C. J. Chang, Nat. Chem. Biol., 2008, 4, 168–175 CrossRef CAS PubMed.
- R. Meguro, Y. Asano, S. Odagiri, C. Li, H. Iwatsuki and K. Shoumura, Arch. Histol. Cytol., 2007, 70, 1–19 CrossRef CAS.
- D. J. Hare, J. L. George, L. Bray, I. Volitakis, A. Vais, T. M. Ryan, R. A. Cherny, A. I. Bush, C. L. Masters, P. A. Adlard, P. A. Doble and D. I. Finkelstein, J. Anal. At. Spectrom., 2014, 29, 565–570 RSC.
- M. J. Hackett, J. A. McQuillan, F. El-Assaad, J. B. Aitken, A. Levina, D. D. Cohen, R. Siegele, E. A. Carter, G. E. Grau, N. H. Hunt and P. A. Lay, Analyst, 2011, 136, 2941 RSC.
- R. Siegele, N. R. Howell, P. D. Callaghan and Z. Pastuovic, Nucl. Instrum. Methods Phys. Res., Sect. B, 2013, 306, 125–128 CrossRef CAS PubMed.
- D. Hare, C. Austin and P. Doble, Analyst, 2012, 137, 1527–1537 RSC.
- C. Austin, T. M. Smith, A. Bradman, K. Hinde, R. Joannes-Boyau, D. Bishop, D. J. Hare, P. Doble, B. Eskenazi and M. Arora, Nature, 2013, 498, 216–219 CrossRef CAS PubMed.
- T. Bacquart, G. Devès, A. Carmona, R. Tucoulou, S. Bohic and R. Ortega, Anal. Chem., 2007, 79, 7353–7359 CrossRef CAS PubMed.
- R. Neutze, R. Wouts, D. van der Spoel, E. Weckert and J. Hajdu, Nature, 2000, 406, 752–757 CrossRef CAS PubMed.
- S. A. James, M. D. de Jonge, D. L. Howard, A. I. Bush, D. Paterson and G. McColl, Metallomics, 2013, 5, 627 RSC.
- E. Lombi, K. G. Scheckel and I. M. Kempson, Environ. Exp. Bot., 2011, 72, 3–17 CrossRef CAS PubMed.
- K. M. Dean, Y. Qin and A. E. Palmer, Biochim. Biophys. Acta, Mol. Cell Res., 2012, 1823, 1406–1415 CrossRef CAS PubMed.
- E. L. Que, R. Bleher, F. E. Duncan, B. Y. Kong, S. C. Gleber, S. Vogt, S. Chen, S. A. Garwin, A. R. Bayer, V. P. Dravid, T. K. Woodruff and T. V. O'Halloran, Nat. Chem., 2014, 7, 130–139 CrossRef PubMed.
| This journal is © The Royal Society of Chemistry 2015 |