 Open Access Article
Creative Commons Attribution 3.0 Unported Licence
Correction: Plasmonics in the ultraviolet with the poor metals Al, Ga, In, Sn, Tl, Pb, and Bi
Jeffrey M.
McMahon†
ab,
George C.
Schatz
a and
Stephen K.
Gray
*b
aDepartment of Chemistry, Northwestern University, Evanston, Illinois 60208, USA
bCenter for Nanoscale Materials, Argonne National Laboratory, Argonne, Illinois 60439, USA. E-mail: gray@anl.gov
First published on 2nd July 2015
Abstract
Correction for ‘Plasmonics in the ultraviolet with the poor metals Al, Ga, In, Sn, Tl, Pb, and Bi’ by Jeffrey M. McMahon et al., Phys. Chem. Chem. Phys., 2013, 15, 5415–5423.
In ref. 1, hereon referred to as I, we reported the results of a fit of a dielectric model to experimental optical data for indium (In).2 We then reported additional results based on this fit, such as nanoparticle cross sections. Since publication, we have come to realize that the experimental data that we used for this (e.g., see Fig. 2 of I) does not correspond to the actual data reported in ref. 2.
In this correction article, we report the results of a new fit (of the same dielectric model used in I) to the correct experimental optical data for In.2 Following this, we calculate the optical properties of spherical In nanoparticles. Finally, we correct a few other minor errors that we have noticed with I.
Recall the dielectric model ε(ω) used in I:
 | (1) |
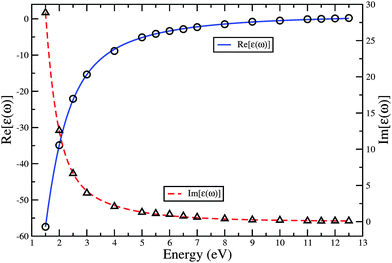
Fig. 1 shows eqn (1) evaluated over the range 1.5 to 12.5 eV, in comparison to the experimental data2 points used for the fit. As can be seen, the model in eqn (1) is remarkably accurate. Moreover, comparing to Fig. 2 of I, it can be seen that the correct magnitude of the real part of ε(ω) is much lower than used for the fit in I. This is the reason that only a single fit is necessary in the present case, as opposed to the two in I.
 | ||
| Fig. 1 Relative permittivity ε(ω) of In from 1.5 to 12.5 eV, evaluated using eqn (1) with the parameters in the text. The real and imaginary parts of ε(ω) are shown as blue solid and red dashed lines, respectively. The corresponding parts of the experimental data2 used for the fitting of eqn (1) are also shown as circular and triangular symbols, respectively. | ||
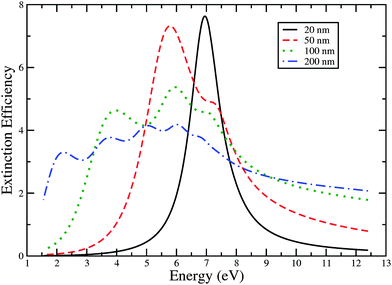
To illustrate how this correction affects the optical properties of small particles, such as those reported in I, we recalculated the extinction efficiencies of spherical nanoparticles with diameters of 20, 50, 100, and 200 nm, using Mie theory.5 As can be seen in Fig. 2, they are quite different than those reported in the center panel of Fig. 6 of I. Rather than occur above 12 eV, the peak resonance (dipolar) now occurs in the UV, extending into the Vis with increasing particle size. This is consistent with the results seen for the other poor metal nanoparticles reported in I (Fig. 6–8 therein). It is interesting to note that the extinction efficiencies are in fact similar to gallium (Ga) (Fig. 7 of I), except narrower. The shift of the resonances to lower energies (from above 12 to near 7 eV, for the 20 nm diameter particle, for example) arises from the reduced magnitude in the real part of ε(ω), which causes the resonance condition Re[ε(ωres)] ≈ −2 to occur at lower energies.
 | ||
| Fig. 2 Extinction efficiencies for spherical In particles with diameters of 20, 50, 100, and 200 nm. | ||
It is also important to also discuss the impact that the corrected model will have on the electric field enhancements (|E|2), a topic discussed in Section 3 of I. Therein, extinction cross sections and |E|2 enhancements occurring at the junction between a dimer of 20 nm diameter nanoparticles were calculated. Considering that the extinction efficiencies of the isolated In particles are similar to Ga, as discussed above, as is the permittivity (compare Fig. 1 to Fig. 3 of I, for example), it is reasonable to expect similar qualitative behavior of the dimer cross sections. Instead of occurring in the far UV and beyond, as reported in I and the top panel of Fig. 11 of I, they are actually more likely to occur in the middle to far UV. Considering further that the width of the resonances of the isolated In particles are narrower relative to Ga, it is expected that the |E|2 enhancements of the former should be stronger, though still less than aluminum (Al), which has very strong and narrow single-particle resonances (see the top panel of Fig. 6 of I).
In addition to our incorrect use of the In experimental optical data2 in I, we have also noticed three other errors, though they do not (significantly) affect the results. First of all, Δε2 for Al in Table 2 of I should be 0.070, not 0.069. Secondly, γLn in the text in Sections 2.1 and 2.2 of I, as well as γL1 and γL2 of Table 2 of I are typos; they should be δLn, δL1, and δL2, respectively. Finally, in Section 2.2 of I, we reported that Ga was experimentally measured at 140 and 77 K at low- and high-energies, respectively. However, it was actually thallium that was measured at these temperatures.6,7 Ga was measured at 300 K.8,9
We thank H. Everitt for pointing out our incorrect use of the In experimental optical data2 in I.
References
- J. M. McMahon, G. C. Schatz and S. K. Gray, Phys. Chem. Chem. Phys., 2013, 15, 5415, 10.1039/c3cp43856b.
- R. Y. Koyama, N. V. Smith and W. E. Spicer, Phys. Rev. B: Solid State, 1973, 8, 2426 CrossRef CAS.
- J. M. McMahon, S. K. Gray and G. C. Schatz, Phys. Rev. Lett., 2009, 103, 097403 CrossRef.
- J. M. McMahon, S. K. Gray and G. C. Schatz, Phys. Rev. B: Condens. Matter Mater. Phys., 2010, 82, 035423 CrossRef.
- C. F. Bohren and D. R. Huffman, Absorption and Scattering of Light by Small Particles, John Wiley & Sons, Inc., New York, 1983 Search PubMed.
- G. Jézéquel, J. Thomas and I. Pollini, Phys. Rev. B: Condens. Matter Mater. Phys., 1988, 37, 8639 CrossRef.
- H. P. Myers, J. Phys. F: Met. Phys., 1973, 3, 1078 CrossRef CAS.
- O. Hunderi and R. Ryberg, J. Phys. F: Met. Phys., 1974, 4, 2084 CrossRef CAS.
- G. Jezequel, J. C. Lemonnier and J. Thomas, J. Phys. F: Met. Phys., 1977, 7, 1613 CrossRef CAS.
Footnote |
| † Present address: Department of Physics, University of Illinois at Urbana-Champaign, Illinois 61801, USA. |
| This journal is © the Owner Societies 2015 |
