DOI:
10.1039/C5CP90064F
(Correction)
Phys. Chem. Chem. Phys., 2015,
17, 14239-14240
Correction: A rational computational study of surface defect-mediated stabilization of low-dimensional Pt nanostructures on TiN(100)
Received
10th April 2015
, Accepted 10th April 2015
First published on 8th May 2015
Abstract
Correction for ‘A rational computational study of surface defect-mediated stabilization of low-dimensional Pt nanostructures on TiN(100)’ by Young Joo Tak et al., Phys. Chem. Chem. Phys., 2015, 17, 9680–9686.
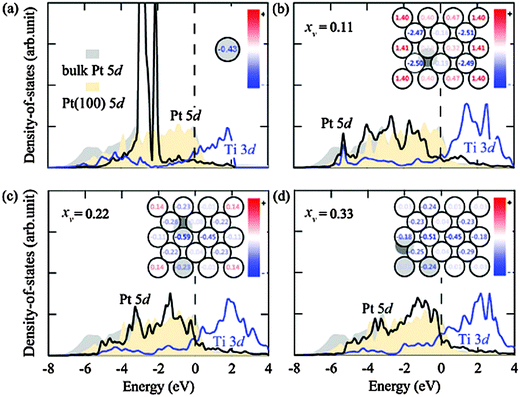
The authors wish to make amendments to the labelling in Fig. 2 and Fig. 5 in the published article.
(a) Fig. 2 should be as follows:
 |
| | Fig. 2 Average binding energy of Pt for 71 different Pt nanostructures on the TiN(100) surface with different concentrations of surface N or Ti vacancies (xv), which refers to the number of vacancies per possible vacancy sites. (a) The average binding energy per Pt atom, as calculated according to eqn (1), versus Pt surface coverage (Θ) for up to 3 adlayers (36 Pt atoms) of Pt on the clean TiN(100) surface. Light, medium, and dark blue colors indicate one, two, and three atomic-layer thickness of the Pt nanostructures, respectively. (b) The surface vacancy formation energies of surface N and Ti vacancies on TiN(100), as calculated using eqn (2). (c) The average binding energy per Pt atom versus surface vacancy concentration at TiN(100) for the Pt/TiN nanostructures (as shown in Fig. 1a). The gray filled circle represents the binding energy of a nano-layer of Pt on the defect-free TiN(100) surface. Orange and blue symbols distinguish the considered N-lean and N-rich conditions, respectively. Open circles denote a Pt nano-layer on TiN(100) with surface N vacancies, and open squares for those with surface Ti vacancies. Filled red triangles show the single Pt atom results from ref. 16 for comparison: the upright red triangle represents that of a single Pt atom adsorbed as a substitutional atom at an surface N vacancy (−1.11 eV), and the inverse red triangle for that at a surface Ti vacancy site (2.33 eV) under N-lean conditions. All possible surface vacancy configurations within our p(3 × 3) surface supercell are considered in this figure. | |
(b) Fig. 5 should be as follows:
 |
| | Fig. 5 Partial density-of-states and top-views of the Pt/TiN nanostructures with the corresponding Bader charge analysis (insets) for (a) Pt single-atom anchored at a surface N vacancy site, (b) Pt nano-layer on TiN(100) with one surface N vacancy (xv = 0.11), (c) Pt nano-layer on TiN(100) with two surface N vacancies (xv = 0.22), and (d) the Pt nano-layer on TiN(100) with three surface N vacancies (xv = 0.33). The Bader charge for each atom is noted in units of electronic charge and the values are color-coded from positive (in red) to negative (in blue). Gray filled circles denote the positions of surface N vacancies below the Pt adatoms. The Fermi energy is indicated by the vertical dashed line at 0 eV. | |
The Royal Society of Chemistry apologises for these errors and any consequent inconvenience to authors and readers.
|
| This journal is © the Owner Societies 2015 |
Click here to see how this site uses Cookies. View our privacy policy here.  Open Access Article

