
 Open Access Article
 This Open Access Article is licensed under a
 Creative Commons Attribution 3.0 Unported Licence
Excited-state annihilation reduces power dependence of single-molecule FRET experiments†
Daniel Nettels*a,
Dominik Haenni‡
a,
Sacha Maillotb,
Moussa Gueyeb,
Anders Barthc,
Verena Hirschfeldc,
Christian G. Hübnerc,
Jérémie Léonardb and
Benjamin Schuler*a
aDepartment of Biochemistry, University of Zurich, Winterthurerstrasse 190, 8057 Zurich, Switzerland. E-mail: nettels@bioc.uzh.ch; schuler@bioc.uzh.ch
bInstitut de Physique et Chimie des Matériaux de Strasbourg & Labex NIE, Université de Strasbourg, CNRS UMR 7504, 67034 Strasbourg Cedex 2, France
cInstitute of Physics, University of Lübeck, Ratzeburger Allee 160, 23562 Lübeck, Germany
First published on 5th November 2015
Abstract
Single-molecule Förster resonance energy transfer (FRET) experiments are an important method for probing biomolecular structure and dynamics. The results from such experiments appear to be surprisingly independent of the excitation power used, in contradiction to the simple photophysical mechanism usually invoked for FRET. Here we show that excited-state annihilation processes are an essential cause of this behavior. Singlet–singlet annihilation (SSA) is a mechanism of fluorescence quenching induced by Förster-type energy transfer between two fluorophores while they are both in their first excited singlet states (S1S1), which is usually neglected in the interpretation of FRET experiments. However, this approximation is only justified in the limit of low excitation rates. We demonstrate that SSA is evident in fluorescence correlation measurements for the commonly used FRET pair Alexa 488/Alexa 594, with a rate comparable to the rate of energy transfer between the donor excited state and the acceptor ground state (S1S0) that is exploited in FRET experiments. Transient absorption spectroscopy shows that SSA occurs exclusively via energy transfer from Alexa 488 to Alexa 594. Excitation-power dependent microsecond correlation experiments support the conclusion based on previously reported absorption spectra of triplet states that singlet–triplet annihilation (STA) analogously mediates energy transfer if the acceptor is in the triplet state. The results indicate that both SSA and STA have a pronounced effect on the overall FRET process and reduce the power dependence of the observed FRET efficiencies. The existence of annihilation processes thus seems to be essential for using FRET as a reliable spectroscopic ruler at the high excitation rates commonly employed in single-molecule spectroscopy.
Introduction
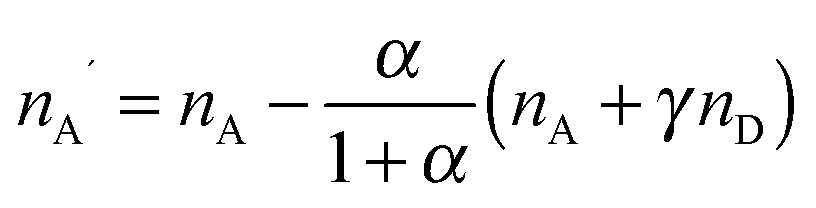
The quantitative observation of inter- and intramolecular Förster resonance energy transfer (FRET) is a technique widely used in fluorescence-based single-molecule spectroscopy, especially for the investigation of biomolecular systems.1,2 Typically, the macromolecules of interest are labeled at specific locations with a donor–acceptor dye pair, and the transfer efficiency E is most commonly determined from the measured detection rates, nD and nA, of donor and acceptor fluorescence photons, respectively, according to| E = nA′/(nA′ + γnD), | (1) |
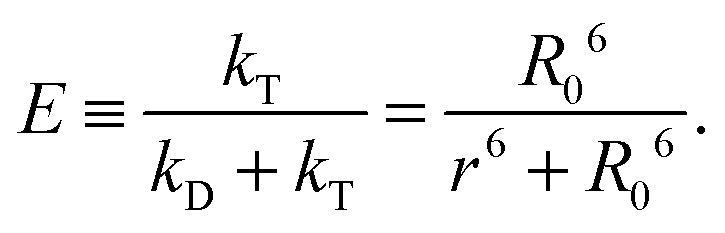
 (see below for the definition of the acceptor direct excitation coefficient α). Eqn (1) is strictly true for the simple photophysical model depicted in the Jablonski diagram of Fig. 1a. It contains three states of the combined system of dyes, S0S0, S1S0, and S0S1 (where SiSj denotes donor and acceptor being in the Si and Sj singlet states, respectively). Starting from the ground state, S0S0, the donor is excited with a rate coefficient kex, which is to a good approximation proportional to the intensity of the incident radiation used for exciting the donor. From the new state, S1S0, the system may now either decay back directly to S0S0 by spontaneous emission with rate coefficient kD; alternatively, the energy is transferred with rate constant kT to the acceptor, and state S0S1 is reached. Subsequently, the system decays back to the ground state S0S0 with the rate coefficient kA. The transfer efficiency E is defined by the first equality in
 | (2) |
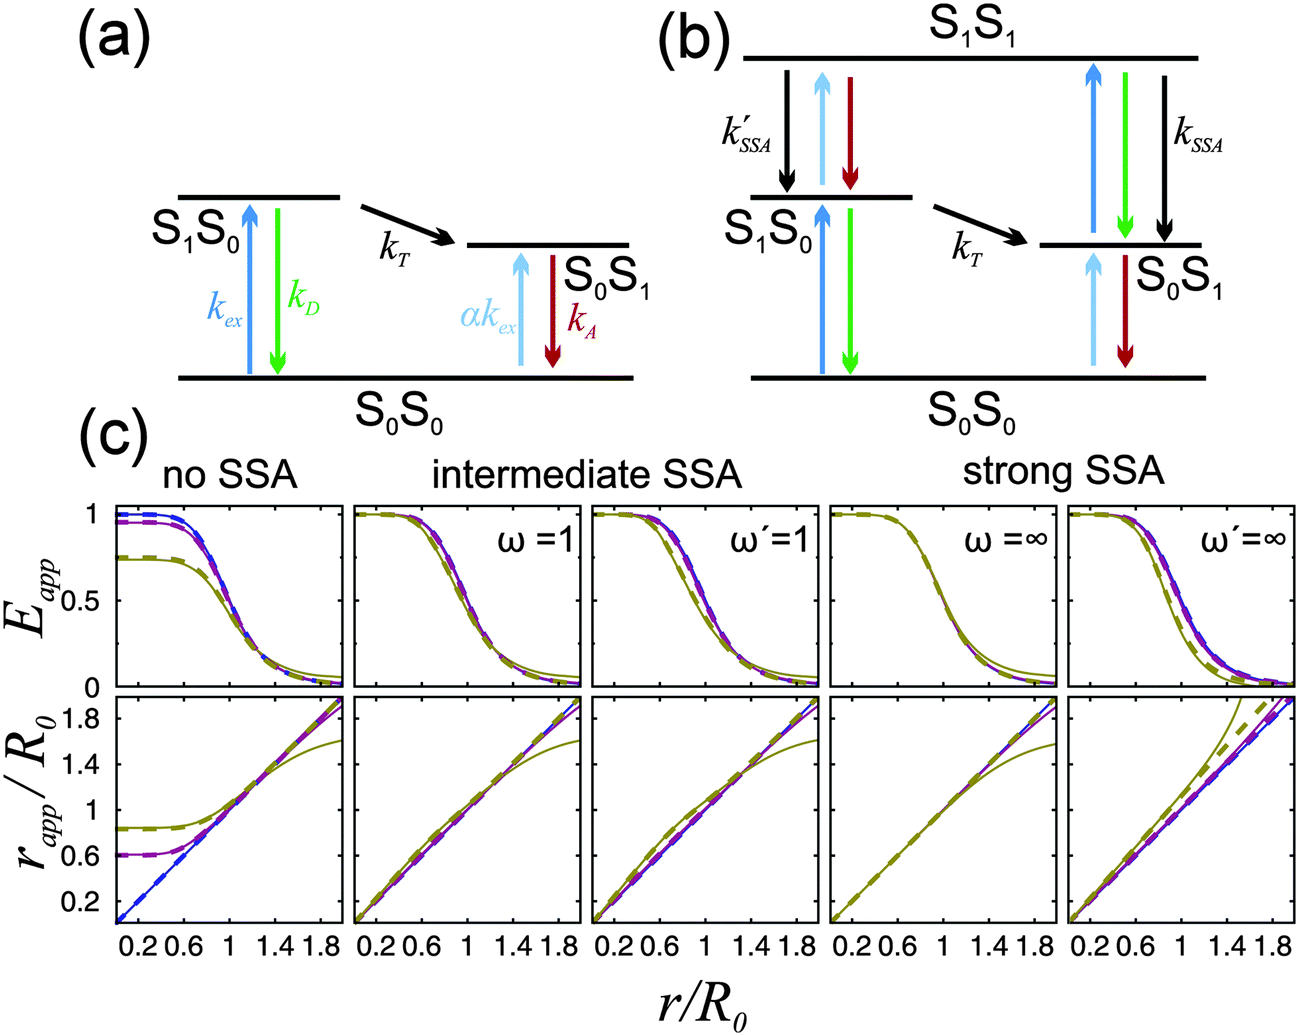 | ||
| Fig. 1 (a and b) Jablonski diagrams of a donor–acceptor FRET dye pair. SiSj denotes the combined state in which donor and acceptor are in the singlet states Si and Sj, respectively. (a) Simplified diagram for which eqn (1) holds. (b) A more realistic diagram, additionally including the double-excited state S1S1 and its radiationless depopulation due to singlet–singlet annihilation (SSA) with rate coefficients kSSA and kSSA′. For the scheme in (b), eqn (1) is no longer strictly applicable. (c) Eapp(r) and rapp(r) calculated from the photophysical model depicted in (b) for three limiting cases: no, intermediate, and strong SSA. The relative strength of SSA is characterized by the inter-dye-distance-independent parameters ω = kSSA/kT and ω′ = kSSA′/kT. Their values are chosen as indicated in the panels, or zero otherwise. Eapp is calculated from Eapp = nA′/(nA′ + γnD), and rapp from solving Eapp = R06/(rapp6 + R06), where R0 is the Förster radius of the S1S0 → S0S1 transition. Each of the three cases are shown for three different excitation rates: kex → 0 (blue), kex = 0.1kD (purple), and kex = kD (yellow). The full lines were calculated with acceptor direct excitation α = 0.05 and the dashed lines for α = 0. Further it was assumed that kD = kA. | ||
The simple scheme of Fig. 1a, however, neglects the population of the state S1S1, in which both fluorophores are in the excited state simultaneously (Fig. 1b). (Also neglected are the triplet states of the chromophores, which we will discuss below.) The S1S1 state can be populated via S0S1 → S1S1 and S1S0 → S1S1 with the rate coefficients kex and αkex, respectively. The omission of the S1S1 state is justified at low excitation intensities, where kex ≪ kA and αkex ≪ kD + kT. However, at higher intensities, which are often desirable for obtaining higher fluorescence detection rates, especially in single-molecule experiments, the population of the double-excited state S1S1 may become significant, and its fluorescence decay back to S0S1 or S1S0 leads to conditions where eqn (1) becomes incorrect. As a result, a pronounced dependence of experimentally observed transfer efficiencies on the excitation rate might be expected, e.g., if surface-immobilized single molecules are investigated in different regimes of irradiance, or if they are compared to measurements on molecules freely diffusing in solution, where typically much higher irradiance is used. However, observed transfer efficiencies are often remarkably independent of excitation rate, raising the question of how nonlinear photophysical behavior outside the weak excitation limit is prevented.
Potential candidates for counteracting mechanisms are excited-state annihilation processes. The population of S1S1, for instance, can lead to singlet–singlet annihilation (SSA) (see Fig. 1b), a two-step process of the form 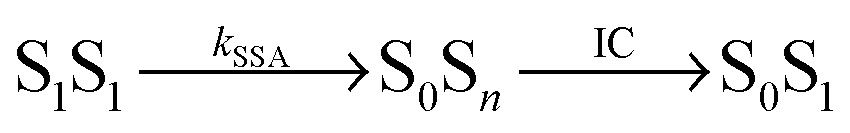 , where energy is transferred from the donor to the acceptor in a Förster-type mechanism. In this process, the donor returns to the ground state while the acceptor is raised to a higher singlet state Sn>1, from where it rapidly returns to the S1 state via radiationless internal conversion (IC). Kinetically, the population of the intermediate state S0Sn can hence be neglected. In the double-excited state, donor and acceptor can also change their roles, i.e., transfer in the opposite direction
 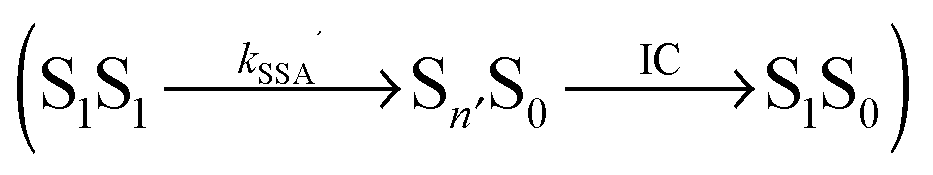 may be possible4 and is thus included in the model of Fig. 1b. An analogous energy transfer process can occur between singlet and triplet states, i.e., S1T1 → S0Tn, with subsequent non-radiative internal conversion, S0Tn → S0T1, resulting in singlet–triplet annihilation (STA).
On the single-molecule level, SSA and STA were first studied by Hübner et al.5 and Hofkens et al.6 by measuring fluorescence trajectories of single polymer-embedded, bichromophoric molecules with two peryleneimides as chromophores that act both as donor and acceptor (homo-transfer). STA was evidenced by collective “on-and-off” events occurring in the recorded emission, which were explained by STA and thus quenching of one chromophore while the other is in the triplet state. The occurrence of SSA was verified from the amplitude of the photon antibunching component in inter-photon arrival time distributions. In addition, Hofkens et al. quantified the Förster radii of the three competing resonance energy transfer pathways. They found very similar values for SSA (5.9 nm) and ‘normal’ energy transfer (5.4 nm), whereas the Förster radius of STA turned out to be significantly greater (8.7 nm). More recently, Fückel et al. quantified SSA of terrylene diimide by photon coincidence measurements with pulsed laser excitation.7
Here we first discuss the influence of the S1S1 population and its quenching by SSA on the right-hand side of eqn (1), which we refer to in the following as the apparent transfer efficiency, Eapp = nA′/(nA′ + γnD), to distinguish it from the ‘true’ E, defined in eqn (2). We show that the deviation of Eapp from E, due to the S1S1 population enhanced by larger excitation rates, is reduced in the presence of strong SSA. We then determine the rate of SSA between Alexa 488 and Alexa 594, a dye pair very commonly used in single-molecule FRET measurements of biomolecules.2,8–16 For this purpose, we labeled the termini of a 20-residue polyproline (Pro20) peptide14,17 with these dyes and performed fluorescence correlation spectroscopy (FCS) with sub-nanosecond time resolution. We show that especially the asymmetric shape of the donor–acceptor intensity cross-correlation in the nanosecond range is highly sensitive to the strength of SSA. We obtain a quantitative measure for the rate of SSA from a global fit of the FCS curves using a detailed photon-statistical model based on the scheme presented in Fig. 1b. To complement and further validate this result, we use transient absorption spectroscopy to determine the extinction coefficient of the S1 state of both dyes. This allows us to determine the nature of the energy transfer in the double-excited state and to predict the corresponding SSA rate, which is seen to agree very well with the result of the FCS experiment. Finally, we expand our photophysical model by including triplet blinking to discuss the impact of STA on single-molecule FRET measurements. By comparing with FRET data measured on terminally labeled polyproline 14 (Pro14), we conclude that both SSA and STA must be taken into account to explain the low power-dependence of the apparent transfer efficiency in this system.
Results and discussion
According to Förster's theory, the transfer rate coefficients kT, kSSA, and kSSA′ (see Fig. 1b) depend on the inter-dye distance r as
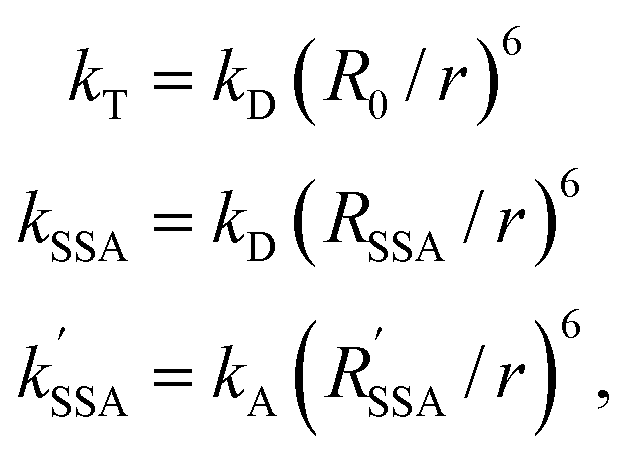 | (3) |
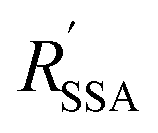 are the Förster radii of the corresponding energy transfer processes. We introduce the inter-dye distance-independent parameters ω = kSSA/kT and
 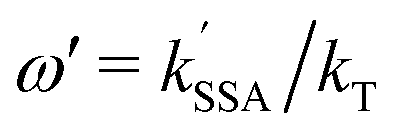 to characterize the relative strength of SSA present in the system, resulting in the following relation between Eapp and E for the photophysical system depicted in Fig. 1b:
 | (4) |
For single-molecule spectroscopy, the case of strong SSA with kSSAD→A = ∞ would be most desirable, since for small and intermediate distances, even at high excitation rates, no substantial deviation from the ideal E(r) dependence would be observed. For larger inter-dye distances, however, a deviation due to acceptor direct excitation would remain, albeit small if the laser power is moderate (kex = 0.1kD).
From the previous section, it is clear that a quantitative knowledge of the strength of SSA (and thus ω) is required for interpreting single-molecule FRET data accurately. Hence, we used FCS with picosecond time resolution to study SSA between the FRET pair Alexa 488 (donor) and Alexa 594 (acceptor) attached by flexible linkers to the termini of Pro20, which serves as a relatively rigid spacer between the dyes and positions them at an average distance close to the Förster radius.14,17 A 1 nM sample of the construct was measured in free diffusion on a confocal single-molecule instrument equipped with two donor and two acceptor detection channels (Hanbury-Brown & Twiss configuration18) to circumvent the dead times of the detectors. Photon arrival times were recorded with ∼50 ps time resolution, limited by the jitter of the detectors, for a total measurement time of 66 hours. From these data, the donor and acceptor autocorrelations, GDD(τ) and GAA(τ), as well as the cross-correlation GAD(τ) were obtained for lag times τ ranging from −10 to 10 ns (Fig. 2). The autocorrelations show a symmetric minimum at τ = 0 due to photon anti-bunching,5,19,20 since a single quantum emitter (donor or acceptor) can only emit one photon at a time. Note that the autocorrelations decrease to one instead of zero at τ = 0, as expected for a free-diffusion experiment, where two photons can be emitted simultaneously and independently if two (or more) fluorophores are present in the confocal observation volume at the same time. Of particular interest is the crosscorrelation, GAD(τ) (Fig. 2b), with its asymmetric shape and GAD(τ = 0) > 1. The latter is a clear indication for a population of the double-exited state, because only from this state can donor and acceptor photons be emitted simultaneously.
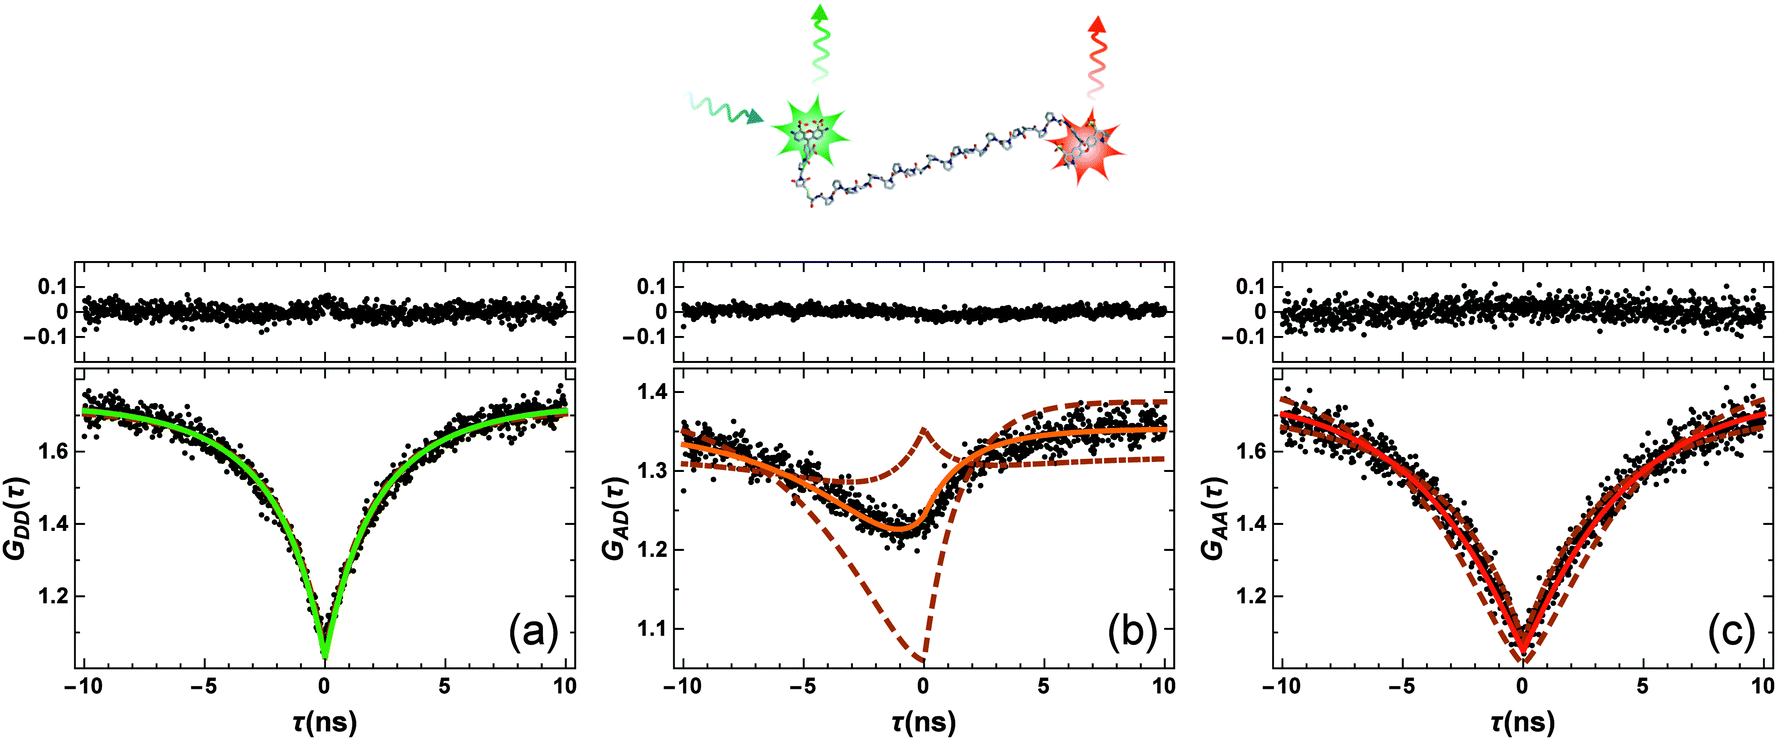 | ||
| Fig. 2 FCS data measured on Pro20 (black points in lower panels; structural representation of the labeled peptide on top). (a–c) Represent the donor–donor, GDD(τ), acceptor–donor, GAD(τ), and acceptor–acceptor, GAA(τ), correlation functions, respectively. Shown are also model curves from a global fit to the data and the corresponding residuals (upper panels). Beside three amplitudes, aij, (depending on particle concentration, background, and triplet blinking) and the antibunching amplitude of the donor-only population, cab, only ω = (RSSA/R0)6 was an adjustable fit parameter. ω = 0.95 ± 0.06 was obtained, corresponding to an SSA Förster radius of RSSA0 = 0.99 × R0. To demonstrate the sensitivity of the fitting procedure on ω, we repeated the global fit while keeping ω fixed to a ten times larger value (ω = 9.5, dashed lines) or a ten times smaller value (ω = 0.095, dashed-dotted lines). These values correspond to RSSA0 = 1.45 × R0 and RSSA0 = 0.68 × R0, respectively. | ||
We fitted the three FCS data sets of Fig. 2 globally with functions corresponding to the photophysical model depicted in Fig. 1b, using the elegant formalism introduced by Gopich and Szabo21 (for details, see Materials and methods). We note that most of the parameters of the model were determined from independent experiments: kD and kA are known from fluorescence lifetime measurements,22kex from antibunching measurements of donor only-labeled polyproline,9 and mean transfer efficiencies between Alexa 488 and Alexa 594 in the Pro20 construct were determined from single-molecule FRET efficiency histograms.§![[thin space (1/6-em)]](https://www.rsc.org/images/entities/char_2009.gif) 17 We thus know kT and can substitute kSSA = ωkT and kSSA′ = ω′kT in the model of Fig. 1b. The only free fit parameters besides ω and ω′ are four amplitudes, which, in contrast to ω and ω′, have only little influence on the asymmetric shape of the crosscorrelation function GAD(τ) and its value at τ = 0. Assuming that energy transfer from the double-excited state occurs in one direction only, either
17 We thus know kT and can substitute kSSA = ωkT and kSSA′ = ω′kT in the model of Fig. 1b. The only free fit parameters besides ω and ω′ are four amplitudes, which, in contrast to ω and ω′, have only little influence on the asymmetric shape of the crosscorrelation function GAD(τ) and its value at τ = 0. Assuming that energy transfer from the double-excited state occurs in one direction only, either 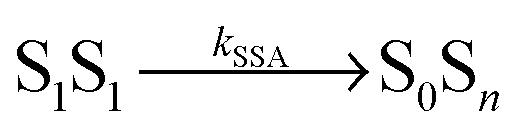 or
or 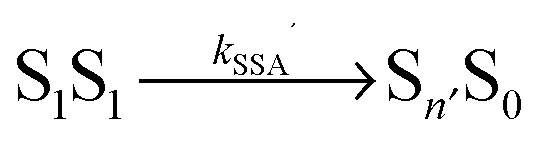 , we fitted the FCS data in two ways, with ω′ = 0 and ω as a free fit parameter, and vice versa.
Fig. 2 shows the resulting fits (full lines) and the residuals for ω′ = 0, yielding the best agreement with the measured data for ω = 0.95 ± 0.06.¶ To demonstrate the impact of ω on the model curves, we also show fits where ω was fixed to values ten times higher and ten times lower, i.e. to ω = 9.5 (dashed lines) and ω = 0.095 (dashed-dotted lines). Importantly, the effect of ω on the crosscorrelation curve is substantial and cannot be compensated by the other fit parameters, illustrating the sensitivity of the method for quantifying SSA. Varying ω′ while ω = 0 results in an equally good fit to the data and a value of ω′ = 0.93 ± 0.05, identical within error to the result for ω. On the basis of the FCS data, we can hence unequivocally demonstrate the occurrence of SSA between Alexa 488 and 594, but the directionality of the transfer process remains indistinguishable.
To address this question, we used transient absorption spectroscopy for obtaining the excited state absorption (ESA) spectra of Alexa 488 and Alexa 594. Förster3 showed that the sixth power of the Förster radius is proportional to the overlap integral J defined by
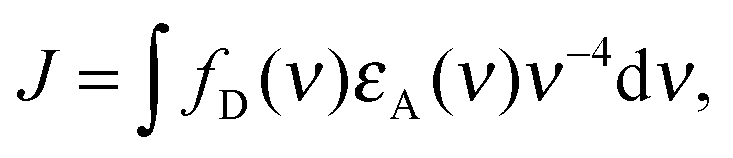 | (5) |
 ,24 and εA(ν) is the molar extinction coefficient of the acceptor as a function of the wavenumber, ν. We used a pump–probe technique to measure the transient absorption spectrum of the two fluorophores 100 ps after impulsive excitation into the S1 state (see Material and methods). After this delay, fast internal vibrational relaxation and solvent reorganization are completed, such that the observed transient spectrum characterizes the relaxed S1 state. The recorded transient spectrum is a superposition of three contributions: ground state bleach (GSB, negative signal), stimulated emission (SE, negative signal), and excited state absorption (ESA, positive signal). By measuring independently the ground state absorption (GSA) and fluorescence steady-state spectra, and taking into account the explicit relation between GSA, GSB, SE and fluorescence (see Material and methods), the ESA spectrum can be retrieved accurately and quantitatively (in units of M−1 cm−1). The results for both chromophores are displayed in Fig. 3 together with the ground state absorption (GSA) of Alexa 594. Interestingly, there is strong spectral overlap between the ESA of Alexa 594 and the fluorescence of Alexa 488, whereas this is not the case between the ESA of Alexa 488 and the fluorescence of Alexa 594. We can thus conclude that Alexa 488 is the donor and Alexa 594 the acceptor in the observed SSA process. In addition, we can use the extinction coefficients determined here for the S1 states of both chromophores (Fig. 3a) to quantify ω. Indeed, from R06 ∝ J and eqn (3), it follows that ω = JSSA/J, where J and JSSA are the overlap integrals of the energy transfer processes S1S0 → S0S1 and S1S1 → S0Sn, respectively, determined from the spectra represented in Fig. 3. From the ratio JSSA/J, we obtain ω = 0.92 ± 0.05, in very good agreement with the value of ω = 0.95 ± 0.06 from the fit to the FCS data. (See in Materials and methods the discussion about the effect of a possible systematic error on the dyes' ground state extinction coefficients). Similarly, within the uncertainty of the determination of the extinction coefficient of the S1 state of Alexa 488 (see Fig. 3b), we can estimate the ratio JSSA′/J and obtain ω′ = 0.05 ± 0.05, compatible with the absence of SSA by energy transfer from Alexa 594 to Alexa 488.
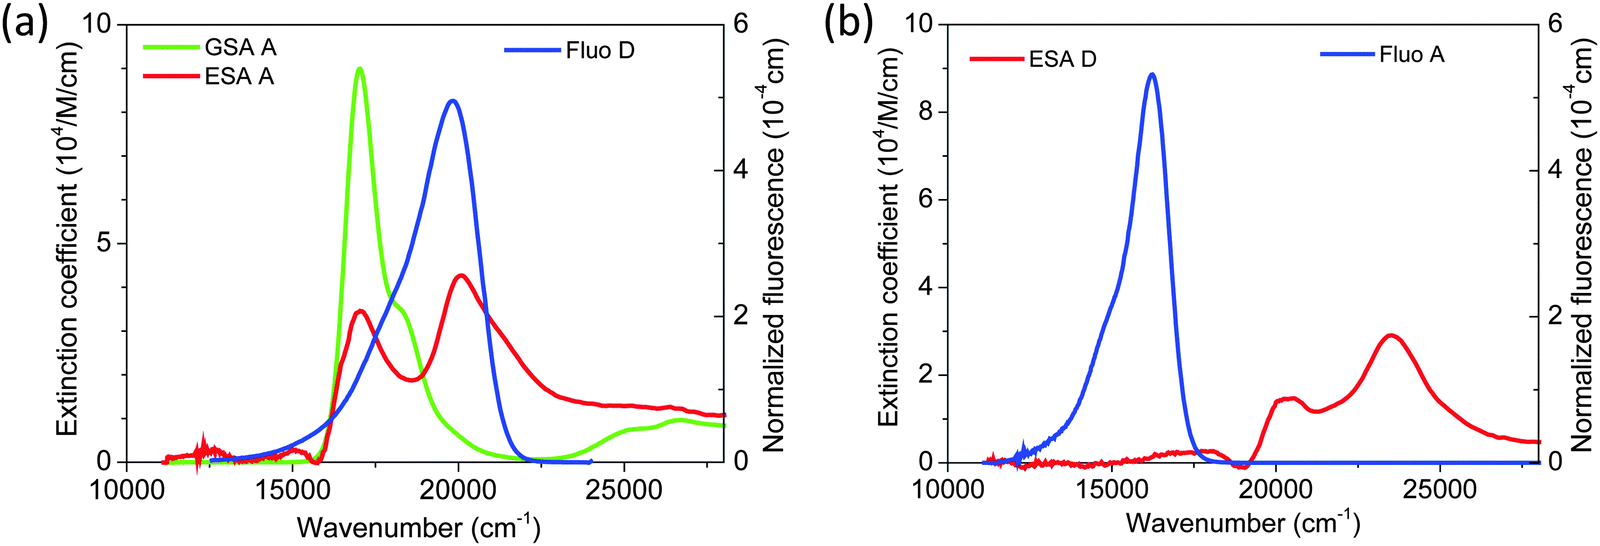 | ||
| Fig. 3 (a) Extinction coefficients (in 104 M−1 cm−1) of S0 (green) and S1 (red) states of the acceptor A (Alexa 594), superimposed with the normalized fluorescence spectrum (blue, in 10−4 cm) of the donor D (Alexa 488). The overlap of the latter with the absorption spectra from both S0 and S1 states of A is pronounced, indicating efficient energy transfer from D to A via S1S0 → S0S1 (‘normal’ FRET) or S1S1 → S0Sn (first step of the SSA mechanism). (b) Extinction coefficient of the S1 state (red) of D, superimposed with the fluorescence spectrum of A (blue): here the overlap is negligible, indicating that no annihilation occurs by energy transfer from A to D (SSA′ mechanism). | ||
From these results, we can thus conclude that SSA between Alexa 488 and 594 occurs with a Förster radius and thus at a rate very similar to that of the “usual” energy transfer process, S1S0 → S0S1. Accordingly, SSA in the intermediate regime (Fig. 1) needs to be taken into account for a fully quantitative treatment of FRET experiments, especially at high excitation rates, and for the quantitative interpretation of FCS results in the nanosecond range.22 An important consequence of SSA is that deviations in the observed transfer efficiency caused by the population of the S1S1 state are mitigated by the resulting non-radiative depopulation of the double-excited state. In fact, SSA via energy transfer from Alexa 488 to Alexa 594, which we find to be preferred, results in a smaller deviation from the ideal weak-excitation limit than the reverse direction of transfer would (Fig. 1c).
Although our results indicate an important role of SSA for the observed FRET efficiency at high excitation rates, additional effects and photophysical states may contribute to the overall process, specifically triplet states (T1), which are populated significantly by most fluorophores used for single-molecule studies.25 In a recent theoretical analysis, Camley et al.26 investigated the role of triplet blinking and the S1S1 state on Förster transfer outside the weak-excitation limit but in the absence of annihilation effects. They assumed that the donor cannot transfer its energy to the acceptor when the latter is in the T1 state. Since triplet state lifetimes are typically in the microsecond range (i.e. much longer than the excited singlet state lifetimes), this scenario leads to an increased emission of donor photons until the acceptor returns to the singlet manifold, resulting in a decreased Eapp.26 However, energy transfer of the type 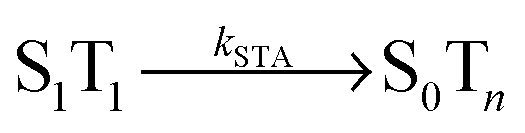 with subsequent radiationless internal conversion, S0Tn → S0T1, i.e., singlet–triplet annihilation (STA), can occur in multichromophoric systems.27 Analogous to the case of SSA, sufficiently strong STA would lead to the quenching of donor fluorescence in the S1T1 state, and the deviation between Eapp and E would become less pronounced or even negligible, as illustrated in Fig. 4.
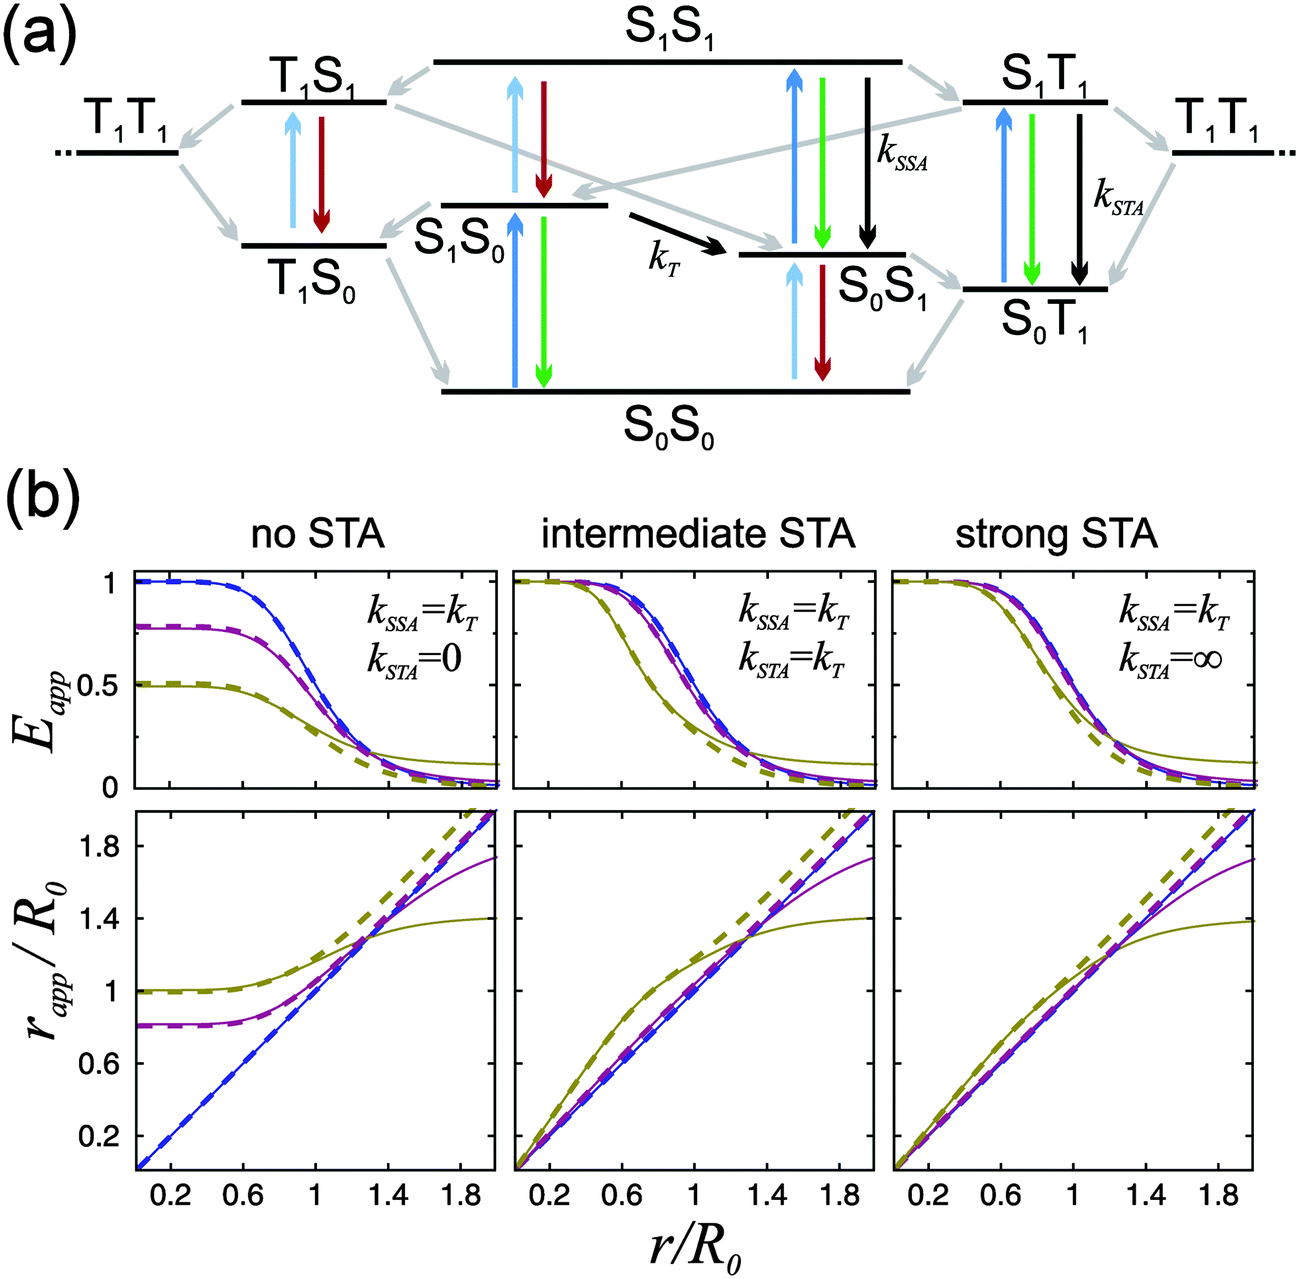 | ||
| Fig. 4 (a) Jablonski diagram of a donor–acceptor FRET pair including triplet T1 states of both dyes that are populated and depopulated via intersystem crossing (grey arrows). Fluorescence photons emitted from S1S1, S1T1, and T1S1 (green and red arrows) are responsible for the deviation of Eapp from E. Quenching of the S1S1 state by SSA and the S1T1 state by STA reduce the deviation. (For clarity, the T1T1 state is represented twice in the diagram.) The effect of STA on Eapp is demonstrated in (b), where, analogous to Fig. 1c, Eapp(r) and rapp(r) were calculated for three limiting cases: no, intermediate, and strong STA. For each case again three different excitation rate coefficients were assumed: kex → 0 (blue), kex = 0.1kD (purple), and kex = kD (yellow). kSSA was set to kT in all calculations. The rate coefficients of ISC for donor and acceptor dye were determined from FCS measurements to be for Alexa 488: kS1→T1 = 0.9 ± 0.4 μs−1 and kT1→S0 = 0.2 ± 0.1 μs−1 and for Alexa 594: kS1→T1 = 1.0 ± 0.5 μs−1 and kT1→S0 = 0.3 ± 0.1 μs−1. (The errors result from the high uncertainty in kex.) The T1S1 state, which can emit acceptor fluorescence photons, is not quenched in this model calculation. It is, however, only weakly repopulated from T1S0 (light blue arrow) with αkex, while the S1T1 state is repopulated from S0T1 with kex (dark blue). Full lines were calculated with acceptor direct excitation, α = 0.05, dashed lines with α = 0. Further it was assumed that kD = kA. | ||
Transient absorption spectra of the T1 state have been measured with flash photolysis and radiolysis experiments for several organic dyes, including rhodamines.28–32 In these cases, the absorption spectra of the T1 state are blue-shifted with respect to S1 absorption, and the T1 absorption cross-section is of similar magnitude, often even greater, than the S1 absorption. The resulting larger overlap of the donor S1 emission and the acceptor T1 absorption suggests that the Förster radius for the S1T1 → S0Tn energy transfer tends to be larger than the one of the S1S0 → S0S1 transfer. A similar observation was made by Hofkens et al., who determined the Förster radii for homotransfer in perylene diimide.6 They found an S1S0 → S0S1 Förster radius of 5.4 nm, an SSA Förster radius of 5.9 nm, and a significantly larger STA Förster radius of 8.7 nm, i.e., kSTA ≈ 17×kT in this case. We are not aware of any triplet absorption spectra reported for Alexa 488 and Alexa 594 that could be used to quantify the strength of STA for this specific dye pair. However, microsecond FCS experiments using Pro20 with variable direct excitation of the acceptor in addition to donor excitation are indicative of the existence of STA (Fig. 5). We observe, as expected, a significant increase in the triplet component of gAA(τ) with increasing acceptor direct excitation, indicative of an increasing triplet population of the acceptor. In the absence of STA, we would expect the donor to increase in brightness while the acceptor is in the triplet. Hence, one would also expect an increasing triplet component in gDD(τ). Instead, virtually no change in the triplet component of the donor autocorrelation is observed (Fig. 5a). From this observation we conclude that kSTA is of similar magnitude as kT. With the assumption that kSTA ≈ kT, model calculations show that Eapp remains very close to E as long as kex is not greater than about a tenth of kD and kA (Fig. 4b), a regime that is rarely exceeded in single-molecule FRET experiments. Without STA, even these excitation rates would lead to pronounced deviations between Eapp and E.26
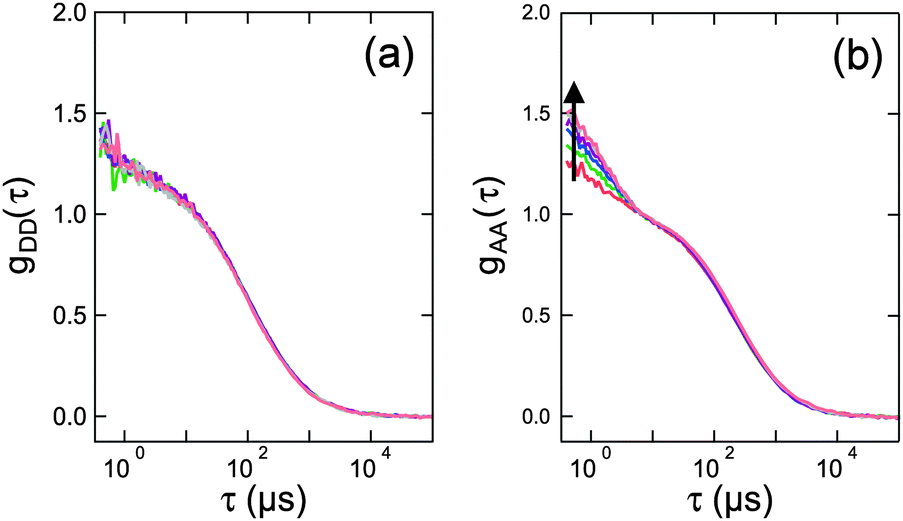 | ||
| Fig. 5 FCS data measured on 1 nM of Pro20 freely diffusing in solution. (a) and (b) represent the donor–donor, gDD(τ), and acceptor–acceptor, gAA(τ), autocorrelation functions, respectively. The donor was excited at 488 nm with a laser power of 20 μW (measured at the back aperture of the objective). The arrow indicates additional direct acceptor excitation at 594 nm with increasing power (0, 20, 40, 60, 80, 100, and 110 μW). The FCS curves are normalized with respect to the amplitude of the diffusion component. | ||
To test our predictions on the influence of SSA and STA on Eapp, we measured transfer efficiency histograms at different laser powers using a FRET-labeled construct for which we expect a pronounced potential dependence of Eapp on laser power and on different strengths of SSA and STA. To this end, we chose a 14-residue polyproline peptide (Pro14, labeled with Alexa 488 and Alexa 594 at its termini, as for Pro20), which is expected to have a transfer efficiency of ∼0.8 (Fig. 6). Besides the smaller inter-dye distance, Pro14 has the advantage of exhibiting a narrower transfer efficiency peak than Pro20.17 We measured Pro14 at different laser powers that roughly correspond to kex values of 0.05, 0.1, 0.2, and 0.3 times kD. On the one hand, we observe, as expected, an increase in the number of detected bursts with increasing laser power until saturation is approached. (The threshold for burst identification was held constant at a minimum of eighty photons per burst.) On the other hand, there is no significant shift in the apparent transfer efficiency towards lower values with increasing laser power. In the inset of Fig. 6, we depict for comparison three different scenarios of the changes in Eapp expected theoretically assuming the photophysical model of Fig. 4a (with kSSA = kT). As discussed above, the greatest shift in Eapp would be expected in the case of complete absence of STA (line with largest negative slope). The shift is, however, much less pronounced for the case of intermediate strong STA (kSTA = kT). If we assume stronger STA with kSTA = 3kT, the dependence of Eapp on laser power approaches the experimental observation of an apparent transfer efficiency that is essentially constant (curve with smallest slope). Unfortunately, we do not observe histograms of suitable quality at laser powers much greater than 600 μW, as with increasing excitation rate, the transfer efficiency peak smears out toward smaller values; this effect is noticeable already at powers >200 μW and most likely due to increased photobleaching of the acceptor during the diffusive passage of labeled Pro14 through the laser focus. Note that the excitation wavelength of 485 nm (corresponding to 20600 cm−1) is close to a resonance in the ESA spectrum of Alexa 594 (Fig. 3a), and excited state absorption of Alexa 594 most likely accelerates photobleaching.33
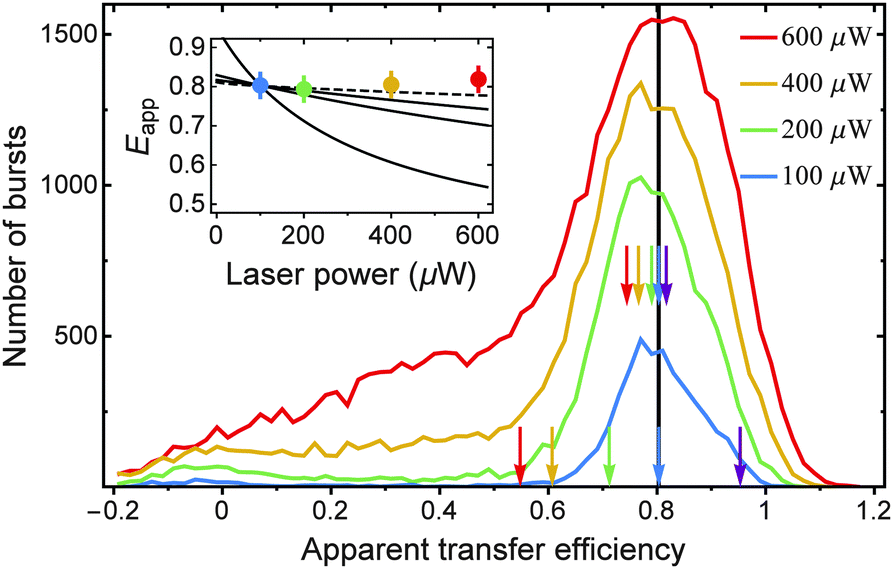 | ||
| Fig. 6 Apparent transfer efficiency histograms of Pro14, terminally labeled with Alexa 488 and Alexa 594, measured at different laser powers (see color legend; 20 pM in 50 mM sodium phosphate buffer, pH 7). Taking the transfer efficiency of the 100 μW measurement as a reference (black vertical line) and assuming that under this condition kex = 0.05kD, we calculate Eapp as a function of the laser power for four cases (see inset, black curves): (1) absence of SSA and STA (largest negative slope); (2) ω = 1 and kSTA = kT (intermediate slope); (3) ω = 1 and kSTA = 3kT (small slope); (4) same as case 2, but with an additional transition S1T1 → S0S1 due to reverse ISC with a rate constant of 0.1 × kT (dashed line). Calculated Eapp values are also indicated by arrows in the histograms for case one (bottom set of arrows) and case three (top set of arrows). At higher excitation powers, the measured FRET peak smears out due to photobleaching of the acceptor (see main text). The measured mean Eapp are given by the peak positions (obtained from Gaussian-peak fits) and are represented in the inset for comparison (colored points). We estimate an uncertainty of ±0.03 on these values (error bars). | ||
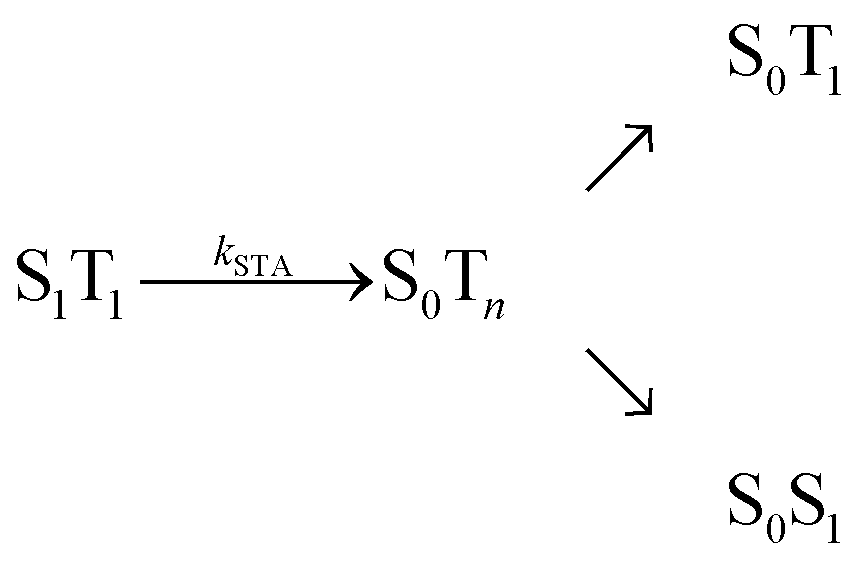
Both SSA and STA thus contribute to a low dependence of the observed transfer efficiency on excitation power. To account for the residual deviation of the calculated power dependence of Eapp from the experimental data (Fig. 6), additional photophysical processes may contribute. For instance, it has been suggested5,34 that the STA process has two non-radiative relaxation channels, as depicted in the following reaction scheme:
 of Alexa 488 at 488 nm to be 5% of kex (see Fig. S4 in the ESI†). Including this process in the model of Fig. 4a has virtually no effect on the apparent transfer efficiencies shown in Fig. 4b and 6.
In conclusion, annihilation processes evidently need to be taken into account for a quantitative understanding of the FRET process outside the weak excitation limit, and they make an important contribution to reducing the dependence of FRET measurements on excitation rate. Our results clearly show the presence of SSA, which leads to an efficient depopulation of the doubly excited singlet state. In addition, there are strong indications that STA also occurs in our FRET pair and further contributes to reducing the power dependence of observed FRET efficiencies. Excited state annihilation can thus explain why FRET efficiencies observed experimentally, e.g., on surface-immobilized single molecules, are usually quite robust with respect to the irradiance used. Likewise, in the absence of excited-state annihilation, the distribution of excitation intensity across the confocal volume would be expected to lead to a broadening of the FRET efficiency histograms observed for molecules freely diffusing in solution. For the most common applications of FRET, SSA and STA thus lead to the wide applicability of the approximations taken from the weak excitation limit and do not need to be considered in detail. For a rigorous analysis of rapid correlation experiments in the nanosecond range and below, however, annihilation processes need to be taken into account explicitly.22 Given that problems with deviations in FRET efficiencies outside the weak excitation limit have rarely been reported, it seems likely that the processes described here affect other commonly used single-molecule FRET pairs in a similar fashion.
Materials and methods
Single-molecule fluorescence spectroscopy
Observations of single-molecule fluorescence were made using a custom-built confocal microscope equipped with a continuous wave, 488 nm solid-state laser (FCD488-010, JDSU) and an Olympus UplanSApo 60x/1.20W objective. After passage through a triple-band mirror that separates excitation and emission light (BS R405/488/594, Chroma Technology), fluorescence emission passed through a 100 μm pinhole. For nsFCS measurements, the photon signal was then divided randomly by a 50–50-beam splitter cube. Each fraction was further separated into donor and acceptor fluorescence by a dichroic mirror (585DCXR, Chroma Technology). Donor fluorescence in each channel then passed a filter (ET525/50m, Chroma Technology) before being focused onto a single-photon avalanche diode (MPD 100ct, Micro Photon Devices). Similarly, acceptor fluorescence in each channel passed a filter (HQ650/100m, Chroma Technology) before being focused onto an MPD. Since the QT650/100 filter does not provide sufficient blocking in the infrared range, an additional filter (720/SP, Semrock) was inserted to suppress the mutual detection of avalanche photon diode breakdown flashes.51 We obtained correction factors γ = 0.53 and β = 0.04 from calibration measurements.52 Peptide samples were prepared as described previously.17 Transfer efficiency histograms were recorded with two detectors. In this case, acceptor photons were detected by an avalanche photon diode (SPCM-AQR-14, Perkin Elmer Optoelectronics) with higher quantum efficiency in the red (but lower time resolution) as compared to the MPDs. We determined γ = 1.05 and β = 0.06 for this configuration. The acceptor direct excitation of α = 0.05 was calculated from the extinction coefficients of Alexa 594 and Alexa 488 at 488 nm.The arrival time of every photon was recorded with a time-correlated, single-photon counting module (HydraHarp 400, PicoQuant). All measurements were performed with a laser power of 100 μW, measured at the back aperture of the objective (beam waist ∼8 mm) unless indicated otherwise. For the FCS measurements, the relative timing of the detection channels was synchronized by recording on all four MPDs photons of picosecond laser pulses from a supercontinuum laser (Fianium, Sc-450-6-PP-01) with the repetition rate set to 20 MHz reflected from a cover slide (filters removed). The wavelength of the laser pulses was selected by a band pass filter (z582/15, Chroma Technology). Photon detection times were measured relative to a synchronization signal from a fast photodiode onto which a fraction of the laser light was diverted. Photon arrival time histograms (1 ps binning) were integrated over ten minutes at photon count rates of about 104 per second on each detector. The recorded distributions have full width at half maximum of about 100 ps. They can be overlaid with a residual jitter of about 3 ps for repeated measurements. Finally, we adjusted the timing offset settings of the HydraHarp 400 such that all four normalized pulse distributions were in agreement to within 3 ps.
For FCS measurements, the arrival times of the output signals of the MPDs were recorded and stored to hard disk with respect to the internal clock of the HydraHarp with 1 picosecond resolution (T2 measurement mode). The MPDs are specified to have a timing jitter of ∼50 ps. The correlation curves were calculated for equidistant lag times with 20 ps binning. To avoid the dead times of the individual detectors and the effect of afterpulsing, only crosscorrelations between detector signals were calculated:53,54 for GDD(τ) between the two donor detection channels, for GAA(τ) between the two acceptor detection channels, and for GAD(τ) between the combined signals of the two acceptor and donor detection channels, respectively.
Calculation of Eapp
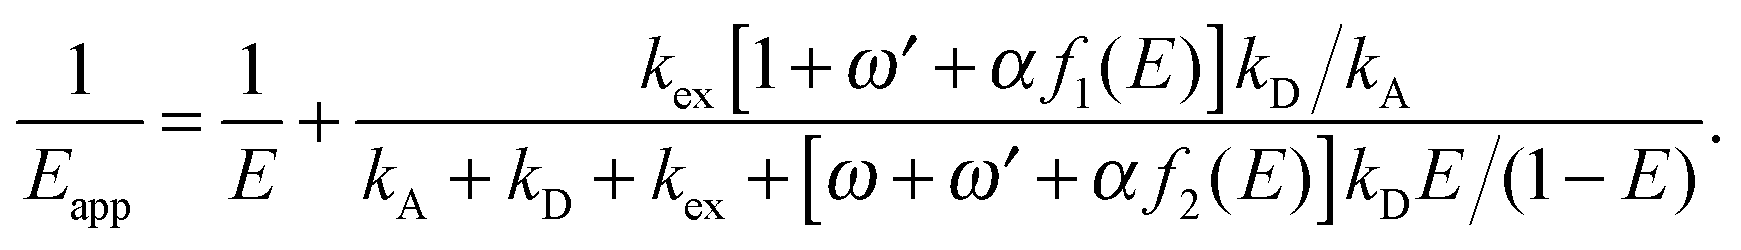
We define p as the normalized vector whose elements are the populations of the four photophysical states in the order S0S0, S1S0, S0S1, and S1S1 (see Fig. 1b). The time evolution of p(t) is governed by the rate equation21| dp/dt = Kp | (5) |
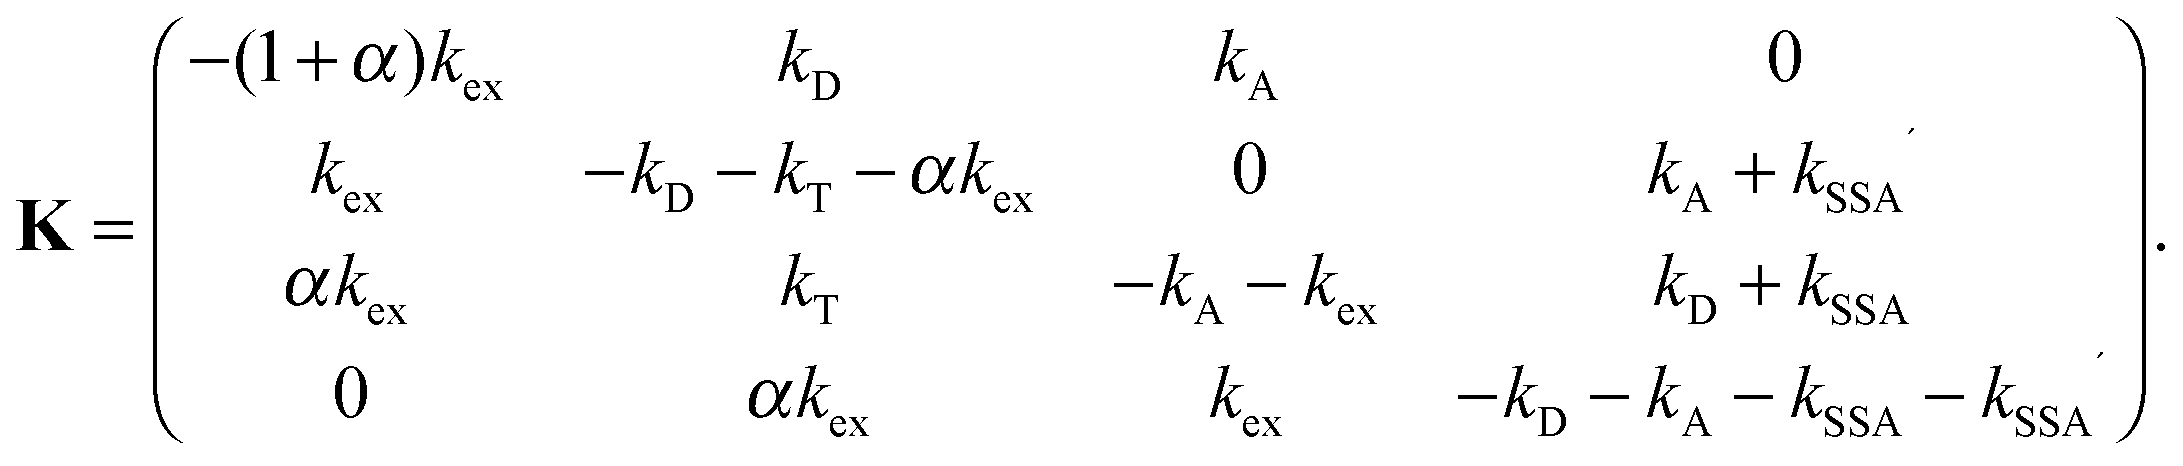 | (6) |
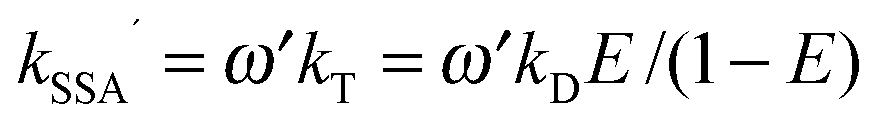
and we make the replacements kT = kDE/(1 − E), kSSA = ωkT = ωkDE/(1 − E), and
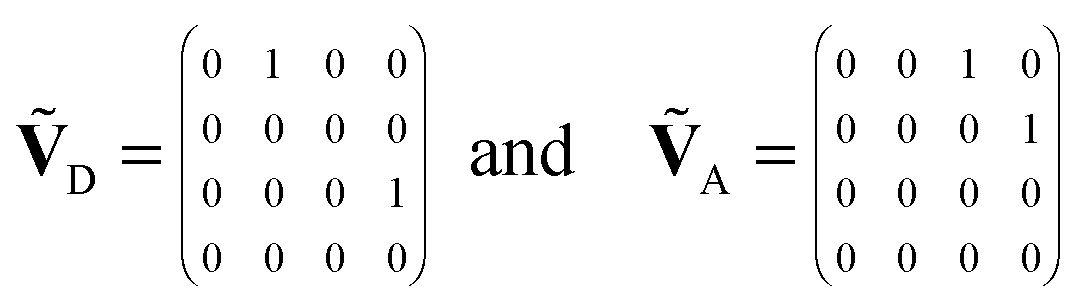
 . With the definitions above, the mean fluorescence photon detection rates can be calculated as
| ni = 1TVipss with i = D, A, | (7) |
| f1(E) = (2 + α)(1 + ω′) + kD−1(1 + α)[kex (1 + α) + kA(2 − ω) + kD(2 + ω′)](1 − E)/E − kD−2(kA − αkD)[kA + kD + (1 + α)kex](1 − E)2/E2 |
| f2(E) = ω + ω′ + kD−1kA−1[kA2 + kAkD + kAkex(1 + (1 + α)ω) − kDkex(1 + α)(1 + ω′)](1 − E)/E − kD−2kA−1(kA − αkD)[kA + kD + (1 + α)kex](1 − E)2/E2. |
Calculation of Gij(τ)
The fluorescence intensity correlation function, gij(τ), between detector channels i and j (i = D, A) of a single molecule with photon emission kinetics described by the rate matrix K is given by9,21,55
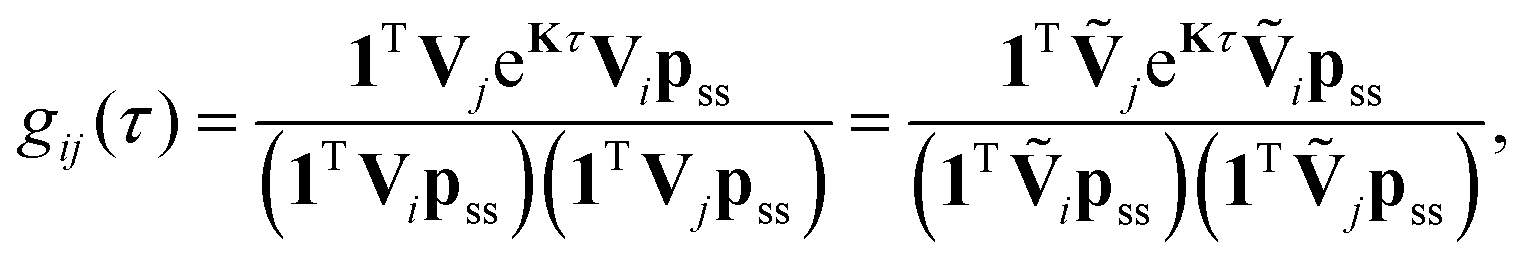 | (8) |
 , respectively. Note that with the exception of ω and ω′, the values of all model parameters in the last term of eqn (8) are known from independent measurements. kD = 0.25 ± 0.01 ns−1 and kA = 0.25 ± 0.01 ns−1 have been determined previously from fluorescence lifetime measurements.22kex = 0.02 ± 0.01 ns−1 was determined from antibunching measurements of donor-only labeled polyproline.9
Polyproline samples exhibit a significant population of cis-isomers within all-trans polyproline helices, which leads to the asymmetric broadening of single-molecule FRET efficiency histograms observed for longer polyproline peptides14,17 (Fig. S1, ESI†). The high transfer efficiency peak in the FRET histogram of Pro20 can be well fitted by two Gaussian curves of different positions E1 and E2, different amplitudes, but identical widths (see Fig. S1, ESI†). For obtaining more realistic FCS curves, we hence treat the Pro20 sample as a mixture of two species (labeled 1 and 2) with mean transfer efficiencies E1 and E2. A third species of Pro20 molecules lacking an active acceptor dye (“donor-only”) also has to be taken into account. Hence, the overall correlation function used for fitting the experimental data is given by
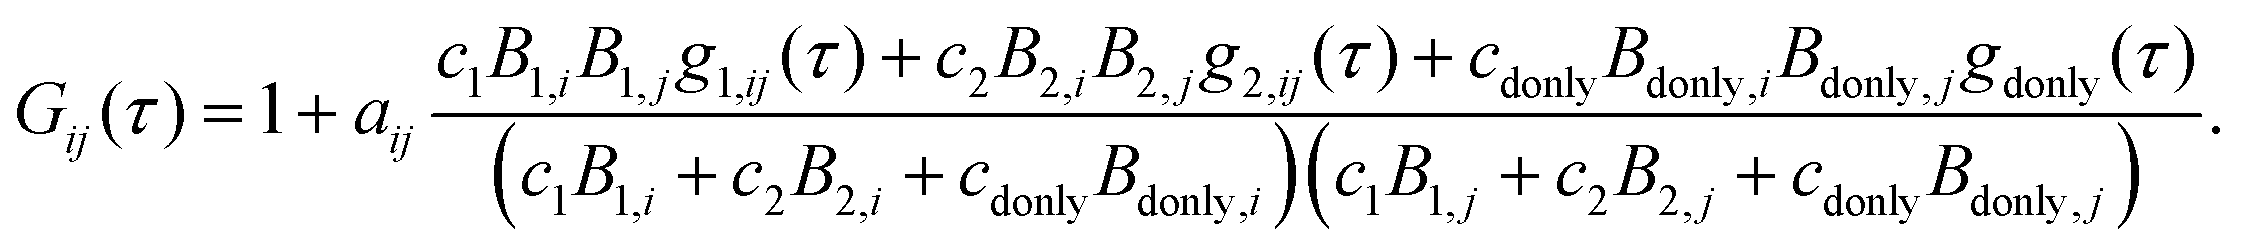 | (9) |
| Bs,D = 1 −Es, Bs,A = γ(Es + α) + β(1 −Es), Bdonly,D = 1, and Bdonly,D = β. | (10) |
| gdonly(τ) = 1 −cabe−kD|τ|. | (11) |
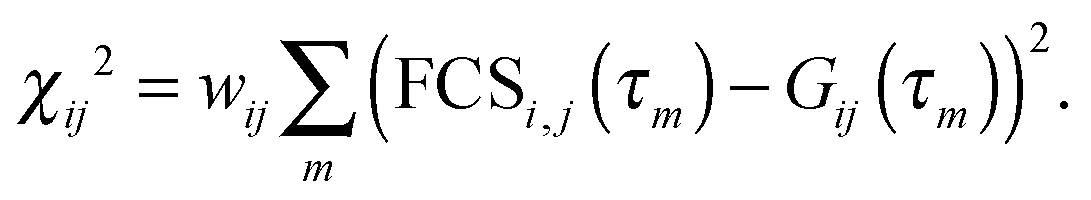
Global fit of the FCS data
We fitted the model FCS curves, GDD(τ), GAD(τ), and GAA(τ) globally to the measured data in Fig. 3 by minimizing the sum of three corresponding χ2 functions, each being of the formThe weights are the reciprocal variances for each data point, wij = 1/σij2 (we assume uniform variances for all data points in one FCS curve). Koppel57 showed that the signal-to-noise ratio of an FCS curve of a single species is proportional to its molecular brightness B if B·Δ ≪ 1, where Δ is the binning interval of the experimental FCS data. In our case with a molecular brightness of ∼0.1 μs−1 and Δ = 20 ps, this requirement is clearly met. As the amplitude of the FCS curve itself does not depend on the brightness, we conclude that the variance of the signal is proportional to σ2 ∝ 1/B2. Generalizing this result to dual-color FCS, we obtain σij2 ∝ 1/(BiBj). Therefore we weight the χ2 functions with wAA = BABA, wAA = BABA, and wAD = 4BABD, where Bi is the mean relative brightness Bi = c1B1,i + c2B2,i + cdonlyBdonly,i. The factor four is justified since the cross correlation was obtained from two donor and two acceptor detection channels and the effective molecular brightness ‘seen’ by a detector pair is twice as large as for a single detector. Our choice of relative weights is empirically confirmed by comparison to the variances calculated from the residuals shown in Fig. 3.
The total of the three χi,j2 functions was minimized by varying ω and the four amplitudes aDD, aAD, aAA, and cab. The best fit values were found to be ω = 0.95, aDD = 0.59, aAD = 0.41, aAA = 0.70, and cab = 0.91. For estimating the error on ω, we minimized χ2 repeatedly (10000 times) by randomly varying the “fixed” model parameters α, β, γ, kD, kA, E1, E2, c1, and c2 by 5% about the values given above assuming normal distributions. kex was also varied, but with a standard deviation of 50% owing to its larger uncertainty. The distribution of ω values obtained by this procedure is essentially symmetric around ω = 0.95 with a standard deviation of 0.06.
Excited state extinction coefficients
We used a custom-made pump–probe setup. An amplified Ti:Sa laser system (800 nm; 40 fs pulse duration; 5 kHz repetition rate) is used to inject a TOPAS (optical parametric amplifier, lightconversion). The latter produces the pump beam, tuned to 490 nm or 600 nm to excite Alexa 488 or Alexa 594, respectively. A white-light supercontinuum was produced by focusing a small fraction of the fundamental 800 nm pulse into a CaF2 crystal, and used as the probe. The sample solutions with an optical density of ∼3 cm−1 in 100 mM potassium phosphate buffer pH 7.2 in the presence of 0.1% sodium azide, 0.25% dimethyl sulfoxide, 0.02% 2-mercaptoethanol, were filtered with a 0.22 μm filter and circulated in a 1 mm thick flow cell, using a peristaltic pump. Pump and probe pulses were overlapped inside the flow cell. The samples were excited to S1 within the linear regime of excitation by a pulsed laser beam. The transmitted probe spectrum was detected with a spectrograph equipped with a CCD camera. By chopping the pump beam, the transmitted probe spectrum was measured successively with and without exciting the sample. A differential absorbance signal (ΔA) is thus computed that reveals the spectral signatures of the transient states. The time delay between the two pulses was adjusted by means of a delay line to 100 picoseconds.The resulting transient spectra are the sum of three contributions, which are the ESA we aim at retrieving, the GSB which is the opposite of GSA, and the SE. Exactly as GSA, SE may be described by a (negative) extinction coefficient εSE(ν) (in units of M−1 cm−1), since both processes result from the same light–matter interaction, as revealed by the equality of both corresponding Einstein coefficients B.58 In molecular systems, however, since equilibrium ground and excited states correspond to different nuclear configurations, the spectral shapes for GSA, SE and fluorescence are different.24 Still, whenever the molecular transition dipole moment is weakly affected by the nuclear degrees of freedom, a simple relation, derived by Strickler & Berg,59 relates the extinction coefficient for GSA to that of SE or to the fluorescence spectrum, as follows:
 000 M−1 cm−1 for Alexa 594 and 71000 M−1 cm−1 for Alexa 488 (Invitrogen).
The ESA extinction coefficient εESA(ν) is retrieved by subtracting the spectrum (εSE(ν) − εGSA(ν)) from the scaled transient spectrum obtained experimentally, as illustrated in Fig. S2 (ESI†). This last step remains somewhat subjective, since the only a priori knowledge of the ESA spectrum is εESA(ν) ≥ 0. In the present case, however, the remarkable similarity between the shapes of the SE and of the transient absorption signal in the red part of the spectrum strongly suggests that no ESA band overlaps in that spectral range.
Finally, we note that the ground state (S0) extinction coefficients of both compounds, which are used here to scale the values of their S1 extinction coefficients, remain somewhat uncertain, with a possible error as large as 20% (as reflected by the variation in values provided by the manufacturer over the past 15 years). The J values computed here would thus carry the same systematic uncertainty. As a further test, we applied the Strickler–Berg formula59 (which applies well to rhodamine, a dye similar in structure to the Alexa dyes) to predict the fluorescence lifetimes of the donor and acceptor dyes employed here, using their known quantum yields (Molecular Probes). The result is no more than 10% off the measured values, which are 4.05 ns for both dyes. We conclude that the systematic error for the estimate of the overlap integrals is also likely to be ≤10%.
Acknowledgements
This work was supported by Swiss National Science Foundation (B. S.). S. M., M. G. and J. L. acknowledge support from the Ministère de l'Enseignement Supérieur et de la Recherche, the Région Alsace, and the Agence Nationale de la Recherche (grant number ANR-11-JS04-0010).References
- L. Stryer, Annu. Rev. Biochem., 1978, 47, 819–846 CrossRef CAS PubMed.
- C. Joo, H. Balci, Y. Ishitsuka, C. Buranachai and T. Ha, Annu. Rev. Biochem., 2008, 77, 51–76 CrossRef CAS PubMed.
- T. Förster, Ann. Phys., 1948, 6, 55–75 CrossRef.
- B. Fückel, G. Hinze, F. Nolde, K. Müllen and T. Basche, Phys. Rev. Lett., 2009, 103, 103003 CrossRef PubMed.
- C. G. Hübner, G. Zumofen, A. Renn, A. Herrmann, K. Müllen and T. Basché, Phys. Rev. Lett., 2003, 91, 093903 CrossRef PubMed.
- J. Hofkens, M. Cotlet, T. Vosch, P. Tinnefeld, K. D. Weston, C. Ego, A. Grimsdale, K. Mullen, D. Beljonne, J. L. Bredas, S. Jordens, G. Schweitzer, M. Sauer and F. De Schryver, Proc. Natl. Acad. Sci. U. S. A., 2003, 100, 13146–13151 CrossRef CAS PubMed.
- B. Fückel, G. Hinze, F. Nolde, K. Müllen and T. Basche, J. Phys. Chem. A, 2010, 114, 7671–7676 CrossRef PubMed.
- B. Schuler, E. A. Lipman and W. A. Eaton, Nature, 2002, 419, 743–747 CrossRef CAS PubMed.
- D. Nettels, I. V. Gopich, A. Hoffmann and B. Schuler, Proc. Natl. Acad. Sci. U. S. A., 2007, 104, 2655–2660 CrossRef CAS PubMed.
- B. Schuler and H. Hofmann, Curr. Opin. Struct. Biol., 2013, 23, 36–47 CrossRef CAS PubMed.
- M. Margittai, J. Widengren, E. Schweinberger, G. F. Schroder, S. Felekyan, E. Haustein, M. Konig, D. Fasshauer, H. Grubmuller, R. Jahn and C. A. M. Seidel, Proc. Natl. Acad. Sci. U. S. A., 2003, 100, 15516–15521 CrossRef CAS PubMed.
- E. Rhoades, M. Cohen, B. Schuler and G. Haran, J. Am. Chem. Soc., 2004, 126, 14686–14687 CrossRef CAS PubMed.
- T. Tezuka-Kawakami, C. Gell, D. J. Brockwell, S. E. Radford and D. A. Smith, Biophys. J., 2006, 91, L42–L44 CrossRef CAS PubMed.
- R. Best, K. Merchant, I. V. Gopich, B. Schuler, A. Bax and W. A. Eaton, Proc. Natl. Acad. Sci. U. S. A., 2007, 104, 18964–18969 CrossRef CAS PubMed.
- A. C. M. Ferreon, Y. Gambin, E. A. Lemke and A. A. Deniz, Proc. Natl. Acad. Sci. U. S. A., 2009, 106, 5645–5650 CrossRef CAS PubMed.
- H. S. Chung and W. A. Eaton, Nature, 2013, 685–688 CrossRef CAS PubMed.
- B. Schuler, E. A. Lipman, P. J. Steinbach, M. Kumke and W. A. Eaton, Proc. Natl. Acad. Sci. U. S. A., 2005, 102, 2754–2759 CrossRef CAS PubMed.
- R. Hanbury Brown and R. Q. Twiss, Nature, 1956, 177, 27–29 CrossRef.
- H. J. Kimble, M. Dagenais and L. Mandel, Phys. Rev. Lett., 1977, 39, 691–695 CrossRef CAS.
- ü. Mets, in Fluorescence Correlation Spectroscopy, ed. E. S. Elson and R. Rigler, Springer-Verlag, Berlin, 2001 Search PubMed.
- I. V. Gopich and A. Szabo, J. Chem. Phys., 2006, 124, 154712 CrossRef PubMed.
- D. Haenni, F. Zosel, L. Reymond, D. Nettels and B. Schuler, J. Phys. Chem. B, 2013, 117, 13015–13028 CrossRef CAS PubMed.
- R. B. Best, H. Hofmann, D. Nettels and B. Schuler, Biophys. J., 2015, 108, 2721–2731 CrossRef CAS PubMed.
- D. L. Dexter, J. Chem. Phys., 1953, 21, 836–850 CrossRef CAS.
- J. Widengren, U. Mets and R. Rigler, J. Phys. Chem., 1995, 99, 13368–13379 CrossRef CAS.
- B. A. Camley, F. L. H. Brown and E. A. Lipman, J. Chem. Phys., 2009, 131, 104509 CrossRef.
- F. C. De Schryver, T. Vosch, M. Cotlet, M. Van der Auweraer, K. Müllen and J. Hofkens, Acc. Chem. Res., 2005, 38, 514–522 CrossRef CAS PubMed.
- I. Carmichael and G. L. Hug, J. Phys. Chem. Ref. Data, 1986, 15, 1–250 CrossRef.
- V. E. Korobov and A. K. Chibisov, J. Photochem., 1978, 9, 411–424 CrossRef CAS.
- V. E. Korobov, V. V. Shubin and A. K. Chibisov, Chem. Phys. Lett., 1977, 45, 498–501 CrossRef CAS.
- P. C. Beaumont, D. G. Johnson and P. J. Parsons, J. Photochem. Photobiol., A, 1997, 107, 175–183 CrossRef CAS.
- M. W. Ferguson, P. C. Beaumont, S. E. Jones, S. Navaratnam and B. J. Parsons, Phys. Chem. Chem. Phys., 1999, 1, 261–268 RSC.
- X. Kong, E. Nir, K. Hamadani and S. Weiss, J. Am. Chem. Soc., 2007, 129, 4643–4654 CrossRef CAS PubMed.
- L. Fleury, J. M. Segura, G. Zumofen, B. Hecht and U. P. Wild, Phys. Rev. Lett., 2000, 84, 1148–1151 CrossRef CAS PubMed.
- J. Widengren and C. A. M. Seidel, Phys. Chem. Chem. Phys., 2000, 2, 3435–3441 RSC.
- Y. Kamata, K. Akiyama and S. Tero-Kubota, J. Phys. Chem. A, 1999, 103, 1714–1718 CrossRef CAS.
- Z. X. Huang, D. M. Ji, S. F. Wang, A. D. Xia, F. Koberling, M. Patting and R. Erdmann, J. Phys. Chem. A, 2006, 110, 45–50 CrossRef CAS PubMed.
- H. Gratz and A. Penzkofer, Chem. Phys., 2001, 263, 471–490 CrossRef CAS.
- M. Goez and V. Zubarev, Chem. Phys., 2004, 307, 15–26 CrossRef CAS.
- D. S. English, E. J. Harbron and P. F. Barbara, J. Phys. Chem. A, 2000, 104, 9057–9061 CrossRef CAS.
- J. M. Larkin, W. R. Donaldson, R. S. Knox and T. H. Foster, Photochem. Photobiol., 2002, 75, 221–228 CrossRef CAS PubMed.
- J. M. Larkin, W. R. Donaldson, T. H. Foster and R. S. Knox, Chem. Phys., 1999, 244, 319–330 CrossRef CAS.
- C. R. Lambert, I. E. Kochevar and R. W. Redmond, J. Phys. Chem. B, 1999, 103, 3737–3741 CrossRef CAS.
- I. Ruckmann, A. Zeug, R. Herter and B. Roder, Photochem. Photobiol., 1997, 66, 576–584 CrossRef CAS.
- R. W. Redmond, I. E. Kochevar, M. Krieg, G. Smith and W. G. McGimpsey, J. Phys. Chem. A, 1997, 101, 2773–2777 CrossRef CAS.
- S. Reindl and A. Penzkofer, Chem. Phys., 1996, 211, 431–439 CrossRef CAS.
- C. Ringemann, A. Schonle, A. Giske, C. von Middendorff, S. W. Hell and C. Eggeling, ChemPhysChem, 2008, 9, 612–624 CrossRef CAS PubMed.
- C. M. Marian, M. Etinski and V. Rai-Constapel, J. Phys. Chem. A, 2014, 118, 6985–6990 CrossRef CAS PubMed.
- C. Eggeling, J. Widengren, L. Brand, J. Schaffer, S. Felekyan and C. A. M. Seidel, J. Phys. Chem. A, 2006, 110, 2979–2995 CrossRef CAS PubMed.
- A. Schonle, C. Von Middendorff, C. Ringemann, S. W. Hell and C. Eggeling, Microsc. Res. Tech., 2014, 77, 528–536 CrossRef PubMed.
- C. Kurtsiefer, P. Zarda, S. Mayer and H. Weinfurter, J. Mod. Opt., 2001, 48, 2039–2047 CrossRef.
- B. Schuler, Methods Mol. Biol., 2007, 350, 115–138 CAS.
- P. Kask, P. Piksarv, M. Pooga, Ü. Mets and E. Lippmaa, Biophys. J., 1989, 55, 213–220 CrossRef CAS PubMed.
- A. J. Berglund, A. C. Doherty and H. Mabuchi, Phys. Rev. Lett., 2002, 89, 068101 CrossRef PubMed.
- I. V. Gopich, D. Nettels, B. Schuler and A. Szabo, J. Chem. Phys., 2009, 131, 095102 CrossRef PubMed.
- Single Molecule Detection in Solution, Methods and Applications, ed. C. Zander, J. Enderlein and R. A. Keller, Wiley-VCH, Berlin, 2002 Search PubMed.
- D. E. Koppel, Phys. Rev. A: At., Mol., Opt. Phys., 1974, 10, 1938–1945 CrossRef.
- A. Einstein, Phys. Z., 1917, 18, 121–128 CAS.
- S. J. Strickler and R. A. Berg, J. Chem. Phys., 1962, 37, 814–822 CrossRef CAS.
Footnotes |
| † Electronic supplementary information (ESI) available. See DOI: 10.1039/c5cp05321h |
| ‡ Current address: Center for Microscopy and Image Analysis, University of Zurich, Winterthurerstrasse 190, 8057 Zurich, Switzerland |
| § Fluorescence anisotropy measurements indicate that diffusional rotation of the fluorophores, attached via flexible linkers to the ends of the polypeptide, occurs on a timescale of 0.1–0.5 ns.23 We conclude that rotation of the dyes has a negligible effect on the shape of the correlation functions and do not include it in the model. |
| ¶ FCS data were independently measured in two laboratories. The results from the second laboratory are shown in the ESI† (Fig. S3). They agree within the error margins. |
| This journal is © the Owner Societies 2015 |