 Open Access Article
Creative Commons Attribution 3.0 Unported Licence
Electrochemical electron paramagnetic resonance utilizing loop gap resonators and micro-electrochemical cells†
Mika A.
Tamski
a,
Julie V.
Macpherson
b,
Patrick R.
Unwin
b and
Mark E.
Newton
*a
aDepartment of Physics, University of Warwick, Gibbet Hill Road, Coventry, CV4 7AL, UK. E-mail: m.e.newton@warwick.ac.uk
bDepartment of Chemistry, University of Warwick, Gibbet Hill Road, Coventry, CV4 7AL, UK
First published on 13th August 2015
Abstract
A miniaturised electrochemical cell design for Electron Paramagnetic Resonance (EPR) studies is reported. The cell incorporates a Loop Gap Resonator (LGR) for EPR investigation of electrochemically generated radicals in aqueous (and other large dielectric loss) samples and achieves accurate potential control for electrochemistry by using micro-wires as working electrodes. The electrochemical behaviour of the cell is analysed with COMSOL finite element models and the EPR sensitivity compared to a commercial TE011 cavity resonator using 4-hydroxy-2,2,6,6-tetramethylpiperidin-1-oxyl (TEMPOL) as a reference. The electrochemical EPR performance is demonstrated using the reduction of methyl viologen as a redox probe in both water and acetonitrile. The data reported herein suggest that sub-micromolar concentrations of radical species can be detected in aqueous samples with accurate potential control, and that subtle solution processes coupled to electron transfer, such as comproportionation reactions, can be studied quantitatively using EPR.
Introduction
Electron Paramagnetic Resonance (EPR) is a spectroscopic technique that has been applied to electrochemical systems since the early work of Austen et al.1 and Maki and Geske.2 Due to its high sensitivity towards paramagnetic species, EPR can provide key information about radical species generated or consumed during electrode reactions. EPR thus complements electrochemical data by directly identifying radical species, confirming reaction mechanisms, and revealing more subtle interactions, for example, between the radical and its environment.3,4 As such, EPR has not only provided a wealth of information to electrochemists, but EPR spectroscopists have also found electrochemical generation to be a feasible option to standard chemical and optical generation of radical species.5,6There have been a number of approaches to the electrochemical (EC) cell design for EC-EPR, as evident from several reviews.7–10 Due to significant dielectric losses at microwave frequencies, aqueous EC-EPR has typically involved the use of flat cells in conjunction with cavity resonators where the sample is as far as possible confined away from the electric fields in the resonator.11–16 Electrochemical problems associated with these designs include significant ohmic-drop and large capacitive currents limiting the cell time constant.17,18 Problems in terms of EPR performance can include the deterioration of the resonator Quality factor (Q-value) and hence EPR sensitivity due to the interaction of the microwave electric field with the metal electrodes and aqueous sample inside the resonator,7 reproducible alignment of the electrochemical cell inside the resonator between experimental runs, and the inhomogeneity of the microwave magnetic field (B1) inside a cavity resonator.19 Flat cells may also be prone to convection during prolonged electrolysis times6 leading to distortion of both the electrochemical and EPR performance.
Loop Gap Resonators (LGRs) were developed in the early 80's for EPR purposes20 and were applied to EC-EPR by Allendoerfer et al.,21 allowing aqueous samples to be investigated with 50 to 100 times larger absolute sensitivities compared to other resonator-EC cell combinations at the time. In a LGR, the microwave electric field is mostly confined in the gaps of the resonator, allowing aqueous or other dielectrically "lossy" samples to occupy a larger volume relative to the size of the resonator. In addition to favourable EPR performance in aqueous systems for very small sample volumes22 (order of microliters), the smaller size of the resonator also allows the optimization of the electrochemical performance through miniaturization.
Ultramicroelectrode (UME) concepts have gone practically unnoticed in EC-EPR, although some examples of the use of small diameter wires exist.23–25 Electrochemically, the benefits of UMEs include diminished ohmic drop, shorter cell time constants and enhanced mass transport.26–28 However, for EC-EPR applications the small currents associated with UMEs can introduce significant challenges, as radical concentrations generated may be insufficient to allow the EPR study of short-lived intermediates or products. Among UMEs, the micro-cylindrical geometry is one of the simplest and easiest to fabricate and use and is particularly attractive in EC-EPR, as the length of the cylinder can be varied in order to produce the desired amount of current and thus generate a sufficient number of radicals in situ.29–31
Building on the early work of Allendoerfer et al.,21 in this paper we report a new EC-EPR cell design that can be used with an X-band (8–12 GHz) LGR and water as a solvent. The use of micro-wire electrodes overcomes the electrochemical problems associated with flat cells, while the high sensitivity of the LGR makes the study of radical species possible, even with low currents. The design allows a range of working-, reference- and counter electrode (WE/RE/CE) materials and geometries to be used. Possible fouling of the WE can be addressed by exchanging the electrode without dissembling the entire cell and cell parts are reusable and interchangeable to allow maximum experimental flexibility.
Experimental
Cell design
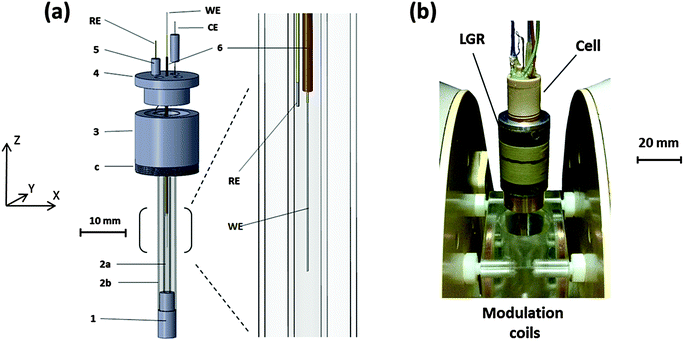
A schematic of the cell designed for the EC-generation of radicals in situ within a LGR is shown in Fig. 1a. Parts 1, 3, 4 and 5 were machined from polyether ether ketone (PEEK) due to the mechanical and chemical stability of the material. Parts 1 and 3 support EPR test tubes, 2a: Q-band EPR tube 1.1 mm ID & 1.6 mm OD, 2b: X-band EPR tube 3.0 mm ID & 4.0 mm OD. 2a is the sample tube holding the solvent and therefore the ID determines the sample volume inside the resonator, but also contains the WE and RE. In an assembled set-up (Fig. 1b and Fig. S1, ESI†) the inner tube holds the solvent away from the fringing electric fields of the LGR gaps. Thus, if necessary, the ID of 2a can be adjusted by choosing a suitable capillary and the performance of the setup optimised for solvents with different dielectric constants. To date, cells with ID's (2a) between 0.8 and 1.1 mm have been fabricated. The X-band tube (2b) acts as a structural support, making the assembled cell robust and easy to handle, while enabling symmetrical placement of the cell into the resonator.Screw threads (c) on part 3 allow the attachment of the cell into the resonator (Fig. 1b) and also the adjustment of the WE inside the resonator in the Z-direction for optimal performance. Part 4 fits to part 3, resulting in a small chamber between them where the CE is located. The four channels in part 4 allow the attachment of Teflon tubing for solvent flow, but also permit the connection of the RE and CE to thicker wires outside the cell for electrical connection through part 5. This arrangement makes changing the RE and CE easy if necessary, whilst the additional channel enables mixing experiments to be conducted.
Part 6 is a fine capillary with dimensions of ca. 0.15 mm ID, 0.4 mm OD through which the WE is guided to the sensitive part of the LGR inside 2a. The capillary can be removed and inserted back through part 4, allowing the WE to be changed when necessary. The bracketed part, from where the enlarged diagram is taken, represents the sensitive region of the 5-loop 4-gap LGR used in this work and has a length of 10 mm in the Z-direction. The RE, inserted into the cell through one of the pegs (5) is placed as close as possible to the WE to minimise the uncompensated resistance. The CE in the chamber of parts 3 and 4 is far enough from the active region of the resonator so that no interference from CE products is expected.
Assembly
An image of the cell attached to the LGR is shown in Fig. 1b, and the LGR, in turn, is attached to a coupling arm. For experiments, the setup is lowered to the middle of the modulation coils, which are fastened between the EPR magnet poles. The in-house built modulation coils provide the high frequency modulation of the DC magnetic field necessary for the lock-in detection in continuous wave (CW) EPR experiments. The LGR attaches to the coupling arm and is coupled to the microwaves inductively32,33 through a rigid coaxial cable with a coupling loop at the end. The coupling arm enables the distance between the resonator and the loop to be adjusted so that a critical coupling can be achieved for optimum sensitivity.The sample is deoxygenated in a glass syringe by bubbling N2 gas through it and introduced into the cell by a syringe pump (Legato 110) through PTFE tubing surrounded by a larger PVC tube. The interior of the PVC tubing is flushed with N2 during the experiment and the flow guided through the whole of the central cavity of the modulation coils, thus creating an inert atmosphere around the entire EC-EPR setup, enabling high reproducibility for oxygen free experiments. Fig. S1 (ESI†) represents the setup in more detail.
Materials
Simulations
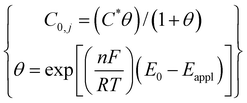
The theory for the diffusion of electro-active species to a micro-cylindrical electrode has been developed for linear sweep experiments. Assuming uniformity along the cylinder, only a single dimension of diffusion has to be considered, and for a linear sweep the analytically obtained peak current density is:29 | (1) |
 | (2) |
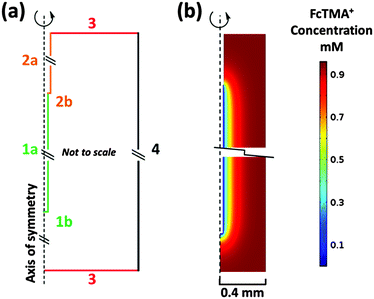
The WE placed inside a 0.8 mm ID sample tube (part 2a Fig. 1a) was modelled using COMSOL Multiphysics 4.4 (COMSOL AB) Finite Element Modelling (FEM) software. Fig. 2a shows a schematic representation of the model. The domain height and width are 11.2 and 0.4 mm respectively for the modelled 0.8 mm ID capillary in 2D axisymmetric geometry. Therefore, the model is not shown to scale, as the height of the domain is significantly greater than the width, but distinguishes the different types of boundaries used.
Boundary 1a is the wire electrode surface where the small edge (1b) represents the tip of the wire. Boundary 2a is the wire insulation with 2b representing the insulation edge (7.5 μm) at the electrode/insulation interface. Boundary 3 represents the bulk solution in the capillary far away from the WE. Boundary 4 is the capillary wall where the concentration of the electroactive species goes to zero. Corresponding boundary conditions for the model are summarised in Table 1.
![[thin space (1/6-em)]](https://www.rsc.org/images/entities/char_2009.gif) 485 C mol−1 and R = 8.314 J mol−1 K−1
485 C mol−1 and R = 8.314 J mol−1 K−1
For 100 and 20 mV s−1 scan rates simulated, 20![[thin space (1/6-em)]](https://www.rsc.org/images/entities/char_2009.gif) 000 and 15
000 and 15![[thin space (1/6-em)]](https://www.rsc.org/images/entities/char_2009.gif) 000 mesh points were applied respectively along the 7 mm long wire electrode (boundary 1a) and 25 mesh points to the electrode tip (boundary 1b). The domain was then meshed continuously with a maximum element growth rate of 1.02 from the electrode surface.
000 mesh points were applied respectively along the 7 mm long wire electrode (boundary 1a) and 25 mesh points to the electrode tip (boundary 1b). The domain was then meshed continuously with a maximum element growth rate of 1.02 from the electrode surface.
FcTMA+ oxidation and the subsequent reduction of FcTMA2+ under diffusion control was modelled for cyclic voltammetry (CV) by solving Fick's second law for the concentration (C) of reactant species:
 | (3) |
Fig. 2b is a snapshot of the concentration of FcTMA+ in the cell during a 20 mV s−1 CV recorded between 0 and 0.6 V at the switching potential of 0.6 V. The figure is zoomed to the electrode/insulation interface and to the wire tip and thus boundaries 3 where C = C* lie further away than suggested by the figure. A 0.8 mm ID sample tube (2a, Fig. 1a) was chosen for the model, as the simulations results were identical to those obtained with the wire electrode in a bulk solution, indicating that for a symmetrically placed WE, the cell wall does not hinder the diffusion field, and thus the model is representative of eqn (1) and (2).
The LGR
The role of the resonator is to concentrate the B1 field in the sample and make the signal produced by the change in magnetic susceptibility at resonance as large as possible. Rather than trying to fit the experiment to general purpose cavity EPR resonators, LGR's provide the opportunity to adapt the resonator to the experiment. The CW EPR signal is proportional to the loaded resonator Q-value (QL) and the filling factor (η):35| S ∝ QLη | (4) |
The use of LGR is particularly advantageous for samples of limited volume such as the concentration of short lived radical species in the diffusion field during an electrochemical experiment, and in cases where the sample is non-saturable and large B1 fields can be used.22 In addition, LGRs also allow the miniaturization of the electrochemical setup, enabling the beneficial use of microelectrodes.
EPR
A 5-loop 4-gap resonator was used for the EPR measurements. 4 gaps allow the increase in the diameter of the sample loop, thus facilitating the use of a standard 4 mm OD X-band EPR tube as a structural support. Bruker X-band continuous wave spectrometer (EMX-8/2.7) was used for the EPR measurements. Coupling to the microwave source (Bruker ER 041 X-band Microwave Bridge) was achieved using in-house built coupling arm and inductive coupling.Results and discussion
The effect of the sample tube (2a) ID towards the EPR performance
The larger the ID of the sample tube, the closer the sample is to the fringing electric fields in the gaps of the LGR, leading to an increasing dielectric microwave loss. The unloaded Q-value (Qu) of the 5-loop 4-gap resonator is approximately 1700 in accordance with the literature.22 For water the 1.1 mm ID sample tube gives a typical QL = 500–600 at around 9.57 GHz, one third of the Qu. If the cell is filled with acetonitrile, QL ≈ 900. A cell assembled with the 0.8 mm ID sample tube filled with water gives a QL = 800–900 at around 9.51 GHz frequency. Crucially the insertion of a micro-cylinder WE to the resonator does not introduce a noticeable change in the Q-value or the microwave coupling.Higher Q-values suggest higher sensitivity. However, eventually the diminishing ID of the capillary starts to hinder the electrochemical performance (see Fig. 4 and discussion) and a compromise between the two has to be made depending on the system under investigation.
EPR sensitivity comparison between LGR and cylindrical resonator
The EPR performance between the LGR and a cylindrical TE011 resonator was compared by placing a 1.1 mm ID capillary filled with water containing 10 μM of the stable radical TEMPOL as a reference concentrically through each resonator. The TE011 cavity coupled critically with a Q-value of 1500, whereas the Qu for this resonator was closer to 5000, suggesting that both resonators performed at approximately 1/3 of their Qu. Using a microwave power sweep, saturation curves for both resonators were constructed. The optimal signal to noise ratio (S![[thin space (1/6-em)]](https://www.rsc.org/images/entities/char_2009.gif) :
:![[thin space (1/6-em)]](https://www.rsc.org/images/entities/char_2009.gif) N) achieved with both resonators was approximately 120
N) achieved with both resonators was approximately 120![[thin space (1/6-em)]](https://www.rsc.org/images/entities/char_2009.gif) :
:![[thin space (1/6-em)]](https://www.rsc.org/images/entities/char_2009.gif) 1 (Fig. 3), indicating that in terms of concentration sensitivity they perform equally. Note that the EPR spectrum for TE011 cavity is offset for clarity.
1 (Fig. 3), indicating that in terms of concentration sensitivity they perform equally. Note that the EPR spectrum for TE011 cavity is offset for clarity.
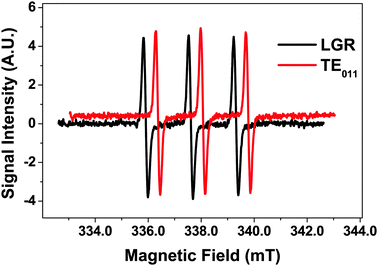 | ||
Fig. 3 1st derivative EPR spectra for 10 μM TEMPOL in LGR and TE011 with S![[thin space (1/6-em)]](https://www.rsc.org/images/entities/char_2009.gif) : :![[thin space (1/6-em)]](https://www.rsc.org/images/entities/char_2009.gif) N = 120. Spectrum for TE011 is offset for clarity by 0.45 mT and 0.4 SI units. N = 120. Spectrum for TE011 is offset for clarity by 0.45 mT and 0.4 SI units. | ||
Although the two resonators performed similarly, taking into account sample volumes inside the resonators, in terms of absolute sensitivity the LGR performed 2–3 times better. In the future η for the LGR could be further increased by reducing the sample loop diameter leading to further sensitivity gains.
Electrochemistry
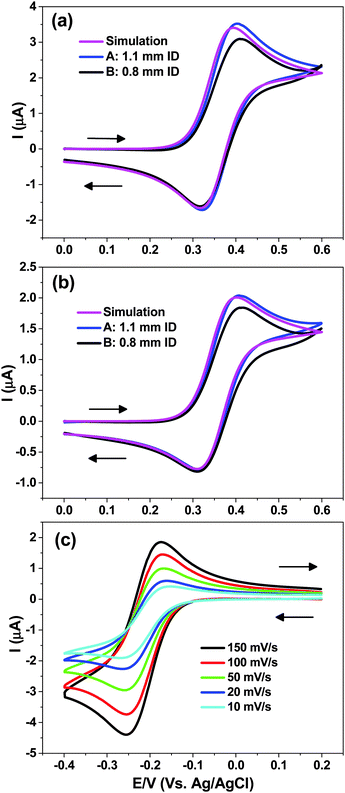
Experimental electrochemical characterization of two cells, representing the largest and smallest ID sample tubes used in this study, i.e. cell A (1.1 mm) and cell B (0.8 mm) are shown in Fig. 4a and b. The working electrode was a 50 μm diameter Pt wire, 7 mm in length, with 125 μm diameter Ag|AgCl RE and a bare Pt wire as a CE, while 0.4 M KCl acted as a supporting electrolyte. The results of the COMSOL simulation (identical for cells A and B) of the CV for the FcTMA+/2+ are also shown in Fig. 4a and b.Fig. 4a reveals that at scan rate of 100 mV s−1 the EC CV behaviour for the oxidation of 1 mM FcTMA+ is very close to that predicted by the simulation assuming a reversible diffusion-controlled process. A peak to peak separation (ΔEP) value of 78 mV is predicted from the simulation, which shows that diffusion is not purely linear at the micro-cylinder electrode. For cell A the simulated ΔEp value is in good agreement with that recorded experimentally, i.e. 83 ± 2 mV. Note that increasing the supporting electrolyte concentration was observed to decrease the ΔEP (due to Ohmic drop effects in the cell geometry employed) until values of ca. 0.4 M, beyond which increasing the concentration showed no appreciable effect. For the cell B measured ΔEP value was 94 ± 2 mV, the difference to that obtained for cell A essentially due to a stretched out oxidative wave of the CV.
Fig. 4b shows the behaviour at 20 mV s−1 scan rate, where increased radial diffusion effects will contribute. This is reflected in a larger simulated ΔEP = 93 mV which compares favourably with 94 ± 2 mV measured for cell A. For cell B the measured ΔEP of 104 ± 2 mV suggests that at slower scan rates this cell behaviour is closer to that predicted.
For cell A, the experimental peak current (iP) was within 3% of that simulated irrespective of the scan rate whereas for cell B the iP value was consistently 8% lower. As discussed above in the simulations section, the capillary wall is not expected to hinder the diffusion field for 0.8 mm ID sample tube. A possible explanation for the slightly lower iP and larger ΔEP values is the fact that the WE is not completely symmetrically placed within the capillary. Thus the diffusion field might be restricted by the capillary wall, although the observed iP values for cell B are still within the tolerance of the wire diameter (±10%) reported by the manufacturer.
The simulated iP for the oxidation wave at 20 mV s−1 agreed with that predicted analytically (eqn (1) and (2)) to within 0.5%, and for 100 mV s−1 to within 2%. For the latter scan rate the no. of mesh points required to approach the value predicted by the analytical equations started to increase exponentially for an incremental increase in simulated iP.
Fig. 4c shows reduction of Ru(NH3)63+/2+ for the cell A at different scan rates. The gradual change in the shape of the CV is evident as the measured ΔEP increases from 80 to 114 mV as the scan rate is reduced from 150 to 10 mV s−1. For mediators such as Ru(NH3)63+/2+ and FcTMA+/2+, scan rates between 10 and 150 mV s−1 seem to be practical for the cell described.
Electrochemical EPR
EPR was carried out in the presence of the electrochemical redox mediator methyl viologen (MV2+) which undergoes two consecutive one electron reduction steps, the first being:MV2+ + e− ![[left over right harpoons]](https://www.rsc.org/images/entities/char_21cb.gif) MV+˙ MV+˙ | (5) |
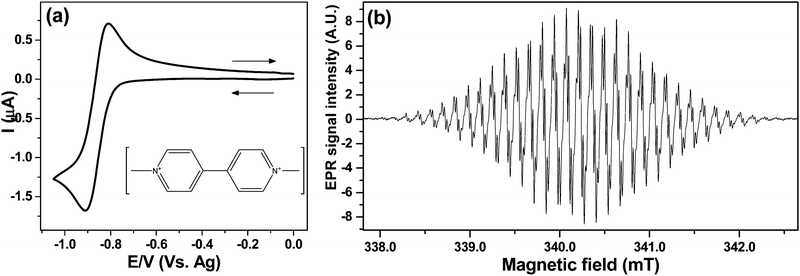
From the CV in Fig. 5a a potential of −0.9 V was chosen to generate MV+˙ under diffusion limited conditions. Fig. 5b shows the spectrum of the radical after electrolysing 1 mM MV2+ solution in the cell A for 2 min. The EPR scan was initiated as the potential was switched off.
The EPR spectrum obtained with 0.02 mT modulation, averaging 5 scans gave a signal to noise (S![[thin space (1/6-em)]](https://www.rsc.org/images/entities/char_2009.gif) :
:![[thin space (1/6-em)]](https://www.rsc.org/images/entities/char_2009.gif) N) of 740
N) of 740![[thin space (1/6-em)]](https://www.rsc.org/images/entities/char_2009.gif) :
:![[thin space (1/6-em)]](https://www.rsc.org/images/entities/char_2009.gif) 1. The Root Mean Square (RMS) value for the noise was calculated from the baseline on a low field side of the spectrum. The emerging hyperfine coupling suggests that no line broadening occurs due to electron exchange between radical–parent interaction proposed previously:24
1. The Root Mean Square (RMS) value for the noise was calculated from the baseline on a low field side of the spectrum. The emerging hyperfine coupling suggests that no line broadening occurs due to electron exchange between radical–parent interaction proposed previously:24
(MV+˙) + (MV2+)* ![[left over right harpoons]](https://www.rsc.org/images/entities/char_21cb.gif) (MV+˙)* + (MV2+) (MV+˙)* + (MV2+) | (6) |
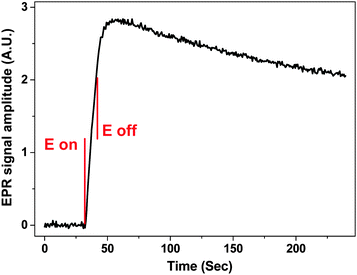
A complementary option for scanning the magnetic field to record the entire EPR spectrum is to fix the field to a given value and monitor the signal amplitude as a potential perturbation is applied. This allows the generation of radical species at the electrode as a function of time and potential to be monitored simultaneously. Fig. 6 shows an average EPR signal amplitude of 5 repetitions as a function of potential and time for 1 mM MV2+ in water and 0.4 M KNO3, as the WE is stepped to −1.0 V for 10 seconds in cell B. Between the 5 repetitions, fresh solution was inserted to the cell via a syringe pump.
The charge generated during a 10 second potential step was ca. 1.4 × 10⁻⁵ C, indicating that the number of radical species (MV+˙) generated was 8.7 × 10¹³. The volume of sample inside the sensitive part of the resonator was 5 μL, and thus the concentration of the radical species can be estimated to ca. 30 μM, assuming 100% efficient electron transfer and that the radical decay is negligible during the relatively short potential step. The S![[thin space (1/6-em)]](https://www.rsc.org/images/entities/char_2009.gif) :
:![[thin space (1/6-em)]](https://www.rsc.org/images/entities/char_2009.gif) N = 122
N = 122![[thin space (1/6-em)]](https://www.rsc.org/images/entities/char_2009.gif) :
:![[thin space (1/6-em)]](https://www.rsc.org/images/entities/char_2009.gif) 1 when the signal was taken to be the maximum EPR amplitude, while for the noise a RMS was calculated from the region before the potential step. Extrapolating from the results in Fig. 6, the limit of quantification (LOQ) was estimated to be 7.1 × 10¹² and the limit of detection (LOD) 2.1 × 10¹² spins or 2.4 and 0.7 μM, respectively if the experiment was to be repeated 5 times.
1 when the signal was taken to be the maximum EPR amplitude, while for the noise a RMS was calculated from the region before the potential step. Extrapolating from the results in Fig. 6, the limit of quantification (LOQ) was estimated to be 7.1 × 10¹² and the limit of detection (LOD) 2.1 × 10¹² spins or 2.4 and 0.7 μM, respectively if the experiment was to be repeated 5 times.
The increase in the EPR signal shown in Fig. 6 is rapid after the potential step is applied at 32 seconds into the experiment. The EPR signal intensity increases for ca. 10 seconds after the potential switches off at 42 seconds, which could be attributed to the radical diffusing away from the electrode surface introducing changes to the filling factor and to the distribution of the radical within the B1 field inside the sample volume. Also the formation of an EPR silent radical cation dimer in water has been proposed41,42
| 2MV+˙ ⇌ (MV)22+ | (7) |
During the following 180 seconds after the potential was switched off the signal intensity decreased to 70% of the largest value, confirming the observation that MV+˙ is indeed a stable radical in aqueous systems at least around neutral pH. No decay constant was calculated, as with the current setup it is possible that the stable radical could diffuse out of the sensitive part of the resonator within 180 seconds.
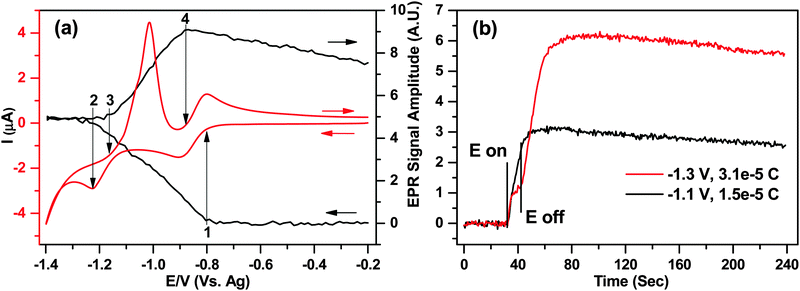
A wider potential sweep CV between −0.2 and −1.4 V for both reduction peaks of MV2+ is shown in Fig. 7a for cell B, corresponding to the electron transfer processes in eqn (5) and also eqn (8)
| MV+˙ + e− ⇌ MV0 | (8) |
After this point, the EPR signal remained constant while the switching potential was reached and the scan reversed, indicating that a steady concentration of radical species was maintained in the cell for ca. 20 seconds, at least on the EPR sensitivity scale. This result seems surprising as at high negative potentials the parent MV2+ molecule would be expected to reduce to MV0, while the already generated MV+˙ would also go through the second reduction step, thus leading to a diminishing EPR signal.
The EPR signal intensity started to increase again during the return scan at the onset of peak (3) on the voltammogram, where eqn (8) was reversed. The shape of the first oxidation peak during the reverse scan suggests a precipitation or deposition of the neutral MV0 on the surface, and subsequent stripping from the electrode. This was also supported by the EPR as the rate of EPR signal increase between points (3) and (4) was ca. 25% larger than between (1) and (2), suggesting that the arrival of the species to the electrode surface exceeded the diffusion limit. Integration of the stripping peak yielded a charge of 2.5 × 10⁻⁵ C or 1.6 × 10¹⁴ molecules being oxidized during the reversal of eqn (8).
Finally the EPR signal intensity started to decrease at the onset of the second oxidation peak of the return wave (4) where eqn (5) was reversed. The signal intensity diminished by less than 20%, as the radical diffused throughout the sample volume and did not have time to arrive to the electrode for oxidation before the experiment finished.
The unexpected levelling of the EPR signal intensity at potentials beyond ca. −1.2 V in Fig. 7a was further investigated by applying two independent 10 second potential steps at −1.1 V and −1.3 V, corresponding to points just before and after the second reduction step, respectively. Fig. 7b displays the EPR amplitudes (y-axis) as a function of time (x-axis), and the applied potentials.
For the −1.1 V potential step corresponding to the process in eqn (5) the EPR signal increased as expected based on the data in Fig. 6 and ca. 1.5 × 10⁻⁵ C of charge was transferred. On the other hand, when the potential was stepped to −1.3 V, after the initial increase in the EPR signal a distinct plateau was observed, and the EPR signal increase didn't resume at the expected rate until the potential was switched off. None the less, as almost exactly twice the charge was generated during the step (3.1 × 10⁻⁵ C) combined with exactly double the EPR signal, there is a clear quantitative evidence that the final product in the solution is the paramagnetic MV+˙ and not the neutral MV0 that the applied potential would suggest.
From Fig. 7a it was determined that MV0 is likely to deposit on the surface of the electrode, so the increase of the EPR signal after the potential is switched off at −1.3 V can be attributed to a process in eqn (9), proposed by Monk et al.42
| MV0 + MV2+ → 2MV+˙ | (9) |
Clearly this setup allows the characterization of electrode processes under precise potential control on a quantitative level with high EPR sensitivity. In the future EC-EPR could be used for example to study comproportionation reactions, previously performed on UMEs, on equal or even lower redox mediator concentrations than before.43
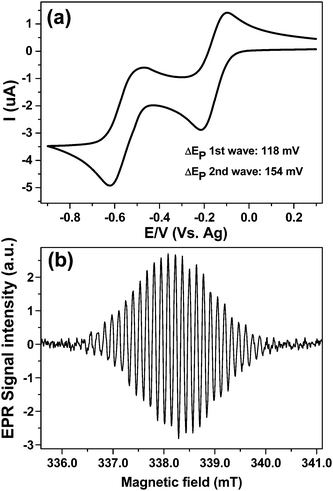
Finally cell A was tested using a solvent with a moderate dielectric loss, acetonitrile. Fig. 8a displays the CV obtained at 100 mV s−1 scan rate over the both reduction steps for 1 mM MV2+ at a 50 μm diameter platinum WE vs. Ag-pseudo reference using 0.2 M TBAP as a supporting electrolyte. Clearly in acetonitrile the neutral MV0 does not deposit on the electrode nor precipitate out of solution, at least to any significant extent, as both peaks of the return wave have a symmetry indicative of mass transport limitation, when compared to the CV in Fig. 7a. The larger cell resistance is obvious from the stretched ΔEp value for the first wave (118 mV) when compared to the aqueous results.
The high EPR sensitivity is evident from Fig. 8b which was obtained after stepping the potential to −0.3 V with a single EPR scan for a concentration of ca. 20 μM of MV+˙ giving S![[thin space (1/6-em)]](https://www.rsc.org/images/entities/char_2009.gif) :
:![[thin space (1/6-em)]](https://www.rsc.org/images/entities/char_2009.gif) N of 72
N of 72![[thin space (1/6-em)]](https://www.rsc.org/images/entities/char_2009.gif) :
:![[thin space (1/6-em)]](https://www.rsc.org/images/entities/char_2009.gif) 1 for 42 sec scan time, indicating that EC-ERP measurements are possible also with organic solvents.
1 for 42 sec scan time, indicating that EC-ERP measurements are possible also with organic solvents.
Conclusions
A novel design of EC-EPR cell has been presented and its electrochemical performance demonstrated with well-known redox mediators. The electrochemical EPR performance was analysed by characterising the behaviour of MV2+ in an aqueous system. These results suggest that the potential control of the cell is precise enough for analytical experiments, while the simultaneous EPR behaviour of the system can be monitored quantitatively under inert atmosphere.Silver, gold and platinum can be used as a WE material between 25 and 125 μm conductor diameters. Also a piece of mesh has been inserted to the capillary instead of a wire and successful EC-EPR experiments performed, although at the expense of the potential control.
In terms of EPR sensitivity the LGR turned out to perform as well as commercially available cylindrical TE011 resonator. Sub μM EPR limits of detection have been demonstrated even for radicals such as MV+˙ with complicated multi-line EPR spectra. Much lower detection limits are of course possible for radicals with simple single line EPR spectra. The sensitivity of the LGR allows the use of relatively small surface area micro wires and also a true miniaturization of the electrochemical cell. As the syringe pump/potentiostat/EPR interface can be programmed and thus certain experiments automated, signal averaging can be efficiently used to study short liver radicals.
Although designed primarily for aqueous samples, the applicability for organic solvents has also been demonstrated.
Obviously there are several parameters to optimise in EC-EPR, depending on the system under study. The design demonstrated here allows the maximum flexibility between the electrochemistry and EPR. Further work is underway for a detailed characterization of the setup for the routine absolute quantification of paramagnetic species in EC-EPR experiments.
Acknowledgements
The author would like to thank the EPSRC National EPR Research Facility & Service, Manchester for training in EC-EPR and the EPSRC Integrated Magnetic Resonance Centre for Doctoral Training (EP/J500045/1).References
- D. E. G. Austen, P. H. Given, D. J. E. Ingram and M. E. Peover, Nature, 1958, 182, 1784–1786 CrossRef CAS PubMed.
- A. H. Maki and D. H. Geske, J. Chem. Phys., 1959, 30, 1356–1357 CrossRef CAS PubMed.
- A. J. Bard and L. R. Faulkner, Electrochemical Methods: Fundamentals and Applications, John Wiley & Sons, Inc., 2nd edn, 2001 Search PubMed.
- L. Dunsch, J. Solid State Electrochem., 2011, 15, 1631–1646 CrossRef CAS.
- P. H. Rieger, I. Bernal, W. H. Reinmuth and G. K. Fraenkel, J. Am. Chem. Soc., 1963, 85, 683–693 CrossRef CAS.
- L. H. Piette, P. Ludwig and R. N. Adams, Anal. Chem., 1962, 34, 916–921 CrossRef CAS.
- R. N. Bagchi, A. M. Bond and F. Scholz, Electroanalysis, 1989, 1, 1–11 CrossRef CAS PubMed.
- A. M. Waller and R. G. Compton, in Comprehensive Chemical Kinetics, ed. R. G. Compton, Elsevier, 1989, vol. 29, pp. 297–352 Search PubMed.
- J. D. Wadhawan and R. G. Compton, in Encyclopedia of Electrochemistry, ed. A. J. Bard, M. Stratmann and E. J. Calvo, Wiley-VCH Verlag GmbH & Co. KGaA, 2003, vol. 29, pp. 170–220 Search PubMed.
- P. R. Murray and L. J. Yellowlees, Spectroelectrochemistry, The Royal Society of Chemistry, 2008, pp. 207–231 Search PubMed.
- B. A. Coles and R. G. Compton, J. Electroanal. Chem., 1983, 144, 87–98 CrossRef CAS.
- R. G. Compton, P. J. Daly, P. R. Unwin and A. M. Waller, J. Electroanal. Chem., 1985, 191, 15–29 CrossRef CAS.
- H. Park, M. S. Won, C. Cheong and Y. B. Shim, Electroanalysis, 2002, 14, 1501–1507 CrossRef CAS.
- A. Petr, L. Dunsch and A. Neudeck, J. Electroanal. Chem., 1996, 412, 153–158 CrossRef.
- E. Dmitrieva, Y. Harima and L. Dunsch, J. Phys. Chem. B, 2009, 113, 16131–16141 CrossRef CAS PubMed.
- J. G. Gaudiello, P. K. Ghosh and A. J. Bard, J. Am. Chem. Soc., 1985, 107, 3027–3032 CrossRef CAS.
- I. B. Goldberg, A. J. Bard and S. W. Feldberg, J. Phys. Chem., 1972, 76, 2550–2559 CrossRef CAS.
- I. B. Goldberg and T. M. McKinney, in Laboratory techniques in electroanalytical chemistry, ed. P. T. Kissinger and W. R. Heineman, Dekker, New York, 1984, pp. 675–728 Search PubMed.
- R. N. Adams, J. Electroanal. Chem., 1964, 8, 151–162 CAS.
- W. Froncisz and J. S. Hyde, J. Magn. Reson., 1982, 47, 515–521 CAS.
- R. D. Allendoerfer, W. Froncisz, C. C. Felix and J. S. Hyde, J. Magn. Reson., 1988, 76, 100–105 Search PubMed.
- J. S. Hyde and W. Froncisz, in Advanced EPR: applications in biology and biochemistry, ed. A. J. Hoff, Elsevier, 1989, pp. 1–29 Search PubMed.
- R. N. Bagchi, A. M. Bond and R. Colton, J. Electroanal. Chem., 1986, 199, 297–309 CrossRef CAS.
- R. N. Bagchi, A. M. Bond and F. Scholz, J. Electroanal. Chem., 1988, 252, 259–267 CrossRef CAS.
- D. A. Fiedler, M. Koppenol and A. M. Bond, J. Electrochem. Soc., 1995, 142, 862–867 CrossRef CAS PubMed.
- M. Fleischmann and S. Pons, J. Electroanal. Chem., 1987, 222, 107–115 CrossRef CAS.
- S. Pons and M. Fleischmann, Anal. Chem., 1987, 59, A1391–A1399 Search PubMed.
- J. Heinze, Angew. Chem., Int. Ed. Engl., 1993, 32, 1268–1288 CrossRef PubMed.
- K. Aoki, K. Honda, K. Tokuda and H. Matsuda, J. Electroanal. Chem., 1985, 182, 267–279 CrossRef CAS.
- K. Aoki, K. Honda, K. Tokuda and H. Matsuda, J. Electroanal. Chem., 1985, 186, 79–86 CrossRef CAS.
- K. Aoki, Electroanalysis, 1993, 5, 627–639 CrossRef CAS PubMed.
- M. Mehdizadeh, T. K. Ishii, J. S. Hyde and W. Froncisz, IEEE Trans. Microwave Theory Tech., 1983, 31, 1059–1064 CrossRef.
- G. A. Rinard, R. W. Quine, S. S. Eaton and G. R. Eaton, J. Magn. Reson., Ser. A, 1993, 105, 137–144 CrossRef CAS.
- I. Dumitrescu, P. R. Unwin and J. V. Macpherson, Electrochem. Commun., 2009, 11, 2081–2084 CrossRef CAS PubMed.
- M. Brustolon, Electron Paramagnetic Resonance, A practitioner's Toolkit, A John Wiley & Sons, Inc., Hoboken, New Jersey, 2009 Search PubMed.
- G. Rinard and G. Eaton, in Biomedical EPR, Part B: Methodology, Instrumentation, and Dynamics, ed. S. Eaton, G. Eaton and L. Berliner, Springer US, 2005, vol. 24/B, pp. 19–52 Search PubMed.
- L. Zhuang and J. Lu, Rev. Sci. Instrum., 2000, 71, 4242–4248 CrossRef CAS PubMed.
- R. M. Elofson and R. L. Edsberg, Can. J. Chem., 1957, 35, 646–650 CrossRef CAS.
- C. L. Bird and A. T. Kuhn, Chem. Soc. Rev., 1981, 10, 49–82 RSC.
- W. R. Dunham, J. A. Fee, L. J. Harding and H. J. Grande, J. Magn. Reson., 1980, 40, 351–359 CAS.
- E. M. Kosower and J. L. Cotter, J. Am. Chem. Soc., 1964, 86, 5524–5527 CrossRef CAS.
- P. M. S. Monk, R. D. Fairweather, M. D. Ingram and J. A. Duffy, J. Chem. Soc., Perkin Trans. 2, 1992, 2039–2041 RSC.
- C. Amatore, M. F. Bento and M. I. Montenegro, Anal. Chem., 1995, 67, 2800–2811 CrossRef CAS.
Footnote |
| † Electronic supplementary information (ESI) available: Fig. S1: The EC-EPR setup. See DOI: 10.1039/c5cp04259c |
| This journal is © the Owner Societies 2015 |

