
 Open Access Article
 This Open Access Article is licensed under a Creative Commons Attribution-Non Commercial 3.0 Unported Licence
The effect of surface modification by reduced graphene oxide on the electrocatalytic activity of nickel towards the hydrogen evolution reaction
Debabrata
Chanda
a,
Jaromír
Hnát
a,
Ana S.
Dobrota
b,
Igor A.
Pašti
b,
Martin
Paidar
a and
Karel
Bouzek
*a
aDepartment of Inorganic Technology, University of Chemistry and Technology, Technicka 5, 16628, Prague 6, Czech Republic. E-mail: bouzekk@vscht.cz
bFaculty of Physical Chemistry, University of Belgrade, Studentskitrg 12-16, 11158 Belgrade, Serbia
First published on 15th September 2015
Abstract
To find cheap, efficient and durable hydrogen evolution reaction catalysts is one of the major challenges when developing an alkaline water electrolysis system. In this paper we describe an electrochemically reduced graphene oxide (RGO)-modified Ni electrode, which could be used as a pre-eminent candidate for such a system. The experimentally determined characteristics of this electrode showing superior electrocatalytic activity were complemented by density functional theory calculations. Thermodynamic considerations led to the conclusion that H atoms, formed upon H2O discharge on Ni, spill onto the RGO, which serves as an H adatom acceptor, enabling continuous cleaning of Ni-active sites and an alternative pathway for H2 production. This mode of action is rendered by the unique reactivity of RGO, which arises due to the presence of O surface groups within the graphene structure. The significant electrocatalytic activity and life time (>35 days) of the RGO towards the HER under conditions of alkaline water electrolysis are demonstrated.
1. Introduction
The growing energy demands of developed societies occurring in parallel with increasing pressure for environmental protection and pollution reduction have intensified research in the field of environmentally friendly energy production and storage methods. Hydrogen represents one of the most promising energy carriers of the future.1 Water electrolysis, as an inseparable part of the hydrogen cycle, represents a technology capable of efficiently converting electrical energy from renewable power sources, such as solar or wind, into the chemical energy of hydrogen.2,3 Nowadays, the latest development in electrochemical water splitting research is anion-selective membrane water electrolysis (ASMWE), which has attracted a lot of interest.4–6 The advantages of this process are the low hydrogen cross-over, higher flexibility and the possibility to work at elevated pressure. However, many ASMWE devices rely on the use of noble metals like Pt for the hydrogen evolution reaction (HER) despite their scarcity and high cost.5,6 One of the key challenges when developing a highly efficient, application-oriented ASMWE system is to find a stable, low cost catalyst for the HER. Mostly, transition metal based electrodes7–9 serve as a HER catalyst in alkaline medium, but their activity is far below that of Pt. Carbon-containing compounds like graphene oxide10 and graphene11 have been characterised as highly active catalysts for the oxygen evolution reaction (OER) in alkaline solution. Moreover, the Co3O4/graphene composite material efficiently catalyses the oxygen reduction reaction (ORR) in alkaline medium.12 Besides graphene, graphene oxide (GO), i.e. graphene containing a significant amount of oxygen atoms in different functional groups, and reduced graphene oxide (RGO) are also of interest.13–15 MoS2 nanoparticles grown on RGO have shown good photocatalytic activity towards the HER in the photoelectrochemical water splitting process.16 Yang et al.17 reported WS2 deposited on RGO as an efficient HER catalyst for acidic water electrolysis. The porous NiO/RGO hybrid can extensively catalyse the OER in alkaline medium.18 However, to the best of our knowledge, no information has been published to date indicating that, in terms of its electrocatalytic activity towards the HER, RGO is comparable to Pt in alkaline water electrolysis. In contrast, the catalytic activities of RGO and GO towards the HER are reported to be fairly poor.19,20Graphene (Geim and Novoselov, 2010 Nobel Prize) has attracted a lot of attention in the recent years due to its potential application in many energy-related technological fields.21–24 Graphene is defined as a planar hexagonal ring containing a sp2 hybridised carbon atom with a two-dimensional (2D) honeycomb lattice.25 Over the years, graphene-supported metal nanoparticles have attracted a great deal of attention and it was found that graphene acts as an active support in these systems. For example, for hydrogen storage, graphene enhances the performance of the composite material through H spillover,26 enabling further tuning of its properties by the introduction of defects and/or dopants.26,27 In HER catalysis, the same process is of immense importance, as it enables cleaning of the catalyst surface due to the transfer of discharged H to the active support where it recombines to H2, allowing the reaction to proceed.28
In this paper, a RGO/Ni foam catalyst is described as that, even when compared with a commercial Pt catalyst, exhibits high HER activity in alkaline solution. Additionally, RGO is attached to the Ni foam surface without using a polymeric binder, which is a critical aspect of constructing gas diffusion electrodes by alkaline technology.
The objective of the present study is to prepare RGO from GO on a nickel foam electrode by means of a simple electrochemical method and to verify its suitability for application as a catalyst for the HER in ASMWE. Based on thermodynamic considerations, which relied on density functional theory (DFT) calculations, an atomic-level justification is put forward for the superb catalytic activity of a RGO/Ni foam electrode which is based on H spillover from the Ni foam surface to the RGO under HER operating conditions. It is further demonstrated that RGO/Ni foam exhibits good durability for the HER under ASMWE conditions.
2. Experimental
2.1 Preparation of graphene oxide
In this study the layered graphite oxide (GRO) was produced by the oxidation of graphite using the improved method of Marcano et al.29 The prepared GRO is subsequently easily transferred to the GO by the ultrasonic exfoliation method.5 g of NaNO3 (Lachner, Czech Republic, 99.5%) was dissolved in a 500 ml beaker containing 80 ml of H2SO4 (Penta, Czech Republic, 95–97%) and 20 ml of H3PO4 (Penta, Czech Republic, 85%) placed in an ice-water bath. Next, 3 g of graphite powder (Sigma-Aldrich ≥99.9%) was introduced into the acid mixture. After 15 minutes of stirring, 6 g of dry potassium permanganate KMnO4 (Lachner, Czech Republic, 99.5%) was added to the reaction mixture while keeping its temperature below 20 °C. The solution was stirred for another 2 h in a water bath at 35 °C and consequently allowed to stand for 5 days. Subsequently the mixture was diluted by adding 100 ml of water over a period of 20 min. As a consequence, the temperature of the mixture increased to 50 °C. The excess of potassium permanganate was reduced by the addition of 15 ml of 30 wt% hydrogen peroxide (Lachner, Czech Republic, 30%). The diluted mixture was washed by the decanting method with 5 wt% HCl followed by centrifugation at 1000 rpm for 10 min. This purification process was repeated at least 10 times. Then the mixture was washed by the decanting method with deionized H2O, followed by centrifugation at 1000 rpm for 10 min. The deionized H2O washing process was repeated three times to obtain the graphite oxide (GRO) slurry. It was dried at 50 °C for 24 hours in a vacuum oven. Graphene oxide (GO) was obtained by ultrasonication of GRO in isopropyl alcohol (Lachner, Czech Republic, 99.99%) for 4 hours. During the sonication procedure, the temperature was kept below 50 °C.
2.2 Deposition of reduced graphene oxide (RGO) on the Ni foam electrode
RGO was deposited on the surface of the electrode electrophoretically. The GO colloid was obtained by dispersing GO powder (100 mg) in isopropyl alcohol (100 ml). Then 10 ml of 1 mol dm−3 KOH (Lachner, Czech Republic, 85%) was added to the solution as a supporting electrolyte. Electrophoretic deposition was performed in a standard two-electrode glass cell at 22 °C. Ni foam (1.95 cm × 1.95 cm) was used as a cathode. Pt foil served as an anode. The distance between the two electrodes was 1 cm. RGO deposition was carried out by applying a voltage of 10 V between the electrodes. During deposition the GO was reduced to RGO. After each deposition of RGO on the Ni foam, it was dried and weighed to control the RGO catalyst loading. The process was continued until an RGO loading of 0.15 mg cm−2 was obtained on the nickel electrode.2.3 Material characterization
Fourier transform infrared spectroscopy (FTIR) analysis was performed using a Thermo Scientific Nicolet iS10 FT-IR spectrometer, USA. Raman measurements were carried out using a dispersive Raman microscope (Senterra R200-L, Bruker Optics, USA) with an excitation wavelength of 514 nm. X-ray photoelectron spectroscopy (XPS) of the samples was performed using an ESCAProbeP (Omicron Nanotechnology Ltd, UK) electron spectrometer. Curve fitting of the core-level XPS lines was carried out using CasaXPS software with a Gaussian–Lorentzian product function and a non-linear Shirley background. The morphology of the deposited RGO was studied by scanning electron microscopy (SEM) (Jeol JSM-6510lv, Japan). The elemental composition of the RGO was determined by energy-dispersive X-ray spectroscopy (EDX) (EDX; NORAN, Jeol, Japan) analysis. TEM was performed on a JEOL JEM-3010 (Japan) field-emission transmission electron microscope with an accelerating voltage of 200 kV. For IR, SEM and TEM analysis, the Ni foam was first dissolved in 1 M HCl, then the RGO was collected by a filtration process using a membrane filter (Millipore, JHWP 0.45 μm, USA).2.4 Electrocatalytic study
The electrochemical tests were carried out using a multichannel potentiostat/galvanostat HEKA PG 310 (HEKA Elektronik, Germany) in a three-electrode configuration with a Pt foil counter-electrode and a Hg/HgO reference electrode in a 1 mol dm−3 KOH aqueous electrolyte (0.098 V vs. SHE at room temperature). During this measurement, nickel foam or RGO-modified Ni foam was used as a working electrode. A Vulcan XC-72R supported Pt catalyst (30% Pt–C) (E-Tek Inc., USA) was used on the cathode side as a standard material for comparison with RGO/Ni foam. The Pt catalyst was attached to the Ni foam electrode by an anion-selective quaternized polyphenylene oxide (qPPO) binder. For more detailed information on the preparation of the cathode catalyst layer, refer to ref. 5. The linear sweep voltammetry (LSV) curves were collected in the potential range of −0.6 V to −1.45 V at a potential scan rate of 10 mV s−1. The cyclic voltammograms (CV) were recorded in the potential range of 0 V to −0.8 V at a scan rate of 10 mV s−1. All electrochemical experiments were carried out at a temperature of 22 °C and at an ambient pressure.2.5 Preparation of the MEA for alkaline water electrolysis
The heterogeneous anion-selective membrane (27.3 wt% low density polyethylene, 6.7 wt% poly(ethylene glycol-ran-propylene glycol), 66 wt% anion-selective resin particles, Dowex Marathon A) was used for the water electrolysis experiments. After being cut to the appropriate dimensions, the membrane was activated according to the procedure described in ref. 30. The ion-exchange capacity and ionic conductivity of the activated membrane were found to be 2 mmol g−1 and 5.6 S m−1 at 50 °C respectively.30 RGO-containing Ni foam was used as a cathode and bare nickel foam as an anode in an alkaline electrolyser. Gold-plated nickel was used as a current feeder. The cell was completed by two steel terminal plates separated from the current feeder by a PEEK plate. An electrolysis cell, constructed using both a bare nickel foam cathode as well as an anode, was used as a standard set-up for purposes of comparison. In addition, Ni foam with carbon-supported Pt was adopted as a cathode catalyst for comparison with RGO/Ni foam.A single-cell alkaline water electrolyser was operated at 50 °C using 10 wt% KOH solution as a liquid electrolyte. The performance of the prepared catalyst was evaluated by determining the load curves in a cell voltage range of 1.5 to 2.0 V using stabilised power source Statron 3251.1 (Statron Gerätetechnik GmbH, Germany). For more detailed information on the experimental arrangement, refer to ref. 30.
2.6 DFT calculations
Periodic DFT calculations were performed using the PWscf code of the Quantum ESPRESSO distribution.31 Ultrasoft pseudopotentials were generated on the GGA-PBE level of approximation.32 The kinetic energy cutoff was 30 Ry, while the charge density cutoff was 448 Ry. Pristine graphene (p-graphene) was modeled using a layer consisting of 32 carbon atoms within an orthorhombic supercell with dimensions amounting to 9.88 × 8.65 × 14 Å. The first irreducible Brillouin zone was sampled by Γ-centered 4 × 4 × 1 set of k-points generated by the general Monkhorst–Pack scheme.33 Convergence with respect to the vacuum layer thickness and k-point mesh was confirmed. Oxygen defects were introduced on both sides of the graphene layer to model RGO. Epoxy- and hydroxyl-graphene were modeled with O![[thin space (1/6-em)]](https://www.rsc.org/images/entities/char_2009.gif) :C ratios amounting to 1:8 in both cases and are denoted hereafter as C32O4 and C32(OH)4. RGO models were obtained upon cell relaxation in an XY plane and relaxation of all atoms contained within the supercell. Relaxation was allowed until the forces acting on the atoms were below 0.025 eV Å−1 and the change in the total energy of the system was below 1 meV (both criteria had to be satisfied). The nickel surface was modeled with (001) orientation using a (2 × 2) cell with 4 metal layers and a 14 Å thick vacuum layer. Integration of the first irreducible Brillouin zone was done using a 4 × 4 × 1 set of k-points. Relaxation of the adsorbate layer and the top two surface layers was allowed in all directions. When subsurface hydrogen sorption in Ni was studied, only a bottom Ni layer was kept fixed.
:C ratios amounting to 1:8 in both cases and are denoted hereafter as C32O4 and C32(OH)4. RGO models were obtained upon cell relaxation in an XY plane and relaxation of all atoms contained within the supercell. Relaxation was allowed until the forces acting on the atoms were below 0.025 eV Å−1 and the change in the total energy of the system was below 1 meV (both criteria had to be satisfied). The nickel surface was modeled with (001) orientation using a (2 × 2) cell with 4 metal layers and a 14 Å thick vacuum layer. Integration of the first irreducible Brillouin zone was done using a 4 × 4 × 1 set of k-points. Relaxation of the adsorbate layer and the top two surface layers was allowed in all directions. When subsurface hydrogen sorption in Ni was studied, only a bottom Ni layer was kept fixed.
The strength of hydrogen interaction with the RGO and Ni(001) surfaces was measured by hydrogen binding energy (Eb) defined as:
| Eb = Esubs+H − (Esubs + EH) | (1) |
| Eads = Esubs+H − (Esubs + ½EH2) | (2) |
3. Results and discussion
3.1 Physical characterization
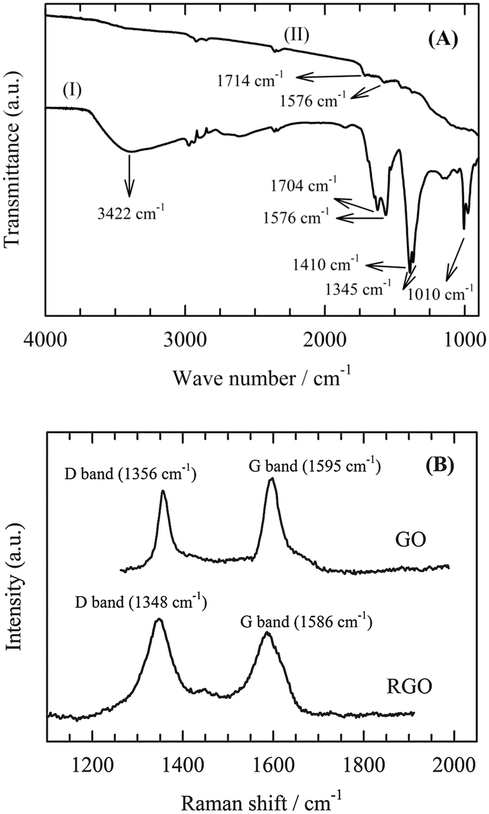
The FTIR spectra of the prepared GO and RGO were recorded (Fig. 1A). The spectrum of GO contains a broad and intense absorption band at 3422 cm−1, corresponding to the O–H stretching vibrations and bands at 1704 and 1010 cm−1, which are assigned to the C![[double bond, length as m-dash]](https://www.rsc.org/images/entities/char_e001.gif) O and C–OH stretching vibrations of COOH groups, respectively. After the reduction of GO, the intensity of the bands of the O–H, C–O and CO groups decreased dramatically, indicating the occurrence of a deoxygenation reaction. Fig. 1B shows the Raman spectra of GO and RGO-coated Ni foam. Ni foam does not appear in Raman spectra.10 GO shows two Raman bands, the D band and G band at 1356 and 1595 cm−1, respectively. Whereas the D band (sp3) corresponds to the disorder line, the G band (sp2) indicates the order line.
O and C–OH stretching vibrations of COOH groups, respectively. After the reduction of GO, the intensity of the bands of the O–H, C–O and CO groups decreased dramatically, indicating the occurrence of a deoxygenation reaction. Fig. 1B shows the Raman spectra of GO and RGO-coated Ni foam. Ni foam does not appear in Raman spectra.10 GO shows two Raman bands, the D band and G band at 1356 and 1595 cm−1, respectively. Whereas the D band (sp3) corresponds to the disorder line, the G band (sp2) indicates the order line.
 | ||
| Fig. 1 (A) FT-IR spectra of (I) GO and (II) RGO. (B) Raman spectra of GO and RGO. | ||
After GO had been reduced to RGO, the D band became more prominent and shifted from 1356 cm−1 to 1348 cm−1 due to the reduction in size of the in-plane sp2 domains. At the same time, the G band shifted from 1595 cm−1 to 1586 cm−1. This corresponds to the dominating first-order scattering of the E2g mode representing the sp2 domain of graphite. The lattice defects arise due to the presence of carboxyl, hydroxyl and epoxide groups on the carbon basal plane.
The decrease of the peak intensity ratio I(D):I(G) between the D band and the G band represents a decrease in the number of defects in the carbon basal plane. In the present case, ration values of 0.96 and 1.15 were obtained for GO and RGO, respectively. This result indicates a significant number of defects in the RGO basal plane, which is higher for RGO than for GO.
The C:O ratios determined by X-ray photoelectron spectroscopy (XPS) (survey scan, Fig. 2A and B) had values of 2.16 and 3.1 for GO and RGO, respectively. This provides additional evidence that GO electrochemical reduction was incomplete. Some oxygen-containing groups remain maintained in the structure even after its application. The C1s XPS spectrum (Fig. 2C) of the GO sheets showed a sharp peak at 284.57 eV, which corresponded to aromatic C–C (40%) bonds of carbon atoms in a conjugated honeycomb lattice. Peaks at 285.74, 288.51 and 290 eV could be attributed to the C in C–O or C–OH (21%), carbonyl (CO, 15%) and carboxylate (O–CO, 24%) groups, respectively. Oxygen-containing groups are present due to the harsh oxidation of the sp2 atomic structure of graphite. The C1s spectra of RGO in Fig. 2D indicate that the oxygen-containing carboxylate groups were completely reduced after the electrochemical reduction. Thus, the CO (4%) bond signal was also significantly reduced. Based on Fig. 2D, it can be stated that the peak ratio of the C–C (49%) bond increases. This is due to the formation of the C–C skeleton by the reduction process of the oxygen-containing species. On the other hand, the intensity of the peak corresponding to the C–O or C–OH (47%) bond increased, which could be explained by the reduction of CO and O–CO upon formation of these groups. It can be concluded that the observations described prove that the reduction of GO to RGO does proceed, but only to a certain degree. A significant portion of more stable oxygenated functional groups remains preserved even after the reduction.
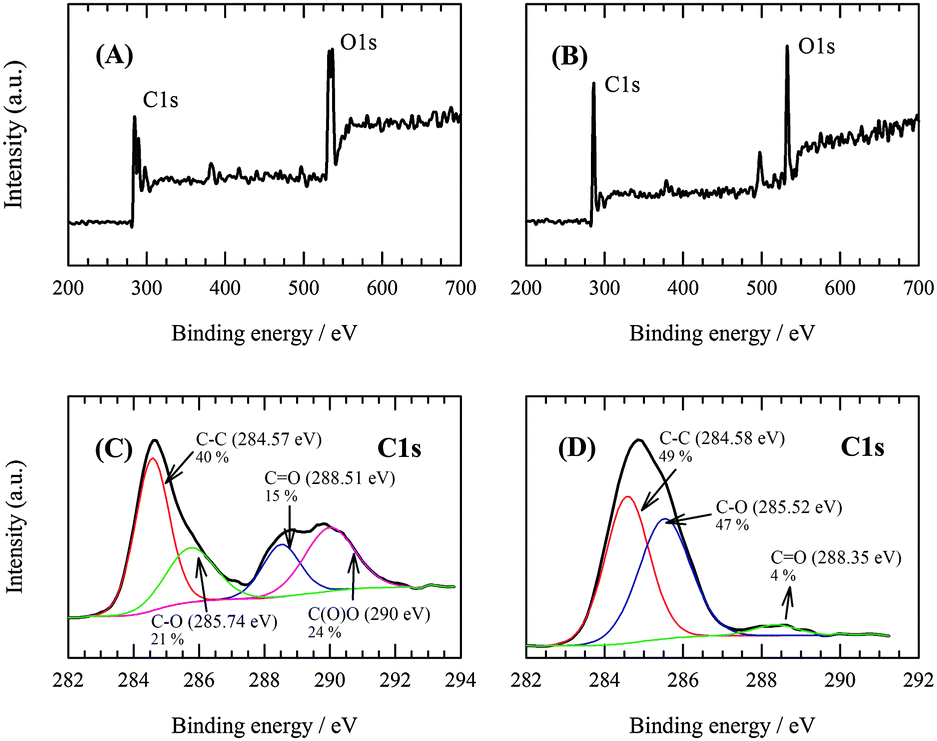 | ||
| Fig. 2 XPS survey spectra of (A) GO and (B) RGO. XPS C1s and fitting curve of (C) GO and (D) RGO. | ||
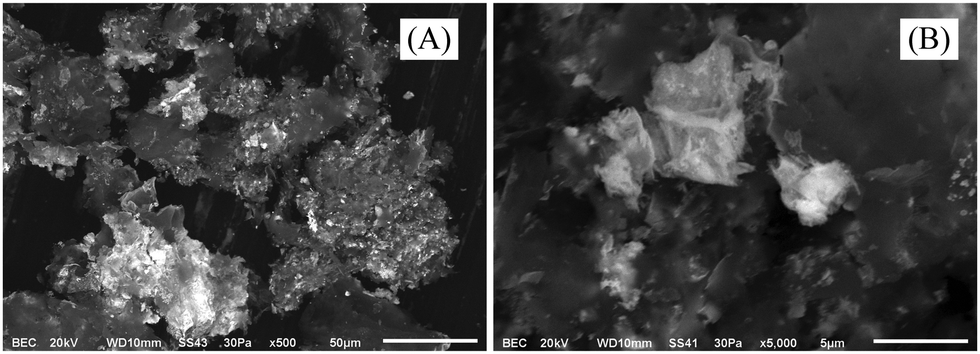
Fig. 3A shows RGO-coated Ni foam. This, together with a closer view shown in Fig. 3B, documents the fact that the RGO forms a continuous film over the Ni foam framework. EDX elemental mapping (Fig. 4) supported the presence of Ni (support), C (RGO) and O (residual oxygen functional groups) elements in the RGO–Ni foam. Fig. 5 shows a SEM image of the unsupported RGO (without Ni foam), revealing its ruffled structure after exfoliation. The morphology of RGO resembles a thin curtain, which indicates the overlap between the individual RGO films. Fig. 6 shows the TEM images of the resulting RGO (without Ni foam) material. It exhibits a typical wrinkled structure caused by irregularities and folding of the sheets. The resulting images reveal that RGO forms a crumpled, multilayer thin film on the Ni surface.
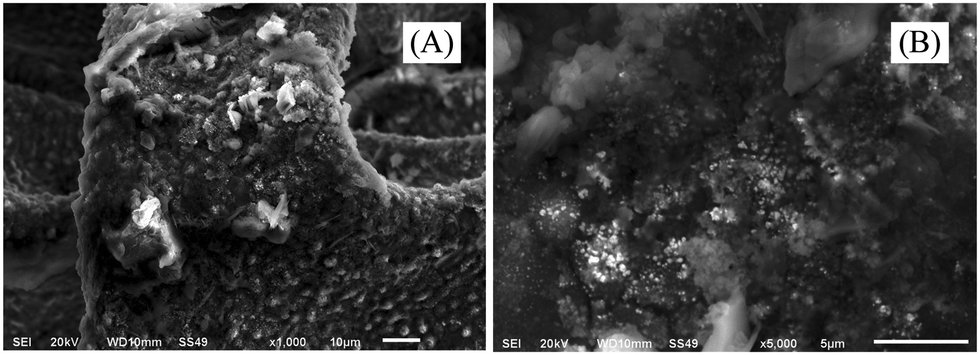 | ||
| Fig. 3 SEM images of the RGO-coated Ni foam electrode. | ||
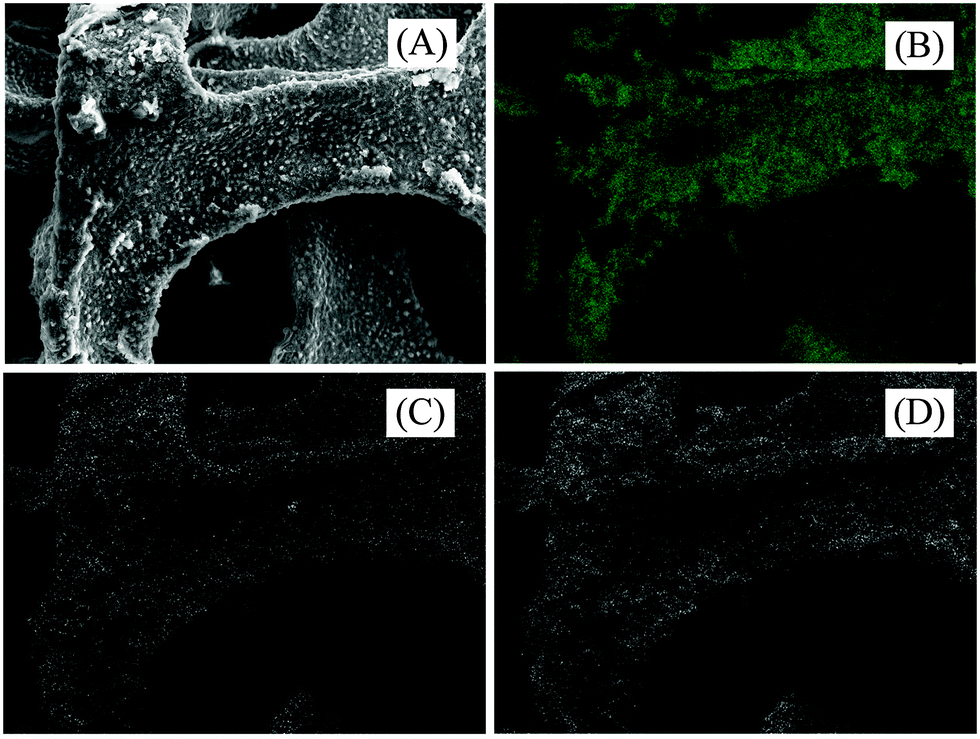 | ||
| Fig. 4 (A) SEM image of RGO-coated Ni foam, (B–D) EDX elemental distributions of Ni, C and O, respectively for the RGO–nickel foam electrode. | ||
 | ||
| Fig. 5 SEM images of the multilayer structure of RGO (without Ni foam) at different magnifications. | ||
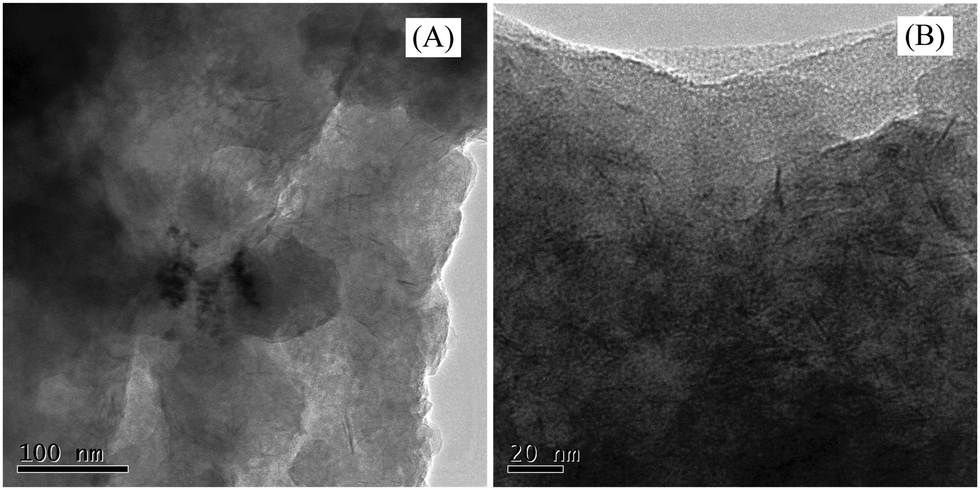 | ||
| Fig. 6 TEM images of the multilayer structure of RGO (without Ni foam). | ||
3.2 Electrochemical characterization
The electrocatalytic activity of the RGO-modified nickel foam electrode towards the HER was investigated in 1 mol dm−3 KOH solution by means of LSV and CV and compared with bare Ni foam and a Pt–C/Ni foam electrode. In Fig. 7A, the LSV curve from RGO/Ni foam exhibits HER electrocatalytic activity higher than that of Pt–C/Ni foam and Ni foam electrodes. The CV curves of Ni foam and RGO/Ni foam electrodes (Fig. 7B) are similar in shape and show the same features. This also led us to conclude that the RGO layer formed on Ni foam is permeable to the electrolyte, while only a fraction of Ni surface is blocked by RGO, as deduced from the reduction of the current response of RGO/Ni foam in comparison to the bare Ni foam. Constructed Tafel plots (Fig. 7C) for bare Ni foam, RGO/Ni foam and Pt–C/Ni foam yielded Tafel slopes and are summarised in Table 1.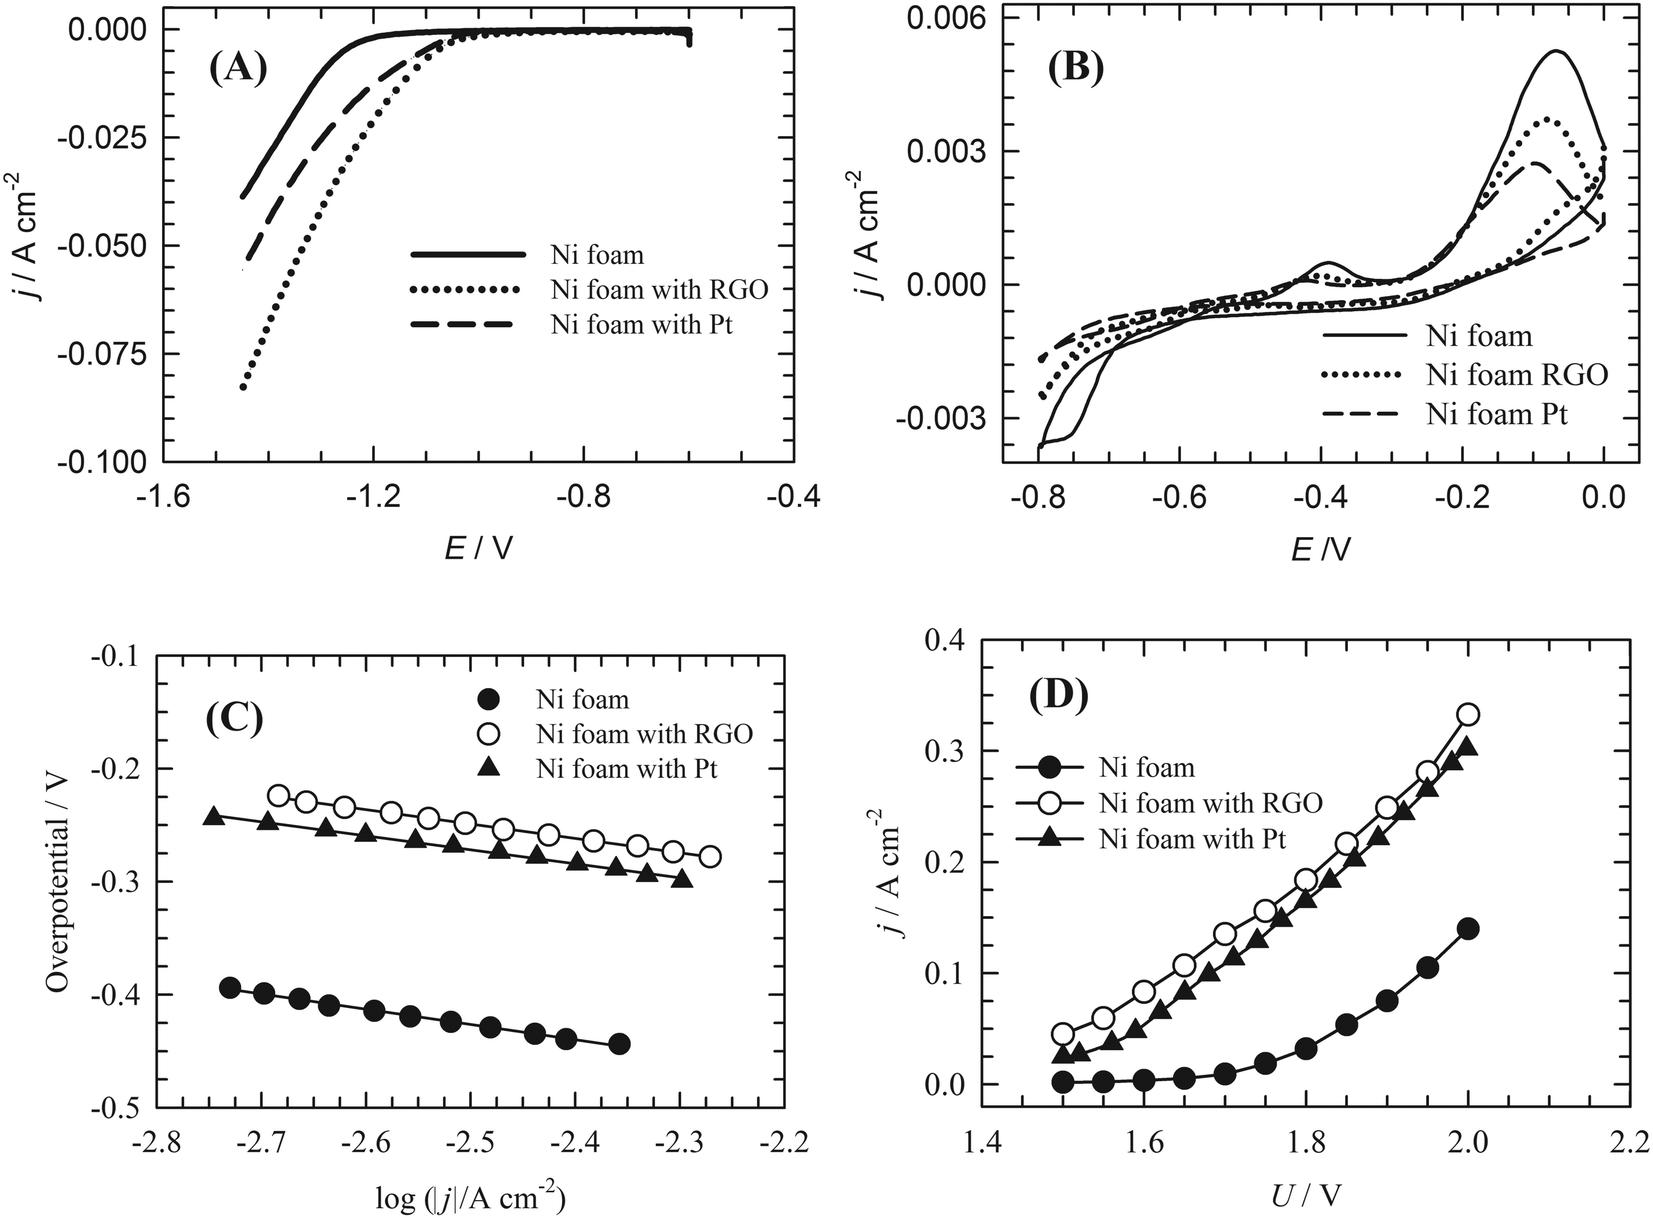 | ||
| Fig. 7 (A) Pseudostationary linear sweep voltammetry curve, (B) cyclic voltammetric curve, (C) Tafel plot of the hydrogen evolution reaction. Experimental conditions: 22 °C; 1 mol dm−3 KOH solution; working electrode: bare Ni foam, 0.15 mg cm−2 RGO-coated Ni foam & 0.15 mg cm−2 Pt + qPPO binder (85:15). Hg/HgO reference electrode; Pt counter-electrode; argon atmosphere; potential scan rate 10 mV s−1; and electrode area 3.8 cm−2 were used. (D) V–I characteristics of a single-cell electrolyser. Experimental conditions: 50 °C; 10 wt% KOH solution; anode: bare Ni foam; cathode: bare Ni foam, 0.15 mg cm−2 RGO coated Ni foam & 0.15 mg cm−2 Pt + qPPO binder (85:15); electrode area 3.8 cm2; electrolyte flow rate 350 ml min−1. Assignment of electrodes is indicated in the figures for all experiments. | ||
| Catalyst | Tafel slope (mV dec−1) | Exchange current density (A cm−2) |
|---|---|---|
| Ni foam | −144 | 6.76 × 10⁻⁵ |
| RGO–Ni foam | −130 | 1.04 × 10⁻³ |
| Pt–C/Ni foam | −133 | 7.24 × 10⁻⁴ |
A Tafel equation in the form of
| η = blogj + a | (3) |
| M + H2O + e− ⇔ MHads + OH− Volmer | (4) |
| MHads + H2O + e− ⇔ M + H2 + OH− Heyrovsky | (5) |
| MHads + MHads ⇔ H2 + 2M Tafel | (6) |
The exchange current density (j0) was used as a parameter to evaluate the activity of the catalyst towards the HER in water electrolysis.8 The attained values are again summarised in Table 1. The j0 of the RGO/Ni foam electrode was 12 times higher than that of the Ni foam electrode and 1.6 times higher than that of the Pt–C/Ni foam electrode.
3.3 Performance of the MEA in an alkaline water electrolyser
The load curves obtained for the materials under study are shown in Fig. 7D. In contrast to the bare Ni foam electrode, a very short activation potential region was observed for the RGO and Pt–C modified Ni foam electrodes. In most of the voltage range used the system performance was controlled by its ohmic resistance. At a cell voltage of 1.85 V, which can be considered as the average cell voltage in industrial alkaline water electrolysers, the corresponding value of current density was 54 mA cm−2 for the Ni foam cathode and 210 mA cm−2 for the Pt–C-modified Ni foam. Under identical conditions the RGO-modified Ni foam cathode exhibited a current density of 223 mA cm−2. This represents a very promising result.3.4 DFT modelling
An obvious conclusion from the previous sections is that the HER activity of RGO/Ni is excellent, but the question is how does the combination of one rather poor HER catalyst (RGO) and one modest HER catalyst (Ni) produce the catalyst that outperforms Pt?Obviously, some kind of cooperative action must be operative. In order to rationalize the HER performance on the Ni foam–RGO electrode DFT modelling was used. Due to the complexity of the Ni foam–RGO interface, the interaction of hydrogen with graphene, RGO and Ni surface was investigated. Low H coverage of 1/32 monolayers (ML) was considered on p-graphene and RGO. As a reference, we found that p-graphene binds H weakly, with the H binding energy amounting to −0.84 eV using a spin-restricted approach, while the inclusion of the spin polarization had a minor effect, decreasing Eb to −0.89 eV. This result is in accordance with previous reports on H-graphene interaction in the literature (see the overview provided by Ivanovskaya et al.37), which validates our model of the graphene layer.
With this benchmark we set two models of graphene containing hardly reducible O-groups which were found in the RGO reported here, namely, epoxy-graphene and hydroxyl-graphene (Fig. 8, bottom). We observed the local change in the C–C bond lengths and the corrugation of the graphene layer upon the introduction of O-functional groups, which indicates the disruption of the π electronic system due to sp2 → sp3 rehybridization. This is also reflected in the change in the C–C bond lengths in the vicinity of O functional groups which increases from 1.42 Å to up to 1.51 Å. The latter value is between the bond lengths of a single and a double C–C bond. The final result of the functionalization of graphene is the formation of unsaturated surface bonds, which consequently affects the chemisorption properties of RGO. To further validate our models, a comparison can be made with the work of Mkhoyan et al.38 The authors found experimentally the average roughness of the O-containing graphene (O:C ratio 1:5) to be 0.6 nm. In the present work we found that the layer roughness amounts to 0.72 nm for C32O4 and 1.1 nm for C32(OH)4. For the O concentration investigated here, no pronounced band gap opening was observed for the two models of RGO, which is in agreement with the previous work on O-containing graphene.39 The ground states of the RGO models investigated here were found to be non-magnetic. More details on the models used here are provided in the recent work of Dobrota et al.40
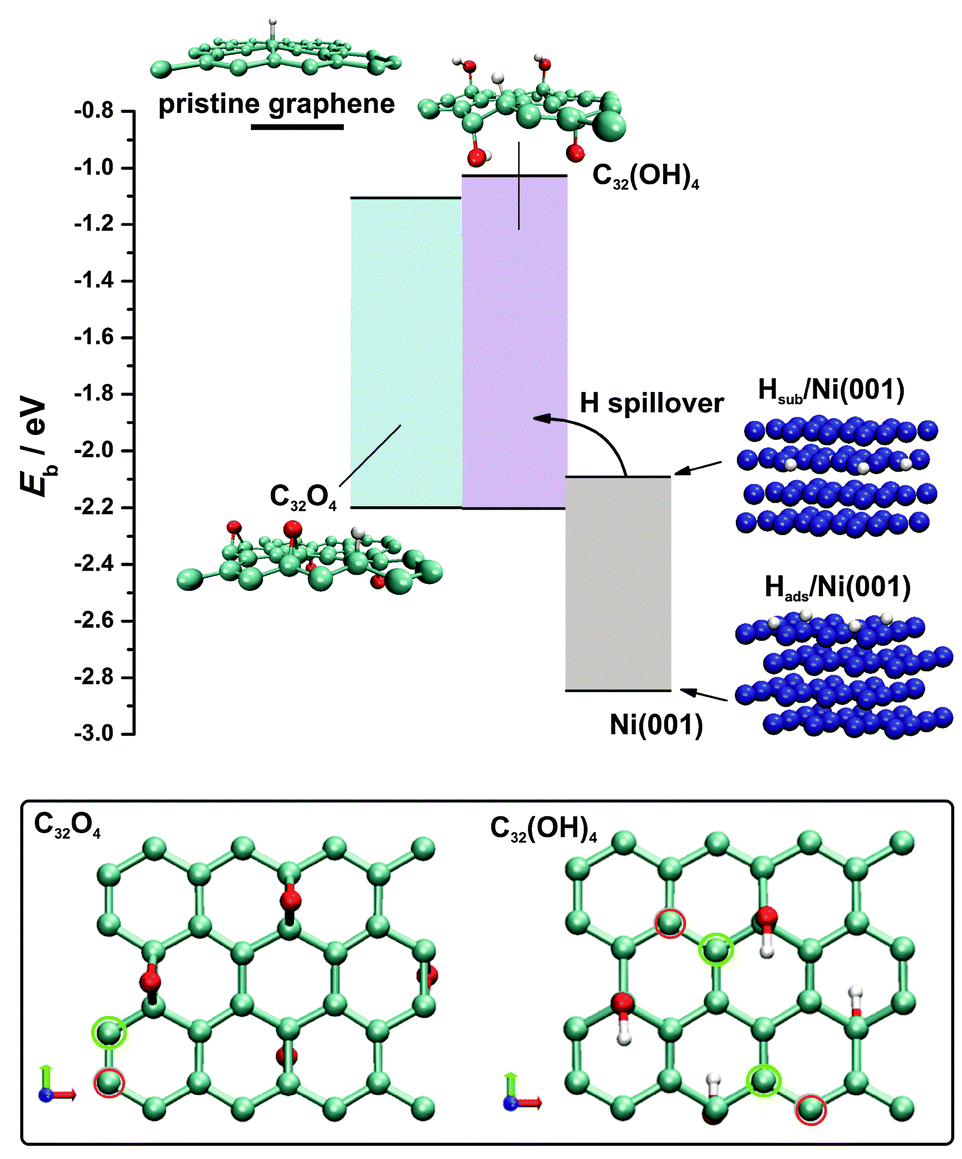 | ||
| Fig. 8 Comparison of the hydrogen binding energies on the considered RGO model surfaces with hydrogen adsorption/absorption energetics on the Ni(001) surface. Shaded areas represent the range of hydrogen binding energies on a particular surface. Hydrogen binding energy on p-graphene is indicated by a thick horizontal line. Even at very low H coverage, H binding presents an energetically favourable alternative to the formation of subsurface H atoms in the Ni phase. At the bottom, two models of RGO employed in DFT calculations are presented: epoxy-graphene (C32O4) and hydroxyl-graphene (C32(OH)4). The sites of the strongest (green circles) and the weakest bonding (red circles) of H on RGO are indicated. | ||
The evaluated hydrogen binding energies on p-graphene and the RGO model surfaces (Table 2) indicate enhanced chemisorption upon the introduction of the O-surface groups on the graphene plane. Spin-polarization usually affects Eb to a very small extent and does not change the preference of the adsorption sites. Hydrogen chemisorption on the RGO model surfaces was tested at different sites selected on the basis of the symmetry, the electronic structure and the charge state (more than 40 different configurations). For both models we found that hydrogen binding energy is reduced to −2.24 eV (Table 2). According to eqn (2) this indicates that H binding on the RGO surface is 0.02 eV endothermic with respect to H2. It was observed that the most reactive C atoms are located adjacent to O-functional groups (Fig. 8, bottom). This is understandable even at an intuitive level: the disturbance of the π electronic system is most pronounced in the vicinity of the O-containing surface group, inducing the conversion of sp2 to sp3 bonds and the formation of unsaturated dangling bonds available for H chemisorption. Similar observations were previously made in the cases of other functional groups on the graphene layer.41,42 For example, formation of the dangling bonds upon increasing the oxidation level of graphene induces the agglomeration of the oxygen functionalities42 which in turn results in a stable oxidized graphene layer,43 even though a number of dangling bonds are formed. In spite of the enhanced H adsorption energies on RGO compared to p-graphene, H binding energies are still too low to promote effective Hads formation, being the first step in the HER mechanism, which agrees with the low HER activity of oxidized graphene, as mentioned previously.20,21 Hence, the interim conclusion is that the initial Hads formation must take place at the Ni surface via the Volmer reaction, and this is possible since we know that the RGO layer does not block the access of the electrolyte to the Ni foam surface (Fig. 7B).
| Surface | Spin restricted | Spin-polarized | ||
|---|---|---|---|---|
| E b,max/eV | E b,min/eV | E b,max/eV | E b,min/eV | |
| p-Graphene | −0.84 | −0.89 | ||
| C32O4 | −2.18 | −0.83 | −2.24 | −1.09 |
| C32(OH)4 | −2.20 | −1.03 | −2.24 | −1.04 |
In order to address the H–Ni interaction, a Ni(001) surface was chosen since the Ni foam used in the experiments possesses a large number of surface defects and it was considered to be a better approximation of the HER catalyst surface than densely packed Ni(111). For this surface orientation, H binding energy amounting to −2.84 eV with a preference for 4-fold sites (investigated coverage 0.25 ML) was found. This result is in excellent agreement with previous reports considering H interaction with Ni(001) (see ref. 44 for a detailed overview). Among low-index Ni surfaces, Ni(001) was found to bond to H the most strongly.44 Moreover, H binding energy on a Ni surface was previously found to depend weakly on surface coverage.45
HER catalytic activity trends are often rationalized in terms of a Volcano plot.46,47 The position of Ni on the Volcano was previously discussed in detail.46,48 Although the DFT calculations locate Ni on the HER volcano curve, calculations of the surface H diverge from the experimental behaviour as Ni forms hydrides under HER conditions with the Ni–H bond energy amounting to −2 eV.47 In order to account for this process, we also investigated hydrogen sorption into the Ni phase (quantified in the same manner as H adsorption, eqn (1), Experimental section). A stable hydrogen sorption site was found to be an octahedral one where H is located in the second subsurface layer with a bond energy of −2.09 eV (Fig. 8, see the structure denoted as Hsub/Ni(001)). The formation of the subsurface hydride under HER operating conditions is considered to be the cause of Ni deactivation,49 while this process proceeds in spite of the high kinetic barrier (which was estimated to be almost 1 eV) due to the high effective fugacity of H under the corresponding experimental conditions.50 In this context, the build-up of subsurface hydride weakens the adsorption of H on the Ni surface, affecting HER kinetics, which is experimentally observed by the change in the Tafel slope and the exchange current density.49 Hence, the HER on a bare Ni electrode can be perceived as a complex process during which the formation of adsorbed H takes place, followed by its further recombination to H2 as well as its migration below the Ni surface. The latter process affects the initial step of Hads formation, leading to gradual deactivation, while under stationary conditions a certain degree of Ni coverage by Hads is attained. For example, Ni coverage by H under HER conditions in 1.0 mol dm−3 NaOH is approximately 0.9 ML when the overvoltage is below −0.2 V.51 This agrees with our conclusions based on the measured Tafel slope, and it is also in line with a strong Ni–Hads bond.
The enhanced HER kinetics at the Ni–RGO interface, observed experimentally, suggests cooperative action between the Ni foam and RGO. By comparing the H binding energies on Ni and RGO (Fig. 8), it is concluded that the enhanced H chemisorption properties of RGO, compared to p-graphene, qualify it as a sink for Hads formed on the Ni surface. In other words, Hads, intermediately formed on the Ni surface, migrates onto RGO instead of being engaged in the formation of subsurface Ni hydride which would ultimately hinder HER kinetics. Then, Hads recombines quickly on the RGO surface to form H2, which is also thermodynamically favoured as H adsorption on analysed RGO model surfaces is slightly endothermic with respect to the H2 (thermoneutral adsorption corresponds to Eb of −2.26 eV, eqn (2)). By comparing H binding energies on RGO and Ni (Fig. 8), a thermodynamic barrier for the H spillover process can be estimated to be 0.6 eV, which can be overcome at room temperature.52 By this means, the Ni surface is constantly cleared and the HER kinetics is enhanced at the Ni–RGO interface as the new active sites are supplied for the discharge of H2O. The facts that Hads on RGO is endothermic with respect to H2 (suggesting low activation energy for the recombination) and that the thermodynamic barrier for the spillover process is low enough to enable the reaction to take place are, however, not sufficient. In order to provide fast H2 evolution by recombination of Hads spilled to RGO, Hads also need to have sufficiently high mobility so that two Hads can meet and recombine. Recently it was shown that hydroxyl functional groups may facilitate Hads surface mobility on a graphene layer which stands in favour of our standing point.53 According to Fig. 8 the H spillover from Ni to RGO presents an energetically favourable alternative to the H2 formation on the Ni surface via a slow Heyrovsky reaction and the Ni hydride formation even at very low RGO coverage by adsorbed H. On the other hand, previous theoretical results by Singh et al.52 suggest that hydrogenation of p-graphene can enhance H spillover from Pd4 clusters. Hence, it is expected that hydrogenation of RGO will further increase Hads–RGO binding energy, making the spillover process even more feasible. This reinforces our conclusion regarding the mechanism of the enhanced HER activity of the RGO/Ni foam electrode. The H spillover onto p-graphene is energetically highly unfavourable (Fig. 9) with a barrier of almost 2 eV, indicating the crucial role of the O-containing groups of RGO for enhanced HER activity of the RGO/Ni foam electrode. It should be noted that the H spillover is consistent with the experimentally measured Tafel slope for the RGO/Ni electrode. If H2 is formed via the recombination of the spilled Hads from the Ni foam to the RGO layer, which should be a fast process, then the H2O discharge to Hads on the Ni foam (Volmer reaction) determines the kinetics of the H2 formation. If this is true, then the expected Tafel slope should be −120 mV dec−1, which matches quite well with the measured value of −130 mV dec−1.
 | ||
| Fig. 9 Long-term stability test of a single-cell water electrolyser. Experimental conditions: 50 °C; current density 265 mA cm−2; 10 wt% KOH solution; anode: bare Ni foam; cathode: 0.15 mg cm−2 RGO-coated Ni foam or bare Ni foam (indicated in the figure); electrode area 3.8 cm2; electrolyte flow rate 5 ml min−1. | ||
In addition to the RGO/Ni foam interface demonstrated here, a natural question arises whether some other nanostructured carbon such as carbon nanotubes (CNT) could provide similar action to RGO being a Hads acceptor under HER conditions. If the thermodynamic parameters related to the strength of the Hads interaction with the CNT surface are considered it seems that such a kind of operation could be possible but critically dependent on the structure of the CNTs.54 There are experimental reports which support this conclusion, demonstrating H spillover in metal-loaded CNTs.55,56 For example, Bhowmick et al. observed H spillover upon the exposure of the Pt-single wall CNT composite to molecular hydrogen, and confirmed the formation of new C–H bonds using XPS, as done here later on.56 On the other hand, such composite materials has not been employed as the cathode material for water electrolysis and their performance with respect to the RGO/Ni foam electrode cannot be estimated at this point. The questions are also whether the CNT/Ni system can be prepared in the way similar to the RGO/Ni counterpart and how the performance would be impacted by the functionalization of CNTs.
3.5 Effect of a cathode catalyst layer on the stability of the alkaline water electrolyser
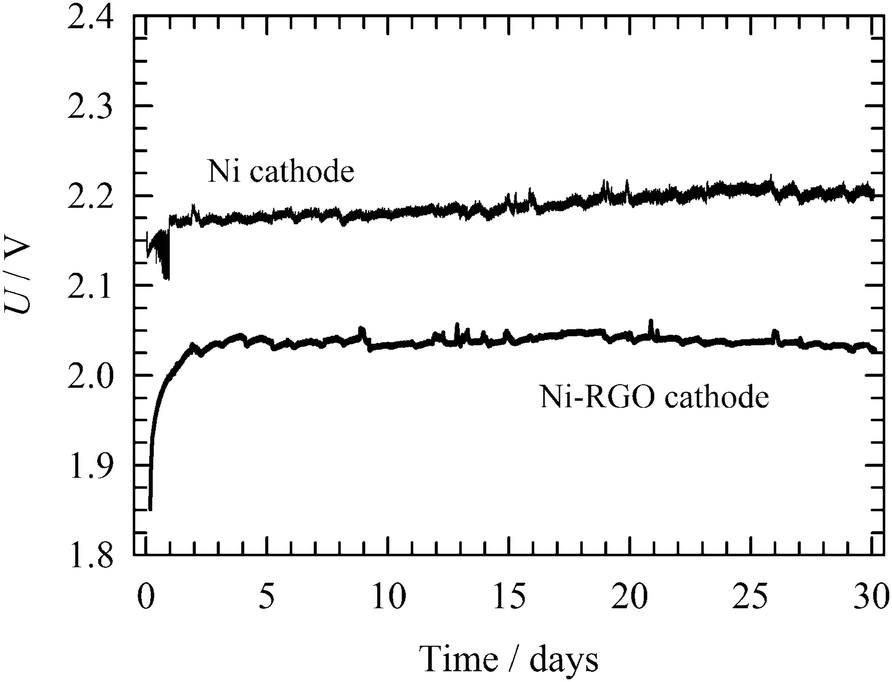
The long-term stability of the RGO-modified Ni foam electrode containing MEA was investigated in comparison to the bare Ni foam cathode by continuous operation at 265 mA cm−2, in 10 wt% KOH solution at 50 °C. The continuous long-term stability test shown in Fig. 9 indicates that the cell voltage increases with time, reaching a stable value after 2 days. A further increase in the cell voltage, indicating cathode inhibition or RGO catalyst degradation, was not observed during the next 30 days long-term process. This implies good RGO stability for the HER under conditions of alkaline water electrolysis. By contrast, the bare Ni foam cathode shows a higher cell voltage over the polarization period under study. Cathodes for industrial electrolysers have to possess good durability not just under continuous, but also intermittent operation corresponding to the shutdown of the electrolyser for maintenance or as a response to unstable power sources, such as renewables (e.g. wind and solar). After 30 days of the continuous process, the operational conditions were changed to discontinuous for 5 days. First, the electrodes were polarized at a constant current density of 265 mA cm−2 for 23 hours. Then the current density was reduced to 2.6 μA cm−2 for 1 hour. During the intermittent periods, the electrode was depolarized by the electrochemical discharge reactions releasing electrochemically adsorbed hydrogen in a molecular form. At the same time, the hydrogen adsorbed on the Ni surface also partly diffused into the bulk of the electrode. In these two ways the active sites are regenerated. As can be seen in Fig. 10, after each intermittent period the cell voltage started at a value lower than at the end of the previous cycle. The final voltage achieved at the end of the individual cycles gradually increased, but never attained a value of the voltage recorded for the stable polarization (Fig. 9). A similar behaviour was observed for bare Ni cathode. Although the difference between RGO–Ni and bare Ni was slightly reduced over the period of cell intermittent operation, this change was not significant. Similarly to the case of constant load, the main decrease in the difference in voltage appears within first 2 to 3 days period. Afterwards it stabilises. The voltage variation within each cycle is due to the repeated desorption of the hydrogen accumulated on the electrode surface during a switch-off period, leading to repeated regeneration of the active sites. The intermittent electrolysis test thus supports the claim of the outstanding stability of the RGO catalyst.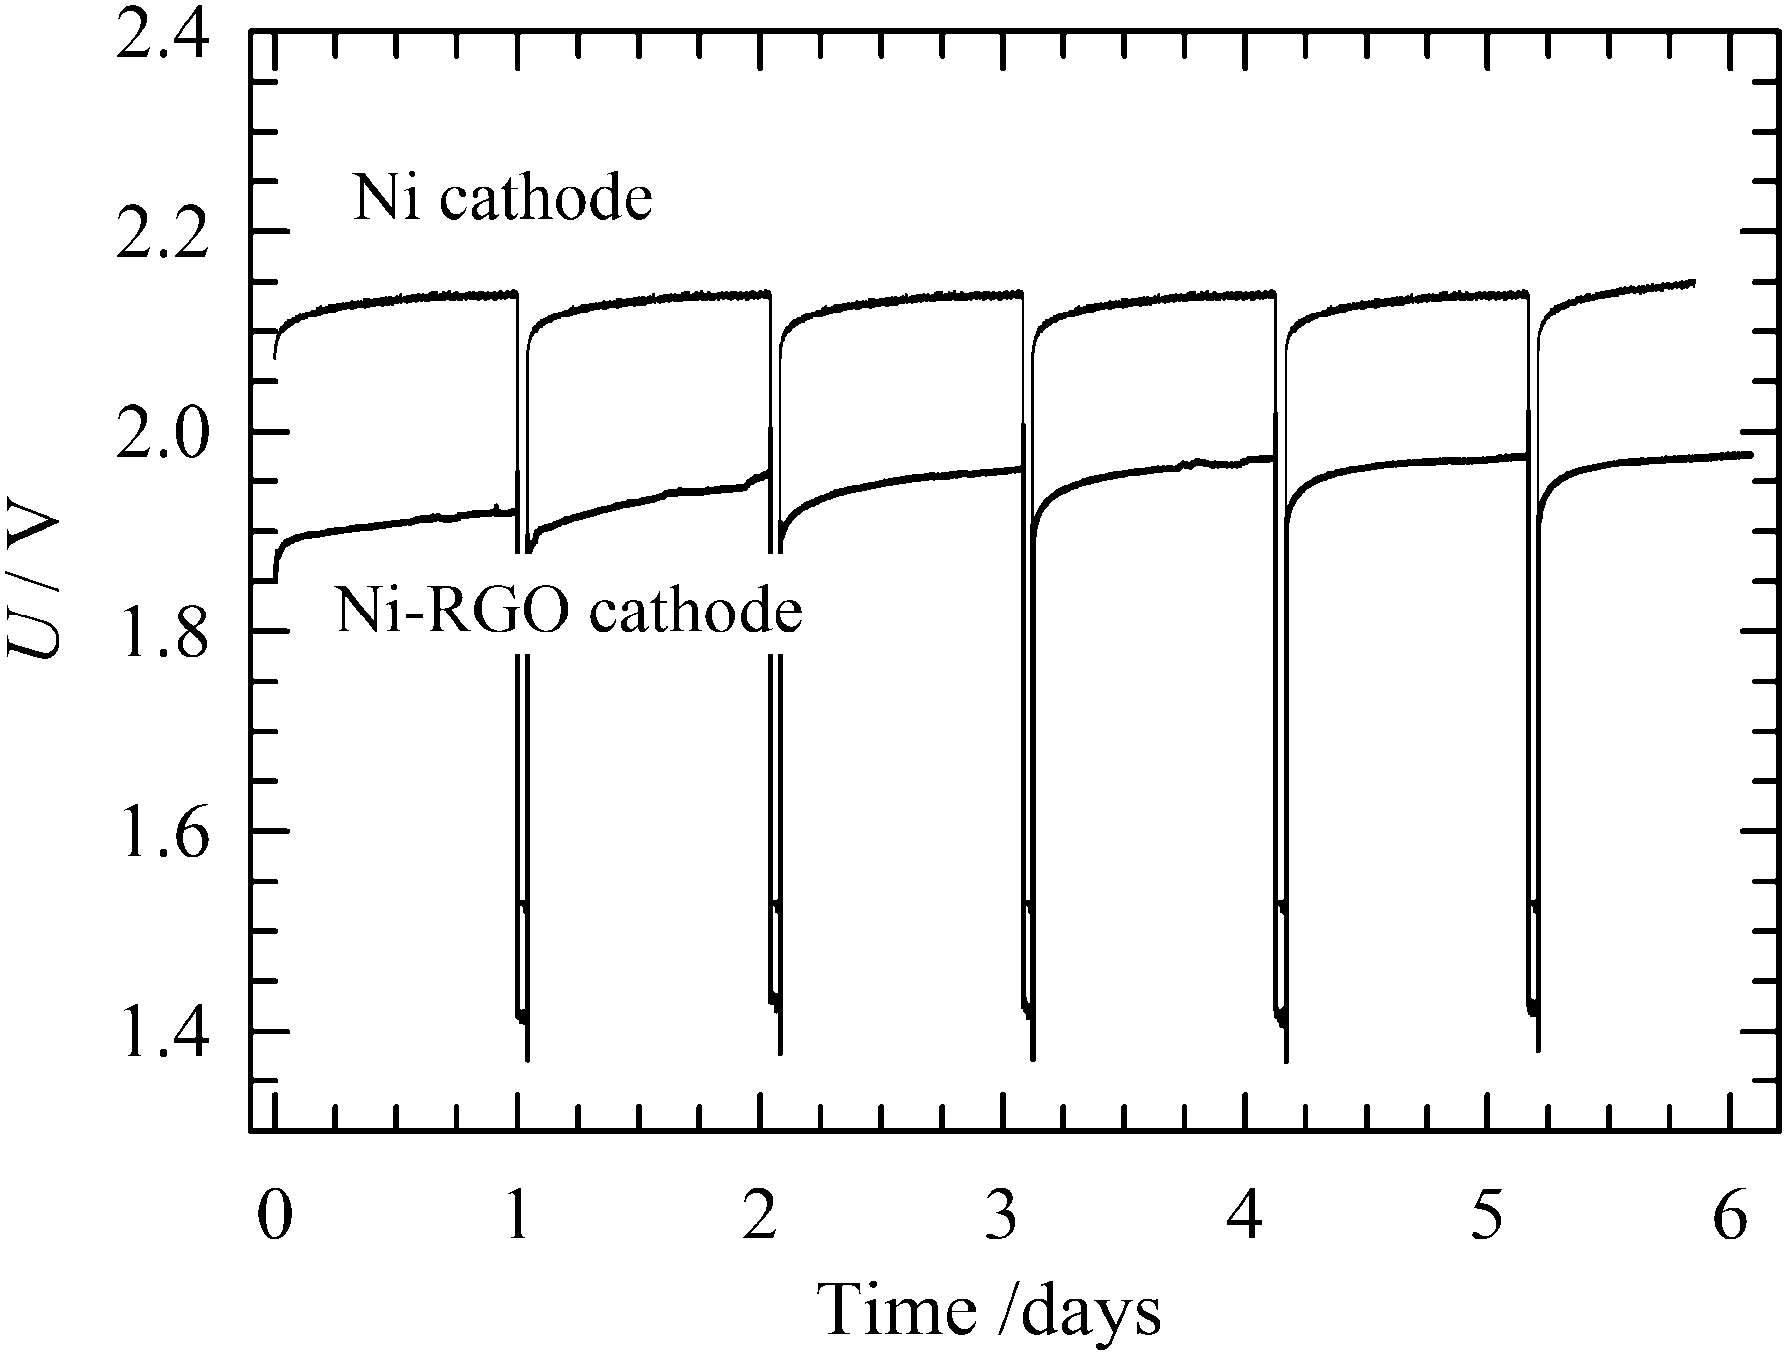 | ||
| Fig. 10 Long-term intermittent stability test of a single-cell water electrolyser. Experimental conditions: 50 °C; current load 265 mA cm−2, 1 hour current density was changed to 2.6 μA cm−2 after every 23 hours of operation at working current load; 10 wt% KOH solution; anode: bare Ni foam; cathode: 0.15 mg cm−2 RGO-coated Ni foam or bare Ni foam (indicated in the figure); electrode area 3.8 cm2; electrolyte flow rate 5 ml min−1. | ||
The SEM micrograph after 35 days (30 days continuous + 5 days intermittent) of electrolysis is presented in Fig. 11A and B. As can be seen, the electrode surface was damaged to a certain extent, as compared with the surface prior electrolysis as shown in Fig. 3A and B. These small changes can, however, be considered to have a negligible impact on the HER potential.
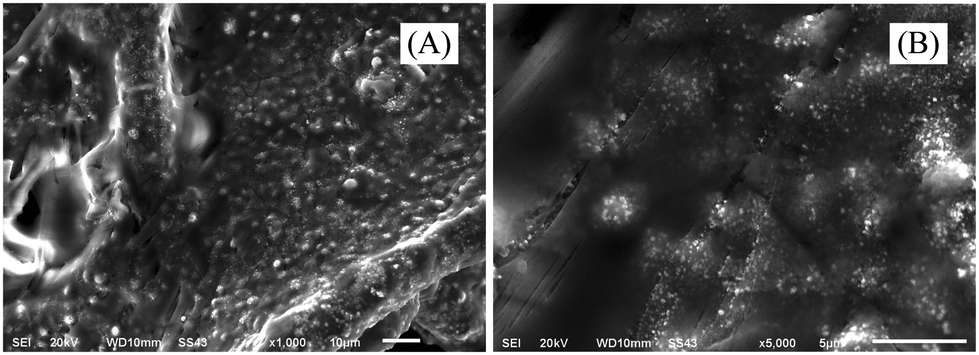 | ||
| Fig. 11 Surface morphology of the RGO/Ni foam catalytic layer after a 35 day (30 days continuous + 5 days intermittent) long-term electrolysis test. | ||
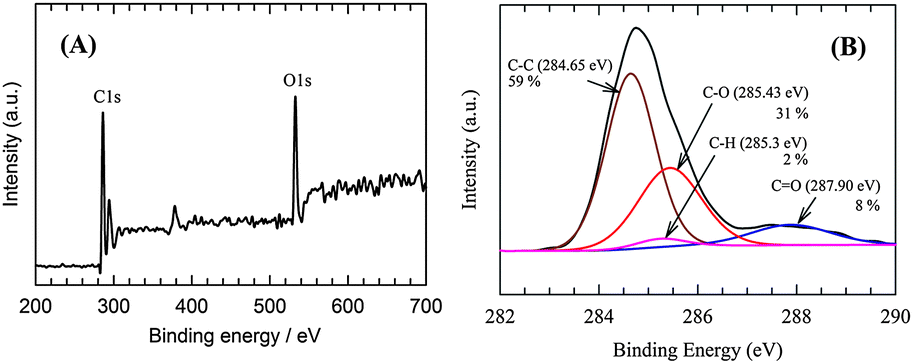
Furthermore, after long-term exposure the chemical composition of the RGO catalytic layer was examined by means of XPS. The XPS spectra survey scan in Fig. 12A reveal that the C and O atomic ratio was 3.45, which indicates a greater reduction of the RGO compared to the electrode prior to electrolysis as shown in Fig. 2B. The C1s spectra of the RGO catalyst after electrolysis are shown in Fig. 12B. The intensity of the C–C (59%) bond signal increased and that of the peak corresponding to the C–O or C–OH (31%) bonds decreased. This could be explained by virtue of the reduction of the C–O or C–OH bonds. On the other hand, the CO (8%) bond peak intensity increased, which may have been caused by the minor extent of the oxidation of the C–O or C–OH bonds in the intermittent electrolysis period. The additional peak (Fig. 12B) at 285.3 (2%) can be assigned to the binding energy of the C–H bond.57 While the observation of the C–H moieties is a direct confirmation of H spillover on the RGO surface,56 its low contribution to the overall C1s spectra is in harmony with the endothermic formation of Hads on RGO (Table 2). Since it can be observed that different C atoms bind Hads with differing strengths on the RGO surface, it is suggested that Hads only remained at the strongest binding sites of RGO under UHV conditions in the XPS chamber. However, according to our results, the rapid recombination of Hads on RGO is, in fact, what makes the RGO/Ni foam electrode such an excellent HER catalyst.
 | ||
| Fig. 12 The XPS survey spectra (A) and C1s fitting curve (B) of the RGO catalytic layer after a 35 day (30 days continuous + 5 days intermittent) long-term stability test. | ||
4. Conclusions
In this study, it has been reported that the RGO-modified nickel foam electrode is a superb novel HER catalyst in alkaline medium. Under identical conditions, the RGO/Ni catalyst even surpasses the Pt–C catalyst in terms of HER activity. Experimental measurements were complemented by DFT calculations which led to the following conclusion regarding the crucial role of RGO in the RGO-modified Ni foam electrode: it enables H spillover from the Ni foam, acting as an acceptor of H atoms obtained upon H2O discharge on Ni foam. This facilitates the formation of free active sites on the Ni phase, which is necessary for the HER to proceed, and also of an alternative path for H2 production via the recombination of the spilled Hads from the Ni foam to RGO. Such an action is enabled by the unique reactivity of RGO rendered by its O surface groups. The HER kinetics on the RGO/Ni foam is determined by the H2O discharge with the formation of the adsorbed H, while the H spillover enables an effective pathway for the removal of intermediately formed Hads. While the proposed mechanism of HER activity enhancement is a well-known concept in electrochemistry, the use of RGO as a surface modifier, and not as a support for nanosized catalysts, opens up a new perspective for the design of novel HER catalysts.The 35 day test manifested excellent stability of this electrode. The overall properties of the non-noble RGO/Ni foam electrode make an excellent case for an alternative to the noble metal-based HER catalyst.
Acknowledgements
We acknowledge funding support from the Ministry of Education, Youth and Sports of the Czech Republic under specific university research (MSMT No. 20/2015), and from the Serbian Ministry of Education, Science and Technological Development under project no. III45014.References
- J. A. Turner, Science, 2004, 305, 972–975 CrossRef CAS PubMed.
- T. N. Veziroglu, Int. J. Hydrogen Energy, 2000, 25, 1143–1150 CrossRef CAS.
- J. B. Yadav, J. W. Park, Y. J. Cho and O. S. Joo, Int. J. Hydrogen Energy, 2010, 35, 10067–10072 CrossRef CAS PubMed.
- C. C. Pavel, F. Cecconi, C. Emiliani, S. santicioli, A. Scaffidi, S. Catanorchi and M. Comotti, Angew. Chem., Int. Ed., 2014, 53, 1378–1381 CrossRef CAS PubMed.
- J. Hnát, M. Paidar, J. Schauer and K. Bouzek, Int. J. Hydrogen Energy, 2014, 39, 4779–4787 CrossRef PubMed.
- Y. Leng, G. Chen, A. J. Mendoza, T. B. Tighe, M. A. Hickner and C. Y. Wang, J. Am. Chem. Soc., 2012, 134(22), 9054–9057 CrossRef CAS PubMed.
- L. Wu, Y. He, T. Lei, B. Nan, N. Xu, J. Zou, B. Huang and C. T. Liu, Energy, 2013, 63, 216–224 CrossRef CAS PubMed.
- C. I. Muller, T. Rauscher, A. Schmidt, T. Schubert, T. Weißgärber, B. Kieback and R. Röntzsch, Int. J. Hydrogen Energy, 2014, 39, 8926–8937 CrossRef PubMed.
- D. Chanda, J. Hnát, M. Paidar, J. Schauer and K. Bouzek, J. Power Sources, 2015, 285, 217–226 CrossRef CAS PubMed.
- S. Seetharaman, R. Balaji, K. Ramya, S. K. Dhathathreyan and M. Velan, Int. J. Hydrogen Energy, 2013, 38, 14934–14942 CrossRef CAS PubMed.
- Q. Liu, J. Jin and J. Zhang, ACS Appl. Mater. Interfaces, 2013, 5(11), 5002–5008 CAS.
- Y. Liang, Y. Li, H. Wang, J. Zhou, J. Wang, T. Regier and H. Dai, Nat. Mater., 2011, 10, 780 CrossRef CAS PubMed.
- H. A. Becerril, J. Mao, Z. Liu, R. M. Stoltenberg, Z. Bao and Y. Chen, ACS Nano, 2008, 2, 463–470 CrossRef CAS PubMed.
- C. G. Navarro, R. T. Weitz, A. M. Bittner, M. Scolari, A. Mews, M. Burghard and K. Kern, Nano Lett., 2007, 7, 3499–3503 CrossRef PubMed.
- H. Tang, K. Dou, C. C. Kaun, Q. Kuanga and S. Yang, J. Mater. Chem. A, 2014, 2, 360–364 CAS.
- Y. Li, H. Wang, L. Xie, Y. Liang, G. Hong and H. Dai, J. Am. Chem. Soc., 2011, 133(19), 7296–7299 CrossRef CAS PubMed.
- J. Yang, D. Voiry, S. J. Ahn, D. Kang, A. Y. Kim, M. Chhowalla and H. S. Shin, Angew. Chem., Int. Ed., 2013, 52, 13751–13754 CrossRef CAS PubMed.
- G. F. Cai, J. P. Tu, J. Zhang, Y. J. Mai, Y. Lu, C. D. Gu and X. L. Wang, Nanoscale, 2012, 4, 5724–5730 RSC.
- X. Li, X. Wang, L. Zhang, S. Lee and H. Dai, Science, 2008, 319(5867), 1229–1232 CrossRef CAS PubMed.
- C. B. Ma, X. Qi, B. Chen, S. Bao, Z. Yin, X. J. Wu, Z. Luo, J. Wei, H. L. Zhang and H. Zhang, Nanoscale, 2014, 6, 5624–5629 RSC.
- S. Sarkar and S. Sampath, Chem. Commun., 2014, 50, 7359–7362 RSC.
- O. S. Kwon, T. Kim, J. S. Lee, S. J. Park, H. W. Park, M. Kang, J. E. Lee, J. Jang and H. Yoon, Small, 2013, 9(2), 248–254 CrossRef CAS PubMed.
- S. J. Wang, Y. Geng, Q. Zheng and J. K. Kim, Carbon, 2010, 48(6), 1815–1823 CrossRef CAS PubMed.
- K. Yu, Z. Wen, H. Pu, G. Lu, Z. Bo, H. Kim, Y. Qian, E. Andrew and S. Mao, J. Mater. Chem. A, 2013, 1(2), 188–193 CAS.
- A. K. Geim and K. S. Novoselov, Nat. Mater., 2007, 6(3), 183–191 CrossRef CAS PubMed.
- A. K. Singh, M. A. Ribas and B. I. Yakobson, ACS Nano, 2009, 3, 1657–1662 CrossRef CAS PubMed.
- K. Spyrou, D. Gournis and P. Rudolf, ECS J. Solid State Sci. Technol., 2013, 2(10), M3160–M3169 CrossRef CAS PubMed.
- L. Wang, U. Stimming and M. Eikerling, Electrocatalysis, 2010, 1, 60–71 CrossRef CAS.
- D. C. Marcano, D. V. Kosynki, J. M. Berlin, A. Sinitskii, Z. Sun, A. Slesarev, L. B. Alemany, W. Lu and J. M. Tour, ACS Nano, 2010, 4, 4806–4814 CrossRef CAS PubMed.
- J. Hnát, M. Paidar, J. Schauer, J. Zitka and K. Bouzek, J. Appl. Electrochem., 2012, 42, 545–554 CrossRef.
- P. Giannozziet, et al. , J. Phys.: Condens. Matter, 2009, 21, 395502 CrossRef PubMed.
- J. P. Perdew, K. Burke and M. Ernzerhof, Phys. Rev. Lett., 1996, 77, 3865–3868 CrossRef CAS.
- H. J. Monkhorst and J. D. Pack, Phys. Rev. B: Solid State, 1976, 13, 5188–5192 CrossRef.
- P. Quaino, F. Juarez, E. Santos and W. Schmickler, Beilstein J. Nanotechnol., 2014, 5, 846–854 CrossRef CAS PubMed.
- J. M. Jaksic, M. V. Vojnovic and N. V. Krstajic, Electrochim. Acta, 2000, 45, 4151–4158 CrossRef CAS.
- W. Sheng, H. A. Gasteiger and Y. S. Horn, J. Electrochem. Soc., 2010, 157(11), B1529–B1536 CrossRef CAS PubMed.
- V. V. Ivanovskaya, A. Zobelli, D. Teillet-Billy, N. Rougeau, V. Sidis and P. R. Briddon, Eur. Phys. J. B, 2010, 76, 481–486 CrossRef CAS.
- K. A. Mkhoyan, A. W. Contryman, J. Silcox, D. A. Stewart, G. Eda, C. Mattevi, S. Miller and M. Chhowalla, Nano Lett., 2009, 9, 1058–1063 CrossRef CAS PubMed.
- J. Ito, J. Nakamura and J. A. Natori, Appl. Phys., 2008, 103, 113712 Search PubMed.
- A. S. Dobrota, I. A. Pašti and N. V. Skorodumova, Electrochim. Acta, 2015, 176, 1092 CrossRef CAS PubMed.
- V. Georgakilas, M. Otyepka, A. B. Bourlinos, V. Chandra, N. Kim, K. C. Kemp, P. Hobza, R. Zboril and K. S. Kim, Chem. Rev., 2012, 112, 6156 CrossRef CAS PubMed.
- N. Ghaderi and M. Peressi, J. Phys. Chem. C, 2010, 114, 21625 CAS.
- S. Zhou and A. Bongiorno, Sci. Rep., 2013, 3, 2484, DOI:10.1038/srep02484.
- A. Mohsenzadeh, K. Bolton and T. Richards, Surf. Sci., 2014, 627, 1–10 CrossRef CAS PubMed.
- J. K. Nørskov, T. Bligaard, A. Logadottir, J. R. Kitchin, J. G. Chen, S. Pandelov and U. Stimming, J. Electrochem. Soc., 2005, 152, J23–J26 CrossRef PubMed.
- S. Trasatti, J. Electroanal. Chem. Interfacial Electrochem., 1972, 39, 163–184 CrossRef CAS.
- W. Sheng, M. Myint, J. G. Chen and Y. Yan, Energy Environ. Sci., 2013, 6, 1509–1512 CAS.
- W. Schmickler and S. Trasatti, J. Electrochem. Soc., 2006, 153, L31–L32 CrossRef CAS PubMed.
- J. G. Highfield, E. Claude and K. Oguro, Electrochim. Acta, 1999, 44, 2805–2814 CrossRef CAS.
- B. Baranowski, Hydride formation at high hydrogen pressure, in Metal Hydrides, ed. G. Bambakidis, Plenum Press, 1981, p. 193 Search PubMed.
- J. M. Jakšić, M. V. Vojnović and N. V. Krstajić, Electrochim. Acta, 2000, 45, 4151–4158 CrossRef.
- A. K. Singh, M. A. Ribas and B. I. Yakobson, ACS Nano, 2009, 3, 1657–1662 CrossRef CAS PubMed.
- A. D. Lueking, G. Psofogiannakis and G. E. Froudakis, J. Phys. Chem. C, 2013, 117, 6312 CAS.
- V. Barone, J. Heyd and G. E. Scuseria, J. Chem. Phys., 2004, 120, 7169 CrossRef CAS PubMed.
- C.-H. Chen and C.-C. Huang, Microporous Mesoporous Mater., 2008, 109, 549 CrossRef CAS PubMed.
- R. Bhowmick, S. Rajasekaran, D. Friebel, C. Beasley, L. Jiao, H. Ogasawara, H. Dai, B. Clemens and A. Nilsson, J. Am. Chem. Soc., 2011, 133, 5580 CrossRef CAS PubMed.
- S. Mukherjee, B. Ramalingam and S. Gangopadhyay, J. Mater. Chem. A, 2014, 2, 3954–3960 CAS.
| This journal is © the Owner Societies 2015 |