
 Open Access Article
 This Open Access Article is licensed under a
 Creative Commons Attribution 3.0 Unported Licence
Thermal evolution of cobalt deposits on Co3O4(111): atomically dispersed cobalt, two-dimensional CoO islands, and metallic Co nanoparticles
S.
Mehl
a,
P.
Ferstl
b,
M.
Schuler
b,
A.
Toghan
ac,
O.
Brummel
a,
L.
Hammer
b,
M. A.
Schneider
*b and
J.
Libuda
*ad
aLehrstuhl für Physikalische Chemie II, Friedrich-Alexander-Universität Erlangen-Nürnberg, Egerlandstrasse 3, 91058 Erlangen, Germany. E-mail: joerg.libuda@fau.de
bLehrstuhl für Festkörperphysik, Friedrich-Alexander-Universität Erlangen-Nürnberg, Staudtstrasse 7, 91058 Erlangen, Germany. E-mail: alexander.schneider@fau.de
cChemistry Department, Faculty of Science, South Valley University, 83523 Qena, Egypt
dErlangen Catalysis Resource Center, Friedrich-Alexander-Universität Erlangen-Nürnberg, Egerlandstrasse 3, 91058 Erlangen, Germany
First published on 18th August 2015
Abstract
Cobalt oxide nanomaterials show high activity in several catalytic reactions thereby offering the potential to replace noble metals in some applications. We have developed a well-defined model system for partially reduced cobalt oxide materials aiming at a molecular level understanding of cobalt-oxide-based catalysis. Starting from a well-ordered Co3O4(111) film on Ir(100), we modified the surface by deposition of metallic cobalt. Growth, structure, and adsorption properties of the cobalt-modified surface were investigated by scanning tunneling microscopy (STM), low-energy electron diffraction (LEED), and infrared reflection absorption spectroscopy (IRAS) using CO as a probe molecule. The deposition of a submonolayer of cobalt at 300 K leads to the formation of atomically dispersed cobalt ions distorting the surface layer of the Co3O4 film. Upon annealing to 500 K the Co ions are incorporated into the surface layer forming ordered two-dimensional CoO islands on the Co3O4 grains. At 700 K, Co ions diffuse from the CoO islands into the bulk and the ordered Co3O4(111) surface is restored. Deposition of larger amounts of Co at 300 K leads to formation of metallic Co aggregates on the dispersed cobalt phase. The metallic particles sinter at 500 K and diffuse into the bulk at 700 K. Depending on the degree of bulk reduction, extended Co3O4 grains switch to the CoO(111) structure. All above structures show characteristic CO adsorption behavior and can therefore be identified by IR spectroscopy of adsorbed CO.
1. Introduction
Cobalt oxide nanomaterials have recently attracted much attention because of their application potential in heterogeneous catalysis,1–4 energy-related materials,5–8 and electrocatalysis.9–11 There are many reactions in which cobalt oxides show high activity, for example in low temperature CO oxidation1,3,12–19 and the selective oxidation of CO (PROX, for removal of CO from the hydrogen feed of fuel cells),6 the oxidation of methane and of volatile organic compounds (VOC),2,20–26 and in both, the oxygen reduction reaction (ORR) and the oxygen evolution reaction (OER) in electrocatalysis.9,10,27 Other applications that involve partially oxidized cobalt phases or metallic and bimetallic cobalt nanoparticles are, for example, the production of hydrogen by reforming of hydrocarbon oxygenates such as ethanol,7,8,28,29 or the Fischer–Tropsch reaction.30,31 Noteworthy, in several of these applications cobalt oxide may replace noble metals such as platinum or rhodium, thereby providing a low-cost alternative to noble metal catalysts.In various respects the adsorption behavior and reactivity of nanostructured cobalt and cobalt oxide catalysts is quite different from its noble metal counterparts. A feature that is rather unique for cobalt oxide is its outstanding structure dependency.4 For the case of CO oxidation, it has early been recognized that the Co3O4 shows very high activity even at low temperature.12 Haruta and coworkers demonstrated outstanding activity of Co3O4 nanorods for CO oxidation at temperatures as low as −77 °C.1 These nanorods expose a large fraction of (110) facets, and on the basis of theoretical calculations, different mechanisms have been proposed for the activation of lattice oxygen.1,16,32 These pathways involve either threefold or two-fold coordinated oxygen, a species that may be present at the bulk-terminated (110) surface. It is not clear, however, whether the assumed bulk termination is realistic. In fact, the atomic structure of the nanomaterial facets under reaction conditions is generally unknown, even if their shape is well-controlled. Especially in moist reaction environments, as for example in the experiments reported by Haruta and coworkers,1 hydroxylation of the surface is likely and the role of coadsorbed water is poorly understood in general.
Even less is known on the microscopic mechanisms for more complex reactions involving larger hydrocarbons and hydrocarbon oxygenates.4 Different active sites and structural features have been suggested to play a role. For example, Co3O4 nanosheets with predominately (112) facets were shown to be particularly active for CH4 oxidation.33,34 Here, various other factors were considered, in particular the presence of oxygen vacancies and surface Co2+ ions. For oxygenate reforming, finally, the synergistic combination of ionic and metallic CO sites is essential.29
The present work aims at the development of new cobalt-oxide-based model systems which allow us to study their surface chemistry under well-controlled ultrahigh vacuum (UHV) conditions.35–37 We take advantage of the fact that a variety of well-ordered Co3O4 and CoO films can be grown on Ir(100).38–48 In a unique fashion, these films allow varying the stoichiometry, the surface orientation, the film thickness, and the defect density. Over the last years many of these structures have been characterized in great detail using STM and LEED I–V analysis.38,46 In previous work, we have explored the interaction of CO and O2 with well-ordered and well-defined Co3O4(111) film.49 We investigated the adsorbate phases of CO on Co3O4(111) and showed that, in addition to the molecularly adsorbed CO, a carbonate species is formed at the side facets of the Co3O4(111). In the present work, we aim at the properties of partially reduced and mixed metallic/oxidic cobalt surfaces. The morphology of these systems is characterized and their adsorption properties are investigated using CO as a probe molecule. In upcoming work, these model systems will be used to study the interaction and the catalytic conversion of hydrocarbons and hydrocarbon oxygenates.
2. Experimental section
The experiments were performed in two UHV systems at the Universität Erlangen-Nürnberg, Germany. The STM experiments were conducted in a UHV chamber at a base pressure of 2 × 10⁻¹¹ mbar. Sample preparation, LEED, and STM were performed in situ. For STM experiments (at 300 K) the sample was transferred to a separate part of the UHV chamber and electrochemically etched tungsten tips were used. The IRAS experiment were performed in a UHV system with a base pressure of p = 2 × 10⁻¹⁰ mbar, containing all necessary preparation characterization methods (LEED, Auger Electron spectroscopy, thermal desorption spectroscopy). The IR measurements were performed with a vacuum Fourier-transform infrared (FT-IR) spectrometer (Bruker VERTEX 80v) equipped with a liquid-nitrogen cooled narrow-band HgCdTe (MCT) detector. The spectrometer is coupled via differentially pumped KBr windows to the UHV system. Up to 6 dosers and evaporation sources can be aimed at the IR measurement position allowing in situ measurements during metal deposition, gas adsorption and reaction experiments. The present measurements were performed in a fully remote-controlled mode (National Instruments (NI) and LabVIEW interface) by dosing pulses of CO via a gas doser equipped with an electromagnetic valve and subsequent acquisition of a spectrum. The low pressure reservoir of the doser was filled with CO (Messer, 4.7) that was further purified using a liquid nitrogen cool trap to remove possible traces of volatile carbonyls. Before the experiment a background spectrum was taken (200 scans, sampling rate 10 kHz, resolution 4 cm−1, 110 s). For each experiment 15 pulses of CO corresponding to exponentially increasing gas doses were admitted. After each CO pulse a spectrum was taken (200 scans, sampling rate 10 kHz, resolution 4 cm−1, 110 s).Sample preparation
The preparation of the Co3O4(111) films on Ir(100) was previously described in the literature.38,46 The same films (of slightly lower thickness) were used in a previous publication.49 The Ir(100) single crystal (Matek) was mounted on a tantalum sample holder that permits heating to 1500 K and cooling with liquid nitrogen to 100 K. The sample temperature was measured with a type-K thermocouple spot-welded directly to the sample. The sample was cleaned by ion bombardment and annealing cycles as described in the literature. First, the Ir was cleaned by several cycles of ion bombardment (2 keV, 10 μA) for 60 min with Ar (Linde, 6.0) and subsequent annealing for 3 min to 1273 K. The quality of the surface was checked by LEED (1 × 1 structure at 200 eV). Subsequently, the sample was cooled down with liquid nitrogen to 100 K and placed in front of a O2 gas doser. Then the sample was annealed to 1273 K in 5 × 10⁻⁶ mbar oxygen (Linde, 5.0) for 5 minutes. After cooling to room temperature, this procedure yields a sharp 2×1-O superstructure in LEED. A commercial electron-beam evaporator (Focus EFM3) was used to grow the cobalt oxide film. The deposition rate of cobalt (2 mm rod, Alfa Aesar 99.995%) was calibrated using a quartz microbalance. A deposition rate of 2 Å min−1 was used (EFM3, ion flux 60 nA), corresponding to 1 monolayer equivalent (MLE) per minute. For preparation of the Co3O4(111) film the sample was cooled to 100 K and Co was deposited for 20 min (1 MLE per min) at an oxygen partial pressure of 5 × 10⁻⁶ mbar. Subsequently the film was annealed in oxygen for 2 min at 523 K and finally briefly heated in UHV to 673 K to improve the degree of ordering. After this procedure the quality of the films was checked by LEED. Finally, metallic Co was deposited under UHV conditions at a sample temperature of 300 K. The deposition times were 30 s for a Co film with a nominal thickness of 1 Å and 150 s for a nominal film thickness of 5 Å.3. Results and discussion
3.1 Growth and structure of Co on Co3O4(111)/Ir(100) studied by STM
In Fig. 1a(i) we show a LEED pattern and an STM image of the pristine Co3O4 film. The film consists of (111) oriented grains up to 100 nm in diameter. From the previous structural analysis48 it is known that this surface is terminated by Co atoms that would nominally correspond to the Co2+ ions of the bulk crystal. The STM data mainly reveal steps between terraces with a step height of 4.7 Å which corresponds to a single repetition unit of the spinel structure.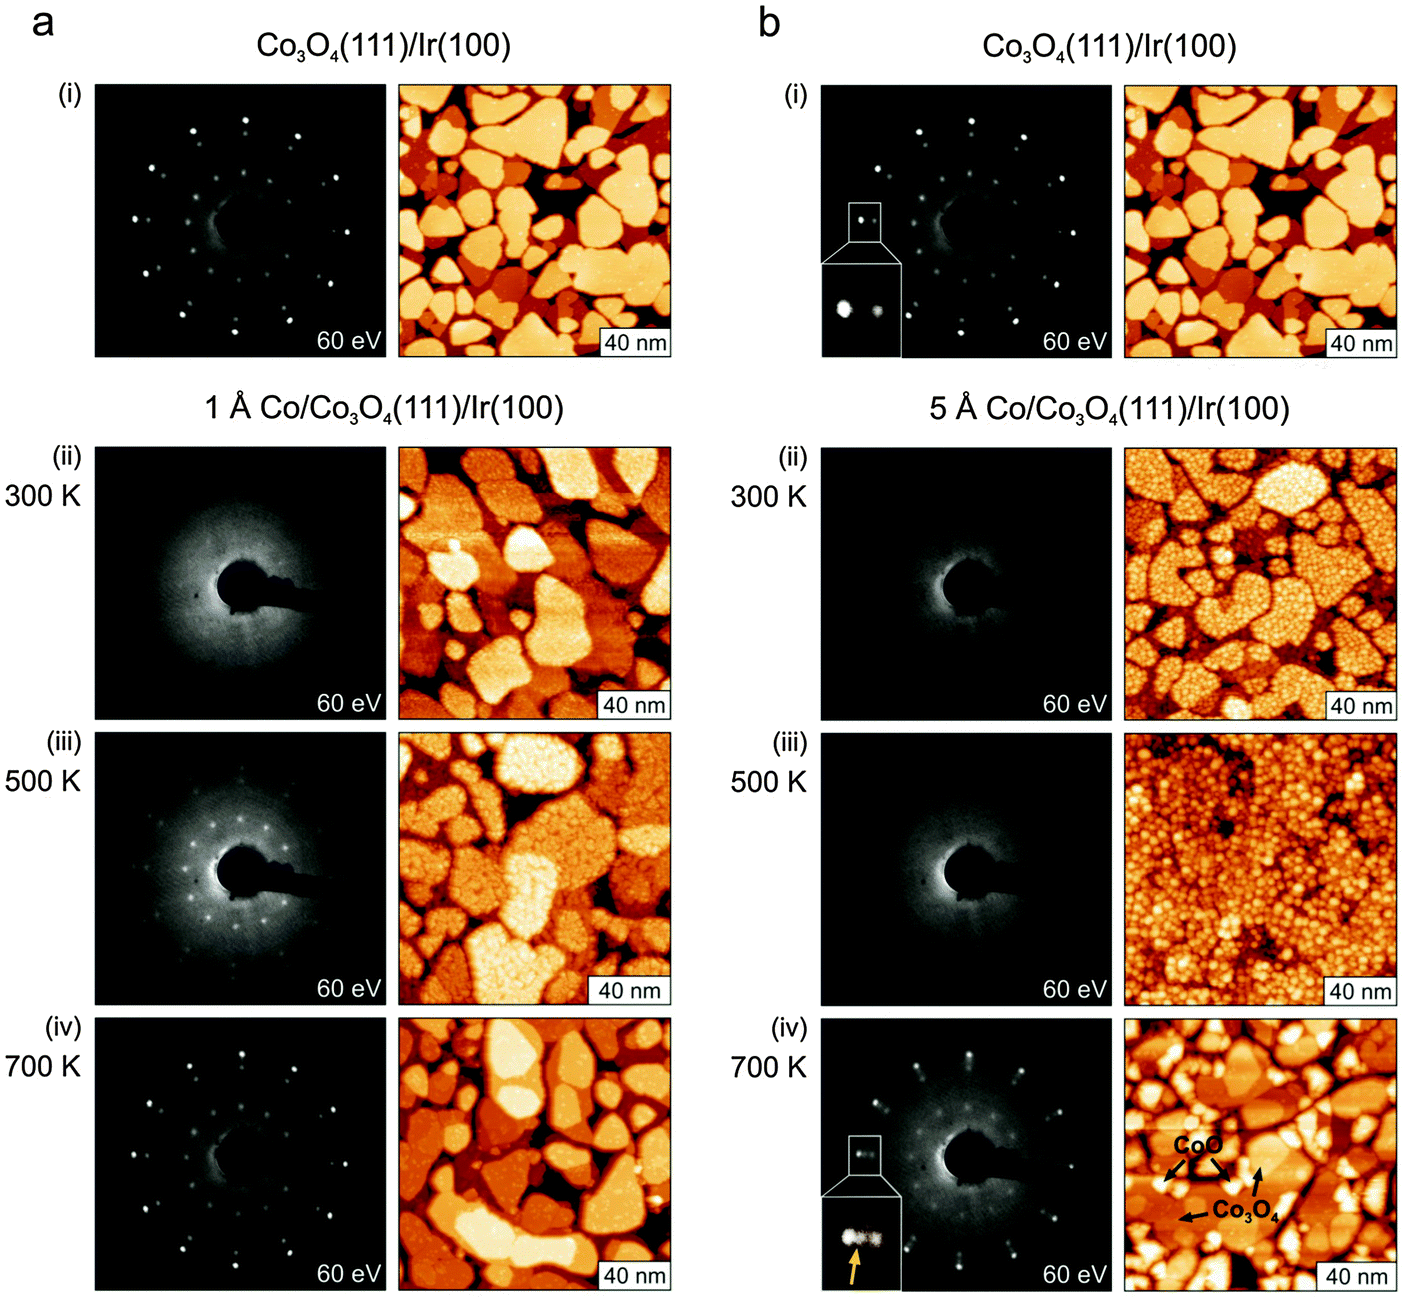 | ||
| Fig. 1 (a) LEED patterns and STM images (130–150 nm)2 taken at 300 K of the pristine Co3O4(111) film on Ir(100) (i), after deposition of 1 Å Co at 300 K (ii), and after subsequent annealing steps to 500 K (iii) and 700 K (iv). (b) LEED patterns and STM images (130–150 nm)2 taken at 300 K of the pristine Co3O4(111) film on Ir(100) (i), after deposition of 5 Å Co at 300 K (ii), and after subsequent annealing steps to 500 K (iii) and 700 K (iv). The insets in (i) and (iv) demonstrate the emergence of an additional reflex in the LEED pattern after annealing to 700 K due to a partial CoO(111) texture of the film that was clearly absent before. The CoO(111) texture appears in STM as crystallites protruding from the average Co3O4 surface level as indicated. | ||
In a first step, we investigate the structural changes of the Co3O4(111) film after deposition of Co at 300 K shown in Fig. 1a(i) and b(i). After deposition of 1 Å (approximately 0.5 ML, Fig. 1a(ii)) of Co the very sharp LEED pattern of the pristine film disappears completely, indicating a complete loss of the long-range order in the surface region. The same is the case after deposition of 5 Å Co (see Fig. 1b(ii)). Whereas the film shows grains with a rough surface after deposition of 1 Å Co, we observe the decoration with larger aggregates of 3–5 Å height after deposition of 5 Å Co. In the latter case, these small aggregates can easily be picked up by the tip which maintains its metallic character afterwards. This observation indicates that the Co deposits stay metallic on the surface at 300 K.
Subsequent annealing in UHV alters the surface morphology and structure of the film drastically. After annealing to 500 K the crystallites of the 1 Å Co/Co3O4 film are covered by what seem to be small islands of diameters ranging from 5 to 30 Å. However, the heights of these structures are one to three times 1.5 Å which is considerably less than the expected step height of 2 Å of Co(0001). Also the ordered LEED pattern of Co3O4(111) reappears, but with strongly altered relative spot intensities. This is a clear indication of a modified surface structure. Therefore we interpret the small islands as ordered patches of a structurally yet unknown 2D phase of CoO on the Co3O4 film.
After annealing the 5 Å Co deposits to 500 K a somewhat different morphology is observed. We observe the formation of larger three-dimensional particles, similar to what is typically observed for metal deposition on oxide surfaces.50 It was not possible to resolve the structure of these particles in more detail by STM. As suggested by the IRAS data discussed below, the particles consist of metallic Co aggregates which grow on the two-dimensional CoO phase described above. Although the size and the structure of the particles cannot be determined directly from STM, we can still estimate the particle density to be 5 × 1012 cm−2. From this density and the amount of Co deposited (5 Å, 3.4 × 10¹⁵ Co atoms cm−2) we may estimate the average number of Co atoms per particle to be 700 atoms per particle. To some degree, the originally well-developed trenches between grains appear to decrease in density and depth after Co deposition and annealing. This could indicate some incorporation of Co into the Co3O4 films which would then expand accordingly. In total the surface of the film is not ordered as evidenced by the still missing LEED pattern.
After annealing the Co covered films to 700 K the original LEED pattern of the pristine film Co3O4(111) film is largely recovered. STM reveals again large grains that have the same atomic structure as in the original films. For the 1 Å deposit only few small and flat islands remain on the Co3O4 grains. Also for the 5 Å Co deposit we observe that on a large fraction of the surface the Co3O4(111) terraces are restored with a relatively low density of defects on top. In addition we observe the formation of larger islands and crystalline grains. To identify the atomic structure of the additional grains we use the extreme sensitivity of LEED to ordered structures. Detailed inspection of the LEED patterns (inserts of Fig. 1b(i) and (iv)) reveals that an ordered structure is present in the film that was absent before. By comparison with energy-dependent LEED data from a well-ordered CoO(111) film46 and with STM data from a reduced Co3O4 film49 we conclude that a substantial fraction of these new grains are well-ordered CoO(111) crystallites.
3.2 CO adsorption at Co deposits in Co3O4(111)/Ir(100) probed by IRAS
In the next step, we explore the CO adsorption properties of the modified films. The experiments were performed at the same cobalt coverages as the STM/LEED experiments corresponding to nominal Co layer thicknesses of 1 Å and 5 Å, respectively. Co was deposited at 300 K and, subsequently, the samples were cooled to 100 K. After taking the reference spectrum, the samples were exposed to a pre-programmed series of exponentially increasing doses of CO. IR spectra were automatically acquired after each CO dose. Thus, an exposure range covering more than four orders of magnitude could be explored, ranging from 0.003 L to 49 L (1 L (Langmuir) = 1 × 10⁻⁶ Torr s).Corresponding series of spectra are displayed in Fig. 2a for a cobalt coverage of 1 Å and in Fig. 3a for a cobalt coverage of 5 Å. In both figures, the left panel displays the complete exposure range, and the right panel shows a close up of the exposure range <0.05 L. The excellent signal-to-noise ratio of the current experiments permits detection of adsorbed CO at exposures down to approximately 0.001 L or coverages down to θ = 0.001. At exposures lower than 0.05 L the bands show hardly any coverage dependent shifts, suggesting that the bands in this coverage range correspond to the singleton frequencies of the related species.
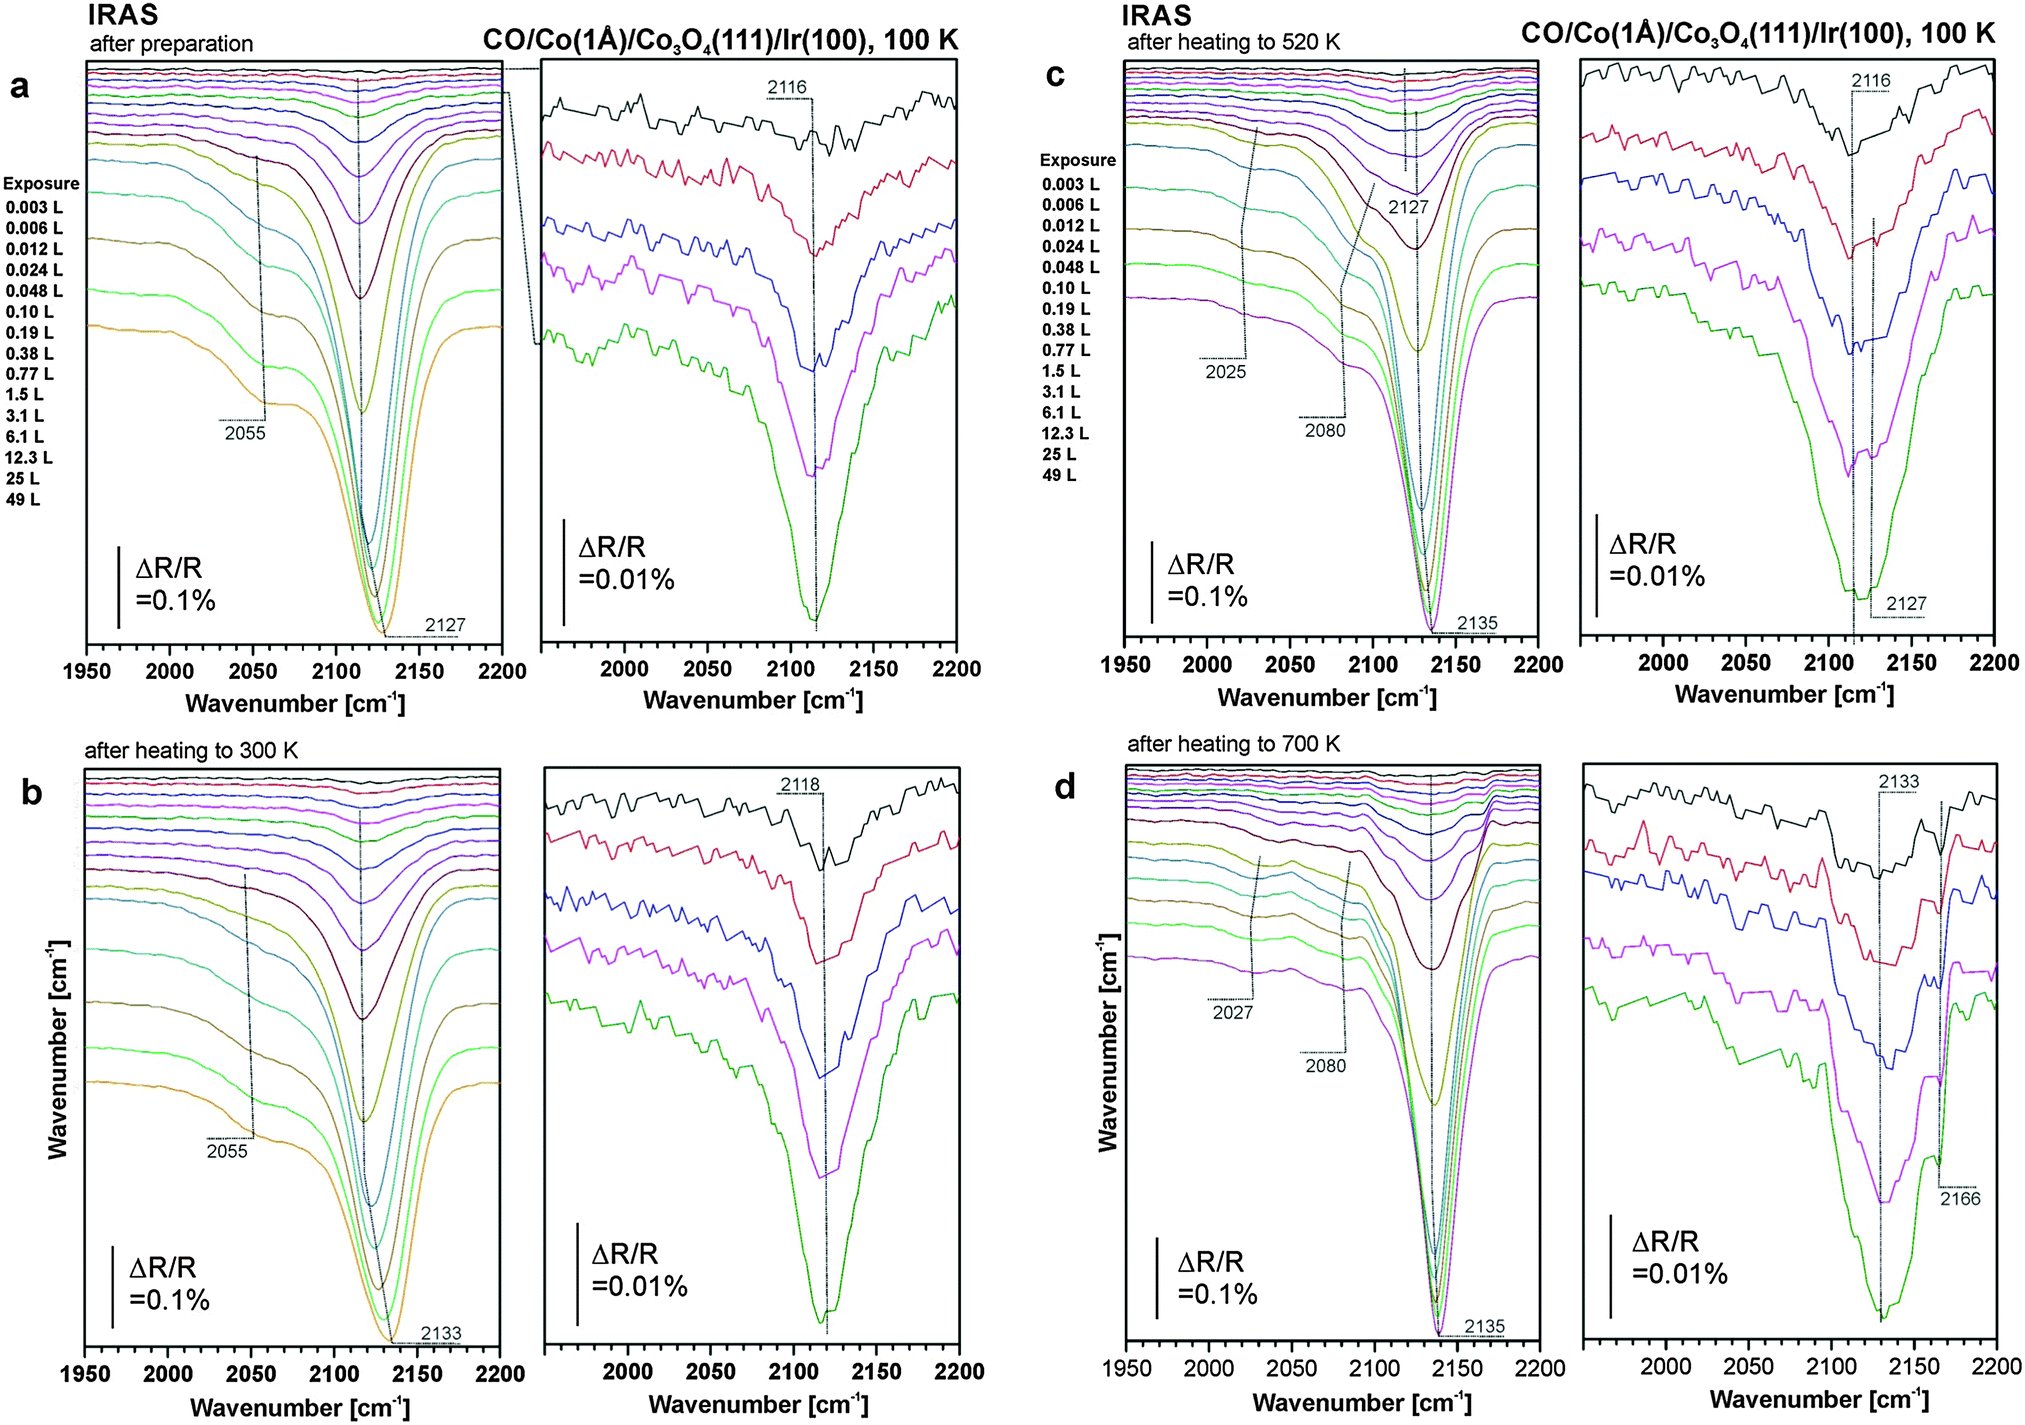 | ||
| Fig. 2 (a) IR reflection absorption spectra of CO adsorbed on Co3O4(111)/Ir(100) after deposition of 1 Å Co at 300 K. CO adsorption and measurement of the spectra took place at 100 K. (b) IR spectra measured on sample (a) after annealing to 300 K and subsequent exposure to CO at 100 K. (c) IR spectra measured on sample (b) after annealing to 520 K and exposure to CO at 100 K; (d) IR spectra measured on the sample in (c) after annealing to 700 K and exposure to CO at 100 K. | ||
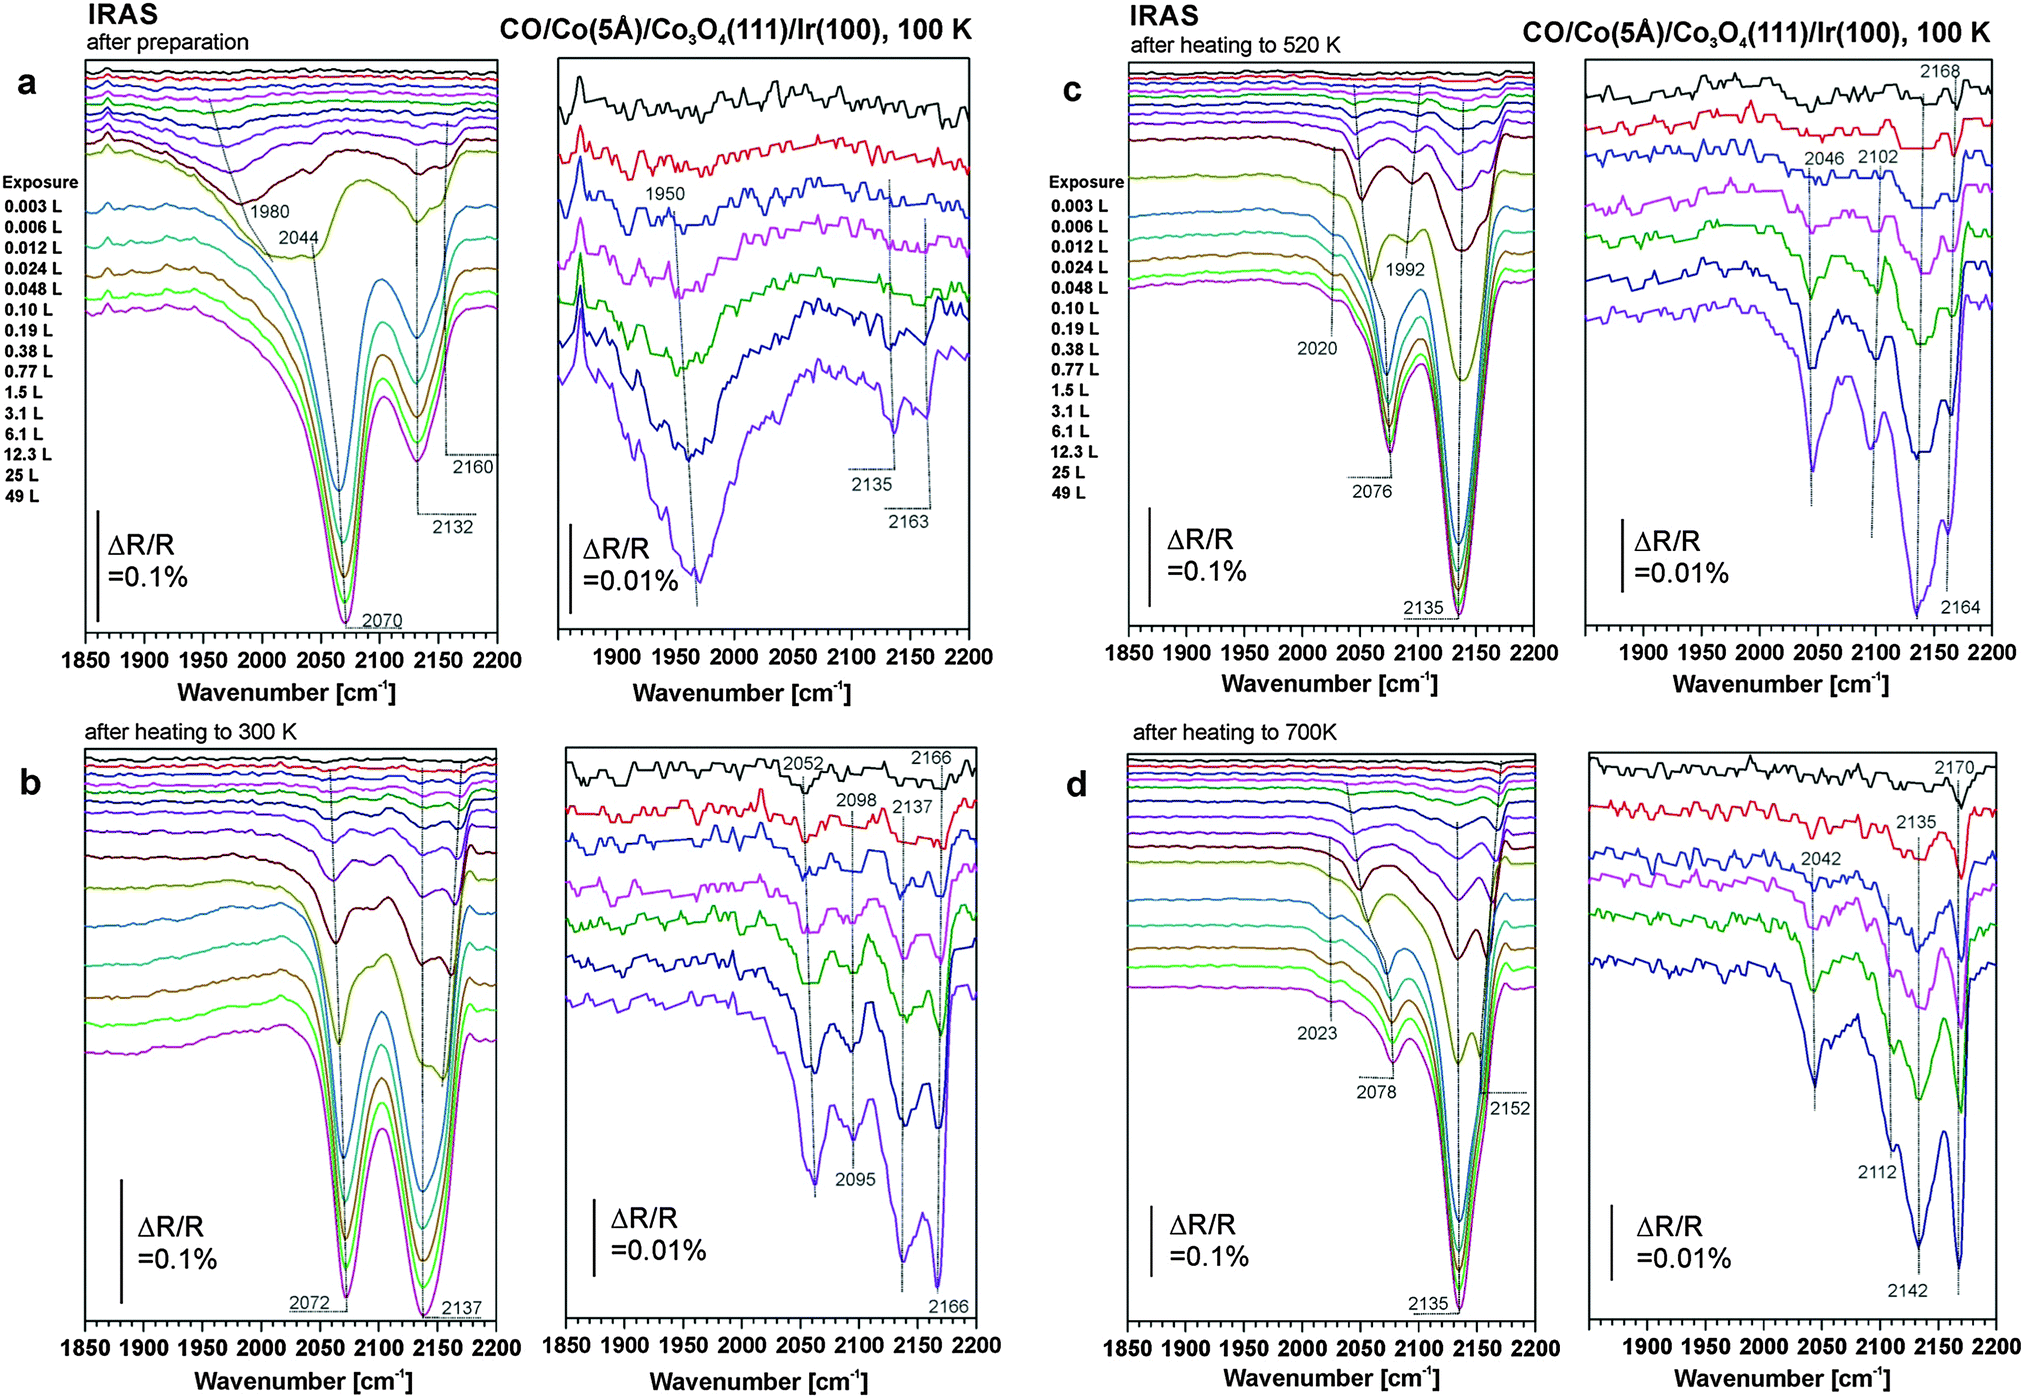 | ||
| Fig. 3 (a) IR reflection absorption spectra of CO adsorbed on Co3O4(111)/Ir(100) after deposition of 5 Å Co at 300 K. CO adsorption and measurement of the spectra took place at 100 K. (b, bottom) IR spectra measured on sample (a) after annealing to 300 K and subsequent exposure to CO at 100 K. (c) IR spectra measured on sample (b) after annealing to 520 K and subsequent exposure to CO at 100 K; (d) IR spectra measured on the sample in (c) after annealing to 700 K and subsequent exposure to CO at 100 K. | ||
For the 1 Å Co deposit, we observe a band at 2116 cm−1 in the limit of small exposure. This band shows hardly any coverage dependent shift up to CO exposures around 1 L. At larger exposure a small blue shift to 2127 cm−1 is observed. In addition we observe a weak and broad shoulder at around 2055 cm−1 which appears at CO exposures exceeding 0.2 L.
For the 5 Å Co deposit the spectra are more complex. In the limit of low CO exposure we observe a broad band at 1950 cm−1 which blue-shifts to 1980 cm−1 with increasing CO exposure. At exposures exceeding 1 L, the feature at 1980 cm−1 disappears in favor of a band at 2044 cm−1, which blue-shifts to 2070 cm−1 with increasing exposure. In addition two sharper bands appear at 2135 and 2163 cm−1 at exposures exceeding 0.1 L.
The very strong effect of the cobalt deposits on the CO adsorption behavior of Co3O4(111) even at submonolayer coverages becomes apparent if we compare the CO adsorption spectra obtained after deposition of 1 Å Co to those of the pristine film as shown for low and high CO coverage in Fig. 4a and b, respectively.
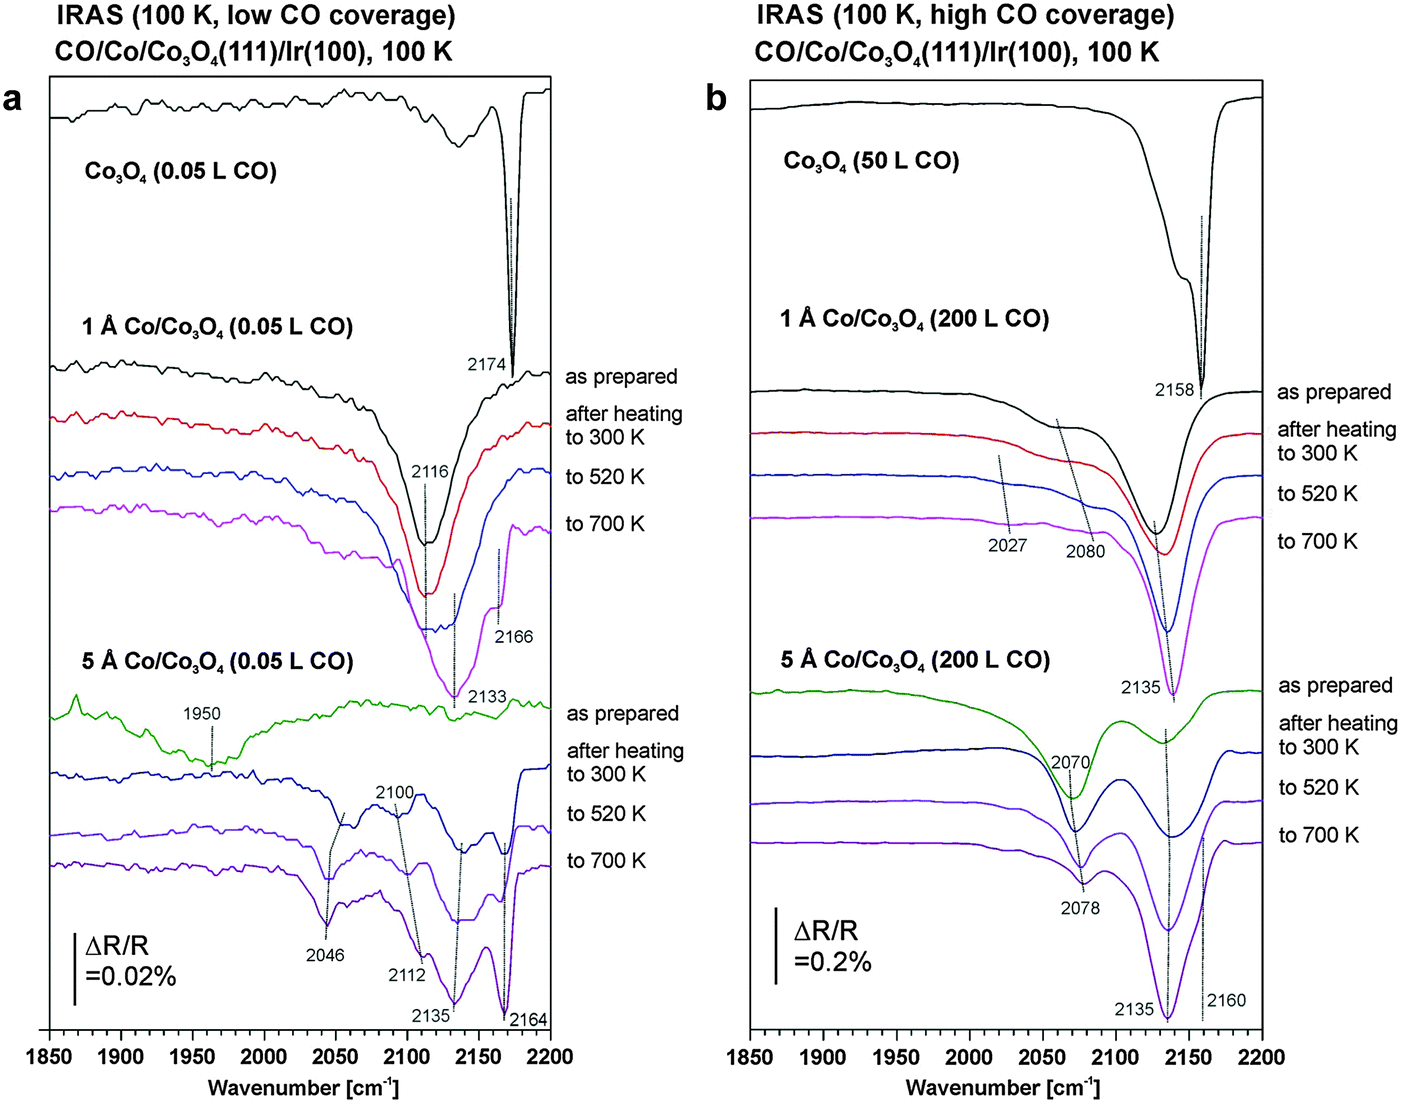 | ||
| Fig. 4 (a) Comparison of the IR reflection absorption spectra of CO at low coverage adsorbed on Co3O4(111)/Ir(100) after deposition of 1 Å Co (center) and 5 Å Co (bottom) and subsequent annealing at different temperatures. The CO was adsorbed and the spectra were measured at 100 K. The IR spectra for CO on the pristine Co3O4(111)/Ir(100) is displayed at the top (from ref. 49). (b) Comparison of the IR reflection absorption spectra of CO at high coverage adsorbed on Co3O4(111)/Ir(100) after deposition of 1 Å Co (center) and 5 Å Co (bottom) and subsequent annealing at different temperatures. The CO was adsorbed and the spectra were measured at 100 K. The IR spectra for CO on the pristine Co3O4(111)/Ir(100) is displayed at the top (from ref. 49). | ||
In a previous study we investigated the CO adsorption on the pristine Co3O4(111) film in detail.49 We found that at low exposure CO adsorbs at Co2+ centers, giving rise to a sharp band around 2170 cm−1. At exposures exceeding 1 L, a compressed phase is formed in which surface sites are occupied in between the Co2+ ions. As a result two CO bands are observed at 2135 cm−1 and 2160 cm−1. Simultaneously, a weak band at 1750 cm−1 appears which was assigned to the formation of bidentate carbonate species at oxygen ions located at defects such as terrace edges and side faces.
In comparison to the pristine Co3O4(111) film, after deposition of 1 Å Co the original Co2+ sites of the film surface quantitatively disappear. In agreement with the STM results discussed in Section 3.1, this observation clearly shows that the deposited Co does not form three-dimensional metallic islands, as is normally observed for metal deposition on oxide surfaces. Instead the Co is atomically dispersed in a rather homogeneous fashion. In line with the LEED and STM results we attribute the change to the formation of a layer of atomically dispersed Co ions which cover the Co3O4 surface nearly completely and distort its long range order. The stretching frequency for the CO adsorbed at this dispersed Co deposits lies clearly above the typical CO stretching frequencies for metallic Co (1950–2070 cm−1, see ref. 51–56 and discussion below). Yet, the observed frequency is also slightly below the previously observed CO frequencies on cobalt oxide (2135–2175, see ref. 49). We attribute the band to CO adsorption at Co2+ centers in the distorted surface layer. It is noteworthy that the band is relatively narrow and shows nearly no coverage dependent shift. This observation is in line with the STM results suggesting a relatively homogeneous distribution of the dispersed Co phase.
The shift which we observe at exposures exceeding 1 L may be associated with the coadsorption of CO at regular oxide sites (giving rise to bands at 2135 and 2158 cm−1 at high coverage, see ref. 49). The weak shoulder at 2055 cm−1 is associated with CO adsorption at a minor fraction of small metallic Co aggregates, as discussed in the following. Interestingly, the carbonate band at 1750 cm−1 is completely quenched by cobalt deposition. Previously, we suggested that the carbonate species is formed by activation of CO at the oxygen ions located at step edges.49 We conclude that these step sites are also efficiently covered by the Co deposit.
We may speculate why the Co deposits do not form metallic nanoparticles at low coverage, as is observed for most noble and transition metals on oxide surfaces. A possible explanation involves facile electron transfer from the Co0 atoms deposited to the Co3+ ions in the subsurface region. If this redox process is faster than diffusion of Co0, Co2+ ions are formed which repel each other electrostatically and the nucleation of Co nanoparticles will be suppressed.
For the case of thicker Co films (2.5 ML or 5 Å) the IR spectrum at low CO coverage (<1 L) is dominated by the band at 1950 cm−1 to 1980 cm−1, which is associated with CO adsorption on the facets of metallic Co nanoparticles. Toomes and King attributed the band at 1972 cm−1 on Co(10−10) to on-top CO.51 Tskipuri and Bartynski observed two bands at 1936 cm−1 and 1974 cm−1 for the case CO on Co films on Cu(100) which they assigned to CO at bridge and on-top sites respectively.56 Carlsson et al. investigated CO adsorption on Co nanoparticles grown on an ordered alumina support. They observed a CO stretching band at 1967 cm−1 and assigned it to on-top CO.53 In all of these studies a high coverage phase is formed at larger exposure, accompanied by a strong blue-shift of the bands. On Co(10−10) the high coverage phase was associated with CO occupying both on-top and higher coordinated sites.52 For CO/Co/Cu(100), Tskipuri and Bartynski attributed a feature at 2060 cm−1 to the coordination of two CO molecules to one Co center.56 On the basis of isotopic exchange experiments on supported Co nanoparticles, Carlsson et al. had previously assigned a similar band at 2068 cm−1 to a carbonyl-like species with the stoichiometry Co(CO)n (n = 3, 4).53 It is noteworthy that in our experiments the feature in this spectral range shows a strong coverage-dependent blue shift from 2044 to 2070 cm−1. This observation suggests strong dipole coupling between the CO species, and points to CO adsorption at neighboring metallic sites, e.g. at particle edges, rather than to the formation of a molecular carbonyl. In addition to the metal-related bands we observe two weak bands at 2132 and 2160 cm−1. They are close to the CO stretching frequencies observed for the Co-free Co3O4 film and, therefore, are attributed to unoccupied fractions of the surface. These assignments agree with the STM and LEED results (see Section 3.1) which suggest that for larger Co coverage metallic Co particles grow on top of the dispersed Co phase that is formed initially.
3.3 Thermal behavior of the Co deposits on Co3O4(111)/Ir(100) probed by IRAS
To explore the thermal behavior of the cobalt deposits on Co3O4, the samples were annealed stepwise to different temperatures and subsequently cooled to 100 K before they were exposed to CO again. A heating series to 300 K, 520 K and 700 K for the 1 Å Co film is displayed in Fig. 2b–d and for the 5 Å Co film in Fig. 3b–d. A comparison of the spectra obtained before and after annealing to those of the clean Co3O4 film is compiled in Fig. 4a for low CO coverage and in Fig. 4b for high CO coverage.We consider the 1 Å (0.5 ML) Co film first. Upon annealing to 300 K, the principal band at 2116 cm−1 remains practically unchanged. This implies that the CO adsorbed on the Co2+ sites of the dispersed Co phase desorbs below 300 K, while its structure remains unchanged. After annealing to 520 K the band at 2116 cm−1 is visible only at very low exposure. Already at around 0.01 L CO a new band at 2127 cm−1 appears, which dominates the spectrum at exposures around 1 L. We attribute this band to CO adsorption on the Co ions of the two-dimensional CoO phase, identified by STM and LEED (Section 3.1). Regarding its chemical and adsorption properties, the ordered two-dimensional CoO phase is similar to the disordered phase as indicated by the small CO stretching frequency shift between both structures. The band related to CO on ordered Co3O4(111) at 2170 cm−1 remains very weak showing that the surface is largely covered by the new CoO phase.
Upon annealing to 700 K the situation changes dramatically. At low CO coverage two peaks appear at 2133 cm−1 and at 2166 cm−1. These two bands indicate the formation of Co3O4(111) facets, in excellent agreement with the STM studies in Section 3.1. The different intensities of the two features may be associated with the somewhat modified defect structure of the surface. We conclude that above 520 K diffusion of Co ions into the bulk is activated leading to a decay of the 2D-CoO islands at the surface. Thus the original surface structure of the Co3O4 film is largely restored.
Noteworthy is the weak shoulder at 2055 cm−1 in Fig. 2a and b which can be assigned to metallic Co aggregates. The metallic aggregates are prone to sintering and changes are already observed at 520 K. They develop into two even weaker features at 2027 cm−1 and 2080 cm−1. The position of these bands is similar to those found for multilayer Co films on Cu(100), where features at 2020 and 2060 cm−1 are observed.56 The lower frequency feature was assigned to on-top CO at facet sites and the high frequency band to a compressed phase. We conclude that a small fraction of cobalt was not dispersed on the surface, formed metallic nanoparticles and sintered. These metallic aggregates are scarce, however, and could not be identified in STM at low Co coverage.
For the case of large cobalt coverage (5 Å Co, Fig. 3b–d), the features associated with oxidic cobalt above 2100 cm−1 increase upon annealing at the expense of the peaks below 2100 cm−1 associated with metallic cobalt. This behavior indicates sintering of metallic Co particles upon heating (as suggested by STM, see Section 3.1). Regarding the assignment of the metallic Co features we have to take into account that CO desorbs only partially at 300 K. Being a differential spectroscopy (sample vs. background spectrum), IRAS shows only the spectral changes due to the part of the CO which desorbs upon annealing and readsorbs upon CO-exposure. At higher temperature, CO desorbs molecularly from well-ordered Co facets.51,53,57–61 At defect sites, however, there may also be a fraction of CO which dissociates upon annealing.
Similar as discussed for the deposition of 1 Å Co, we attribute the feature at around 2020 cm−1 to CO bound to facets of the metallic Co nanoparticles. The most interesting feature is the band between 2070 and 2078 cm−1. As discussed above, this feature was originally assigned to a carbonyl species Co(CO)n (n = 3, 4).53 The blue shift of this species with increasing annealing temperature suggests, however, that the frequency of the band depends on the nanoparticle size, which increases with annealing temperature due to sintering. The blue shift results from dipole coupling and, thereby, points to a close proximity between the CO adsorption sites on the cobalt nanoparticles. Also, the coverage dependence of the band suggests that there is strong dipole coupling. Indeed, we observe a relatively large coverage dependent blue shift that increases with increasing particle size from Δ = 20 cm−1 (2052–2072 cm−1) after annealing to 300 K to Δ = 36 cm−1 (2042–2078 cm−1) after annealing to 700 K. On the basis of this observation, we conclude that this CO band is associated with a multiply coordinated nanoparticle site and not with a molecular carbonyl. Such sites are, for example, the edges of the nanoparticles. With increasing particle size the length of the particle edges increases giving rise to increased dipole coupling and, thereby, to an increasing blue-shift.
Finally, we note that after annealing to 700 K the two bands at 2137 and 2166 cm−1 which are associated with Co3O4 dominate the spectrum at low CO coverage. This is consistent with the observation by LEED and STM, suggesting that the largest part of the surface consists of ordered Co3O4(111) facets. Surface Co is lost in part by sintering but to the largest extent by diffusion into the Co3O4 lattice and formation of CoO grains. Our experiments on ordered CoO(111) films suggest that these facets adsorb CO too weakly to be probed under the present conditions. The appearance of a weak band around 2110 cm−1 (close to the vibrational frequencies for CO on dispersed Co2+ and on the 2D CoO phase) may be associated with a small fraction of disordered 2D-CoO areas left under these conditions.
4. Conclusions
In this work we prepared and characterized a model system for partially reduced cobalt oxide surfaces. We have investigated the growth, structure and adsorption properties of cobalt deposits on an ordered Co3O4(111) film on Ir(100). In combination with STM and LEED, we apply IRAS using CO as a probe molecule. A schematic summary of the behavior of the Co deposits and the associated CO vibrational frequencies is displayed in Fig. 5. In conclusion we find that: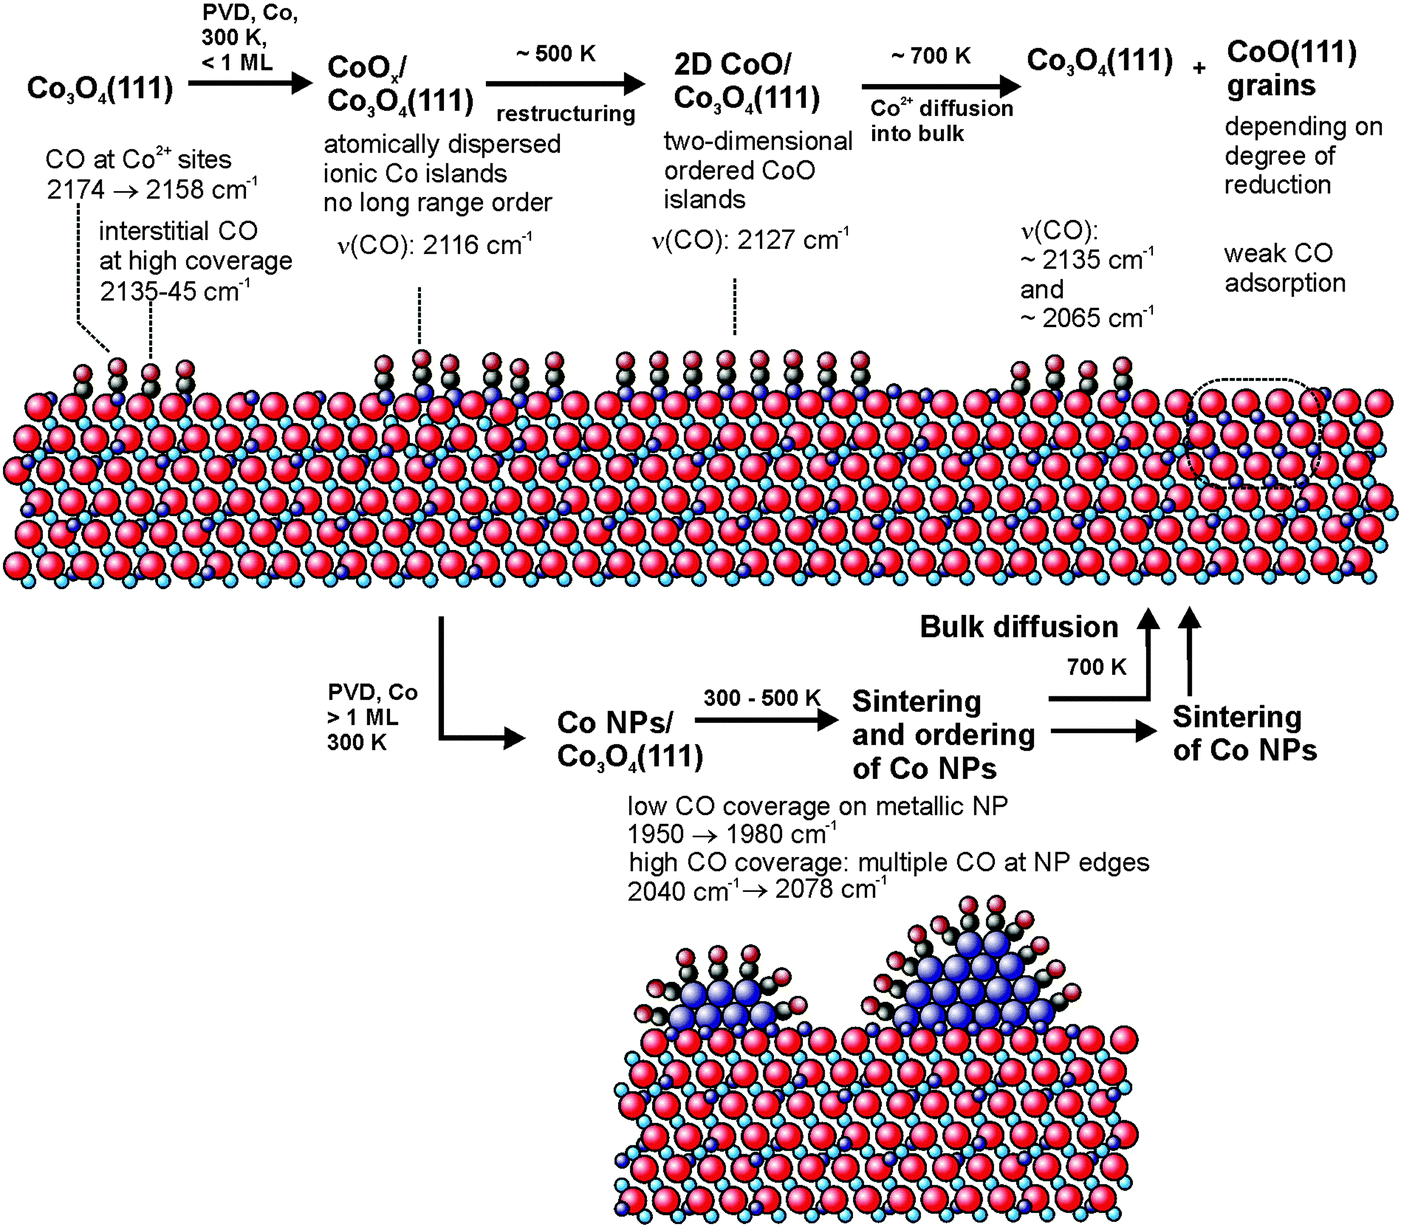 | ||
| Fig. 5 Schematic representation of the CO vibrational frequencies observed for adsorption on the different cobalt deposits on Co3O4(111)/Ir(100) investigated in this work. | ||
1. Deposition of a submonolayer of cobalt at 300 K leads to the formation of atomically dispersed cobalt ions which are incorporated into the surface layer of the Co3O4 film. Whereas the long-range-order of the film is lost, the morphology of the oxide film is preserved. Infrared spectroscopy of adsorbed CO on the cobalt-modified surface shows a single vibrational band near 2116 cm−1, indicating a homogeneous surface with a well-defined short-range structure.
2. Upon annealing to 500 K dispersed Co ions rearrange forming islands of an ordered two-dimensional CoO phase on Co3O4. The 2D CoO phase is characterized by adsorbed CO with a vibrational band near 2127 cm−1.
3. At 700 K Co diffuses into the bulk recovering ordered Co3O4(111) at the surface (vibrational bands around 2165 and 2135 cm−1).
4. Deposition of multilayers of metallic cobalt leads to formation of metallic cobalt clusters which cover the two-dimensional CoO phase. On the metallic Co particles CO adsorbs at bridge and at on-top sites on the particle facets. In addition, lower coordinated particle edge sites can be identified, which bind to more than one CO molecule. The CO vibrational bands from these sites show characteristic dependencies on both the CO coverage and the particle size.
5. The metallic cobalt particles restructure and sinter around 500 K and diffuse into the Co3O4 film upon annealing at 700 K. As a result the ordered Co3O4(111) surface is largely restored. Co diffuses into the oxide lattice and leads to the formation of CoO(111) grains at a sufficiently large degree of reduction.
Acknowledgements
The authors gratefully acknowledge financial support by the Deutsche Forschungsgemeinschaft (DFG) within the DACH Project “COMCAT” and the DFG Research Unit 1878 “funCOS”. Additional support within the Excellence Cluster “Engineering of Advanced Materials” in the framework of the Excellence Initiative and the Clariant AG is acknowledged. Further financial support by the European Commission (“chipCAT”, FP7-NMP-2012-SMALL-6, Grant Agreement no. 310191), travel support by the DAAD by COST Action CM1104 “Reducible oxide chemistry, structure and functions” is gratefully acknowledged.References
- X. Xie, Y. Li, Z.-Q. Liu, M. Haruta and W. Shen, Nature, 2009, 458, 746–749 CrossRef CAS PubMed.
- T. V. Choudhary, S. Banerjee and V. R. Choudhary, Appl. Catal., A, 2002, 234, 1–23 CrossRef CAS.
- J. Jansson, A. E. C. Palmqvist, E. Fridell, M. Skoglundh, L. Osterlund, P. Thormahlen and V. Langer, J. Catal., 2002, 211, 387–397 CrossRef CAS.
- L. F. Liotta, H. Wu, G. Pantaleo and A. M. Venezia, Catal. Sci. Technol., 2013, 3, 3085–3102 CAS.
- S. Xiong, C. Yuan, M. Zhang, B. Xi and Y. Qian, Chem. – Eur. J., 2009, 15, 5320–5326 CrossRef CAS PubMed.
- Z. Zhao, X. Lin, R. Jin, Y. Dai and G. Wang, Catal. Commun., 2011, 12, 1448–1451 CrossRef CAS PubMed.
- S. Tuti and F. Pepe, Catal. Lett., 2008, 122, 196–203 CrossRef CAS.
- C.-B. Wang, C.-C. Lee, J.-L. Bi, J.-Y. Siang, J.-Y. Liu and C.-T. Yeh, Catal. Today, 2009, 146, 76–81 CrossRef CAS PubMed.
- H. Dau, C. Limberg, T. Reier, M. Risch, S. Roggan and P. Strasser, ChemCatChem, 2010, 2, 724–761 CrossRef CAS PubMed.
- Y. Liang, Y. Li, H. Wang, J. Zhou, J. Wang, T. Regier and H. Dai, Nat. Mater., 2011, 10, 780–786 CrossRef CAS PubMed.
- C. Xu, Z. Tian, P. Shen and S. P. Jiang, Electrochim. Acta, 2008, 53, 2610–2618 CrossRef CAS PubMed.
- Y. Y. Yao, J. Catal., 1974, 33, 108–122 CrossRef CAS.
- J. Jansson, J. Catal., 2000, 194, 55–60 CrossRef CAS.
- P. Thormahlen, M. Skoglundh, E. Fridell and B. Andersson, J. Catal., 1999, 188, 300–310 CrossRef CAS.
- S. Royer and D. Duprez, ChemCatChem, 2011, 3, 24–65 CrossRef CAS PubMed.
- Y. Yu, T. Takei, H. Ohashi, H. He, X. Zhang and M. Haruta, J. Catal., 2009, 267, 121–128 CrossRef CAS PubMed.
- C.-W. Tang, L.-C. Hsu, S.-W. Yu, C.-B. Wang and S.-H. Chien, Vib. Spectrosc., 2013, 65, 110–115 CrossRef CAS PubMed.
- L. Hu, K. Sun, Q. Peng, B. Xu and Y. Li, Nano Res., 2010, 3, 363–368 CrossRef CAS.
- M. J. Pollard, B. A. Weinstock, T. E. Bitterwolf, P. R. Griffiths, A. P. Newbery and J. B. Paine, III, J. Catal., 2008, 254, 218–225 CrossRef CAS PubMed.
- C. Ma, D. Wang, W. Xue, B. Dou, H. Wang and Z. Hao, Environ. Sci. Technol., 2011, 45, 3628–3634 CrossRef CAS PubMed.
- C. Y. Ma, Z. Mu, J. J. Li, Y. G. Jin, J. Cheng, G. Q. Lu, Z. P. Hao and S. Z. Qiao, J. Am. Chem. Soc., 2010, 132, 2608–2613 CrossRef CAS PubMed.
- D. A. H. Cunningham, T. Kobayashi, N. Kamijo and M. Haruta, Catal. Lett., 1994, 25, 257–264 CrossRef CAS.
- J.-Y. Luo, M. Meng, X. Li, X.-G. Li, Y.-Q. Zha, T.-D. Hu, Y.-N. Xie and J. Zhang, J. Catal., 2008, 254, 310–324 CrossRef CAS PubMed.
- E. Finocchio, G. Busca, V. Lerenzelli and V. S. Escribano, J. Chem. Soc., Faraday Trans., 1996, 92, 1587–1593 RSC.
- E. Finocchio, R. J. Willey, G. Busca and V. Lorenzelli, J. Chem. Soc., Faraday Trans., 1997, 93, 175–180 RSC.
- G. Busca, M. Daturi, E. Finocchio, V. Lorenzelli, G. Ramis and R. J. Willey, Catal. Today, 1997, 33, 239–249 CrossRef CAS.
- Y. Liang, H. Wang, P. Diao, W. Chang, G. Hong, Y. Li, M. Gong, L. Xie, J. Zhou, J. Wang, T. Z. Regier, F. Wei and H. Dai, J. Am. Chem. Soc., 2012, 134, 15849–15857 CrossRef CAS PubMed.
- J. C. Vargas, S. Libs, A. C. Roger and A. Kiennemann, Catal. Today, 2005, 107–108, 417–425 CrossRef CAS PubMed.
- A. R. Passos, L. Martins, S. H. Pulcinelli, C. V. Santilli and V. Briois, Catal. Today, 2014, 229, 88–94 CrossRef CAS PubMed.
- E. Iglesia, Appl. Catal., A, 1997, 161, 59–78 CrossRef CAS.
- J. P. den Breejen, P. B. Radstake, G. L. Bezemer, J. H. Bitter, V. Froseth, A. Holmen and K. P. de Jong, J. Am. Chem. Soc., 2009, 131, 7197–7203 CrossRef CAS PubMed.
- D.-e. Jiang and S. Dai, Phys. Chem. Chem. Phys., 2011, 13, 978–984 RSC.
- L. Hu, Q. Peng and Y. Li, J. Am. Chem. Soc., 2008, 130, 16136 CrossRef CAS PubMed.
- Z. Fei, S. He, L. Li, W. Ji and C.-T. Au, Chem. Commun., 2012, 48, 853–855 RSC.
- H. Kuhlenbeck, S. Shaikhutdinov and H.-J. Freund, Chem. Rev., 2013, 113, 3986–4034 CrossRef CAS PubMed.
- J. Libuda, ChemPhysChem, 2004, 5, 625–631 CrossRef CAS PubMed.
- J. Libuda and H. J. Freund, Surf. Sci. Rep., 2005, 57, 157–298 CrossRef CAS PubMed.
- K. Heinz and L. Hammer, J. Phys.: Condens. Matter, 2013, 25, 173001 CrossRef CAS PubMed.
- C. Troeppner, T. Schmitt, M. Reuschl, L. Hammer, M. A. Schneider, F. Mittendorfer, J. Redinger, R. Podloucky and M. Weinert, Phys. Rev. B: Condens. Matter Mater. Phys., 2012, 86, 235407 CrossRef.
- M. Gubo, L. Hammer and K. Heinz, Phys. Rev. B: Condens. Matter Mater. Phys., 2012, 85, 113402 CrossRef.
- M. Gubo, C. Ebensperger, W. Meyer, L. Hammer, K. Heinz, F. Mittendorfer and J. Redinger, Phys. Rev. Lett., 2012, 108, 066101 CrossRef.
- M. Gubo, C. Ebensperger, W. Meyer, L. Hammer and K. Heinz, Phys. Rev. B: Condens. Matter Mater. Phys., 2011, 83, 075435 CrossRef.
- C. Ebensperger, M. Gubo, W. Meyer, L. Hammer and K. Heinz, Phys. Rev. B: Condens. Matter Mater. Phys., 2010, 81, 235405 CrossRef.
- W. Meyer, K. Biedermann, M. Gubo, L. Hammer and K. Heinz, Phys. Rev. B: Condens. Matter Mater. Phys., 2009, 79, 121403 CrossRef.
- M. Gubo, C. Ebensperger, W. Meyer, L. Hammer and K. Heinz, J. Phys.: Condens. Matter, 2009, 21, 474211 CrossRef CAS PubMed.
- K. Biedermann, M. Gubo, L. Hammer and K. Heinz, J. Phys.: Condens. Matter, 2009, 21, 185003 CrossRef CAS PubMed.
- W. Meyer, D. Hock, K. Biedermann, M. Gubo, S. Mueller, L. Hammer and K. Heinz, Phys. Rev. Lett., 2008, 101, 016103 CrossRef CAS.
- W. Meyer, K. Biedermann, M. Gubo, L. Hammer and K. Heinz, J. Phys.: Condens. Matter, 2008, 20, 265011 CrossRef CAS PubMed.
- P. Ferstl, S. Mehl, M. A. Arman, M. Schuler, L. Balasz, A. Toghan, Y. Lykhach, O. Brummel, E. Lundgren, J. Knudsen, L. Hammer, M. A. Schneider and J. Libuda, J. Phys. Chem. C, 2015, 119, 16688–16699 CAS.
- M. Baumer and H. J. Freund, Prog. Surf. Sci., 1999, 61, 127–198 CrossRef CAS.
- R. L. Toomes and D. A. King, Surf. Sci., 1996, 349, 1–18 CrossRef CAS.
- J. Gu, Y. Y. Yeo, W. S. Sim and D. A. King, J. Phys. Chem. B, 2000, 104, 4684–4689 CrossRef CAS.
- A. F. Carlsson, M. Baumer, T. Risse and H. J. Freund, J. Chem. Phys., 2003, 119, 10885–10894 CrossRef CAS PubMed.
- T. Risse, A. Carlsson, M. Baumer, T. Kluner and H. J. Freund, Surf. Sci., 2003, 546, L829–L835 CrossRef CAS PubMed.
- T. Nowitzki, A. F. Carlsson, O. Martyanov, M. Naschitzki, V. Zielasek, T. Risse, M. Schmal, H. J. Freund and M. Baeumer, J. Phys. Chem. C, 2007, 111, 8566–8572 CAS.
- L. Tskipuri and R. A. Bartynski, Surf. Sci., 2009, 603, 802–806 CrossRef CAS PubMed.
- J. J. C. Geerlings, M. C. Zonnevylle and C. P. M. Degroot, Surf. Sci., 1991, 241, 302–314 CrossRef CAS.
- S. J. Jenkins and D. A. King, Surf. Sci., 2002, 504, 138–144 CrossRef CAS.
- X. Q. Gong, R. Raval and P. Hu, Surf. Sci., 2004, 562, 247–256 CrossRef CAS PubMed.
- E. A. Lewis, A. D. Jewell, G. Kyriakou and E. C. H. Sykes, Phys. Chem. Chem. Phys., 2012, 14, 7215–7224 RSC.
- K. Liao, V. Fiorin, D. S. D. Gunn, S. J. Jenkins and D. A. King, Phys. Chem. Chem. Phys., 2013, 15, 4059–4065 RSC.
| This journal is © the Owner Societies 2015 |