 Open Access Article
Creative Commons Attribution 3.0 Unported Licence
Surface chemistry of copper metal and copper oxide atomic layer deposition from copper(II) acetylacetonate: a combined first-principles and reactive molecular dynamics study†
Xiao
Hu
*a,
Jörg
Schuster
b,
Stefan E.
Schulz
ab and
Thomas
Gessner
ab
aTechnische Universität Chemnitz, Center for Microtechnologies, Reichenhainer Str. 70, Chemnitz, D-09126, Germany. E-mail: xiao.hu@zfm.tu-chemnitz.de
bFraunhofer Institute for Electronic Nano Systems, Technologie-Campus 3, Chemnitz, D-09126, Germany
First published on 14th September 2015
Abstract
Atomistic mechanisms for the atomic layer deposition using the Cu(acac)2 (acac = acetylacetonate) precursor are studied using first-principles calculations and reactive molecular dynamics simulations. The results show that Cu(acac)2 chemisorbs on the hollow site of the Cu(110) surface and decomposes easily into a Cu atom and the acac-ligands. A sequential dissociation and reduction of the Cu precursor [Cu(acac)2 → Cu(acac) → Cu] are observed. Further decomposition of the acac-ligand is unfavorable on the Cu surface. Thus additional adsorption of the precursors may be blocked by adsorbed ligands. Molecular hydrogen is found to be nonreactive towards Cu(acac)2 on Cu(110), whereas individual H atoms easily lead to bond breaking in the Cu precursor upon impact, and thus release the surface ligands into the gas-phase. On the other hand, water reacts with Cu(acac)2 on a Cu2O substrate through a ligand-exchange reaction, which produces gaseous H(acac) and surface OH species. Combustion reactions with the main by-products CO2 and H2O are observed during the reaction between Cu(acac)2 and ozone on the CuO surface. The reactivity of different co-reactants toward Cu(acac)2 follows the order H > O3 > H2O.
Introduction
Copper interconnects have been widely used to replace aluminum in ultralarge-scale integrated circuitry due to their low resistivity and superior resistance to electromigration.1 Of the various deposition techniques applied for Cu metallization, electrochemical deposition (ECD) is the preferred choice. However, the ECD process requires conductive seed layers. Moreover, diffusion barrier films are needed to deposit between the Cu seed layer and the patterned dielectrics in order to prevent the migration of Cu into the Si substrate and the dielectrics.2 So far, ionized physical vapor deposition (iPVD) using ionized sputtering techniques in combination with high re-sputter ratio regimes has been adopted as the desirable method for the barrier and Cu seed layer deposition.3 However, with the ongoing scaling down and aspect ratio increase of devices, iPVD tends to fail due to its inherent nonconformal deposition characteristic.One promising alternative for making uniform and conformal Cu thin films is atomic layer deposition (ALD). ALD is a gas-phase thin film deposition technique based on sequential, self-terminating reactions between the surface and precursors.4,5 The typical ALD process consists of four repetitive steps. The precursor (typically a metal compound) chemisorbs on reactive sites, saturates the surface and releases the reaction by-products. After that, unreacted precursor molecules as well as gaseous byproducts are purged from the reactor. The co-reactant (typically a non-metal compound) is then supplied to clean up the surface of contaminations and deposit the desired species (e.g. oxygen or hydroxyl groups). Finally, another purging phase is introduced to evacuate the excessive reactants and products. By repeating these steps, the film growth is self-limiting, which leads to excellent step coverage and conformal deposition on high aspect ratio structures.
Precursor chemistry plays a key role in ALD. The candidate metal precursors must be volatile, thermally stable, and reactive. Moreover, a low-temperature process (ideally at ≤160 °C) is desirable for Cu ALD in order to avoid the agglomeration of Cu at elevated temperatures.6 Recently, a number of Cu precursors have been tested for chemical vapor deposition and ALD applications, such as β-diketiminates,7,8 β-diketonates,9–11 amidinates,12,13 aminoalkoxides,14 guanidinate,15,16 iminopyrrolidinate.17,18 Among them, the Cu β-diketonate family is promising because of its high stability and relatively low vapor pressure. The direct Cu ALD process using Cu(acac)2 and H2 requires a deposition temperature of above 250 °C, and is thus undesirable.19 The deposition temperature can be reduced below 100 °C by utilizing the plasma enhanced ALD technology.20,21 However, such a process would lead to high roughness and reduced step coverage of ALD, which may not be applicable for high aspect ratio structures.22 On the other hand, several indirect ALD routes to Cu films have been reported. These approaches consist of two steps: (1) ALD of the Cu oxide or nitride, and (2) reduction into the metallic Cu with a reducing agent. Waechtler et al.10 investigated the ALD of Cu2O thin films on different diffusion barriers (e.g. Ta, TaN, and Ru) using (nBu3P)2Cu(acac) (Bu = butyl) and wet oxygen. The deposited Cu2O can be reduced easily to Cu metal using formic acid as the reducing agent assisted by a Ru catalyst.10 Knisley et al.23 proposed the low temperature deposition of high purity Cu metal through the reduction of ALD copper formate using hydrazine. Further theoretical studies revealed that a hydrazine undergoes cleavage to form NH2 moieties, which then abstracts H of the formate intermediate and spontaneously forms NH3 and CO2 by-products.24 More recently, Park et al.25 reported ALD of Cu3N followed by reduced annealing in H2. Such processes may avoid the oxidization of barrier metal below the Cu seed layer.
There have been a few experimental and theoretical studies on the surface chemistry of Cu(I) and Cu(II) β-diketonates. In general, the Cu(I) β-diketonates are more reactive compared to Cu(II) β-diketonates. However, the main limitation of Cu(I) β-diketonates is that these precursors may easily undergo a disproportionation reaction, which defeats the self-limiting nature of ALD processes.9 Previous in situ X-ray photoelectron spectroscopy (XPS) results suggest that the disproportionation of the (nBu3P)2Cu(acac) precursor, which deposits metallic Cu and releases gaseous Cu(acac)2, starts above 200 °C on SiO2 or above 125 °C on the Co substrate.26,27 Hence, the upper temperature limit for copper ALD using this precursor lies below these temperatures. Another important issue regarding Cu β-diketonates is the redox chemistry during the ALD. In many cases, especially when metal ALD is desired, the metal center in a precursor is required to undergo an oxidation or reduction step. It is generally assumed that such a step is accomplished during the second ALD half-cycle, which is associated with the promotion of a co-reactant.28 Recent surface-science studies, however, illuminated that oxidation state changes in the metal can occur upon precursor activated adsorption on the substrate, involving the partial loss and transformation of ligands. For example, the initial loss of acac-ligands of the Cu(acac)2 precursor was observed at 200 and 235 K for Ni(110) and Cu(110) single-crystal surfaces, respectively.29 The formation of a metal–Cu(acac) complex was proposed. An obvious oxidation state change of Cu has been seen between 250 and 300 K. The adsorbed Cu(acac) species lose their remaining acac-ligands and Cu2+ is completely reduced to metallic Cu.29
In this work, the surface chemistry of Cu(acac)2 on the Cu(110) surface is revisited theoretically. Recently, quantum chemistry (QC), in particular density functional theory (DFT) calculations, has become a powerful tool to explicit the ALD chemistry at an atomic scale.30–49 Dey et al.31 investigated the transmetalation reactions in Cu ALD using diethylzinc as the reducing agent, following experiments by Lee et al.8 Lin et al.32 have investigated the competition between ligand-exchange reactions and surface decomposition of Cu(acac)2 on a Si(100)-2 × 1 surface. More recently, we have studied the surface reactions of (nBu3P)2Cu(acac) and Cu(acac)2 precursors on a Ta(110) surface.33 Ta is found to exhibit high activity towards the decomposition of Cu precursors, which is consistent with earlier results.9,34,35 Based on thermodynamic modeling, a combustion-like reaction during the O3 or wet O2 pulse, with CO2 and H2O as the main by-products, has been proposed.33
An alternative QC approach for investigating ALD chemistry involves ab initio molecular dynamics (AIMD), which have been carried out on the simulation of SiO243,44 and HfO245 ALD. As compared to the “static” ab initio calculations, AIMD offers a dynamic description of the time evolution of a chemical reaction. Unfortunately, due to the costs of treating the electronic degrees of freedom, the AIMD study is restricted to model systems consisting of a few hundred atoms and to very short time scales (tens of ps). We thus perform molecular dynamics simulation of Cu ALD using reactive force field (ReaxFF).50 ReaxFF was developed to bridge the gap between QC and empirical force field, which enables the simulation of comparatively large systems for long time scales (e.g. tens of thousands of atoms for the ns scale).50 Unlike other traditional non-reactive force fields, ReaxFF offers an accurate description of the bond forming or breaking process.50
Previously, the surface reaction of similar metal β-diketonate of Ir(acac)3 was studied in situ using a quadrupole mass spectrometer and a quartz crystal microbalance.51 In that work, CO2 and H2O were confirmed as the main reaction by-products during IrO2 ALD.51 However, the elementary-step ALD reaction mechanisms are still unclear, since some fast reactions that involve unstable intermediates are difficult to be observed experimentally. Alternatively, reactive molecular dynamics (RMD) simulation provides a possibility to capture the reactions that occurred in ALD in a femtosecond timescale. In the present article, we focus on the surface chemistry of Cu(acac)2 by means of DFT calculations and RMD simulations. It is found that Cu(acac)2 is dissociated easily into a Cu atom and the acac-ligands on both metallic Cu and Cu oxide surfaces. The dissociated acac-ligands are thermodynamically stable on the surface, and can be removed by co-reactants during the next ALD half-cycle. The mechanisms for the surface reactions between Cu(acac)2 and different co-reactants (i.e. H2, atomic H, H2O, and O3) are also discussed.
Methodology
The DFT calculations were performed using the Quantum Espresso (QE) package.52 For the modeling of the exchange and correlation interactions the Perdew–Burke–Ernzerhof (PBE) functional within the generalized gradient approximation (GGA)53 was used in conjunction with ultrasoft pseudopotentials54 and a plane-wave basis set. Kinetic energy cutoffs of 408 eV (for wave functions) and 4082 eV (for charge density) were used. The Brillouin zone was sampled using a 2 × 2 × 1 Monkhorst–Pack k-point mesh.55 To investigate the physisorption of the Cu precursor on the surface, we used a nonlocal van der Waals density functional (vdW-DF)56 as implemented in QE. The geometry was optimized until the total energy changes and all components of all forces are smaller than 1.26 × 10⁻⁴ eV and 2.57 × 10⁻² eV Å−1, respectively. With the optimized structures, the vibration properties of adsorbed species were calculated using the harmonic approximation based on density-functional perturbation theory.57 The minimum energy paths and saddle points were investigated by the climbing image nudged elastic band method (CI-NEB).58,59 The charge transfer trends were studied by means of Mulliken population analysis60 within the plane-wave CASTEP code,61 using similar calculation methods as in QE.The RMD simulations were carried out using ReaxFF potential as implemented in LAMMPS.62 ReaxFF is a general bond order-dependent potential that uses relationships the between interatomic distance and bond order as well as between the bond order and bond energy to describe bond dissociation.50 The system energy (Esystem) in ReaxFF is composed of a sum of energy terms:50
| Esystem = Ebond + Eunder + Eover + Eval + Epen + Etors + Econj + ECoulomb + EvdWaals |
The partial contributions include bond energies Ebond, atom under-/overcoordination energies Eunder and Eover, valence angle energies Eval, penalty energies Epen, torsion angle energies Etors, conjugation energies Econj, and non-bonded Coulomb (ECoulomb) and van der Waals (EvdWaals) interaction energies. All bonded energy terms include bond order dependence, which are determined by the local environment of each atom. The Coulomb term ECoulomb is taken into account for all atom pairs. A shielded Coulomb potential was used to adjust for orbital overlap between atoms that were close together. Atomic charges are computed using the geometry-dependent charge calculation scheme (EEM scheme) of Mortier et al.63 The calculation of long-range electrostatic interactions (e.g., via Ewald summation) is eliminated by the use of a seventh-order taper function within a cutoff distance. All other non-bonded interactions (short-range Pauli repulsion and long-range dispersion) are included in the EvdWaals term. A detailed description of the individual terms can be found in the original paper of van Duin et al.50
The ReaxFF parameters for the Cu(acac)2 system considered in the present study have been determined by ab initio calculations performed in previous investigations.64 The Cu/O/H parameters were integrated into the glycine force field65 by following the suggestions of Huang et al.66 These force fields use the same O/H parameters and potential functions, making such integration relatively straightforward.66 The Cu/C bond parameters were not optimized since such bonds were not expected to form, while the non-bonded interactions were obtained from standard combination rules. The RMD simulations are performed in the NVT canonical ensemble (constant number, volume and temperature). A Nose–Hoover thermostat with a damping constant of 100 fs was used for temperature control. The time step used in RMD simulations was 0.1 fs for the reaction between Cu(acac)2 and O3 and 0.25 fs for the other systems, respectively. Such small time steps are required to capture bond breaking and forming involved in chemical reactions, so that converged results for species evolution can be obtained. The initial system was firstly equilibrated using a low-temperature (at 1 K) MD. After the equilibrium, the system temperature was further increased from 1 K to 600 K within 20 ps at a uniform rate. Finally, reactive NVT-MD simulations were performed at 600 K for a total simulation time of up to 1 ns. We slightly increase the temperature to accelerate the chemical reaction.
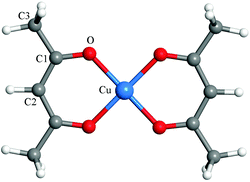
Fig. 1 shows the calculated atomic structure of the Cu(acac)2 precursor. The predicted and experimental bond lengths and bond angles are listed in Table 1. A good agreement is observed between theoretical and experimental results.67 The only exception is that ReaxFF predicts slightly larger C1–O bond length (0.16 Å) and Cu–O–C1 angle (4.8°) values. A more systematic comparison of the results from DFT and ReaxFF is shown in the next section. In DFT calculations, the Cu(110) surface was modeled using a p(4 × 4) supercell with periodic four-layer slab models. In the case of RMD simulations, larger surface models consisting of a four-layer slab for p(22 × 30)-Cu(110) (79.52 × 76.68 Å2), and a nine-layer slab for p(12 × 16)-Cu2O(111) (72.46 × 83.67 Å2) and for p(14 × 12)-CuO(111) (80.76 × 73.70 Å2) were employed, respectively. To simplify our models, only stoichiometric surfaces were considered for Cu2O(111) and CuO(111). During the simulations, the bottom two layers of Cu(110), and four layers of Cu2O(111) and CuO(111) were fixed, respectively. To investigate the surface reaction between Cu(acac)2 and different co-reactants, 24 Cu(acac)2 precursors were initially placed on the surface, corresponding to a coverage of ∼0.4 molecule nm−2. Above the adsorbed Cu(acac)2, 2000 H2O molecules or H atoms, or 1000 O3 molecules were distributed randomly, with a density of 0.08 g cm−3, 0.004 g cm−3, and 0.1 g cm−3, respectively. We used a relatively high density of co-reactants to ensure sufficient reactivity of the system and hence to obtain results within a reasonable calculation time.
| Exp. (ref. 67) | DFT | ReaxFF | |
|---|---|---|---|
| Cu–O | 1.91 | 1.95 | 1.98 |
| C1–O | 1.27 | 1.28 | 1.43 |
| C1–C2 | 1.39 | 1.40 | 1.40 |
| C1–C3 | 1.48 | 1.51 | 1.52 |
| ∠Cu–O–C1 | 125.9 | 126.0 | 127.9 |
| ∠O–C1–C3 | 114.4 | 115.3 | 119.2 |
| ∠O–C1–C2 | 124.4 | 125.4 | 126.8 |
| ∠O–Cu–O | 93.2 | 92.5 | 89.7 |
Results and discussion
Adsorption and dissociation of Cu(acac)2 on the surface
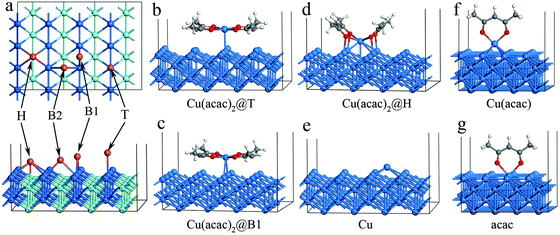
In the first part of our study on copper precursors we analyze the surface adsorption and succeeding dissociation of the precursors on various surfaces. The adsorption of Cu(acac)2 on Cu is studied in detail before we compare these findings to those on other surfaces. On the Cu(110) surface we consider four different adsorption sites: top (T), hollow (H), bridge1 (B1) and bridge2 (B2) (see Fig. 2a). For each position, different adsorption orientations of species were examined. The calculated adsorption energies and structures of Cu(acac)2 and its dissociation products are presented in Table 2 and Fig. 2. As depicted in Fig. 2b–d, three stable configurations have been obtained for the adsorption of Cu(acac)2. On the top and bridge1 sites, Cu(acac)2 prefers to adsorb on Cu(110) with a parallel orientation (Fig. 2b and c). Geometric parameters of the adsorbed Cu(acac)2 are barely changed relative to a gaseous molecule (not shown here). The adsorption energies computed by using the PBE functional are −0.48 eV for top and −0.33 eV for bridge2, respectively (Table 2). It is well known that the pure GGA-PBE does not capture van der Waals forces (dispersion forces), leading to an underestimated binding energy.56 Indeed, the vdW-DF functional predicts much higher adsorption energies (−1.42 eV and −1.34 eV), indicating that the vdW forces are the dominant interactions. One the other hand, Cu(acac)2 is found to strongly chemisorb on the hollow site with a binding energy of −1.51 eV for PBE (Table 2). The energy calculated using vdW-DF is 0.65 eV larger than that using PBE, because of the contribution of vdW forces between the acac-ligands and the surface. The Cu(acac)2 molecule is significantly distorted from planarity to enhance adsorption (Fig. 2d). Four Cu–O bonds are formed between the surface Cu atoms and O of Cu(acac)2, with a bond length of 2.07 Å. However, bond length of the original Cu–O bond of Cu(acac)2 is increased from 1.95 Å (in the gas-phase) to 2.21 Å (on the surface), which weakens the Cu–O bond strength. In contrast to Cu(acac)2 both Cu(acac) and acac prefer to adsorb with the molecular axis being perpendicular to the Cu surface normal (Fig. 2f and g). The most stable adsorption sites are the hollow (Eads = −2.16 eV for PBE) and top (Eads = −2.68 eV for PBE) sites, respectively (Table 2). The Cu atom prefers to adsorb on the hollow site, with a binding energy of −3.08 eV for the PBE functional. The vdW forces have no significant influence on the adsorption energy of Cu(acac), acac, and Cu species, suggesting that chemisorption is the dominant interaction.| Cu(acac)2 | Cu(acac) | acac | Cu | ||||
|---|---|---|---|---|---|---|---|
| Adsorption site | Top | Bridge1 | Hollow | Hollow | Top | Hollow | |
| a E ads denotes the adsorption energy. d(Cup–Cus) is the distance between the Cu atom of the precursor and nearest surface Cu atom. d(Cup–O) stands for the distance between the Cu and O atoms of the precursor. d(Cus–O) represents the distance between the O atom of the precursor or the acac-ligand and the nearest surface Cu atom. Only the most stable adsorption structures for the Cu(acac), acac, and Cu species are presented. | |||||||
| E ads (eV) | PBE | −0.48 | −0.33 | −1.51 | −2.16 | −2.68 | −3.08 |
| vdW-DF | −1.42 | −1.34 | −2.16 | −2.08 | −2.89 | −2.81 | |
| ReaxFF | −1.24 | −1.33 | −2.11 | −2.11 | −2.44 | −3.33 | |
| d(Cup–Cus) (Å) | PBE | 2.65 | 2.76 | 2.63 | 2.62 | — | 2.53 |
| vdW-DF | 2.70 | 2.90 | 2.68 | 2.63 | — | 2.59 | |
| ReaxFF | 2.47 | 2.62 | 2.63 | 2.61 | — | 2.61 | |
| d(Cup–O) (Å) | PBE | 2.04 | 2.02 | 2.21 | 2.00 | — | — |
| vdW-DF | 2.07 | 2.04 | 2.24 | 2.03 | — | — | |
| ReaxFF | 2.01 | 2.02 | 2.88 | 1.97 | — | — | |
| d(Cus–O) (Å) | PBE | 3.45 | 2.99 | 2.07 | 3.28 | 2.01 | — |
| vdW-DF | 3.52 | 3.13 | 2.14 | 3.33 | 2.08 | — | |
| ReaxFF | 3.16 | 2.72 | 1.95 | 3.22 | 1.99 | — | |
In order to demonstrate the validity of our model calculations we have also performed vibrational frequency calculations and compared it with experimental findings.68 The perpendicular adsorption geometries of Cu(acac) and acac have been confirmed by vibrational spectroscopy studies. As shown in Table 3, the key vibrational frequencies of adsorbed Cu(acac) and acac match well with that of gaseous Cu(acac)2, indicating that the surface acac-ligand maintains the same geometric configuration as the gaseous Cu(acac)2.68,69 In contrast, frequency of the CO stretch of adsorbed Cu(acac)2 is shifted from 1556 cm−1 to 1507 cm−1 relative to gaseous Cu(acac)2. This is consistent with a parallel adsorption geometry causing a distorted molecular structure on the surface.
| Cu(acac)2/Cu(110) | Cu(acac)/Cu(110) | acac/Cu(110) | Cu(acac)2 | acac/Cu(001) | Cu(acac)2 | Assignments |
|---|---|---|---|---|---|---|
| This work | Ref. 68 | Ref. 69 | ||||
| Only the key vibrational frequencies are shown. The frequencies of acac/Cu(001) are very similar to that of acac/Cu(110), indicating that the orientation of the Cu surface has a minor effect on the normal modes of the acac-ligand. | ||||||
| 3060 | 3059 | 3077 | 3090 | 3092 | 3077 | Methyne CH stretch |
| 1507 | 1556 | 1543 | 1556 | 1563 | 1554 | CO stretch |
| 1442 | 1450 | 1439 | 1434 | 1430 | 1415 | CH3 deg. def. |
| 1367 | 1378 | 1374 | 1355 | 1356 | CH3 sym. def. | |
| 1238 | 1238 | 1247 | 1249 | 1274 | CC + CCH3 stretch | |
| 1160 | 1199 | 1201 | 1172 | 1190 | CH bending | |
| 1043 | 1035 | 1046 | 1023 | 1024 | 1020 | CH3 rock |
Table 2 also shows the comparison of adsorption energies and bond lengths between ReaxFF and as obtained from DFT. Since no benchmark data are currently available for the Cu(acac)2/Cu(110) system, we thus use the vdW-DF results as a reference to evaluate the accuracy of ReaxFF. Recent DFT calculations for a Cu(dmap)2/Cu(111) (dmap = dimethylamino-2-propoxide) system have found that the vdW interactions not only increase the adsorption energies but also change the nature of the adsorption fundamentally.46 It can be seen from Table 2 that most of the ReaxFF results match well with the DFT results. The average energetic discrepancies with respect to the vdW-DF are ±0.22 eV (8.9%) and ±0.18 Å (6.9%), respectively. The only exception is that ReaxFF fails to predict the structure for Cu(acac)2 adsorption on the hollow site. A large distance between Cu and O atoms (2.88 Å) is associated with the dissociative adsorption of Cu(acac)2 on the surface.
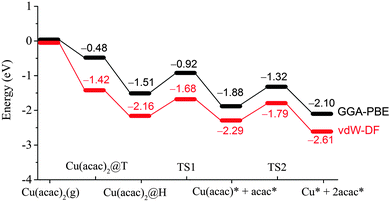
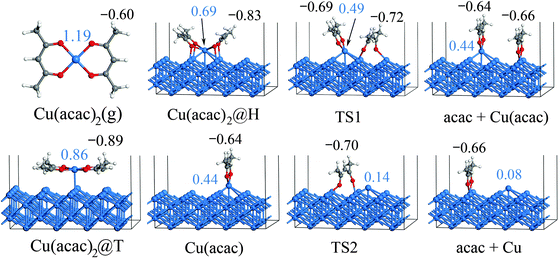
After the preferred adsorption geometries for different species were determined, the minimum energy pathway for Cu(acac)2 dissociation on the Cu surface was mapped out using the CI-NEB method, which is depicted in Fig. 3 and 4. The clean Cu(110) surface with a gaseous precursor is selected as the reference state, while Cu with co-adsorbed acac-ligands on the surface is set as the final state. In general, the decomposition of Cu(acac)2 on Cu(110) is an exothermic process. The calculated reaction energies for the whole process are −2.10 eV with PBE and −2.61 eV with vdW-DF, respectively. Cu(acac)2 can easily diffuse from the top or bridge1 site to the nearby lowest energy hollow site, with no appreciable energy barrier (<0.1 eV). The dissociation of one acac-ligand from adsorbed Cu(acac)2 requires to overcome energy barriers of 0.59 eV for PBE and 0.48 eV for vdW-DF, respectively. At the transition state, the acac-ligand is located above a hollow site, with two oxygen atoms bound to the adjacent surface Cu atoms (Fig. 4). Reaction barrier for the decomposition of Cu(acac) into Cu + acac is similar to that of Cu(acac)2, with 0.56 eV for PBE and 0.50 eV for vdW-DF, respectively. Again, the acac-ligand at the transition state is positioned above the hollow site. The population analysis shown in Fig. 4 suggests that adsorption of Cu(acac)2 and its further dissociation into Cu(acac) and Cu would lead to sequential reduction of the Cu center (1.19e → 0.86e → 0.69e → 0.44e → 0.08e). A zero-valence metallic Cu atom is formed finally. On the other hand, the acac-ligand of Cu(acac)2 is firstly reduced upon adsorption (−0.60e → −0.83e) and is then oxidized upon dissociation (−0.83e → −0.66e). Charge of the acac-ligand in the final state (−0.66e) is similar to that in the reference state (−0.60e), suggesting that the metallic substrate is responsible for the reduction of the Cu center of Cu(acac)2. In short, our DFT calculations reveal a sequential dissociation and reduction [Cu(acac)2 → Cu(acac) → Cu] of the Cu precursor on the Cu(110) surface, which is in accordance with previous XPS investigations.29
In principle, the ligands are used to volatilize the metal atoms. Thus the ligands are expected to remain intact upon adsorption and will be removed by the co-reactant (e.g. hydrogen or oxygen) during the subsequent ALD half cycle.28Table 4 lists the DFT-PBE calculated reaction energies for the further decomposition of the acac-ligand. The large positive energies reveal that the further decomposition of the acac-ligand on a Cu(110) surface is unfavorable. Thus, the stable acac-ligand may block surface sites and prevents the adsorption of further Cu precursor molecules, and therefore the deposition is self-limited.
| Reaction | Energy (eV) |
|---|---|
| acac* → CH3CO* + CH3COCH* | 1.69 |
| acac* → CH3* + CH3COCHCO* | 2.14 |
| acac* → 2CH3CO* + CH* | 3.03 |
| acac* → CH3* + CO* + CH3COCH* | 2.01 |
| acac* → 2CH3* + 2CO* + CH* | 3.66 |
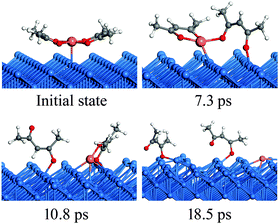
The RMD simulation snapshots of the Cu(acac)2 decomposition on the Cu(110) surface at 600 K are shown in Fig. 5. In general, the reaction pathways observed in RMD simulations are consistent with those from the DFT calculations. The reaction starts by breaking of the Cu–O bond and the tilt of the acac-ligand (7.3 ps). Next, the acac-ligand dissociates completely from the Cu(acac)2 molecule, forming acac and Cu(acac) species on the surface (10.8 ps). Finally, Cu(acac) dissociates into Cu and acac species on the surface after 18.5 ps. Experimentally, the complete decomposition of Cu(acac)2 to metallic Cu on the surface is reported to occur at around 300 K.29 Such a low reaction temperature suggests a high reactivity of the Cu surface towards Cu(acac)2, which is consistent with the small activation energy calculated by DFT. In addition, a facile reaction process is also compatible with the time scale of the RMD simulations.
Fig. 6 shows the comparison for Cu(acac)2 dissociation into Cu(acac) and acac on Cu(110), Cu2O(111), and CuO(111) surfaces. Initially, 24 Cu(acac)2 precursors were placed above the surface. The pathways of Cu(acac)2 dissociation on various substrates are similar, and are thus not shown here. As illustrated in Fig. 6, the Cu(acac)2 molecules are completely decomposed after ∼70 ps at 600 K. The reaction on copper-rich surfaces [Cu(110) and Cu2O(111)] is faster as compared with that on CuO(111), indicating that surface Cu atoms are the reactive species towards the acac-ligand.
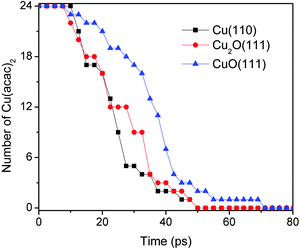 | ||
| Fig. 6 Comparison of the dissociation of Cu(acac)2 into Cu(acac) and acac on Cu(110), Cu2O(111), and CuO(111) surfaces at 600 K. | ||
Surface reaction between Cu(acac)2 and different co-reactants
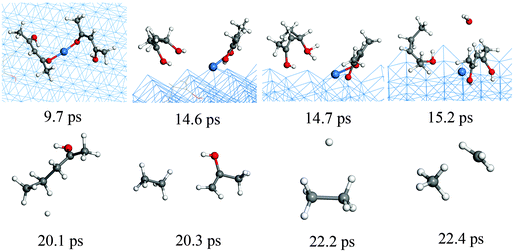
In order to complement the picture of the surface reactions of Cu(acac)2 on various surfaces we analyze the role of different co-reactants which are typically used throughout ALD-processes. First, the reaction with molecular hydrogen is studied. Our RMD investigations reveal that molecular H2 hardly reacts with Cu(acac)2 on the surface at 600 K. Instead, the molecules are found to assemble around the precursor, having weak attractive but nonbonded interactions with the structure. Therefore, we do not consider H2 molecules in our further studies. Indeed, molecular H2 is rarely employed as a co-reactant for Cu β-diketonates.21 Alternatively, a plasma-enhanced ALD process20,21 or a strong reducing agent8,23 is required to deposit the Cu thin films directly.We now discuss the surface reaction between Cu(acac)2 and atomic H on Cu(110), as a model system for plasma enhanced Cu ALD. The corresponding typical RMD snapshots are shown in Fig. 7. The influence of other plasma-generated components (e.g., charged particles, electric fields, and heat)22 is not considered in our simulation. In contrast to the molecular species, atomic hydrogen is found to be very reactive towards the Cu precursor. Cu(acac)2 breaks the Cu–O bonds upon hydrogen impact, and a H2(acac) molecule is formed and released to the gas-phase (14.6 ps). Next, an oxygen atom in H2(acac) is abstracted by the hydrogen and a water molecule is released (15.2 ps). The remaining fragment is dissociated further into ethane and acetone (20.3 ps). Finally, a methane molecule is produced (22.4 ps). The time evolution of the species in the gas-phase during the RMD simulations is shown in Fig. 8a. The formation of HxO species starts slightly earlier (∼10 ps) than that of CxHy species, indicating that the atomic hydrogen reacts first with the oxygen of the Cu precursor. The system achieves the equilibrium after about 150 ps, in which the atomic hydrogen is consumed completely by the formation of H2, CxHy and HxO species. Due to the re-adsorption of HxO species the amounts of surface H and O are slightly increased after ∼80 ps. The HxO species exist mainly as H2O on the surface since the observed H/O ratio is equal to ∼2 (Fig. 8b). In contrast to the H and O containing species most of the C atoms are released to the gas-phase.
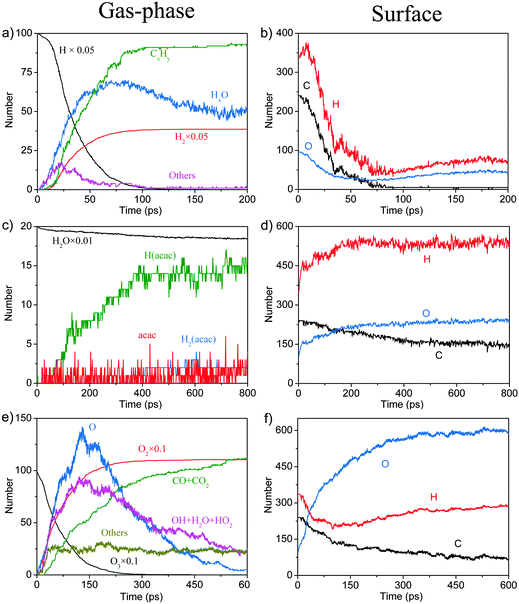 | ||
| Fig. 8 Product evolution for the surface reactions between Cu(acac)2 and atomic H (a and b), water (c and d), and ozone (e and f), respectively. | ||
In the next part of this section we analyze the surface reactions between Cu(acac)2 and H2O, as shown in Fig. 9. We use Cu2O(111) as the substrate since Cu β-diketonates with H2O primarily deposit cuprous oxide films at low temperatures.9,70,71 Previous reports72,73 have shown that water facilitates the deposition of Cu2O through the following ligand-exchange reaction
| Cu(acac) + H2O → CuOH + H(acac) |
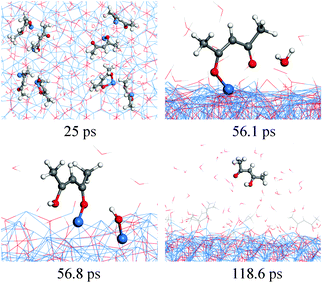
Our RMD simulations predict the following reaction scheme which is consistent with previous findings. Firstly, Cu(acac)2 dissociates into Cu(acac) and acac on the surface after ∼25 ps of simulation. Secondly, a proton is transferred from water to the adsorbed Cu(acac), forming Cu[H(acac)] and OH species on the surface (56.8 ps). Finally, the Cu–O bond of the Cu[H(acac)] intermediate is then broken after 118.6 ps, which leads to the desorption of acetylacetone from the surface to the gas-phase. A similar ligand-exchange mechanism has been widely observed in water-based metal oxide ALD, for example, in the TMA–H2O (TMA = trimethylaluminum) or Hf(NMe2)4–H2O (Me = CH3) process.5,45 During the water pulse, the adsorbed Me- or NMe2-ligands are replaced by –OH groups, followed by the elimination of gaseous CH4 or HNMe2.5,45 It is noticed that cleavage of the Cu–O bond of Cu(acac)2 in the presence of atomic H is promoted upon H impact, whereas with water the proton transition takes place after Cu(acac)2 is completely dissociated on the surface. These observations suggest that water is much less reactive compared to the atomic H. As shown in Fig. 8c, it can be found that H(acac) is the main gaseous product during this reaction, while the amounts of acac and H2(acac) are minor. The surface reaction between H2O and the acac-ligand reaches stationary equilibrium after about 400 ps, in which about 35–40% of the acac-ligands are released to the gas-phase.
Typical RMD snapshots for the surface reactions between Cu(acac)2 and O3 are shown in Fig. 10 and 11. The CuO(111) surface is used in these simulations, which is in line with the experimental observation that CuO is deposited by a Cu(acac)2–O3 ALD process.11 As depicted in Fig. 10, the ozone molecule is found to bind readily with the methyl group through a hydrogen bond, forming an O–H bond with a length of ∼1.9 Å (Fig. 10a). One H atom of the acac-ligand is then abstracted by the ozone, as a result of the OH and O2 formation (16.8 ps). The released OH radical either re-adsorbs on the surface or reacts with methyl hydrogen to produce H2O (99.4 ps). Moreover, we observed that the O atom can insert into the C–H bond of the –CH3 group, which involves the formation of O2 and –CH2OH species (94.3 ps). A similar insertion step has been reported to occur in the TMA–O3 ALD process, proven by infrared spectroscopy and DFT calculations.47,74,75 In comparison to the hydrogen abstraction, the C–C cleavage usually takes place later. As shown in Fig. 11a–c, an oxygen atom firstly adsorbs above the bridging C–C site to form an epoxide (92.2 ps). The C–C bond is then cleaved by the O atom through an epoxy-ether transformation (93.2 ps). At the same time, the acac-ligand breaks the bond with the surface Cu and is thus released to the gas-phase. Subsequently, the formed complex dissociates into the gaseous methylglyoxal, ethenone, and an adsorbed hydroxyl group (93.8 ps). At last, the methylglyoxal and ethenone species are further oxidized into CO, CO2 and OH after about 80 ps of simulation (not shown here). Fig. 11d–h illustrate the alternative reaction pathways for C–C cleavage. Upon continuous adsorption of two O atoms, the acac-ligand dissociates into gaseous methylglyoxal and adsorbed acetate. The formed acetate is readily desorbed from the surface and dissociates into CO2 and CH3. From the time evolution of species shown in Fig. 8e, it is found that most of the O3 is converted into O2 after ∼180 ps upon either a surface reaction or self-dissociation in the gas-phase. The HxOy and COx species are found to be the main by-products, suggesting a combustion-like reaction mechanism. This observation is consistent with previous in situ mass spectroscopy studies for a Ir(acac)3–O3 ALD process.37 We have found that the evolution of HxOy is about ∼10 ps earlier than that of COx species, revealing that ozone reacts first with the hydrogen of the Cu precursor. Concentrations of the H species in the gas-phase increase firstly and decrease after 80 ps. At the equilibrium state, about 70% of the surface C impurities are released to the gas-phase, whereas the amount of surface O increases significantly after the O3 pulse (Fig. 8f). Most of the gaseous HxOy are re-adsorbed on the surface, thus protons are available for the ligand-exchange reaction during the Cu(acac)2 pulse, as in the case of the Cu(acac)2–H2O process.
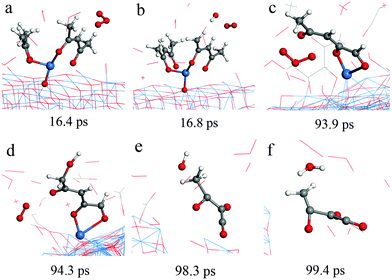 | ||
| Fig. 10 RMD snapshots for H abstraction (a and b), O insertion (c and d), water formation (e and f) observed during the reaction between Cu(acac)2 and ozone on the CuO(111) surface. | ||
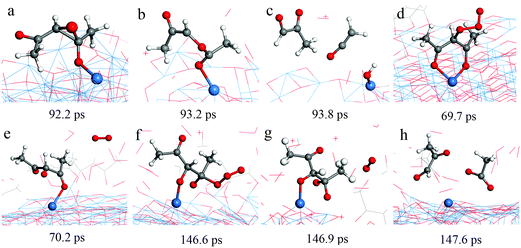 | ||
| Fig. 11 RMD snapshots for C–C breaking observed during the reaction between Cu(acac)2 and ozone on the CuO(111) surface. | ||
By comparison with the reaction rate and the carbon removal ratio under different conditions, it can be concluded that the reactivity of the co-reactants towards Cu(acac)2 follows the order H > O3 > H2O. In experiment, it is well known that reactivity of the co-reactant has a large effect on an ALD temperature window. The lower bound of the ALD window is mainly determined by the thermal activation of a surface reaction as well as by the volatility of the precursor.5 Therefore, the ALD window could be used as an indicator to evaluate the reactivity between Cu(acac)2 and different co-reactants. A lower ALD window is associated with the higher reactivity of the co-reactant. As reported in the literature, when the H plasma is used for Cu(acac)2, the ALD window is as low as 85–135 °C.21 However, much higher temperatures are required when ozone (150–230 °C)11 or water (210–300 °C)76 is used as the co-reactant. These results may suggest that the plasma H is more reactive towards Cu(acac)2 as compared to ozone and water, which is consistent with our conclusion.
Conclusions
In conclusion, the initial surface reactions of the Cu(acac)2 precursor during ALD were studied through DFT calculations and RMD simulations. The Cu(acac)2, Cu(acac) and Cu species prefer to adsorb on a hollow site, whereas the acac-ligand favors adsorption on the top site of the Cu(110) surface. The adsorption energies calculated by ReaxFF agree well with those calculated by vdW-DF. Cu(acac)2 is easily decomposed into a Cu atom and acac-ligands on the Cu(110) surface. The largest reaction barriers calculated using PBE and vdW-DF functionals are 0.59 eV and 0.55 eV, respectively. Mulliken analysis reveals a sequential reduction of the Cu atom during the dissociation of Cu(acac)2 on Cu(110). The dissociated acac-ligands may act as site blockers for additional adsorption of the precursors, since they are thermodynamically stable on the surface. The RMD simulations imply that the decomposition pathways of Cu(acac)2 on various substrates are similar, but the copper-rich surfaces [Cu(110) and Cu2O(111)] are more reactive as compared with the CuO(111) surface. Mechanisms for the surface reaction between Cu(acac)2 and different co-reactants are also examined. The molecular hydrogen is found to be nonreactive towards the Cu precursor; whereas atomic H or water can remove the surface acac-ligands efficiently. The H atoms continuously impact with the Cu precursor, which lead to the breaking of Cu–O, C–O, and C–C bonds sequentially. On the other hand, water reacts with the Cu(acac)2 on Cu2O(111) through a ligand-exchange reaction, producing the gaseous H(acac) and surface OH species. A combustion reaction with CO2 and H2O as the main byproducts is observed when adsorbed Cu(acac)2 reacts with ozone. Once equilibrium is reached, most of the gaseous HxOy are re-adsorbed on the surface. Thus protons are available for the next ALD half cycle.Acknowledgements
This work was supported by the German Research Foundation (DFG) in the International Research Training Group (IRTG), Project GRK-1215 “Materials and Concepts for Advanced Interconnects”.References
- R. Rosenberg, D. C. Edelstein, C.-K. Hu and K. P. Rodbell, Annu. Rev. Mater. Sci., 2000, 30, 229–262 CrossRef CAS.
- R. Solanki and B. Pathangey, Electrochem. Solid-State Lett., 2000, 3, 479–480 CrossRef CAS PubMed.
- Y. Sakamoto, K. Kamada, J. Hamaguchi, A. Sano, Y. Numata, S. Kodaira, S. Toyoda and K. Suu, Jpn. J. Appl. Phys., 2011, 50, 05EA03 CrossRef.
- S. M. George, Chem. Rev., 2010, 110, 111–131 CrossRef CAS PubMed.
- R. L. Puurunen, J. Appl. Phys., 2005, 97, 121301 CrossRef PubMed.
- T. J. Knisley, L. C. Kalutarage and C. H. Winter, Coord. Chem. Rev., 2013, 257, 3222–3231 CrossRef CAS PubMed.
- K. H. Park and W. J. Marshall, J. Am. Chem. Soc., 2005, 127, 9330–9331 CrossRef CAS PubMed.
- B. H. Lee, J. K. Hwang, J. W. Nam, S. U. Lee, J. T. Kim, S.-M. Koo, A. Baunemann, R. A. Fischer and M. M. Sung, Angew. Chem., Int. Ed., 2009, 48, 4536–4539 CrossRef CAS PubMed.
- T. Waechtler, S. Oswald, N. Roth, A. Jako, H. Lang, R. Ecke, S. E. Schulz, T. Gessner, A. Moskvinova, S. Schulze and M. Hietscholde, J. Electrochem. Soc., 2009, 156, H453–H459 CrossRef CAS PubMed.
- T. Waechtler, S. F. Ding, L. Hofmann, R. Mothes, Q. Xie, S. Oswald, C. Detavernier, S. E. Schulz, X. P. Qu, H. Lang and T. Gessner, Microelectron. Eng., 2011, 88, 684–689 CrossRef CAS PubMed.
- M. E. Alnes, E. Monakhov, H. Fjellvag and O. Nilsen, Chem. Vap. Deposition, 2012, 18, 173–178 CrossRef CAS PubMed.
- B. S. Lim, A. Rahtu and R. G. Gordon, Nat. Mater., 2003, 2, 749–754 CrossRef CAS PubMed.
- Z. Li, S. T. Barry and R. G. Gordon, Inorg. Chem., 2005, 44, 1728–1735 CrossRef CAS PubMed.
- J. W. Park, H. S. Jang, M. Kim, K. Sung, S. S. Lee, T. Chung, S. Koo, C. G. Kim and Y. Kim, Inorg. Chem. Commun., 2004, 7, 463–466 CrossRef CAS PubMed.
- J. P. Coyle, W. H. Monillas, G. P. A. Yap and S. T. Barry, Inorg. Chem., 2008, 47, 683–689 CrossRef CAS PubMed.
- A. M. Willcocks, T. P. Robinson, R. Roche, T. Pugh, S. P. Richards, A. J. Kingsley, J. P. Lowe and A. L. Johnson, Inorg. Chem., 2012, 51, 246–257 CrossRef CAS PubMed.
- J. P. Coyle, A. Kurek, P. J. Pallister, E. R. Sirianni, G. P. A. Yap and S. T. Barry, Chem. Commun., 2012, 48, 10440–10442 RSC.
- T. Kim, Y. Yao, J. P. Coyle, S. T. Barry and F. Zaera, Chem. Mater., 2013, 25, 3630–3639 CrossRef CAS.
- M. Utriainen, M. Kröger-Laukkanen, L. S. Johansson and L. Niinistö, Appl. Surf. Sci., 2000, 157, 151–158 CrossRef CAS.
- A. Niskanen, A. Rahtu, T. Sajavaara, K. Arstila, M. Ritala and M. Leskelä, J. Electrochem. Soc., 2005, 152, G25–G28 CrossRef CAS PubMed.
- L. Wu and E. Eisenbraun, J. Vac. Sci. Technol., B, 2007, 25, 2581–2585 CAS.
- H. B. Profijt, S. E. Potts, M. C. M. Van de Sanden and W. M. M. Kessels, J. Vac. Sci. Technol., A, 2011, 29, 050801 Search PubMed.
- T. J. Knisley, T. C. Ariyasena, T. Sajavaara, M. J. Saly and C. H. Winter, Chem. Mater., 2011, 23, 4417–4419 CrossRef CAS.
- G. Dey and S. D. Elliott, RSC Adv., 2014, 4, 34448–34453 RSC.
- J. M. Park, K. Jin, B. Han, M. J. Kim, J. Jung, J. J. Kim and W. J. Lee, Thin Solid Films, 2014, 556, 434–439 CrossRef CAS PubMed.
- D. Dhakal, T. Waechtler, S. E. Schulz, T. Gessner, H. Lang, R. Mothes and A. Tuchscherer, J. Vac. Sci. Technol., A, 2014, 32, 041505 Search PubMed.
- D. Dhakal, T. Waechtler, S. E. Schulz, S. Moeckel, H. Lang and T. Gessner, 2nd International Conference on ALD Applications & 3rd China ALD conference, Shanghai, 2014.
- F. Zaera, J. Phys. Chem. Lett., 2012, 3, 1301–1309 CrossRef CAS PubMed.
- Q. Ma and F. Zaera, J. Vac. Sci. Technol., A, 2013, 31, 01A112 Search PubMed.
- S. D. Elliott, Semicond. Sci. Technol., 2012, 27, 074008 CrossRef.
- G. Dey and S. D. Elliott, J. Phys. Chem. A, 2012, 116, 8893–8901 CrossRef CAS PubMed.
- J. Lin, A. V. Teplyakov and J. C. F. Rodrigues-Reyes, J. Vac. Sci. Technol., A, 2013, 31, 021401 Search PubMed.
- X. Hu, J. Schuster, S. E. Schulz and T. Gessner, Microelectron. Eng., 2015, 137, 23–31 CrossRef CAS PubMed.
- E. Machado, M. Kaczmarski, P. Ordejón, D. Garg, J. Norman and H. Cheng, Langmuir, 2005, 21, 7608–7614 CrossRef CAS PubMed.
- E. Machado, M. Kaczmarski, B. Braida, P. Ordejón, D. Garg, J. Norman and H. Cheng, J. Mol. Model., 2007, 13, 861–864 CrossRef CAS PubMed.
- G. Dey and S. D. Elliott, J. Phys. Chem. C, 2015, 119, 5914–5927 CAS.
- G. Dey, J. S. Wrench, D. J. Hagen, L. Keeney and S. D. Elliott, Dalton Trans., 2015, 44, 10188–10199 RSC.
- G. Dey and S. D. Elliott, Theor. Chem. Acc., 2014, 133, 1416 CrossRef.
- L. Pirolli and A. V. Teplyakov, Surf. Sci., 2006, 600, 3313–3320 CrossRef CAS PubMed.
- P. Mårtensson, K. Larsson and J. O. Carlsson, Appl. Surf. Sci., 1998, 136, 137–146 CrossRef.
- P. Mårtensson, K. Larsson and J. O. Carlsson, Appl. Surf. Sci., 1999, 148, 9–16 CrossRef.
- P. Mårtensson, K. Larsson and J. O. Carlsson, Appl. Surf. Sci., 2000, 157, 92–100 CrossRef.
- S. Chen, G. Fang, X. Qian, A. Li and J. Ma, J. Phys. Chem. C, 2011, 115, 23363–23373 CAS.
- G. Fang, S. Chen, A. Li and J. Ma, J. Phys. Chem. C, 2012, 116, 26436–26448 CAS.
- M. Shirazi and S. D. Elliott, Chem. Mater., 2013, 25, 878–889 CrossRef CAS.
- Y. Maimaiti and S. D. Elliott, J. Phys. Chem. C, 2015, 119, 9375–9385 CAS.
- S. D. Elliott, G. Scarel, C. Wiemer, M. Fanciulli and G. Pavia, Chem. Mater., 2006, 18, 3764–3773 CrossRef CAS.
- L. Huang, B. Han, B. Han, A. Derecskei-Kovacs, M. Xiao, X. Lei, M. L. O'Neill, R. M. Pearlstein, H. Chandra and H. Cheng, J. Phys. Chem. C, 2013, 117, 19454–19463 CAS.
- G. Fang, L. Xu, Y. Cao, L. Wang, D. Wu and A. Li, Chem. Commun., 2015, 51, 1341–1344 RSC.
- A. C. T. van Duin, S. Dasgupta, F. Lorant and W. A. Goddard, J. Phys. Chem. A, 2001, 105, 9396–9409 CrossRef CAS.
- K. Knapas and M. Ritala, Chem. Mater., 2011, 23, 2766–2771 CrossRef CAS.
- P. Giannozzi, S. Baroni, N. Bonini, M. Calandra, R. Car, C. Cavazzoni, D. Ceresoli, G. L. Chiarotti, M. Cococcioni, I. Dabo, A. Dal Corso, S. de Gironcoli, S. Fabris, G. Fratesi, R. Gebauer, U. Gerstmann, C. Gougoussis, A. Kokalj, M. Lazzeri, L. Martin-Samos, N. Marzari, F. Mauri, R. Mazzarello, S. Paolini, A. Pasquarello, L. Paulatto, C. Sbraccia, S. Scandolo, G. Sclauzero, A. P. Seitsonen, A. Smogunov, P. Umari and R. M. Wentzcovitch, J. Phys.: Condens. Matter, 2009, 21, 395502 CrossRef PubMed.
- J. P. Perdew, K. Burke and M. Ernzerhof, Phys. Rev. Lett., 1996, 77, 3865–3868 CrossRef CAS.
- D. Vanderbilt, Phys. Rev. B: Condens. Matter Mater. Phys., 1990, 41, 7892–7895 CrossRef.
- H. J. Monkhorst and J. D. Pack, Phys. Rev. B: Solid State, 1976, 13, 5188 CrossRef.
- M. Dion, H. Rydberg, E. Schroder, D. C. Langreth and B. I. Lundqvist, Phys. Rev. Lett., 2004, 92, 246401 CrossRef CAS PubMed.
- S. Baroni, S. De Gironcoli, A. Dal Corso and P. Giannozzi, Rev. Mod. Phys., 2001, 73, 515–562 CrossRef CAS.
- G. Henkelman, B. P. Uberuaga and H. Jonsson, J. Chem. Phys., 2000, 113, 9901–9904 CrossRef CAS PubMed.
- G. Henkelman and H. Jonsson, J. Chem. Phys., 2000, 113, 9978–9985 CrossRef CAS PubMed.
- M. D. Segall, R. Shah, C. J. Pickard and M. C. Payne, Phys. Rev. B: Condens. Matter Mater. Phys., 1996, 54, 16317–16320 CrossRef CAS.
- M. D. Segall, P. J. D. Lindan, M. J. Probert, C. J. Pickard, P. J. Hasnip, S. J. Clark and M. C. Payne, J. Phys.: Condens. Matter, 2002, 14, 2717–2744 CrossRef CAS.
- S. Plimpton, J. Comput. Phys., 1995, 117, 1–19 CrossRef CAS.
- W. J. Mortier, S. K. Ghosh and S. Shankar, J. Am. Chem. Soc., 1986, 108, 4315–4320 CrossRef CAS.
- A. C. T. van Duin, V. S. Bryantsev, M. S. Diallo, W. A. Goddard, O. Rahaman, D. J. Doren, D. Raymand and K. Hermansson, J. Phys. Chem. A, 2010, 114, 9507–9514 CrossRef CAS PubMed.
- O. Rahaman, A. C. T. van Duin, W. A. Goddard and D. J. Doren, J. Phys. Chem. B, 2011, 115, 249–261 CrossRef CAS PubMed.
- L. Huang, K. L. Joshi, A. C. T. van Duin, T. J. Bandosz and K. E. Gubbins, Phys. Chem. Chem. Phys., 2012, 14, 11327–11332 RSC.
- P. C. Lebrun, W. D. Lyon and H. A. Kuska, J. Crystallogr. Spectrosc. Res., 1986, 16, 889 CrossRef CAS.
- G. S. Girolami, P. M. Jeffries and L. H. Dubois, J. Am. Chem. Soc., 1993, 115, 1015–1024 CrossRef CAS.
- K. Nakamoto and A. E. Martell, J. Chem. Phys., 1960, 32, 588–597 CrossRef CAS PubMed.
- C. Lee and H. H. Lee, Electrochem. Solid-State Lett., 2005, 8, G5–G7 CrossRef CAS PubMed.
- C. R. Vestal and T. C. DeVore, Proceedings of the Conference on High Temperature Corrosion and Materials Chemistry, Electrochemical Society, Washington DC, 2001.
- J. Pinkas, J. C. Huffman, D. V. Baxter, M. H. Chisholm and K. G. Caulton, Chem. Mater., 1995, 7, 1589–1596 CrossRef CAS.
- J. Huo, R. Solanki and J. McAndrew, J. Mater. Res., 2002, 17, 2394–2398 CrossRef CAS.
- J. Kwon, M. Dai, M. D. Halls and Y. J. Chabal, Chem. Mater., 2008, 20, 3248–3250 CrossRef CAS.
- D. N. Goldstein, J. A. McCormick and S. M. George, J. Phys. Chem. C, 2008, 112, 19530–19539 CAS.
- T. Törndahl, M. Ottosson and J. O. Carlsson, J. Electrochem. Soc., 2006, 153, C146–C151 CrossRef PubMed.
Footnote |
| † Electronic supplementary information (ESI) available. The details of the atomic coordinates and validation of the calculation model and the force field parameters. See DOI: 10.1039/c5cp03707g |
| This journal is © the Owner Societies 2015 |

