 Open Access Article
Creative Commons Attribution 3.0 Unported Licence
Modeling the voltage loss mechanisms in lithium–sulfur cells: the importance of electrolyte resistance and precipitation kinetics
Teng
Zhang
*a,
Monica
Marinescu
a,
Laura
O'Neill
b,
Mark
Wild
 b and
Gregory
Offer
a
aDepartment of Mechanical Engineering, Imperial College London, SW7 2AZ, UK. E-mail: t.zhang@imperial.ac.uk
bOXIS Energy LTD, E1 Culham Science Centre, Abingdon, OX14 3DB, UK
First published on 7th August 2015
Abstract
Understanding of the complex electrochemical, transport, and phase-change phenomena in Li–S cells requires experimental characterization in tandem with mechanistic modeling. However, existing Li–S models currently contradict some key features of experimental findings, particularly the evolution of cell resistance during discharge. We demonstrate that, by introducing a concentration-dependent electrolyte conductivity, the correct trends in voltage drop due to electrolyte resistance and activation overpotentials are retrieved. In addition, we reveal the existence of an often overlooked potential drop mechanism in the low voltage-plateau which originates from the limited rate of Li2S precipitation.
The lithium–sulfur (Li–S) cell could provide the next step-change in battery technology with a promising practical energy density of 500–600 W h kg−1. However, broader uptake of Li–S technology is currently hampered by relatively fast capacity fade, incomplete sulfur utilization, and low Columbic efficiency due to the polysulfide shuttle, among other issues.1–5 Improvements in battery design and materials research require a good understanding of the complicated electrochemical processes in the Li–S system, which involve multistep reactions, multiscale transport phenomena, and morphology variations during battery operation. Modelling in tandem with experimental testing has been shown to accelerate research and development in the field.6,7
Mikhaylik et al.8 developed the first Li–S model for studying polysulfide shuttle. This lumped model computes reduction potentials in the high and low voltage-plateaus based on the Nernst equation, but it neglects activation overpotentials, electrolyte resistance, and dissolution/precipitation reactions, all which influence the operating voltage. A more detailed one-dimensional (1D) mechanistic model was later described by Kumaresan et al.9 based on the Nernst–Plank equations for dilute solutions. Kumaresan's model considers multicomponent transport in the porous cathode and separator, charge-transfer kinetics, dissolution/precipitation reactions, and changes in porosity and electrochemically active surface area as a result of dissolution/precipitation. While the model qualitatively reproduces some essential features of a typical Li–S discharge profile – such as the two characteristic voltage plateaus and the voltage dip in-between, it also requires the input of a large number of physical and phenomenological parameters that are not easily obtained experimentally. In view of the complexity of the Kumaresan model, Ghaznavi and Chen10–12 performed a sensitivity analysis of this model. They concluded that, in order for this model to predict charging, further development in modelling precipitation/dissolution reactions is required. Bessler et al.13,14 developed a 1D Li–S model based on a similar framework, which additionally considers the electrochemical double-layer, polysulfide shuttle, and irreversible precipitation at the anode as a capacity fading mechanism. In addition to charge/discharge curves, electrochemical impedance spectra at different depths of discharge (DoD) were predicted.
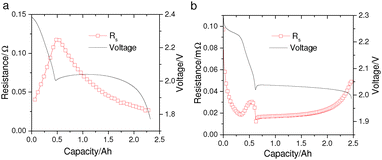
However, while the mechanistic models by Kumaresan et al.9 and Bessler et al.13,14 can reproduce the general discharge profile of a Li–S cell, they fail to capture more intricate cell behavior such as the changing electrolyte resistance (Rs) during discharge. The variation of Rs with DoD is a characteristic feature of Li–S cells that has been observed in various electrolyte chemistries by electrochemical impedance spectroscopy (EIS).15–18 It is generally agreed that the high-frequency intercept of the EIS curve is dominated by the electrolyte resistance of the measured Li–S cell. As shown in Fig. 1a, during discharge Rs increases in the high plateau and reaches a maximum at the transition between the two voltage plateaus; it then decreases throughout the low-plateau. Furthermore, EIS measurements suggest that Rs accounts for most of the voltage-drop in the high plateau, as the low-frequency resistances – which are frequently associated with charge-transfer – only become significant in the low-plateau.15,18,19 In the mechanistic models, however, the predicted voltage drop due to electrolyte resistance is two to three orders of magnitude smaller than the predicted voltage-drop due to activation overpotentials. Such model prediction, directly contradicting EIS data, is visible in the simulated EIS curves by Bessler et al.13 The disagreement is also seen for predictions produced from Kumaresan's model,9 shown in Fig. 1b, where the simulated Rs exhibits a very different evolution with DoD compared to measurements.
 | ||
| Fig. 1 (a) Electrolyte resistance (Rs) measured from a pouch Li–S cell manufactured by Oxis Energy Ltd. Galvanostatic EIS measurements were performed during a 0.34 A cell discharge, and the series resistance was extracted as the high-frequency x-axis intercept of the Nyquist plots at different depths of discharge. (b) Simulated Rs from the Kumaresan model9 for a Li–S cell with similar energy capacity; model parameters were taken from Ghaznavi and Chen.12 | ||
The Rs profile during discharge is typically explained with the variation of electrolyte concentration (or viscosity) caused by the dissolution and subsequent precipitation of polysulfide species. Indeed, it was experimentally observed that the electrolyte conductivity of Li–S cells strongly depends on the concentration of both lithium salt20 and lithium polysulfides.21 At high salt or polysulfide concentrations (typically >1 mol L−1), increased ionic interactions reduce the electrolyte conductivity. Existing Li–S models, however, rely on dilute solution theory in which ionic conductivities are independent of ionic concentrations.
We propose that introducing a concentration dependence of the electrolyte conductivity is necessary to retrieve the experimentally documented trends in the voltage-drop in Li–S cells during discharge. This feature is included in a lumped mechanistic model that describes electrochemical and precipitation reactions, electrode charge-transfer kinetics, as well as morphology variations due to precipitation in a Li–S cell. Compared to the more detailed Kumaresan model, the lumped model does not consider mass-transport and charge-localization effects, and therefore it cannot predict transport limitations. We note, however, that the sensitivity analysis by Ghaznavi and Chen12 indicates that mass transport does not have a significant impact on predictions of the Kumaresan model unless ionic diffusion coefficients are reduced by more than an order of magnitude. Consequently, the discharge curves produced by the lumped model closely resemble those obtained with the Kumaresan model. The advantage of the lumped approach is that the model requires fewer fitting parameters and reduced computational resources.
The model considers six electrochemical reactions and one precipitation reaction during discharge:
| Li → Li+ + e− | (1) |
| 0.5S8 + e− → 0.5S82− | (2) |
| 3/2S82− + e− → 2S62− | (3) |
| S62− + e− → 3/2S42− | (4) |
| 0.5S42− + e− → S22− | (5) |
| 0.5S22− + e− → S2− | (6) |
| 2Li+ + S2− → Li2S↓. | (7) |
| Vcell = (Ej + ηj) − (E1 + η1) − IRs, for j = 2 to 6 | (8) |
 | (9) |
 | (10) |
 | (11) |
The current densities are related to overpotentials through the Butler–Volmer equation. If the anodic and cathodic transfer coefficients are assumed to both equal 0.5, the current–overpotential relation can be written as:
 | (12) |
 | (13) |
The reduction potential for a reaction j is given by the Nernst equation
 | (14) |
The total electrolyte resistance across the cell can be written as Rs = l/Aσ, where σ is the electrolyte conductivity. During discharge, electrochemical and precipitation reactions significantly alter the polysulfide concentrations, which in turn influence the electrolyte conductivity. While the exact relation between ionic concentration and electrolyte conductivity has not been established for Li–S cells, it is reasonable to assume that upon increasing Li+ concentration, the ionic conductivity of the electrolyte first increases and then decreases. This effect is observed in the electrolytes in both lithium–ion and Li–S cells.20–22 We further assume cells are usually built with the electrolyte salt concentration close to the optimal value for the maximum electrolyte conductivity (private communication with Oxis Energy Ltd). With these assumptions, we propose a linear phenomenological function for σ at high Li+ concentrations:
| σ = ε1.5(σ0 − b|CLi+ − CLi+,0|) | (15) |
 | ||
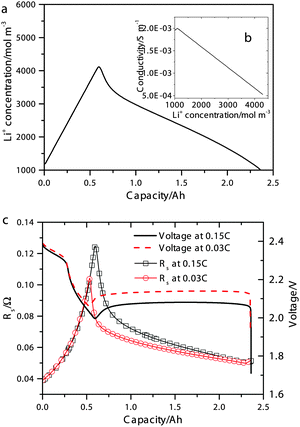
| Fig. 2 (a) Simulated concentration of Li+ during 0.15 C discharge. Inset (b) shows the electrolyte conductivity as a function of Li+ concentration according to eqn (15). (c) Simulated discharge voltages (symbols) and electrolyte resistances (lines) at 0.15 C and 0.03 C. | ||
Finally, we employ the phenomenological expression used by Kumaresan et al.9 to describe the change in specific electrochemical surface area with cathode porosity:
 | (16) |
The model parameters and their assumed values are listed in Table 1. Due to the lack of reported data on standard reduction potentials, exchange current densities, and precipitation kinetics, the parameters in the lumped model – as with the parameters in other Li–S models in the literature – are obtained from calibrating the model with measured discharge curves. Compared to the Kumaresan model,9 the lumped model does not contain the numerous parameters associated with ionic transport, but requires two additional parameters to describe the concentration–conductivity relation.
| Kinetic & thermodynamic parameters | |
| E 01, E02, E03, E04, E05, E06 (V) | 0.0, 2.38, 2.24, 2.15, 2.05, 1.94 |
| i 02, i03, i04, i05, i06 (A m−2) | 2.0, 1.5, 1.0, 0.6, 0.3 |
| k p (m6 mol−2 s−1) | 1.5 × 10⁻⁵ |
| K sp (mol3 m−9) | 1.0 × 10³ |
| Initial conditions | |
| C Li+,0, CS8, CS82−, CS62− (mol m−3) | 1.1 × 10³, 6.7 × 10², 1.0 × 10², 8.2 |
| C S42−, CS22−, CS2− (mol m−3) | 5.6 × 10⁻³, 8.0 × 10⁻⁶, 1.4 × 10⁻⁸ |
| ν Li2S | 10−7 |
| ε 0 | 0.65 |
| σ 0 (S m−1) | 2.0 × 10⁻³ |
| Geometric & other parameters | |
| A (m2) | 0.29 |
| a v,0 (m−1) | 1.0 × 10⁵ |
| b (S m2 mol−1) | 4.6 × 10⁻⁷ |
| l (m) | 4 × 10⁻⁵ |
| V Li2S (m3 mol−1) | 2.8 × 10⁻⁶ |
| ξ | 6 |
The simulated discharge curves and electrolyte resistances at 0.15 C (0.34 A) and 0.03 C are illustrated in Fig. 2c. Similar to the Kumaresan model,9 the lumped mechanistic model is able to qualitatively reproduce the essential features of the discharge profile of Li–S batteries, e.g. a sloping high-plateau voltage, a flat low-plateau voltage, and a voltage dip in-between. However, the lumped model also reproduces the correct trend and magnitude of the electrolyte resistance during discharge due to the introduction of concentration-dependent electrolyte conductivity. The shape of the resistance profile follows closely the evolution of Li+ concentration during discharge as shown in Fig. 2a. Initially, as an increasing amount of Li+ dissolves into the solution to form Li2Sx, the electrolyte conductivity reduces according to the proposed conductivity–concentration relation eqn (15). In the low plateau, as Li+ precipitates out of the solution as Li2S, the electrolyte conductivity increases. The peak of Rs therefore corresponds to the onset of Li2S precipitation. It follows that the voltage dip between the voltage plateaus is not only due to the super-saturation of S2− as described by Kumaresan et al.,9 but also a consequence of electrolyte resistance peaking at the transition between the two voltage plateaus.
According to Fig. 2c, the peak in electrolyte resistance increases with discharge current. At higher currents, the electrochemical production rates of Li+ and S2− are faster, whereas their chemical precipitation rate remains the same at the onset of Li2S precipitation. Consequently, the concentrations of Li+ and S2− are higher, which gives rise to larger electrolyte resistance for a higher discharge current. It is clear from our analysis that the exact shape of the Rs profile is strongly influenced by the precipitation rate of Li2S. In the present model, however, the precipitation rate follows Kumaresan's phenomenological expressions eqn (11), which are known to not reproduce re-dissolution of Li2S upon charging.11,12 A more accurate precipitation/dissolution model would require detailed solid phase nucleation and growth mechanisms24 as well as experimentally determined solubility products and precipitation rates, values currently not well established in Li–S literature.
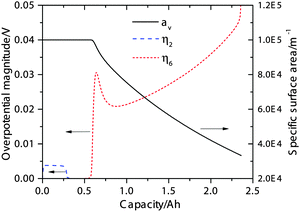
The simulated activation overpotentials (defined in eqn (12)) for the high-plateau process reaction eqn (2) and the low-plateau process reaction eqn (6) are shown in Fig. 3. It is clear that the smaller high-plateau overpotential η2 remains relatively constant in the high plateau whereas the larger low-plateau overpotential η6 increases with increasing DoD. It is found that the increase in low-plateau overpotential is primarily attributed to the reduction in available electrochemical surface area due to Li2S precipitation, which is also shown in Fig. 3. As the insulating Li2S gradually covers a larger portion of the conductive cathode surface, larger activation overpotentials are required to drive the increasing electrochemical current densities. We note that the simulated trend in activation overpotentials resembles that of the low-frequency resistances measured by EIS, which also remain small in the high plateau but rise quickly in the low plateau.15,18,19 Since the activation overpotentials qualitatively reflect the resistance due to charge-transfer, the model agrees with the hypothesis that the low-frequency resistances in EIS measurements arise from charge-transfer processes.15,18,19
 | ||
| Fig. 3 Simulated activation overpotentials η2 (for reaction eqn (2)) and η6 (for eqn (6)) during 0.15 C discharge, and the specific electrochemical surface area (av) during discharge. | ||
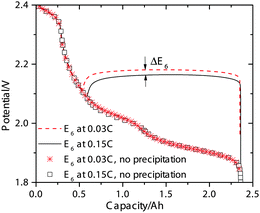
In addition to the potential drop associated with the electrolyte resistance and activation overpotentials, a potential shift also occurs due to Li2S precipitation that alters the reduction potentials in the Nernst equation (eqn (14)). In the absence of precipitation, the S2− concentration increases continuously during discharge in the low plateau, which causes the reduction potentials to drop gradually as dictated by the Nernst equation. This scenario is depicted in Fig. 4 for the low-plateau reduction potential E6 without precipitation, which is similar to the low-plateau reduction potential calculated by Mikhaylik et al.8 In the presence of precipitation, the electrochemical production rate of S2− reaches a dynamic equilibrium with its removal rate due to precipitation, thereby holding the S2− concentration and the reduction potential E6 at a relatively constant value. As illustrated in Fig. 4, the precipitation effectively increases the reduction potential in the low plateau and gives rise to a flat low-plateau potential. Furthermore, since the precipitation rate is finite, the equilibrium concentration of S2− is higher at higher currents and the reduction potential is correspondingly lower. The limited rate of precipitation effectively manifests as a ‘precipitation resistance’ that leads to a drop in E6 at higher currents, as demonstrated in Fig. 4. Due to the quasi steady-state conditions of the testing procedure, EIS measurements can not explicitly reflect this reduction potential drop. However, the shift in equilibrium potential has been reported experimentally by the galvanostatic intermittent titration technique (GITT), for which a long voltage relaxation (∼40 mV over 20 h) was observed in the low plateau after a current pulse had been removed.25 This slow potential equilibration was attributed to the slow precipitation/dissolution kinetics in Li–S cells. Since the magnitude of the reduction potential shift is sensitive to the precipitation rate, the GITT technique might be useful for estimating the precipitation rate constants and solubility products needed for more detailed Li–S models.
In the graphical abstract, the three voltage-drop mechanisms considered in the model are shown together for the representative low-plateau reaction eqn (6). We note that all three mechanisms are related to the precipitation of Li2S: the precipitation affects the electrolyte resistance and reduction potentials through the change in polysulfide concentrations, and influences activation overpotentials via the change in available electrochemical surface area. For practical, high energy-density Li–S cells, the electrolyte resistance is particularly important since these cells generally contain less electrolyte and therefore higher ionic concentrations.26 It is therefore important for high energy-density Li–S cells to employ solvents with high ionic conductivities as well as a thin separator to minimize the Ohmic voltage loss. The voltage-drop due to activation overpotentials and the apparent ‘precipitation resistance’ are more difficult to quantify since they are dependent on the poorly understood reaction mechanisms and precipitation kinetics in Li–S cells. While solvents with low Li2S solubility could facilitate precipitation thereby potentially reducing both the electrolyte resistance and the ‘precipitation resistance’, the increased amount of insulating precipitates induce larger activation overpotentials. Large activation overpotentials could be mitigated through the use of nano-structured cathodes with high conductive surface area.
In the present work only a qualitative comparison between the model prediction and experimental data of cell discharge and electrolyte resistance curves can be made. This limitation is due to: (i) values for many physical parameters, especially those related to Li2S precipitation and electrolyte conductivity, have not been obtained experimentally, nor are they established in the literature; (ii) the present model neglects the polysulfide shuttle as well as transport limitations that could occur at high currents, therefore it does not sufficiently capture the variation of discharge capacity with discharge current. However, improvements to existing modelling approaches have been presented which can qualitatively reproduce more features of a typical Li–S cell behavior than could be reproduced with previous models. These improvements are easy to add to any existing Li–S model to ensure better agreement with the observed cell performance.
In summary, we have demonstrated a lumped mechanistic model which qualitatively reproduce the evolution of electrolyte resistance during discharge reported in the literature. The change in electrolyte resistance can be explained as the result of the concentration dependence of electrolyte conductivity in conjunction with ionic concentration variations due to precipitation. The increase in activation overpotential in the low plateau can be explained by the reduced electrochemical surface area, also associated with Li2S precipitation. In addition, the limited rate of precipitation is shown to cause a drop in reduction potential, which manifests itself as a ‘precipitation resistance’. In view of the central role that Li2S precipitation plays in determining the operating voltage of Li–S batteries, future efforts should seek better understanding of precipitation mechanisms, as well as to measure the polysulfide solubility, precipitation rates, and the concentration–conductivity relation.
Acknowledgements
The authors would like to thank the Engineering and Physical Sciences Research Council in the UK for funding this work under the Revolutionary Electric Vehicle Battery (REVB) project EP/L505298/1.References
- P. G. Bruce, S. A. Freunberger, L. J. Hardwick and J.-M. Tarascon, Nat. Mater., 2012, 11, 19–30 CrossRef CAS PubMed.
- S. S. Zhang, J. Power Sources, 2013, 231, 153–162 CrossRef CAS PubMed.
- D. Bresser, S. Passerini and B. Scrosati, Chem. Commun., 2013, 49, 10545–10562 RSC.
- V. S. Kolosnitsyn and E. V. Karaseva, Russ. J. Electrochem., 2008, 44, 506–509 CrossRef CAS.
- X. Feng, M.-K. Song, W. C. Stolte, D. Gardenghi, D. Zhang, X. Sun, J. Zhu, E. J. Cairns and J. Guo, Phys. Chem. Chem. Phys., 2014, 16, 16931–16940 RSC.
- S. H. Thomke, Research Policy, 1998, 27, 55–74 CrossRef.
- M. C. Becker, P. Salvatore and F. Zirpoli, Research Policy, 2005, 34, 1305–1321 CrossRef PubMed.
- Y. V. Mikhaylik and J. R. Akridge, J. Electrochem. Soc., 2004, 151, A1969 CrossRef CAS PubMed.
- K. Kumaresan, Y. Mikhaylik and R. E. White, J. Electrochem. Soc., 2008, 155, A576 CrossRef CAS PubMed.
- M. Ghaznavi and P. Chen, J. Power Sources, 2014, 257, 394–401 CrossRef CAS PubMed.
- M. Ghaznavi and P. Chen, J. Power Sources, 2014, 257, 402–411 CrossRef CAS PubMed.
- M. Ghaznavi and P. Chen, Electrochim. Acta, 2014, 137, 575–585 CrossRef CAS PubMed.
- D. N. Fronczek and W. G. Bessler, J. Power Sources, 2013, 6–11 Search PubMed.
- A. F. Hofmann, D. N. Fronczek and W. G. Bessler, J. Power Sources, 2014, 259, 300–310 CrossRef CAS PubMed.
- V. S. Kolosnitsyn, E. V. Kuz'mina, E. V. Karaseva and S. E. Mochalov, Russ. J. Electrochem., 2011, 47, 793–798 CrossRef CAS.
- V. Kolosnitsyn, E. Kuzmina, E. Karaseva and S. Mochalov, J. Power Sources, 2011, 196, 1478–1482 CrossRef CAS PubMed.
- Z. Deng, Z. Zhang, Y. Lai, J. Liu, J. Li and Y. Liu, J. Electrochem. Soc., 2013, 160, A553–A558 CrossRef CAS PubMed.
- N. A. Cañas, K. Hirose, B. Pascucci, N. Wagner, K. A. Friedrich and R. Hiesgen, Electrochim. Acta, 2013, 97, 42–51 CrossRef PubMed.
- C. Barchasz, J.-C. Leprêtre, F. Alloin and S. Patoux, J. Power Sources, 2012, 199, 322–330 CrossRef CAS PubMed.
- D. R. Chang, S. H. Lee, S. W. Kim and H. T. Kim, J. Power Sources, 2002, 112, 452–460 CrossRef CAS.
- H. Yamin and E. Peled, J. Power Sources, 1983, 9, 281–287 CrossRef CAS.
- M. Park, X. Zhang, M. Chung, G. B. Less and A. M. Sastry, J. Power Sources, 2010, 195, 7904–7929 CrossRef CAS PubMed.
- R. Xu, I. Belharouak, X. Zhang, R. Chamoun, C. Yu, Y. Ren, A. Nie, R. Shahbazian-Yassar, J. Lu, J. C. Li and K. Amine, ACS Appl. Mater. Interfaces, 2014, 6, 21938–21945 CAS.
- Z. Liu, D. Hubble, P. B. Balbuena and P. P. Mukherjee, Phys. Chem. Chem. Phys., 2015, 17, 9032–9039 RSC.
- M. R. Busche, P. Adelhelm, H. Sommer, H. Schneider, K. Leitner and J. Janek, J. Power Sources, 2014, 259, 289–299 CrossRef CAS PubMed.
- J. Brückner, S. Thieme, H. T. Grossmann, S. Dörfler, H. Althues and S. Kaskel, J. Power Sources, 2014, 268, 82–87 CrossRef PubMed.
| This journal is © the Owner Societies 2015 |

